The US Customer Experience Index, 2018How Brands Build Loyalty With The Quality Of Their Experience
by Rick ParrishJune 19, 2018
NOT LICENSED FOR DISTRIBUTION
fOrrESTEr.COm
Key TakeawaysCustomer Experience Quality LanguishedAbout the same number of brands rose as fell in our rankings, and score gains were about the same size as losses. These moves caused the number of good and poor scores to decline, while the number of OK scores increased. Four industry averages dipped, and three climbed.
Stagnation Among Elite Brands Again Left A Leadership GapNo brand has risen to the top of our rankings and continued to improve — the mark of a true CX leader. Scores among elite brands — the top 5% of brands in the entire CX Index — were static again this year. Most industry frontrunners were repeats, and all were stagnant. As a result, we see no CX leaders, only languishers, lapsers, locksteppers, and laggards.
focus On Emotion To Achieve CX LeadershipEmotion has a bigger impact on brand loyalty than effectiveness or ease in every industry. Elite brands provided about 22 emotionally positive experiences for each negative one; the bottom 5% of brands provided only two emotionally positive experiences for each negative one.
Why Read This ReportHow well do leading brands build loyalty with the quality of their customer experience (CX)? This year, we reveal the complete rankings of all 287 brands across 19 industries in the US Customer Experience Index (CX Index). We also unveil surprising trends in CX quality and the role that emotion plays in CX. Customer experience professionals can use this report to inform their ongoing improvement efforts.
2
32
36
38
39
© 2018 Forrester Research, Inc. Opinions reflect judgment at the time and are subject to change. Forrester®, Technographics®, Forrester Wave, TechRadar, and Total Economic Impact are trademarks of Forrester Research, Inc. All other trademarks are the property of their respective companies. Unauthorized copying or distributing is a violation of copyright law. [email protected] or +1 866-367-7378
Forrester Research, Inc., 60 Acorn Park Drive, Cambridge, MA 02140 USA+1 617-613-6000 | Fax: +1 617-613-5000 | forrester.com
Table Of Contents
Customer Experience Quality Languished In 2018
Torpor At The Top Means There Are No Real CX Leaders
Without Real Leaders, Only Four Types Of Brands Remain
Emotion Holds The Key To Achieving CX Differentiation
How Forrester Can Help
Supplemental Material
Related Research Documents
Answers To Common Questions About Forrester’s Customer Experience Index
The Five Essential Steps To Plan Your CX Transformation
Gauge Your CX Management Maturity
FOR CUSTOMER EXPERIENCE PROFESSIONALS
The US Customer Experience Index, 2018How Brands Build Loyalty With The Quality Of Their Experience
by Rick Parrishwith Harley Manning, Roxana Strohmenger, William Willsea, Meredith McCreight, Ben Salamin, and Rachel Birrell
June 19, 2018
Share reports with colleagues. Enhance your membership with Research Share.
For Customer experienCe proFessionals
The US Customer Experience Index, 2018June 19, 2018
© 2018 Forrester research, inc. unauthorized copying or distributing is a violation of copyright law. [email protected] or +1 866-367-7378
2
How Brands Build Loyalty With The Quality Of Their Experience
Customer Experience Quality Languished In 2018
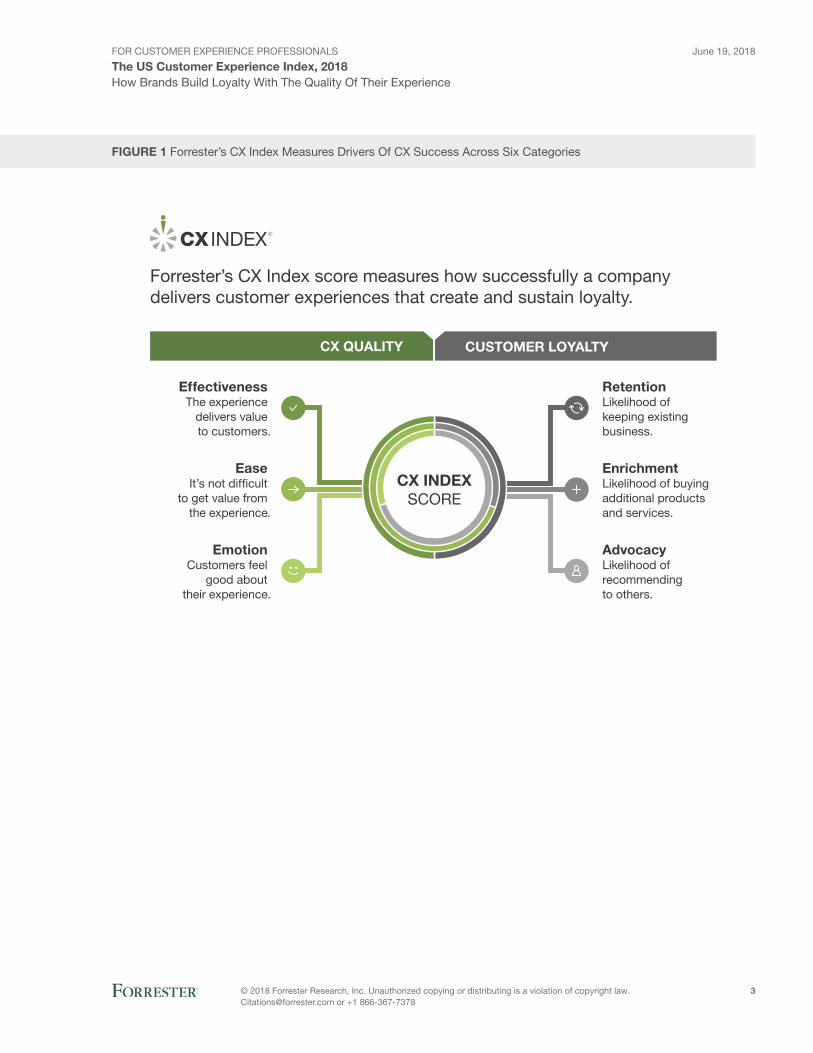
Customer experience leaders grow revenue faster than CX laggards, drive higher brand preference, and can charge more for their products.1 Based on a survey of over 110,000 US adult customers in 2018, Forrester’s Customer Experience Index (CX Index™) methodology measures how well a brand’s customer experience strengthens the loyalty of its customers so it can reap these benefits (see Figure 1). We used this methodology to benchmark CX quality at 287 US brands. Between 2017 and 2018, our benchmark shows the overall quality of the US customer experience stagnating — and differentiation on the basis of CX evaporating — as more brands become mediocre (see Figures 2 to 20).
› Gains and losses at the brand level were a wash. About the same number of brands rose as fell: Of the 287 brands in the CX Index, 37 had statistically significant score increases while 40 had statistically significant score decreases. What’s more, brands that rose gained an average of just over 4 points, while brands that fell lost an average of just under 4 points. Twelve brands gained 5 or more points, and nine brands lost 5 or more points. This is a better performance than in 2017, when half as many brands improved as declined and the average gain was smaller than the average loss. However, this year’s results are weaker than 2016’s, when over five times as many brands rose as sank and the average gain was larger than the average loss.
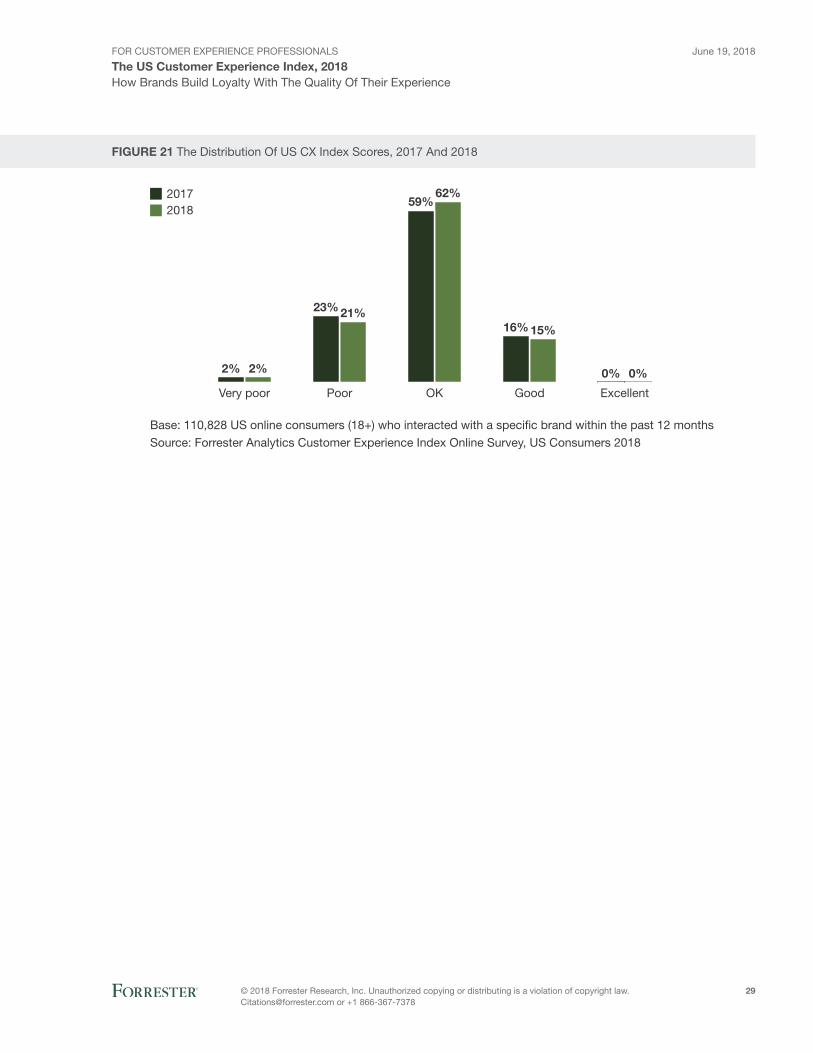
› The number of good and poor scores dipped, while the number of OK scores rose. The percentage of brands in the good category diminished from 16% to 15% as the quality of some brands’ CX fell (see Figure 21).2 Similarly, the percentage of brands at the poor level shrank from 23% to 21% as the quality of their CX rose. As a result, the percentage of brands in the OK category swelled from 59% to 62%. With more than three-fifths of brands clustered in the middle, there’s a greater opportunity for firms to gain a competitive advantage by moving up to the good and excellent categories.
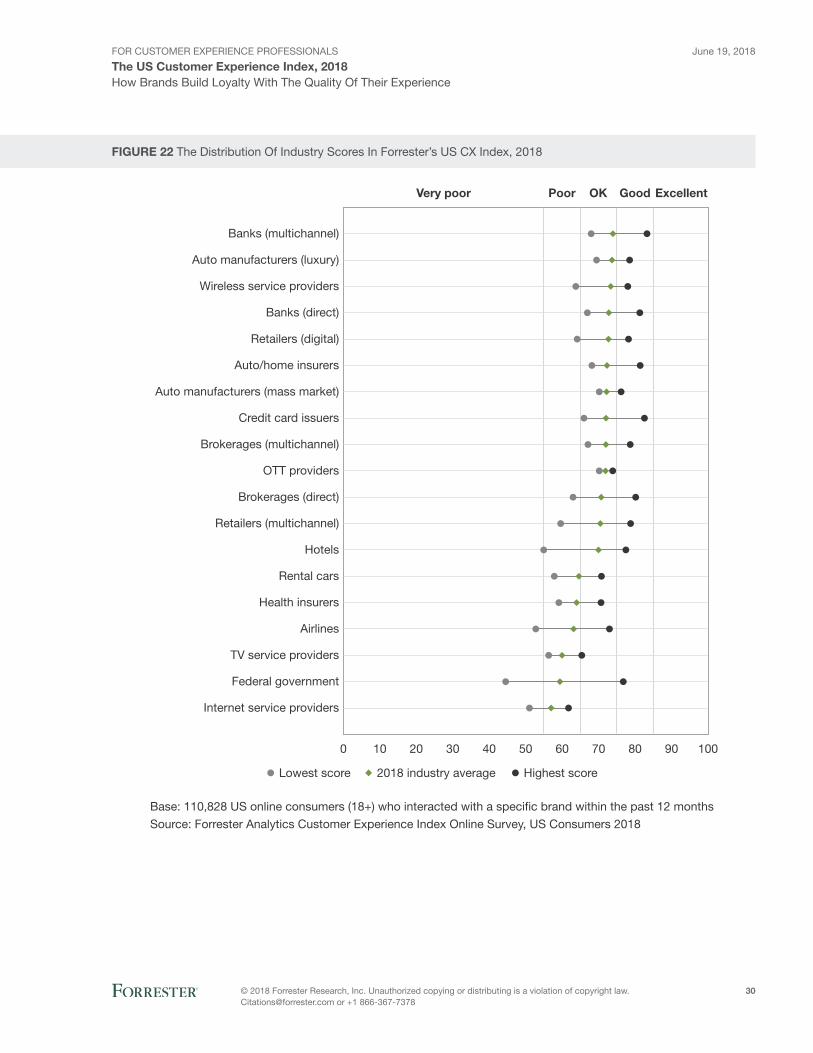
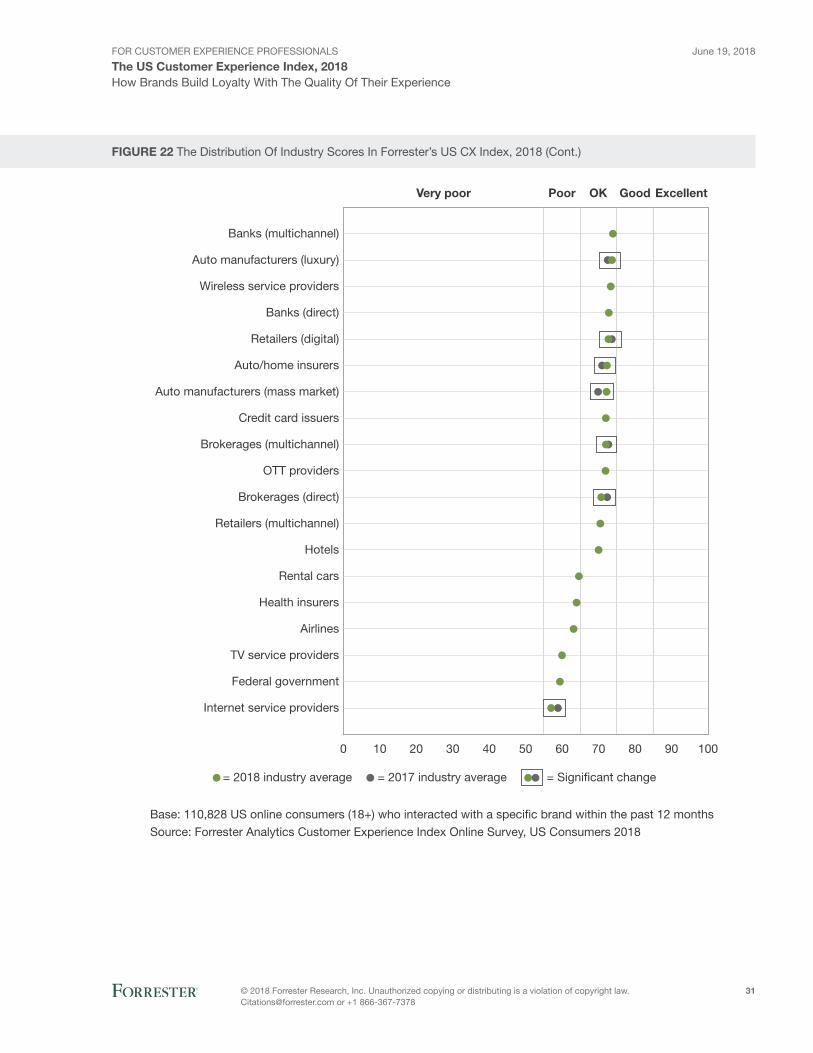
› four industry averages fell, and three climbed. The average score in the direct brokerage, multichannel brokerage, internet service provider (ISP), and digital retailer industries dipped (see Figure 22). Meanwhile, the bar for the auto/home insurer, luxury auto manufacturer, and mass-market auto manufacturer industries inched up.3 That’s better than in 2017, when three industry averages fell and none rose. The result of this year’s changes? The luxury automobile manufacturer industry rose from 6th to 2nd place, knocking the digital retailer industry down from 2nd to 5th. Also, the auto/home insurance industry landed in 6th, up from 10th, and the mass-market auto manufacturer industry moved up to 7th from 13th. Meanwhile, the multichannel brokerage industry fell from 5th to 9th, and the direct brokerage industry dropped from 8th to 11th. The ISP industry cemented its last-place position with an even lower score than in 2017.
For Customer experienCe proFessionals
The US Customer Experience Index, 2018June 19, 2018
© 2018 Forrester research, inc. unauthorized copying or distributing is a violation of copyright law. [email protected] or +1 866-367-7378
3
How Brands Build Loyalty With The Quality Of Their Experience
fIGUrE 1 Forrester’s CX Index Measures Drivers Of CX Success Across Six Categories
3
4
5
6
1
2
7
8
CX QUALITY CUSTOMER LOYALTY
Forrester’s CX Index score measures how successfully a companydelivers customer experiences that create and sustain loyalty.
RetentionLikelihood of keeping existing business.
CX INDEXSCORE
EnrichmentLikelihood of buying additional products and services.
AdvocacyLikelihood of recommending to others.
EffectivenessThe experience
delivers value to customers.
EaseIt’s not difficult
to get value from the experience.
EmotionCustomers feel
good about their experience.
For Customer experienCe proFessionals
The US Customer Experience Index, 2018June 19, 2018
© 2018 Forrester research, inc. unauthorized copying or distributing is a violation of copyright law. [email protected] or +1 866-367-7378
4
How Brands Build Loyalty With The Quality Of Their Experience
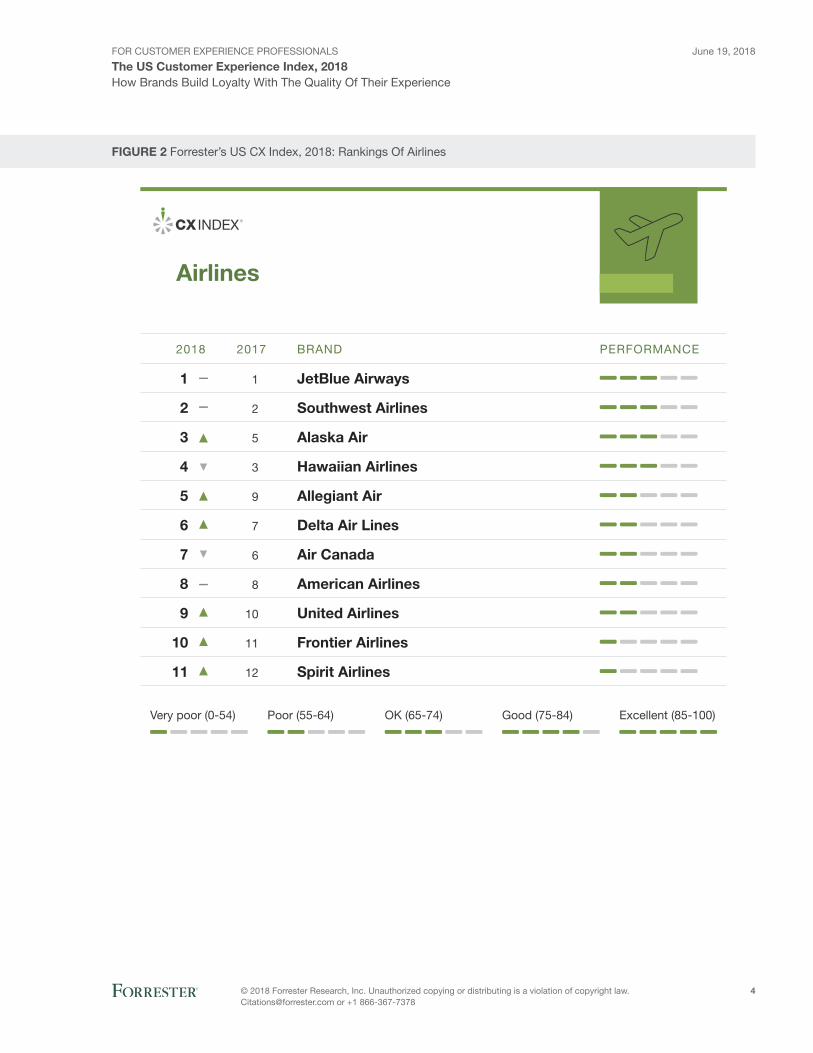
fIGUrE 2 Forrester’s US CX Index, 2018: Rankings Of Airlines
Very poor (0-54) Excellent (85-100)Good (75-84)OK (65-74)Poor (55-64)
1
2
3
4
5
6
7
8
9
10
11
1
2
5
3
9
7
6
8
10
11
12
JetBlue Airways
Southwest Airlines
Alaska Air
Hawaiian Airlines
Allegiant Air
Delta Air Lines
Air Canada
American Airlines
United Airlines
Frontier Airlines
Spirit Airlines
2018 2017 BRAND PERFORMANCE
Airlines

For Customer experienCe proFessionals
The US Customer Experience Index, 2018June 19, 2018
© 2018 Forrester research, inc. unauthorized copying or distributing is a violation of copyright law. [email protected] or +1 866-367-7378
5
How Brands Build Loyalty With The Quality Of Their Experience
fIGUrE 3 Forrester’s US CX Index, 2018: Rankings Of Auto/Home Insurers
Very poor (0-54) Excellent (85-100)Good (75-84)OK (65-74)Poor (55-64)
1
2
3
4
5
6
7
8
9
10
11
1
9
2
15
10
4
6
3
5
11
12
USAA
Erie Insurance
The Hartford
American Family Insurance
Travelers Insurance
State Farm Insurance
MetLife
Nationwide Mutual Insurance
Geico
Allstate
Safeco Insurance
2018 2017 BRAND PERFORMANCE
Auto/home insurers
For Customer experienCe proFessionals
The US Customer Experience Index, 2018June 19, 2018
© 2018 Forrester research, inc. unauthorized copying or distributing is a violation of copyright law. [email protected] or +1 866-367-7378
6
How Brands Build Loyalty With The Quality Of Their Experience
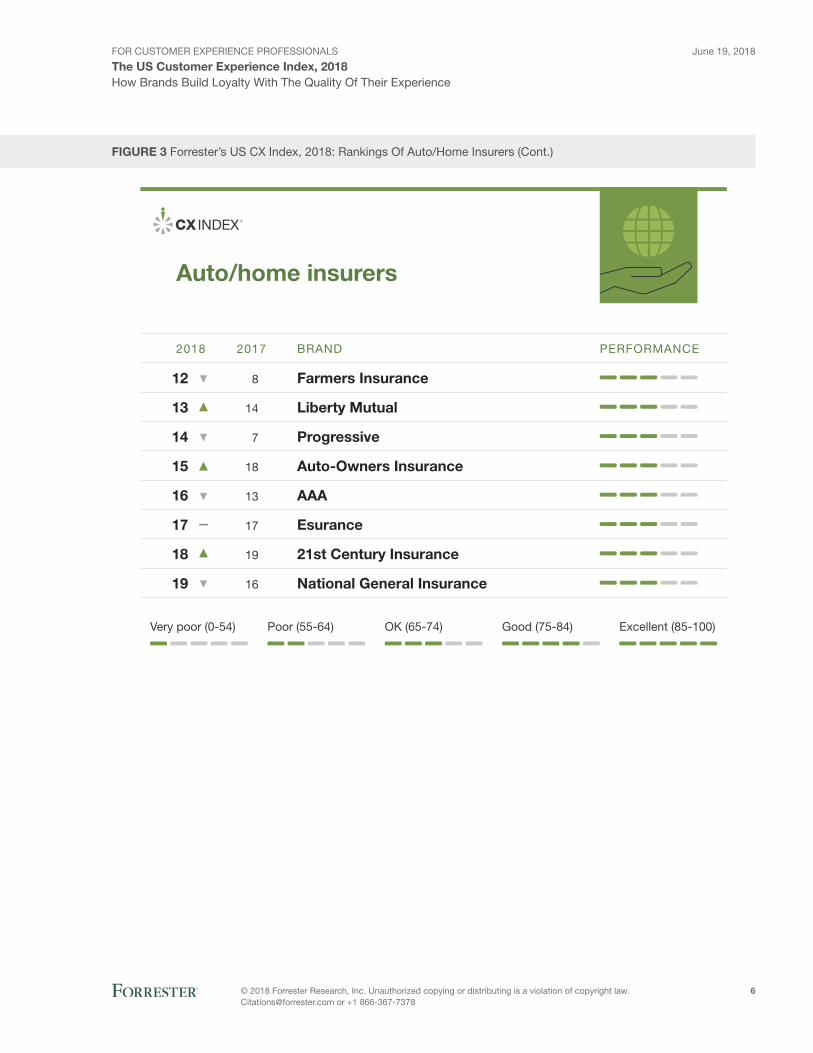
fIGUrE 3 Forrester’s US CX Index, 2018: Rankings Of Auto/Home Insurers (Cont.)
Very poor (0-54) Excellent (85-100)Good (75-84)OK (65-74)Poor (55-64)
12
13
14
15
16
17
18
19
8
14
7
18
13
17
19
16
Farmers Insurance
Liberty Mutual
Progressive
Auto-Owners Insurance
AAA
Esurance
21st Century Insurance
National General Insurance
2018 2017 BRAND PERFORMANCE
Auto/home insurers
For Customer experienCe proFessionals
The US Customer Experience Index, 2018June 19, 2018
© 2018 Forrester research, inc. unauthorized copying or distributing is a violation of copyright law. [email protected] or +1 866-367-7378
7
How Brands Build Loyalty With The Quality Of Their Experience
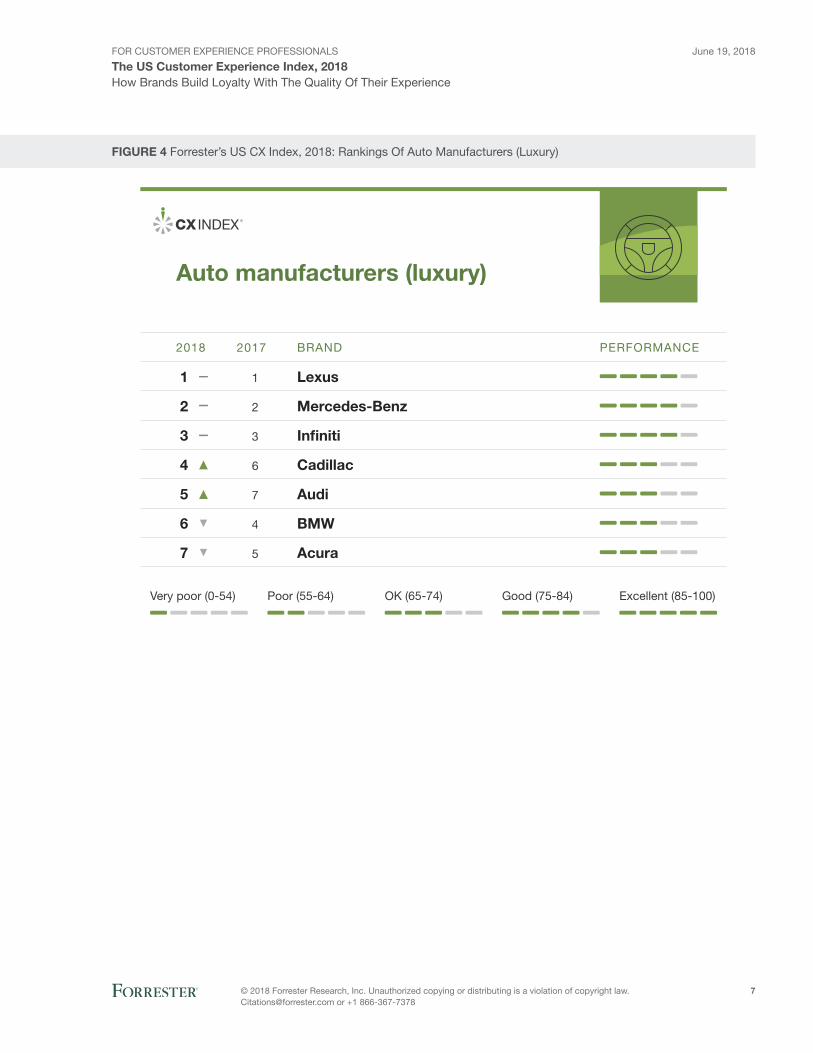
fIGUrE 4 Forrester’s US CX Index, 2018: Rankings Of Auto Manufacturers (Luxury)
Very poor (0-54) Excellent (85-100)Good (75-84)OK (65-74)Poor (55-64)
1
2
3
4
5
6
7
1
2
3
6
7
4
5
Lexus
Mercedes-Benz
In�niti
Cadillac
Audi
BMW
Acura
2018 2017 BRAND PERFORMANCE
Auto manufacturers (luxury)
For Customer experienCe proFessionals
The US Customer Experience Index, 2018June 19, 2018
© 2018 Forrester research, inc. unauthorized copying or distributing is a violation of copyright law. [email protected] or +1 866-367-7378
8
How Brands Build Loyalty With The Quality Of Their Experience
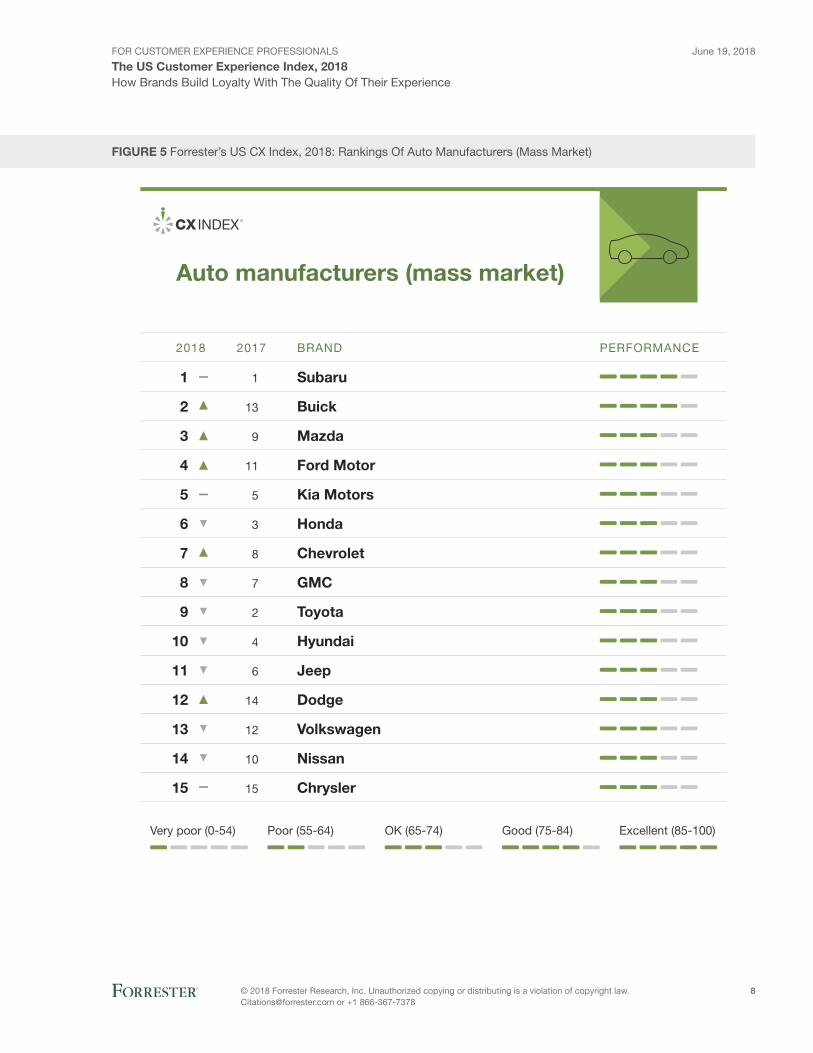
fIGUrE 5 Forrester’s US CX Index, 2018: Rankings Of Auto Manufacturers (Mass Market)
Very poor (0-54) Excellent (85-100)Good (75-84)OK (65-74)Poor (55-64)
1
2
3
4
5
6
7
8
9
10
11
12
13
14
15
1
13
9
11
5
3
8
7
2
4
6
14
12
10
15
Subaru
Buick
Mazda
Ford Motor
Kia Motors
Honda
Chevrolet
GMC
Toyota
Hyundai
Jeep
Dodge
Volkswagen
Nissan
Chrysler
2018 2017 BRAND PERFORMANCE
Auto manufacturers (mass market)
For Customer experienCe proFessionals
The US Customer Experience Index, 2018June 19, 2018
© 2018 Forrester research, inc. unauthorized copying or distributing is a violation of copyright law. [email protected] or +1 866-367-7378
9
How Brands Build Loyalty With The Quality Of Their Experience
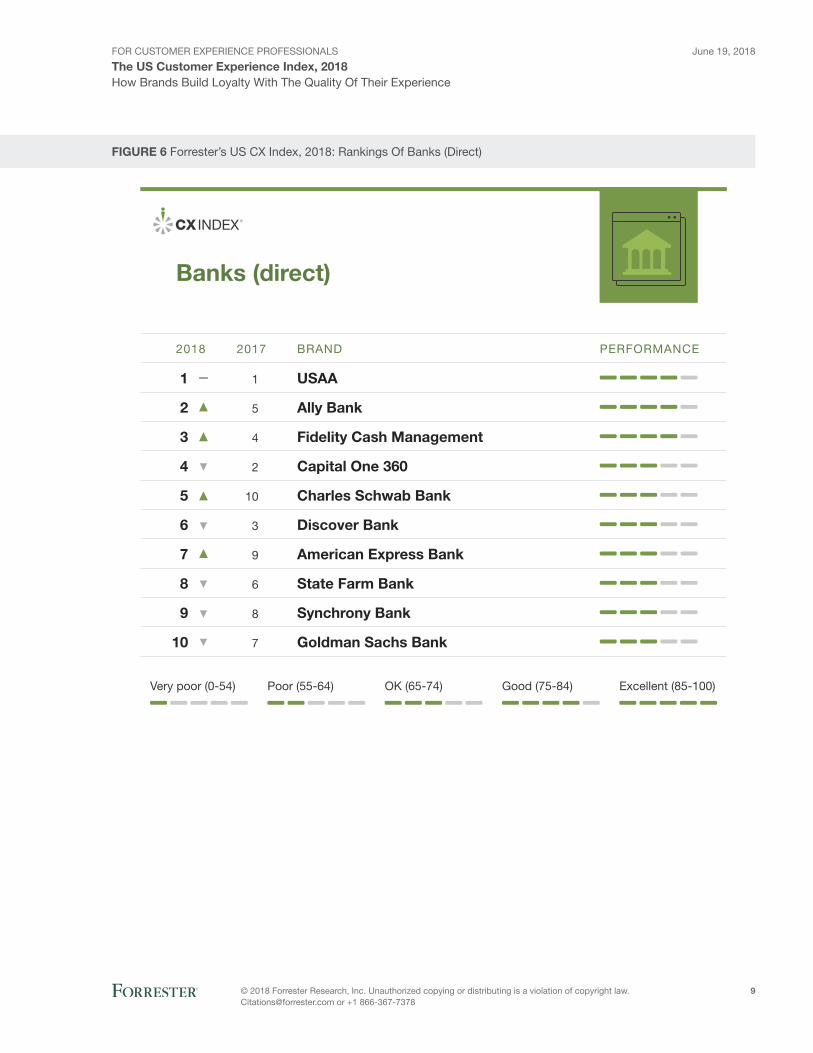
fIGUrE 6 Forrester’s US CX Index, 2018: Rankings Of Banks (Direct)
Very poor (0-54) Excellent (85-100)Good (75-84)OK (65-74)Poor (55-64)
1
2
3
4
5
6
7
8
9
10
1
5
4
2
10
3
9
6
8
7
USAA
Ally Bank
Fidelity Cash Management
Capital One 360
Charles Schwab Bank
Discover Bank
American Express Bank
State Farm Bank
Synchrony Bank
Goldman Sachs Bank
2018 2017 BRAND PERFORMANCE
Banks (direct)
For Customer experienCe proFessionals
The US Customer Experience Index, 2018June 19, 2018
© 2018 Forrester research, inc. unauthorized copying or distributing is a violation of copyright law. [email protected] or +1 866-367-7378
10
How Brands Build Loyalty With The Quality Of Their Experience
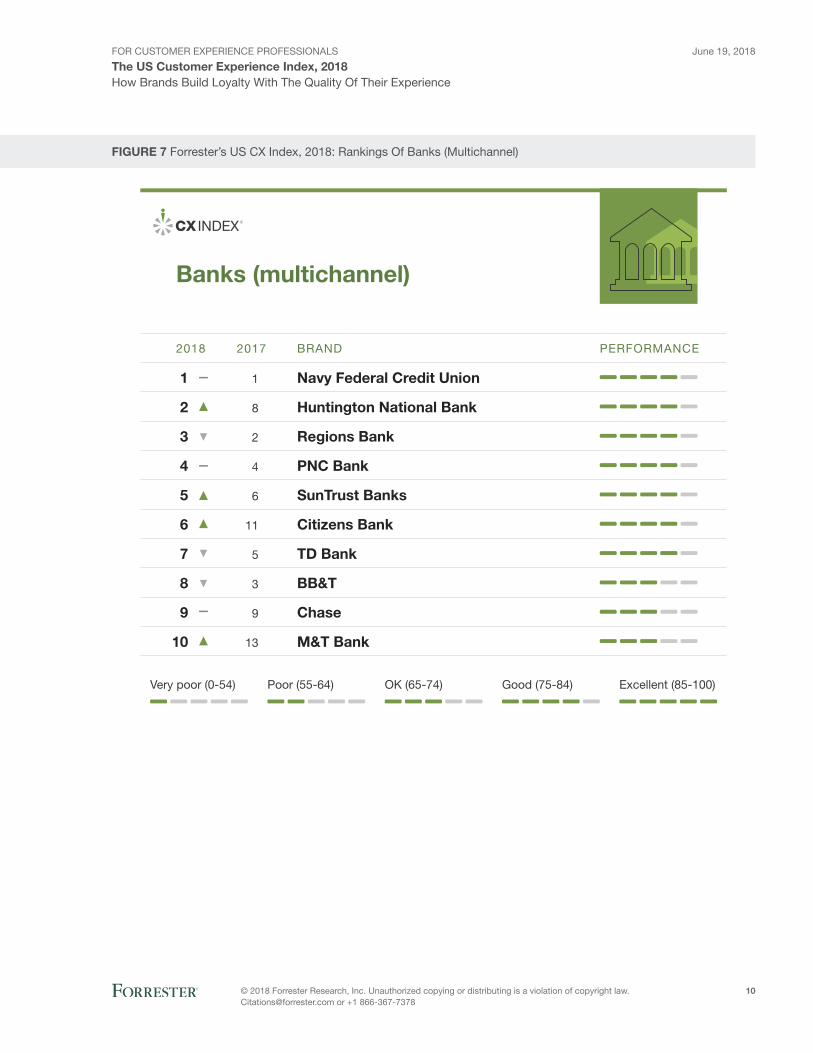
fIGUrE 7 Forrester’s US CX Index, 2018: Rankings Of Banks (Multichannel)
Very poor (0-54) Excellent (85-100)Good (75-84)OK (65-74)Poor (55-64)
1
2
3
4
5
6
7
8
9
10
1
8
2
4
6
11
5
3
9
13
Navy Federal Credit Union
Huntington National Bank
Regions Bank
PNC Bank
SunTrust Banks
Citizens Bank
TD Bank
BB&T
Chase
M&T Bank
2018 2017 BRAND PERFORMANCE
Banks (multichannel)
For Customer experienCe proFessionals
The US Customer Experience Index, 2018June 19, 2018
© 2018 Forrester research, inc. unauthorized copying or distributing is a violation of copyright law. [email protected] or +1 866-367-7378
11
How Brands Build Loyalty With The Quality Of Their Experience
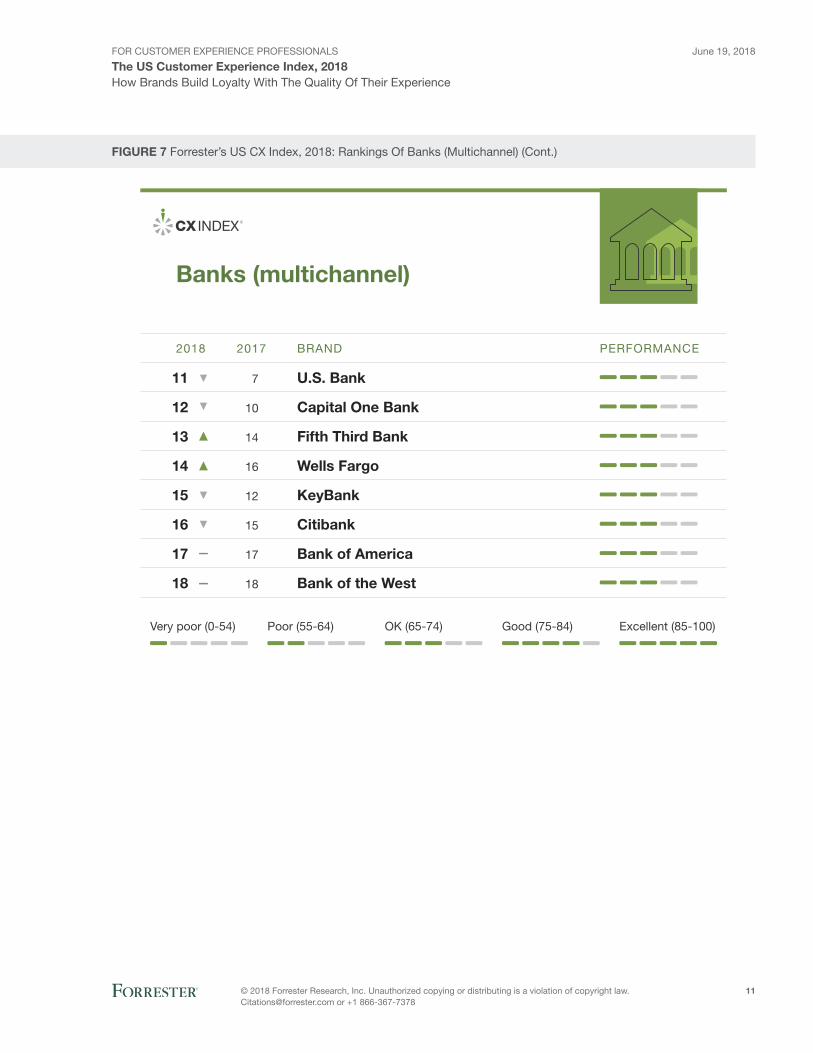
fIGUrE 7 Forrester’s US CX Index, 2018: Rankings Of Banks (Multichannel) (Cont.)
Very poor (0-54) Excellent (85-100)Good (75-84)OK (65-74)Poor (55-64)
11
12
13
14
15
16
17
18
7
10
14
16
12
15
17
18
U.S. Bank
Capital One Bank
Fifth Third Bank
Wells Fargo
KeyBank
Citibank
Bank of America
Bank of the West
2018 2017 BRAND PERFORMANCE
Banks (multichannel)
For Customer experienCe proFessionals
The US Customer Experience Index, 2018June 19, 2018
© 2018 Forrester research, inc. unauthorized copying or distributing is a violation of copyright law. [email protected] or +1 866-367-7378
12
How Brands Build Loyalty With The Quality Of Their Experience
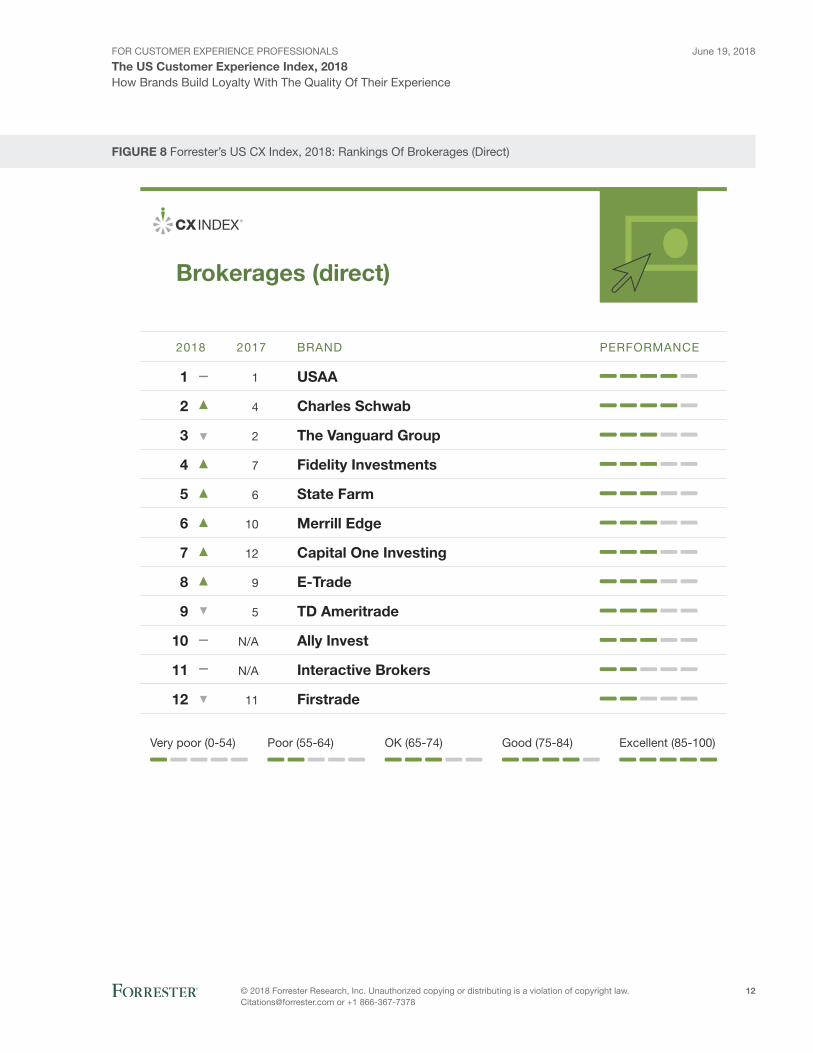
fIGUrE 8 Forrester’s US CX Index, 2018: Rankings Of Brokerages (Direct)
Very poor (0-54) Excellent (85-100)Good (75-84)OK (65-74)Poor (55-64)
1
2
3
4
5
6
7
8
9
10
11
12
1
4
2
7
6
10
12
9
5
N/A
N/A
11
USAA
Charles Schwab
The Vanguard Group
Fidelity Investments
State Farm
Merrill Edge
Capital One Investing
E-Trade
TD Ameritrade
Ally Invest
Interactive Brokers
Firstrade
2018 2017 BRAND PERFORMANCE
Brokerages (direct)
For Customer experienCe proFessionals
The US Customer Experience Index, 2018June 19, 2018
© 2018 Forrester research, inc. unauthorized copying or distributing is a violation of copyright law. [email protected] or +1 866-367-7378
13
How Brands Build Loyalty With The Quality Of Their Experience
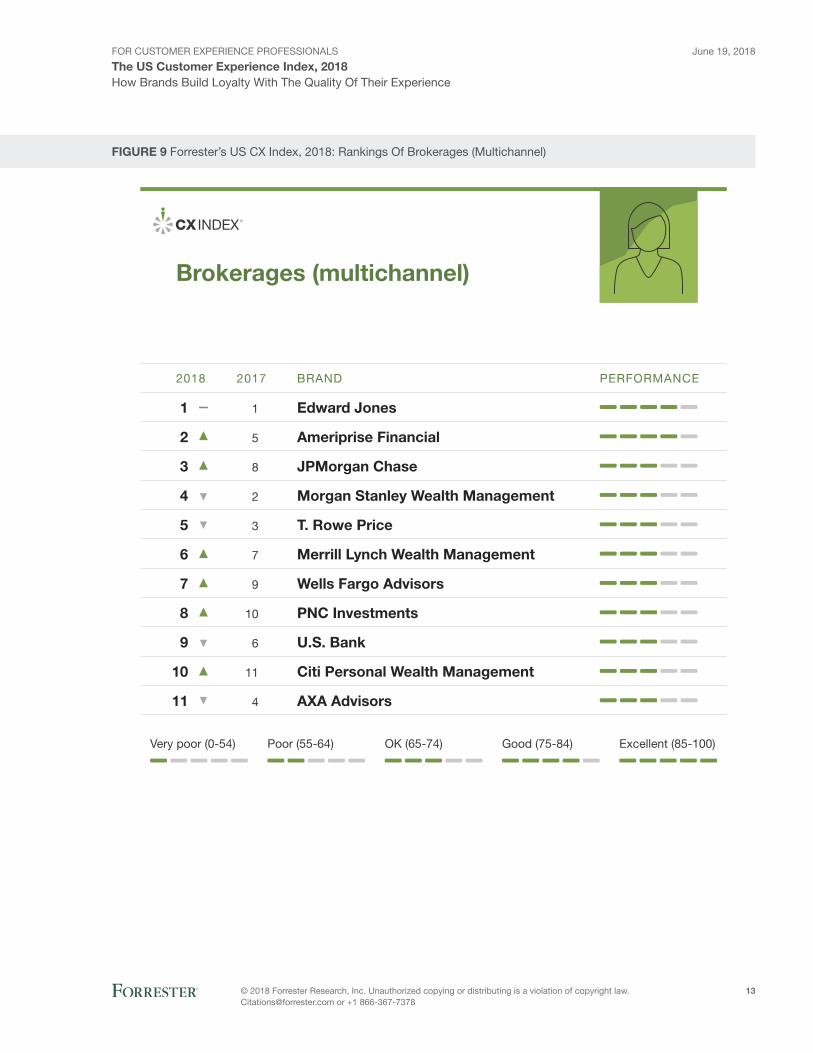
fIGUrE 9 Forrester’s US CX Index, 2018: Rankings Of Brokerages (Multichannel)
Very poor (0-54) Excellent (85-100)Good (75-84)OK (65-74)Poor (55-64)
1
2
3
4
5
6
7
8
9
10
11
1
5
8
2
3
7
9
10
6
11
4
Edward Jones
Ameriprise Financial
JPMorgan Chase
Morgan Stanley Wealth Management
T. Rowe Price
Merrill Lynch Wealth Management
Wells Fargo Advisors
PNC Investments
U.S. Bank
Citi Personal Wealth Management
AXA Advisors
2018 2017 BRAND PERFORMANCE
Brokerages (multichannel)
For Customer experienCe proFessionals
The US Customer Experience Index, 2018June 19, 2018
© 2018 Forrester research, inc. unauthorized copying or distributing is a violation of copyright law. [email protected] or +1 866-367-7378
14
How Brands Build Loyalty With The Quality Of Their Experience
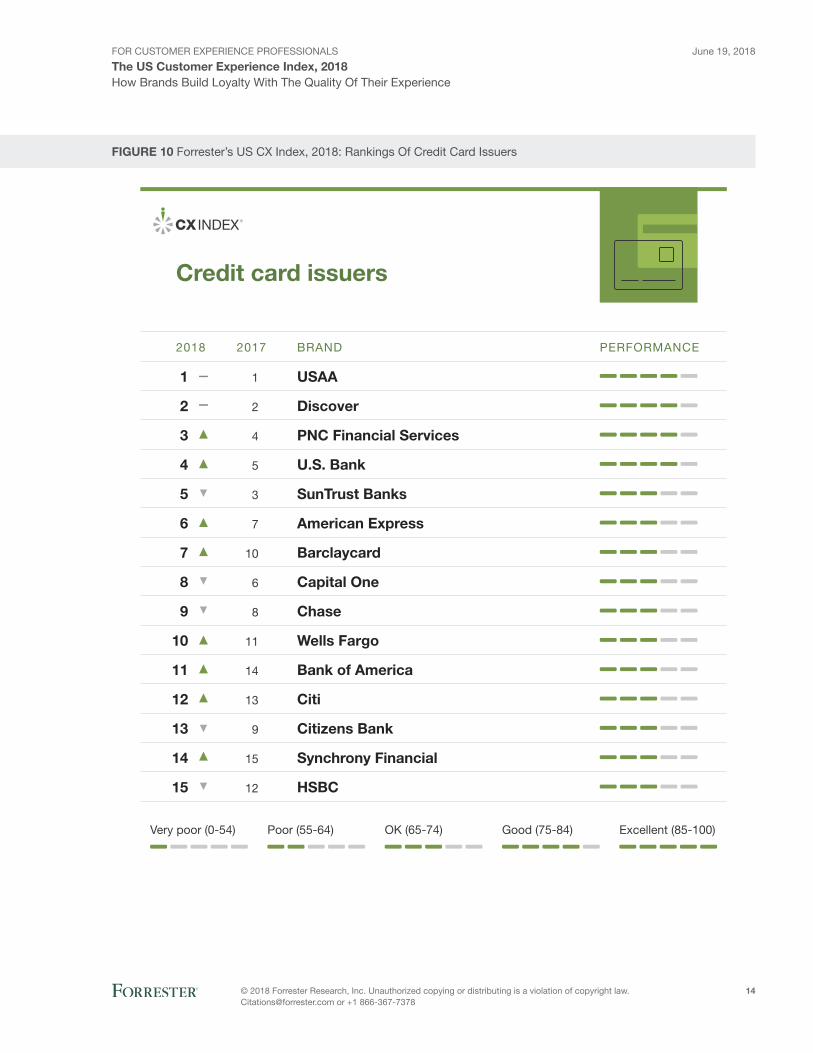
fIGUrE 10 Forrester’s US CX Index, 2018: Rankings Of Credit Card Issuers
Very poor (0-54) Excellent (85-100)Good (75-84)OK (65-74)Poor (55-64)
1
2
3
4
5
6
7
8
9
10
11
12
13
14
15
1
2
4
5
3
7
10
6
8
11
14
13
9
15
12
USAA
Discover
PNC Financial Services
U.S. Bank
SunTrust Banks
American Express
Barclaycard
Capital One
Chase
Wells Fargo
Bank of America
Citi
Citizens Bank
Synchrony Financial
HSBC
2018 2017 BRAND PERFORMANCE
Credit card issuers
For Customer experienCe proFessionals
The US Customer Experience Index, 2018June 19, 2018
© 2018 Forrester research, inc. unauthorized copying or distributing is a violation of copyright law. [email protected] or +1 866-367-7378
15
How Brands Build Loyalty With The Quality Of Their Experience
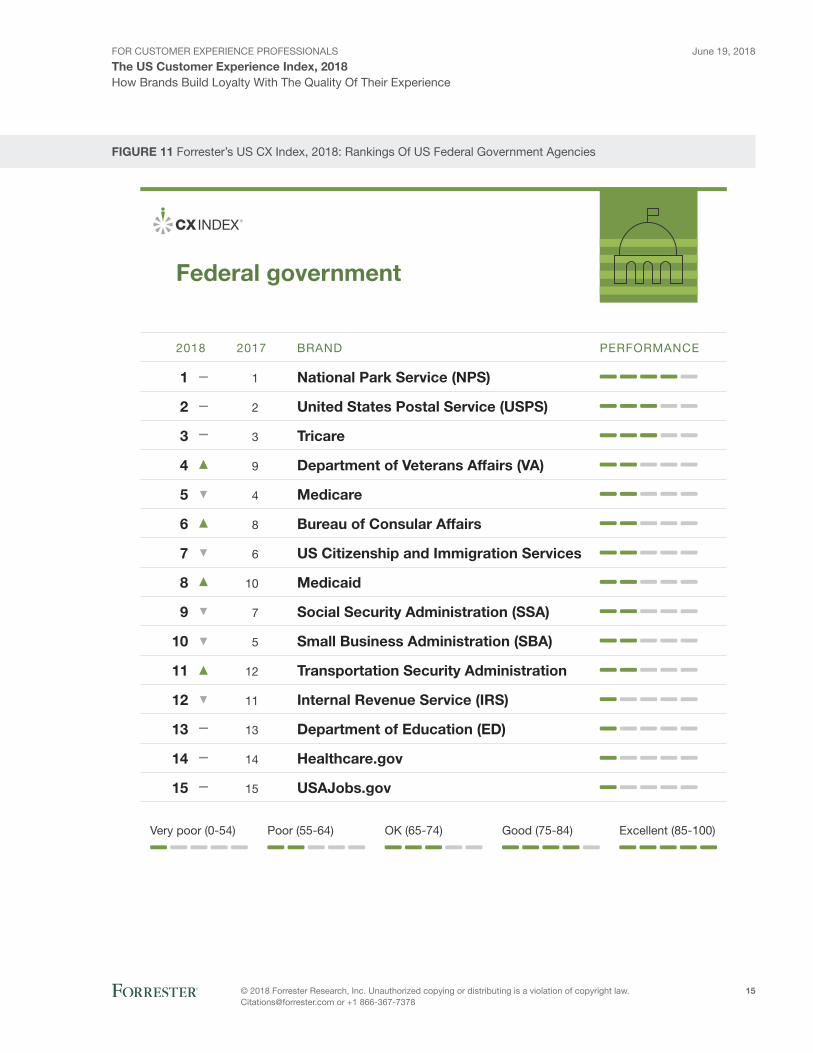
fIGUrE 11 Forrester’s US CX Index, 2018: Rankings Of US Federal Government Agencies
Very poor (0-54) Excellent (85-100)Good (75-84)OK (65-74)Poor (55-64)
1
2
3
4
5
6
7
8
9
10
11
12
13
14
15
1
2
3
9
4
8
6
10
7
5
12
11
13
14
15
National Park Service (NPS)
United States Postal Service (USPS)
Tricare
Department of Veterans Affairs (VA)
Medicare
Bureau of Consular Affairs
US Citizenship and Immigration Services
Medicaid
Social Security Administration (SSA)
Small Business Administration (SBA)
Transportation Security Administration
Internal Revenue Service (IRS)
Department of Education (ED)
Healthcare.gov
USAJobs.gov
2018 2017 BRAND PERFORMANCE
Federal government
For Customer experienCe proFessionals
The US Customer Experience Index, 2018June 19, 2018
© 2018 Forrester research, inc. unauthorized copying or distributing is a violation of copyright law. [email protected] or +1 866-367-7378
16
How Brands Build Loyalty With The Quality Of Their Experience
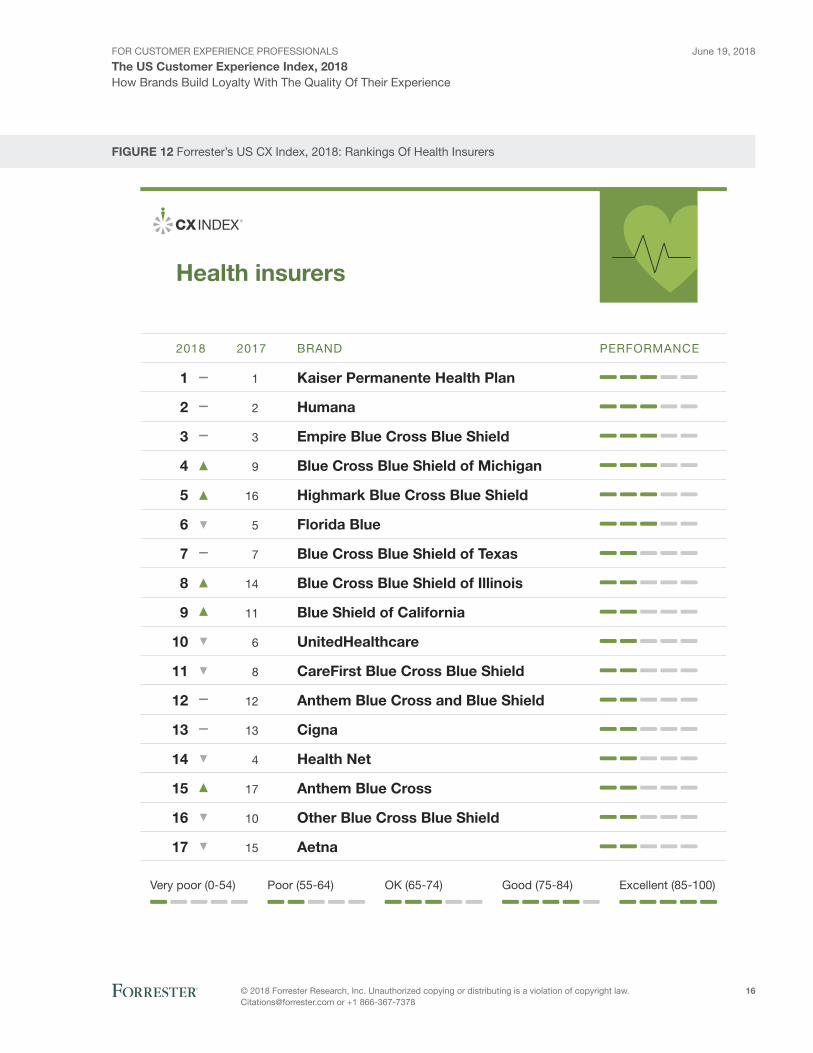
fIGUrE 12 Forrester’s US CX Index, 2018: Rankings Of Health Insurers
Very poor (0-54) Excellent (85-100)Good (75-84)OK (65-74)Poor (55-64)
1
2
3
4
5
6
7
8
9
10
11
12
13
14
15
16
17
1
2
3
9
16
5
7
14
11
6
8
12
13
4
17
10
15
Kaiser Permanente Health Plan
Humana
Empire Blue Cross Blue Shield
Blue Cross Blue Shield of Michigan
Highmark Blue Cross Blue Shield
Florida Blue
Blue Cross Blue Shield of Texas
Blue Cross Blue Shield of Illinois
Blue Shield of California
UnitedHealthcare
CareFirst Blue Cross Blue Shield
Anthem Blue Cross and Blue Shield
Cigna
Health Net
Anthem Blue Cross
Other Blue Cross Blue Shield
Aetna
2018 2017 BRAND PERFORMANCE
Health insurers
For Customer experienCe proFessionals
The US Customer Experience Index, 2018June 19, 2018
© 2018 Forrester research, inc. unauthorized copying or distributing is a violation of copyright law. [email protected] or +1 866-367-7378
17
How Brands Build Loyalty With The Quality Of Their Experience
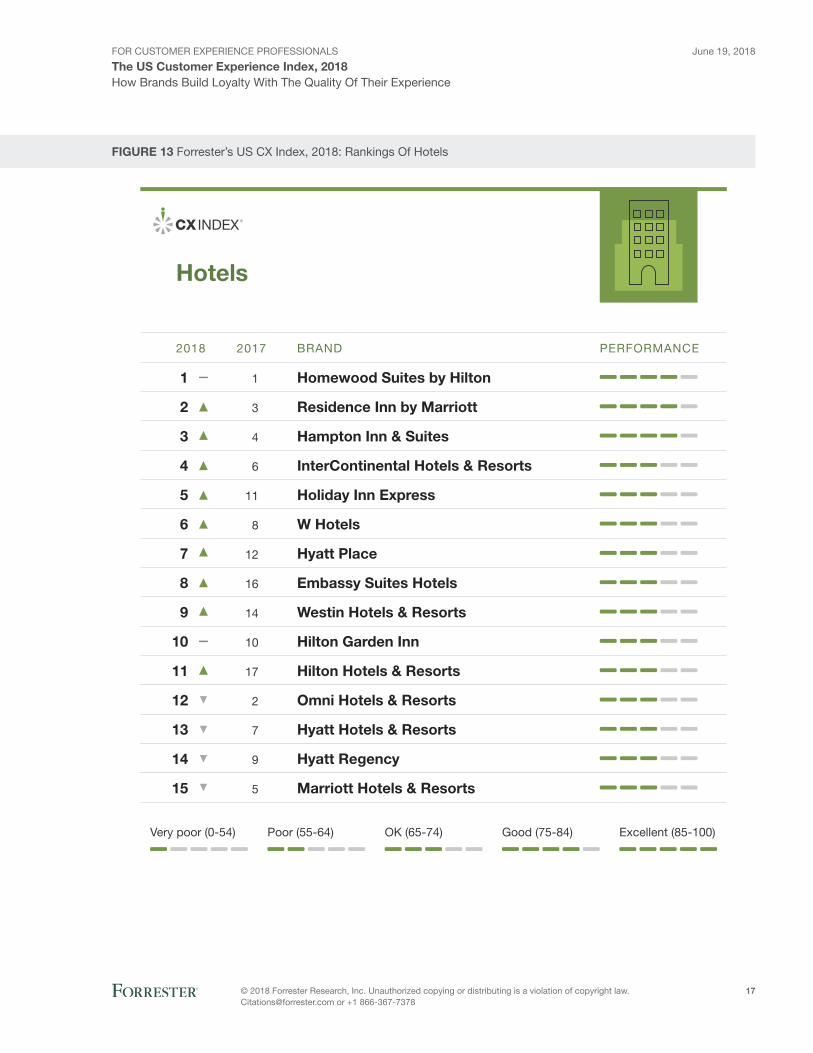
fIGUrE 13 Forrester’s US CX Index, 2018: Rankings Of Hotels
Very poor (0-54) Excellent (85-100)Good (75-84)OK (65-74)Poor (55-64)
1
2
3
4
5
6
7
8
9
10
11
12
13
14
15
1
3
4
6
11
8
12
16
14
10
17
2
7
9
5
Homewood Suites by Hilton
Residence Inn by Marriott
Hampton Inn & Suites
InterContinental Hotels & Resorts
Holiday Inn Express
W Hotels
Hyatt Place
Embassy Suites Hotels
Westin Hotels & Resorts
Hilton Garden Inn
Hilton Hotels & Resorts
Omni Hotels & Resorts
Hyatt Hotels & Resorts
Hyatt Regency
Marriott Hotels & Resorts
2018 2017 BRAND PERFORMANCE
Hotels
For Customer experienCe proFessionals
The US Customer Experience Index, 2018June 19, 2018
© 2018 Forrester research, inc. unauthorized copying or distributing is a violation of copyright law. [email protected] or +1 866-367-7378
18
How Brands Build Loyalty With The Quality Of Their Experience
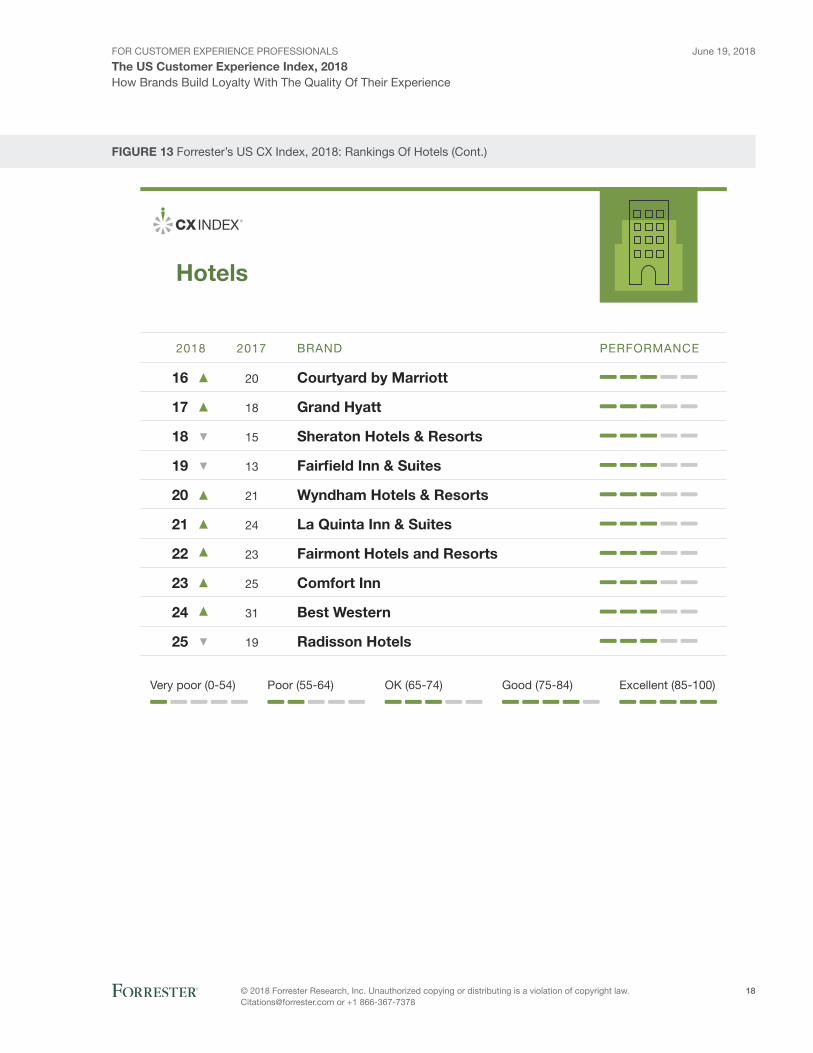
fIGUrE 13 Forrester’s US CX Index, 2018: Rankings Of Hotels (Cont.)
Very poor (0-54) Excellent (85-100)Good (75-84)OK (65-74)Poor (55-64)
16
17
18
19
20
21
22
23
24
25
20
18
15
13
21
24
23
25
31
19
Courtyard by Marriott
Grand Hyatt
Sheraton Hotels & Resorts
Fair�eld Inn & Suites
Wyndham Hotels & Resorts
La Quinta Inn & Suites
Fairmont Hotels and Resorts
Comfort Inn
Best Western
Radisson Hotels
2018 2017 BRAND PERFORMANCE
Hotels
For Customer experienCe proFessionals
The US Customer Experience Index, 2018June 19, 2018
© 2018 Forrester research, inc. unauthorized copying or distributing is a violation of copyright law. [email protected] or +1 866-367-7378
19
How Brands Build Loyalty With The Quality Of Their Experience
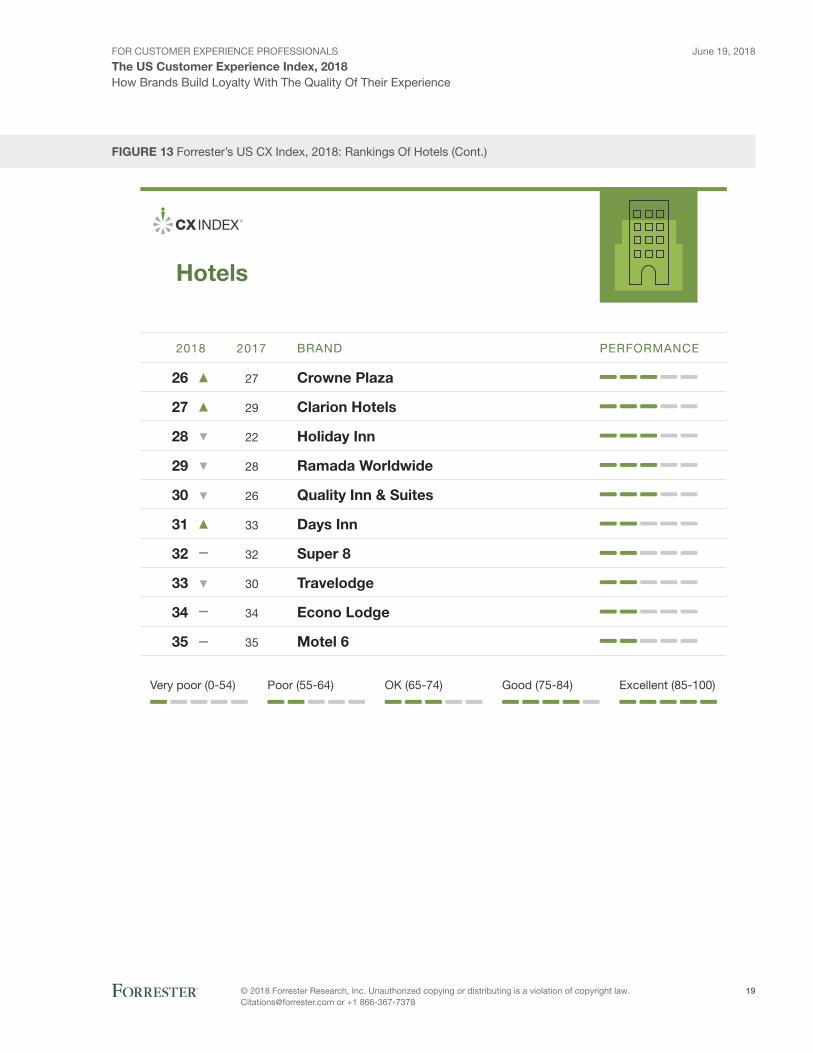
fIGUrE 13 Forrester’s US CX Index, 2018: Rankings Of Hotels (Cont.)
Very poor (0-54) Excellent (85-100)Good (75-84)OK (65-74)Poor (55-64)
26
27
28
29
30
31
32
33
34
35
27
29
22
28
26
33
32
30
34
35
Crowne Plaza
Clarion Hotels
Holiday Inn
Ramada Worldwide
Quality Inn & Suites
Days Inn
Super 8
Travelodge
Econo Lodge
Motel 6
2018 2017 BRAND PERFORMANCE
Hotels
For Customer experienCe proFessionals
The US Customer Experience Index, 2018June 19, 2018
© 2018 Forrester research, inc. unauthorized copying or distributing is a violation of copyright law. [email protected] or +1 866-367-7378
20
How Brands Build Loyalty With The Quality Of Their Experience
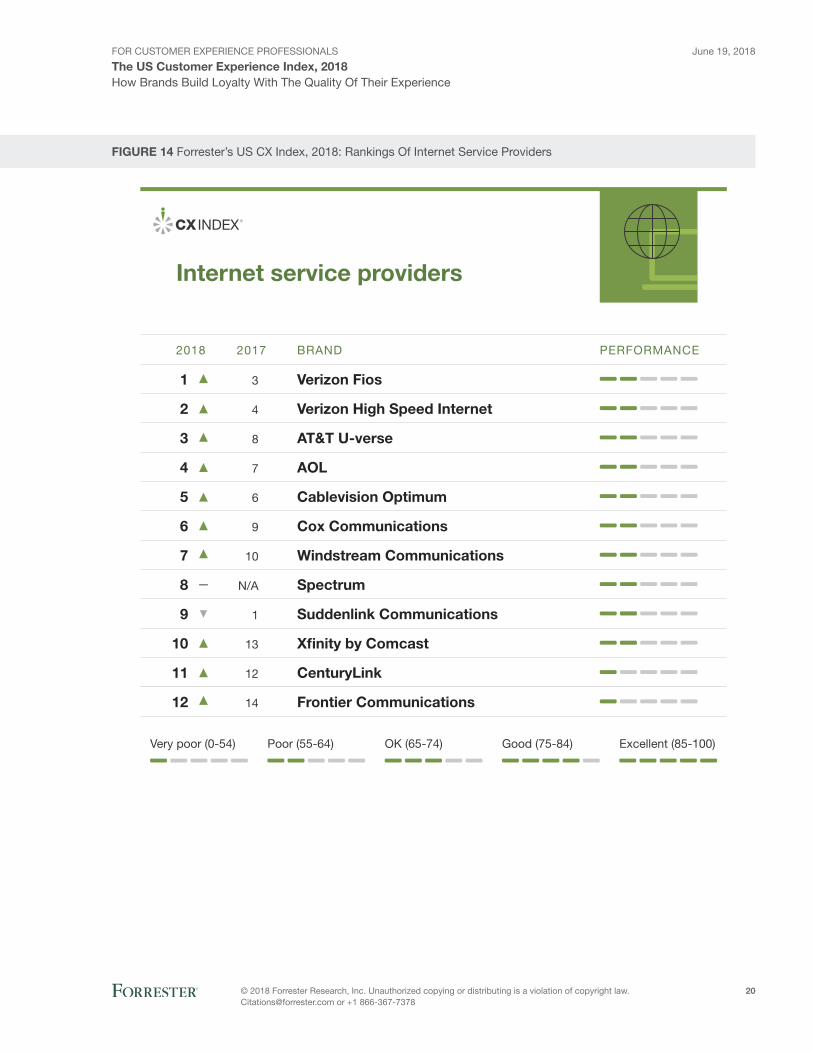
fIGUrE 14 Forrester’s US CX Index, 2018: Rankings Of Internet Service Providers
Very poor (0-54) Excellent (85-100)Good (75-84)OK (65-74)Poor (55-64)
1
2
3
4
5
6
7
8
9
10
11
12
3
4
8
7
6
9
10
N/A
1
13
12
14
Verizon Fios
Verizon High Speed Internet
AT&T U-verse
AOL
Cablevision Optimum
Cox Communications
Windstream Communications
Spectrum
Suddenlink Communications
X�nity by Comcast
CenturyLink
Frontier Communications
2018 2017 BRAND PERFORMANCE
Internet service providers
For Customer experienCe proFessionals
The US Customer Experience Index, 2018June 19, 2018
© 2018 Forrester research, inc. unauthorized copying or distributing is a violation of copyright law. [email protected] or +1 866-367-7378
21
How Brands Build Loyalty With The Quality Of Their Experience
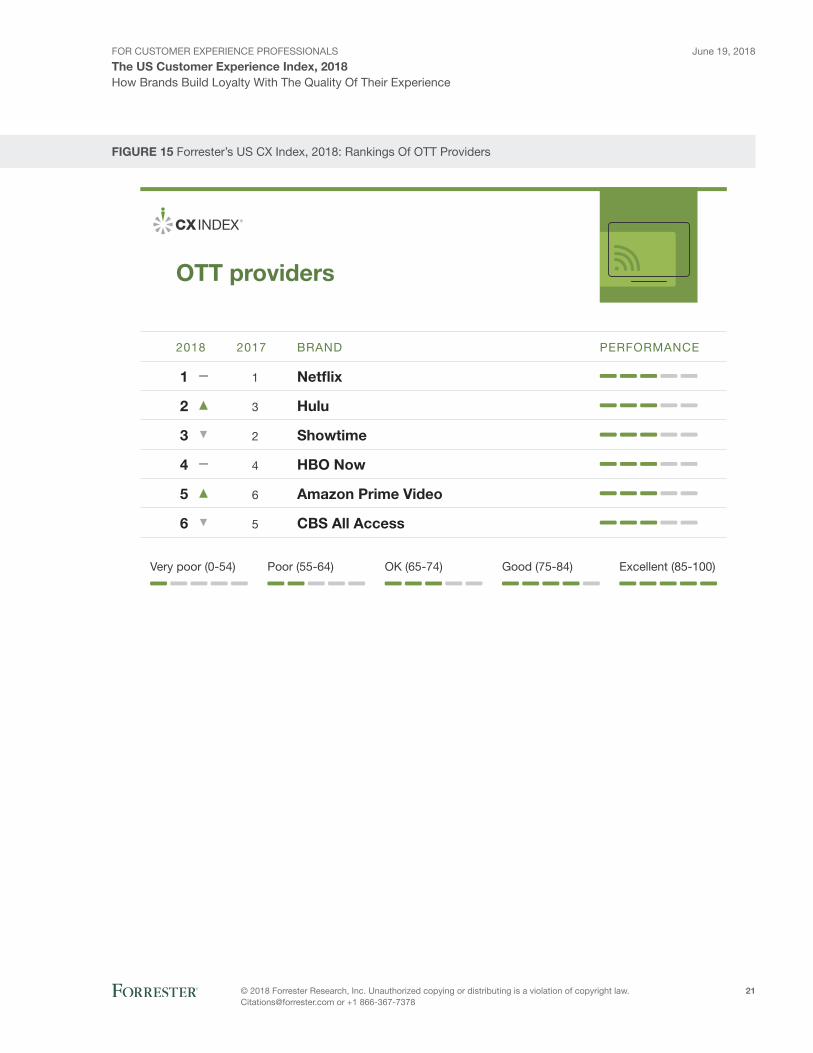
fIGUrE 15 Forrester’s US CX Index, 2018: Rankings Of OTT Providers
Very poor (0-54) Excellent (85-100)Good (75-84)OK (65-74)Poor (55-64)
1
2
3
4
5
6
1
3
2
4
6
5
Netflix
Hulu
Showtime
HBO Now
Amazon Prime Video
CBS All Access
2018 2017 BRAND PERFORMANCE
OTT providers
For Customer experienCe proFessionals
The US Customer Experience Index, 2018June 19, 2018
© 2018 Forrester research, inc. unauthorized copying or distributing is a violation of copyright law. [email protected] or +1 866-367-7378
22
How Brands Build Loyalty With The Quality Of Their Experience
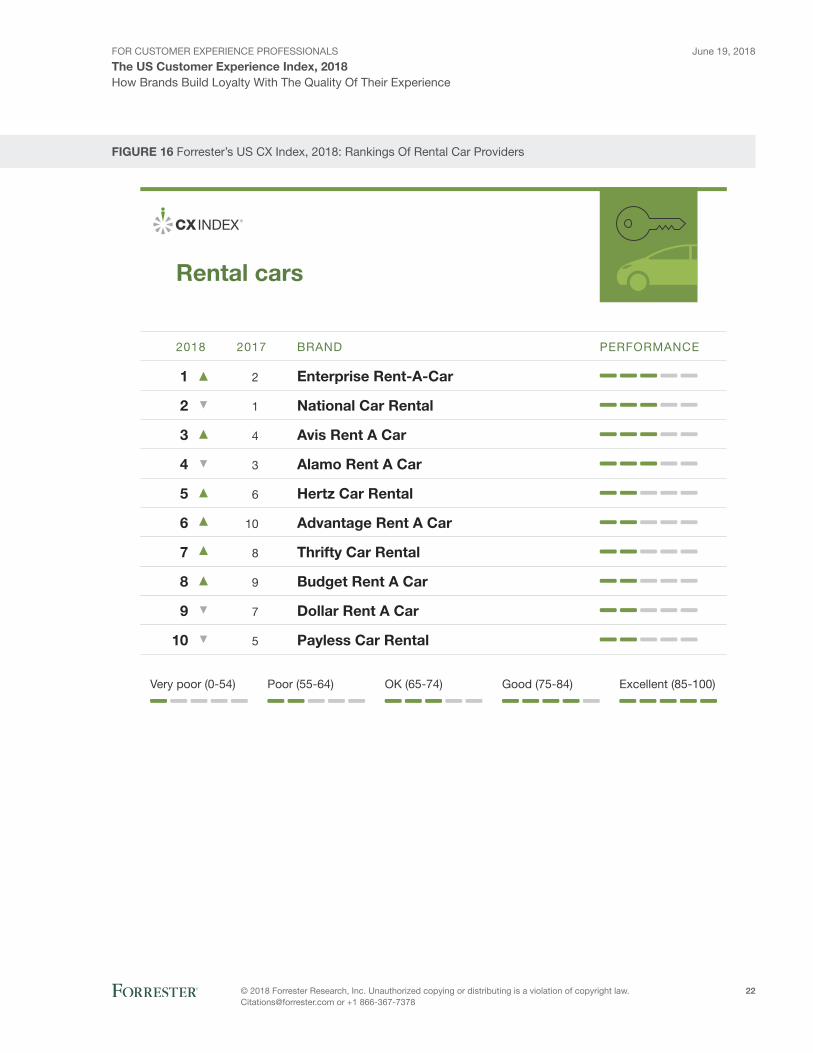
fIGUrE 16 Forrester’s US CX Index, 2018: Rankings Of Rental Car Providers
Very poor (0-54) Excellent (85-100)Good (75-84)OK (65-74)Poor (55-64)
1
2
3
4
5
6
7
8
9
10
2
1
4
3
6
10
8
9
7
5
Enterprise Rent-A-Car
National Car Rental
Avis Rent A Car
Alamo Rent A Car
Hertz Car Rental
Advantage Rent A Car
Thrifty Car Rental
Budget Rent A Car
Dollar Rent A Car
Payless Car Rental
2018 2017 BRAND PERFORMANCE
Rental cars
For Customer experienCe proFessionals
The US Customer Experience Index, 2018June 19, 2018
© 2018 Forrester research, inc. unauthorized copying or distributing is a violation of copyright law. [email protected] or +1 866-367-7378
23
How Brands Build Loyalty With The Quality Of Their Experience
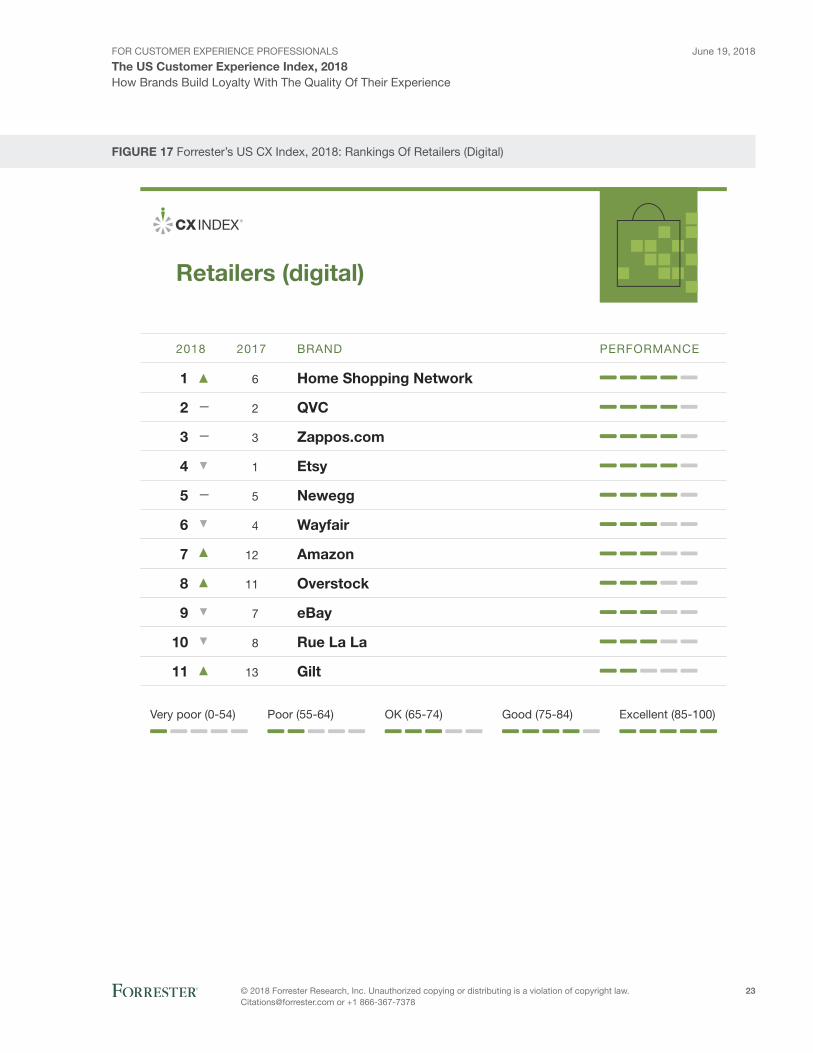
fIGUrE 17 Forrester’s US CX Index, 2018: Rankings Of Retailers (Digital)
Very poor (0-54) Excellent (85-100)Good (75-84)OK (65-74)Poor (55-64)
1
2
3
4
5
6
7
8
9
10
11
6
2
3
1
5
4
12
11
7
8
13
Home Shopping Network
QVC
Zappos.com
Etsy
Newegg
Wayfair
Amazon
Overstock
eBay
Rue La La
Gilt
2018 2017 BRAND PERFORMANCE
Retailers (digital)
For Customer experienCe proFessionals
The US Customer Experience Index, 2018June 19, 2018
© 2018 Forrester research, inc. unauthorized copying or distributing is a violation of copyright law. [email protected] or +1 866-367-7378
24
How Brands Build Loyalty With The Quality Of Their Experience
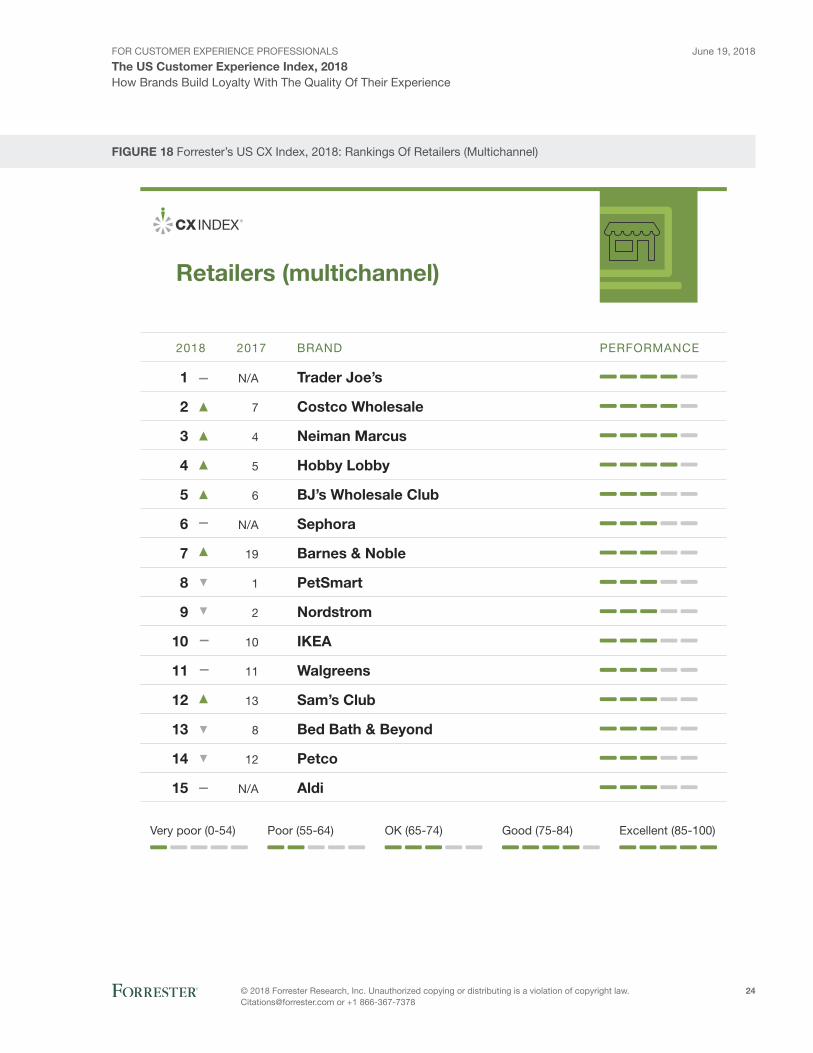
fIGUrE 18 Forrester’s US CX Index, 2018: Rankings Of Retailers (Multichannel)
Very poor (0-54) Excellent (85-100)Good (75-84)OK (65-74)Poor (55-64)
1
2
3
4
5
6
7
8
9
10
11
12
13
14
15
N/A
7
4
5
6
N/A
19
1
2
10
11
13
8
12
N/A
Trader Joe’s
Costco Wholesale
Neiman Marcus
Hobby Lobby
BJ’s Wholesale Club
Sephora
Barnes & Noble
PetSmart
Nordstrom
IKEA
Walgreens
Sam’s Club
Bed Bath & Beyond
Petco
Aldi
2018 2017 BRAND PERFORMANCE
Retailers (multichannel)
For Customer experienCe proFessionals
The US Customer Experience Index, 2018June 19, 2018
© 2018 Forrester research, inc. unauthorized copying or distributing is a violation of copyright law. [email protected] or +1 866-367-7378
25
How Brands Build Loyalty With The Quality Of Their Experience
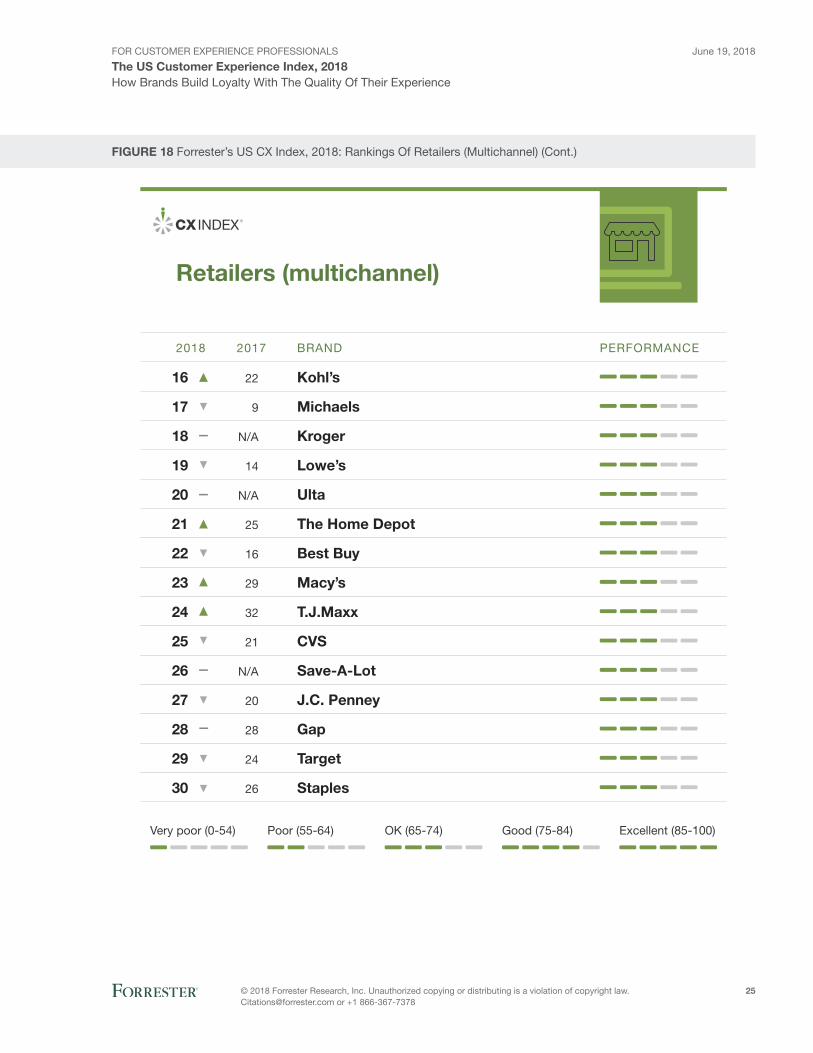
fIGUrE 18 Forrester’s US CX Index, 2018: Rankings Of Retailers (Multichannel) (Cont.)
Very poor (0-54) Excellent (85-100)Good (75-84)OK (65-74)Poor (55-64)
16
17
18
19
20
21
22
23
24
25
26
27
28
29
30
22
9
N/A
14
N/A
25
16
29
32
21
N/A
20
28
24
26
Kohl’s
Michaels
Kroger
Lowe’s
Ulta
The Home Depot
Best Buy
Macy’s
T.J.Maxx
CVS
Save-A-Lot
J.C. Penney
Gap
Target
Staples
2018 2017 BRAND PERFORMANCE
Retailers (multichannel)
For Customer experienCe proFessionals
The US Customer Experience Index, 2018June 19, 2018
© 2018 Forrester research, inc. unauthorized copying or distributing is a violation of copyright law. [email protected] or +1 866-367-7378
26
How Brands Build Loyalty With The Quality Of Their Experience
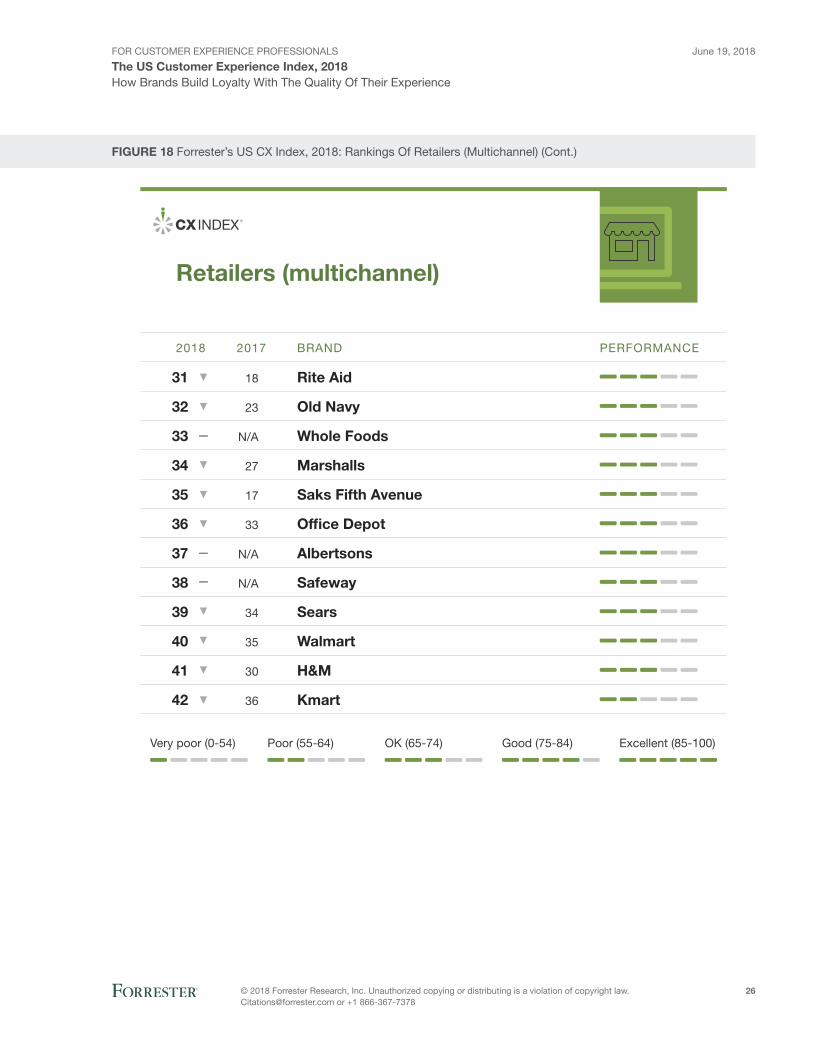
fIGUrE 18 Forrester’s US CX Index, 2018: Rankings Of Retailers (Multichannel) (Cont.)
Very poor (0-54) Excellent (85-100)Good (75-84)OK (65-74)Poor (55-64)
31
32
33
34
35
36
37
38
39
40
41
42
18
23
N/A
27
17
33
N/A
N/A
34
35
30
36
Rite Aid
Old Navy
Whole Foods
Marshalls
Saks Fifth Avenue
Office Depot
Albertsons
Safeway
Sears
Walmart
H&M
Kmart
2018 2017 BRAND PERFORMANCE
Retailers (multichannel)
For Customer experienCe proFessionals
The US Customer Experience Index, 2018June 19, 2018
© 2018 Forrester research, inc. unauthorized copying or distributing is a violation of copyright law. [email protected] or +1 866-367-7378
27
How Brands Build Loyalty With The Quality Of Their Experience
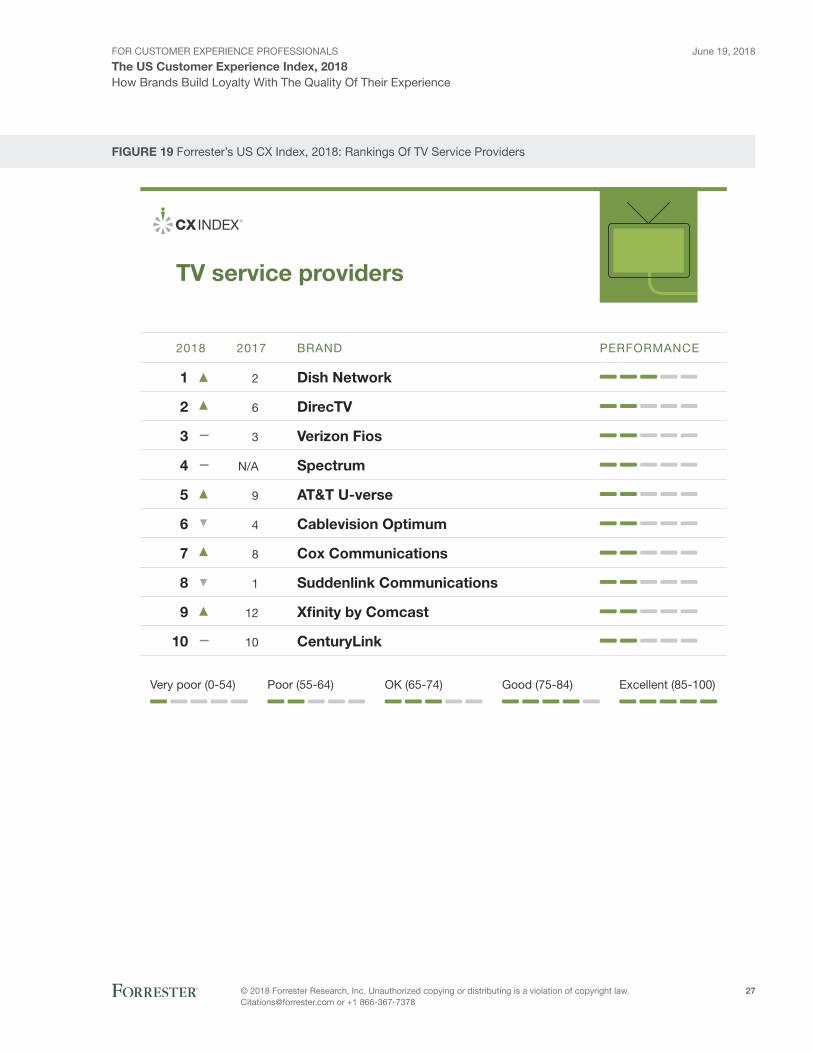
fIGUrE 19 Forrester’s US CX Index, 2018: Rankings Of TV Service Providers
Very poor (0-54) Excellent (85-100)Good (75-84)OK (65-74)Poor (55-64)
1
2
3
4
5
6
7
8
9
10
2
6
3
N/A
9
4
8
1
12
10
Dish Network
DirecTV
Verizon Fios
Spectrum
AT&T U-verse
Cablevision Optimum
Cox Communications
Suddenlink Communications
X�nity by Comcast
CenturyLink
2018 2017 BRAND PERFORMANCE
TV service providers
For Customer experienCe proFessionals
The US Customer Experience Index, 2018June 19, 2018
© 2018 Forrester research, inc. unauthorized copying or distributing is a violation of copyright law. [email protected] or +1 866-367-7378
28
How Brands Build Loyalty With The Quality Of Their Experience
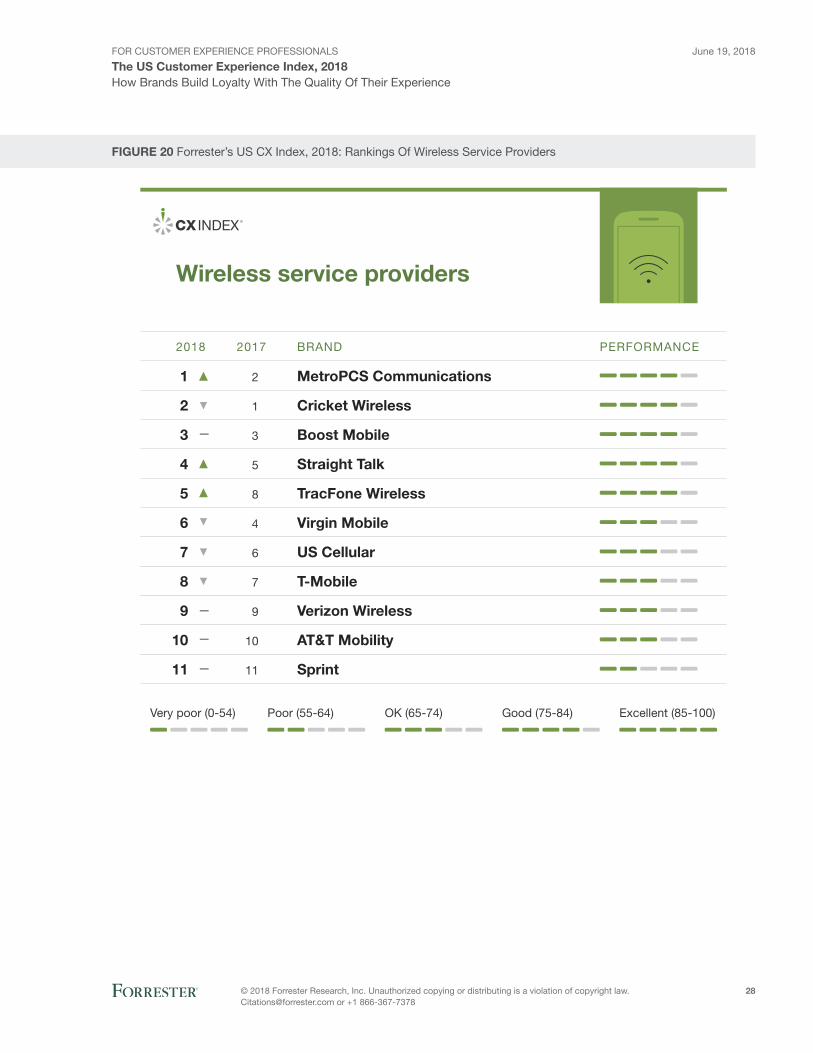
fIGUrE 20 Forrester’s US CX Index, 2018: Rankings Of Wireless Service Providers
Very poor (0-54) Excellent (85-100)Good (75-84)OK (65-74)Poor (55-64)
1
2
3
4
5
6
7
8
9
10
11
2
1
3
5
8
4
6
7
9
10
11
MetroPCS Communications
Cricket Wireless
Boost Mobile
Straight Talk
TracFone Wireless
Virgin Mobile
US Cellular
T-Mobile
Verizon Wireless
AT&T Mobility
Sprint
2018 2017 BRAND PERFORMANCE
Wireless service providers
For Customer experienCe proFessionals
The US Customer Experience Index, 2018June 19, 2018
© 2018 Forrester research, inc. unauthorized copying or distributing is a violation of copyright law. [email protected] or +1 866-367-7378
29
How Brands Build Loyalty With The Quality Of Their Experience
fIGUrE 21 The Distribution Of US CX Index Scores, 2017 And 2018
Very poor Poor OK Good Excellent
2% 2%
23% 21%
62%59%
16% 15%
0% 0%
20172018
Base: 110,828 US online consumers (18+) who interacted with a speci�c brand within the past 12 months
Source: Forrester Analytics Customer Experience Index Online Survey, US Consumers 2018
For Customer experienCe proFessionals
The US Customer Experience Index, 2018June 19, 2018
© 2018 Forrester research, inc. unauthorized copying or distributing is a violation of copyright law. [email protected] or +1 866-367-7378
30
How Brands Build Loyalty With The Quality Of Their Experience
fIGUrE 22 The Distribution Of Industry Scores In Forrester’s US CX Index, 2018
Base: 110,828 US online consumers (18+) who interacted with a specific brand within the past 12 months
Source: Forrester Analytics Customer Experience Index Online Survey, US Consumers 2018
Very poor Poor OK Good Excellent
2018 industry average Highest scoreLowest score
0 10 20 30 40 50 60 70 80 90 100
Banks (multichannel)
Auto manufacturers (luxury)
Banks (direct)
Retailers (digital)
Wireless service providers
Auto manufacturers (mass market)
Auto/home insurers
Brokerages (multichannel)
Credit card issuers
OTT providers
Brokerages (direct)
Hotels
Retailers (multichannel)
Rental cars
Health insurers
Airlines
TV service providers
Federal government
Internet service providers
For Customer experienCe proFessionals
The US Customer Experience Index, 2018June 19, 2018
© 2018 Forrester research, inc. unauthorized copying or distributing is a violation of copyright law. [email protected] or +1 866-367-7378
31
How Brands Build Loyalty With The Quality Of Their Experience
fIGUrE 22 The Distribution Of Industry Scores In Forrester’s US CX Index, 2018 (Cont.)
Base: 110,828 US online consumers (18+) who interacted with a speci�c brand within the past 12 months
Source: Forrester Analytics Customer Experience Index Online Survey, US Consumers 2018
Very poor Poor OK Good Excellent
0 10 20 30 40 50 60 70 80 90 100
Banks (multichannel)
Auto manufacturers (luxury)
Banks (direct)
Retailers (digital)
Wireless service providers
Auto manufacturers (mass market)
Auto/home insurers
Brokerages (multichannel)
Credit card issuers
OTT providers
Brokerages (direct)
Hotels
Retailers (multichannel)
Rental cars
Health insurers
Airlines
TV service providers
Federal government
Internet service providers
= 2018 industry average = 2017 industry average = Signi�cant change
For Customer experienCe proFessionals
The US Customer Experience Index, 2018June 19, 2018
© 2018 Forrester research, inc. unauthorized copying or distributing is a violation of copyright law. [email protected] or +1 866-367-7378
32
How Brands Build Loyalty With The Quality Of Their Experience
Torpor At The Top Means There Are No Real CX Leaders
Not a single brand has managed to rise to the top of our rankings and continue to move upward — the mark of a true CX leader. Instead:
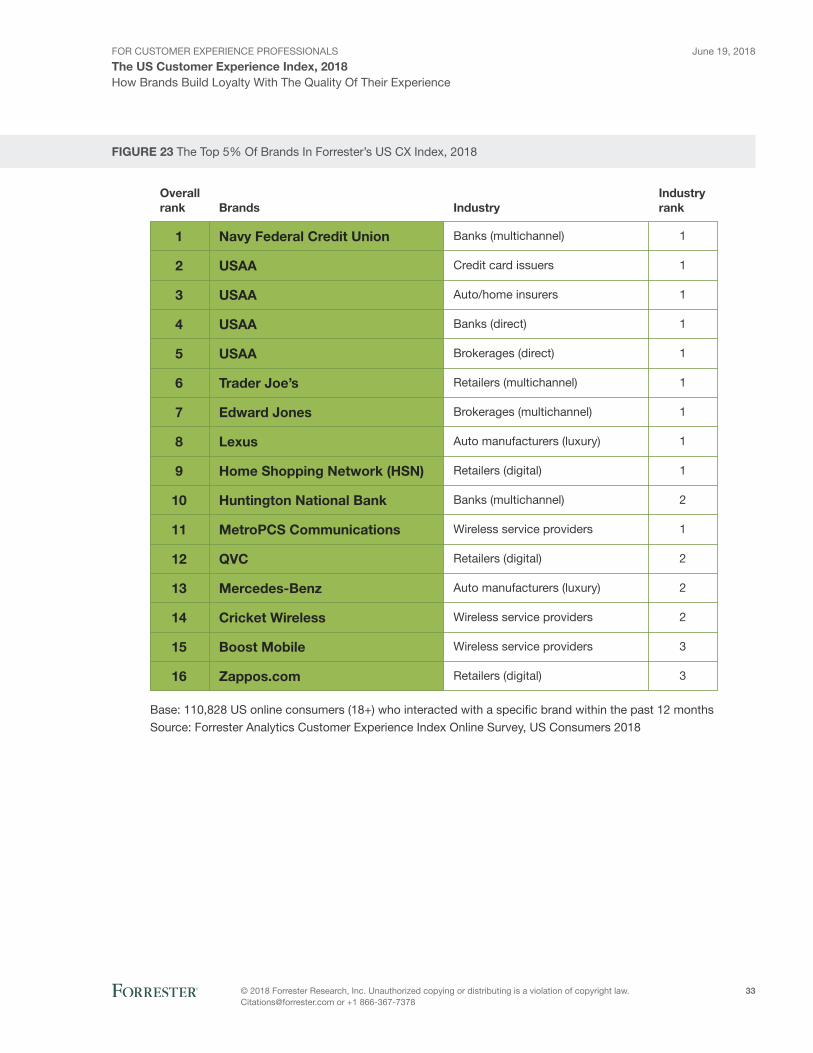
› Elite brands’ scores remained static. We refer to the top 5% of brands across all industries in the CX Index as the “elite brands” (see Figure 23). Of the 15 elite brands that were in the CX Index last year, 12 showed no statistically significant score change.4 In fact, of the 11 elites that were repeats from 2017, only USAA’s direct banking business displayed any change — a small drop that reverses a gain it made last year. Additionally, three of the five new elite brands had no score change and achieved their status only because some of 2017’s elites dropped out, leaving room for new entrants.5 Only Huntington National Bank rose into its slot, thanks to a modest point gain that nearly erased last year’s decline.
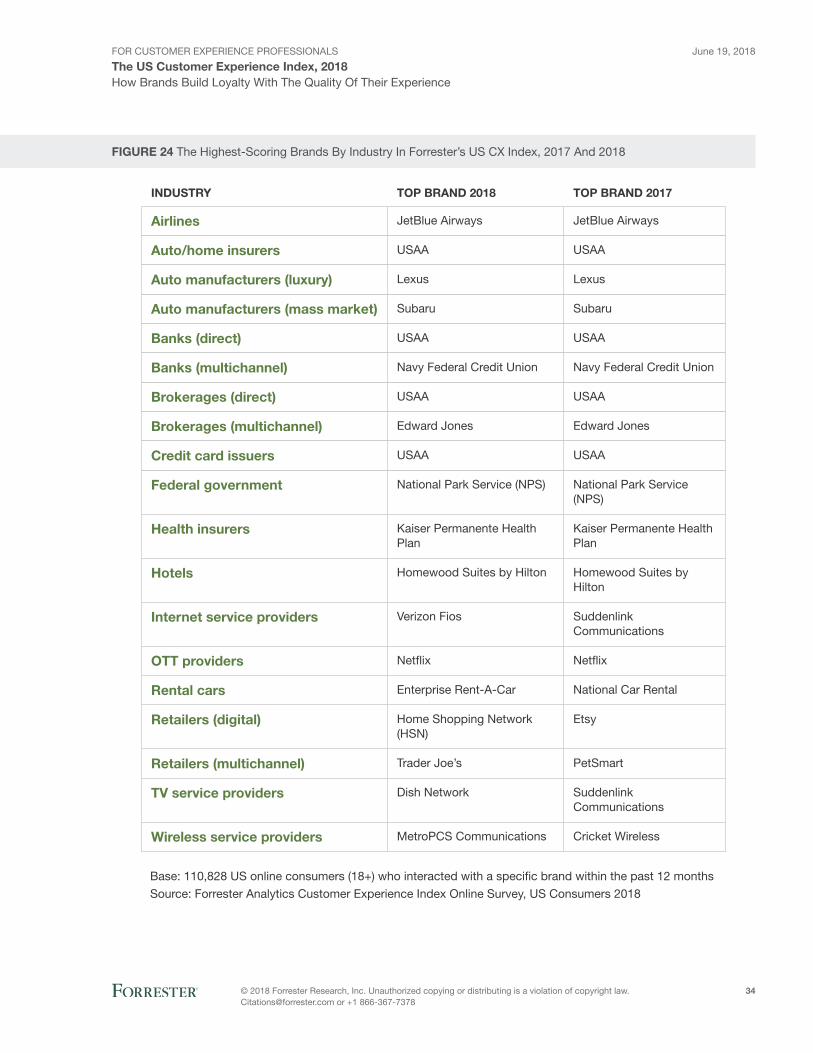
› most industry frontrunners were repeats; all were stagnant. Thirteen of 19 industry frontrunners were repeats from 2017 (see Figure 24). In three of the six industries with new top brands — the digital retail, wireless service provider, and rental car industries — neither the old nor new frontrunners showed statistically significant score changes. The new top brands in these industries earned their spots due only to tiny score variations, not any real change in CX quality. The new top brands in the ISP and TV service provider industries were stagnant, too. They achieved frontrunner status because the 2017 leader — which was Suddenlink Communications in both industries — suffered larger-than-average declines. Last year’s frontrunner in the multichannel retail industry, PetSmart, also remained stable: It lost its first-place status because Trader Joe’s debuted in our study with a higher score and then dropped several more places due to small changes in other brands’ scores — all but one statistically insignificant.
For Customer experienCe proFessionals
The US Customer Experience Index, 2018June 19, 2018
© 2018 Forrester research, inc. unauthorized copying or distributing is a violation of copyright law. [email protected] or +1 866-367-7378
33
How Brands Build Loyalty With The Quality Of Their Experience
fIGUrE 23 The Top 5% Of Brands In Forrester’s US CX Index, 2018
Brands IndustryOverallrank
Industryrank
Navy Federal Credit Union
USAA
USAA
USAA
USAA
Trader Joe’s
Edward Jones
Lexus
Home Shopping Network (HSN)
Huntington National Bank
MetroPCS Communications
QVC
Mercedes-Benz
Cricket Wireless
Boost Mobile
Zappos.com
Banks (multichannel)
Credit card issuers
Auto/home insurers
Banks (direct)
Brokerages (direct)
Retailers (multichannel)
Brokerages (multichannel)
Auto manufacturers (luxury)
Retailers (digital)
Banks (multichannel)
Wireless service providers
Retailers (digital)
Auto manufacturers (luxury)
Wireless service providers
Wireless service providers
Retailers (digital)
1
2
3
4
5
6
7
8
9
10
11
12
13
14
15
16
1
1
1
1
1
1
1
1
1
2
1
2
2
2
3
3
Base: 110,828 US online consumers (18+) who interacted with a specific brand within the past 12 months
Source: Forrester Analytics Customer Experience Index Online Survey, US Consumers 2018
For Customer experienCe proFessionals
The US Customer Experience Index, 2018June 19, 2018
© 2018 Forrester research, inc. unauthorized copying or distributing is a violation of copyright law. [email protected] or +1 866-367-7378
34
How Brands Build Loyalty With The Quality Of Their Experience
fIGUrE 24 The Highest-Scoring Brands By Industry In Forrester’s US CX Index, 2017 And 2018
Base: 110,828 US online consumers (18+) who interacted with a specific brand within the past 12 months
Source: Forrester Analytics Customer Experience Index Online Survey, US Consumers 2018
TOP BRAND 2017INDUSTRY
Airlines
Auto/home insurers
Auto manufacturers (luxury)
Auto manufacturers (mass market)
Banks (direct)
Banks (multichannel)
Brokerages (direct)
Brokerages (multichannel)
Credit card issuers
Federal government
Health insurers
Hotels
Internet service providers
OTT providers
Rental cars
Retailers (digital)
Retailers (multichannel)
TV service providers
Wireless service providers
JetBlue Airways
USAA
Lexus
Subaru
USAA
Navy Federal Credit Union
USAA
Edward Jones
USAA
National Park Service (NPS)
Kaiser Permanente Health Plan
Homewood Suites by Hilton
Suddenlink Communications
Netflix
National Car Rental
Etsy
PetSmart
SuddenlinkCommunications
Cricket Wireless
TOP BRAND 2018
JetBlue Airways
USAA
Lexus
Subaru
USAA
Navy Federal Credit Union
USAA
Edward Jones
USAA
National Park Service (NPS)
Kaiser Permanente Health Plan
Homewood Suites by Hilton
Verizon Fios
Netflix
Enterprise Rent-A-Car
Home Shopping Network (HSN)
Trader Joe’s
Dish Network
MetroPCS Communications

For Customer experienCe proFessionals
The US Customer Experience Index, 2018June 19, 2018
© 2018 Forrester research, inc. unauthorized copying or distributing is a violation of copyright law. [email protected] or +1 866-367-7378
35
How Brands Build Loyalty With The Quality Of Their Experience
Without real Leaders, Only four Types Of Brands remain
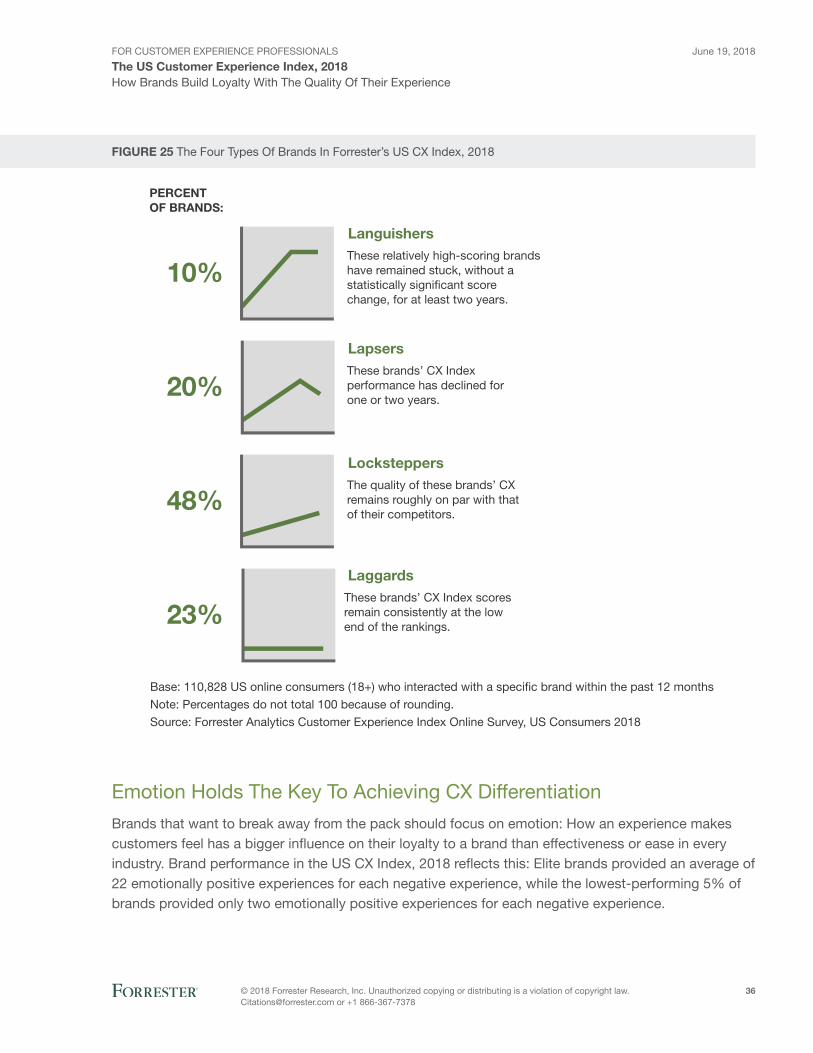
In the absence of real leaders that rise to the top of the pack and continue to improve, there are only four types of brands (see Figure 25).
› Languishers: brands that rose high and then stalled. These relatively high-scoring brands have remained stuck, without a statistically significant score change, for at least two years. Overall, 10% of brands in the entire US CX Index are languishers — as are 10 of the 16 CX Index elite brands and 10 of the 19 industry frontrunners. A full 45% of wireless service providers are languishers, giving that industry the highest percentage of brands in this category.
› Lapsers: brands that rose and then fell back. Lapsers’ CX Index performance has declined for one or two years. Across the entire US CX Index, 20% of brands are lapsers — among them are two elite brands and two industry frontrunners. Among digital retailers, 45% of brands are lapsers, making that the industry with the highest percentage of lapsers.
› Locksteppers: brands that move up and down with the pack. Even when these brands improve, they fail to differentiate themselves because the quality of their CX remains roughly on par with that of their competitors. A full 48% of CX Index brands are locksteppers, including three elite brands, four industry frontrunners, and all six over-the-top (OTT) service providers. And a huge 93% of mass-market auto manufacturers are locksteppers, giving this industry the least differentiation among brands outside the OTT service provider industry.
› Laggards: brands that have stayed at or near the bottom. Although some laggards have improved the quality of their CX, their scores remain consistently at the low end of the rankings. Overall, 23% of CX Index brands, two industry frontrunners, and 80% of brands in the TV service provider industry are laggards.
For Customer experienCe proFessionals
The US Customer Experience Index, 2018June 19, 2018
© 2018 Forrester research, inc. unauthorized copying or distributing is a violation of copyright law. [email protected] or +1 866-367-7378
36
How Brands Build Loyalty With The Quality Of Their Experience
fIGUrE 25 The Four Types Of Brands In Forrester’s US CX Index, 2018
23%
These relatively high-scoring brands have remained stuck, without a statistically significant score change, for at least two years.
Languishers
These brands’ CX Index performance has declined for one or two years.
Lapsers
The quality of these brands’ CX remains roughly on par with that of their competitors.
Locksteppers
These brands’ CX Index scores remain consistently at the low end of the rankings.
Laggards
10%
20%
48%
PERCENTOF BRANDS:
Base: 110,828 US online consumers (18+) who interacted with a specific brand within the past 12 months
Note: Percentages do not total 100 because of rounding.
Source: Forrester Analytics Customer Experience Index Online Survey, US Consumers 2018
Emotion Holds The Key To Achieving CX Differentiation
Brands that want to break away from the pack should focus on emotion: How an experience makes customers feel has a bigger influence on their loyalty to a brand than effectiveness or ease in every industry. Brand performance in the US CX Index, 2018 reflects this: Elite brands provided an average of 22 emotionally positive experiences for each negative experience, while the lowest-performing 5% of brands provided only two emotionally positive experiences for each negative experience.
For Customer experienCe proFessionals
The US Customer Experience Index, 2018June 19, 2018
© 2018 Forrester research, inc. unauthorized copying or distributing is a violation of copyright law. [email protected] or +1 866-367-7378
37
How Brands Build Loyalty With The Quality Of Their Experience
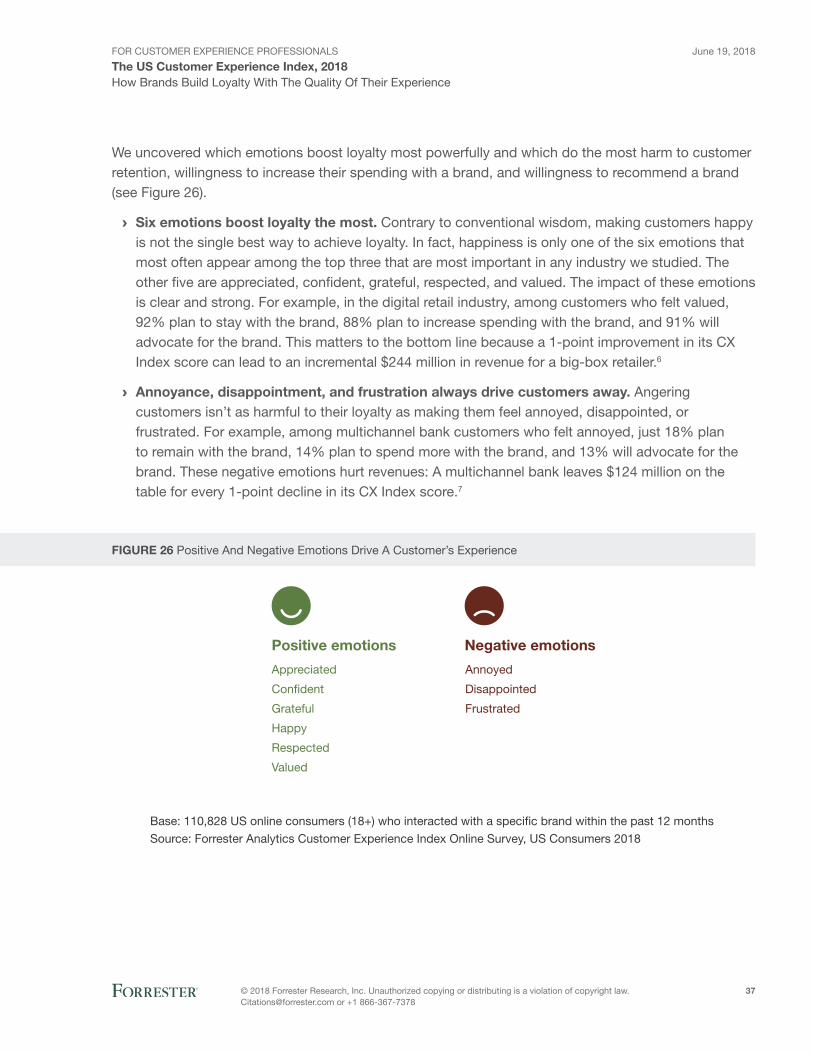
We uncovered which emotions boost loyalty most powerfully and which do the most harm to customer retention, willingness to increase their spending with a brand, and willingness to recommend a brand (see Figure 26).
› Six emotions boost loyalty the most. Contrary to conventional wisdom, making customers happy is not the single best way to achieve loyalty. In fact, happiness is only one of the six emotions that most often appear among the top three that are most important in any industry we studied. The other five are appreciated, confident, grateful, respected, and valued. The impact of these emotions is clear and strong. For example, in the digital retail industry, among customers who felt valued, 92% plan to stay with the brand, 88% plan to increase spending with the brand, and 91% will advocate for the brand. This matters to the bottom line because a 1-point improvement in its CX Index score can lead to an incremental $244 million in revenue for a big-box retailer.6
› Annoyance, disappointment, and frustration always drive customers away. Angering customers isn’t as harmful to their loyalty as making them feel annoyed, disappointed, or frustrated. For example, among multichannel bank customers who felt annoyed, just 18% plan to remain with the brand, 14% plan to spend more with the brand, and 13% will advocate for the brand. These negative emotions hurt revenues: A multichannel bank leaves $124 million on the table for every 1-point decline in its CX Index score.7
fIGUrE 26 Positive And Negative Emotions Drive A Customer’s Experience
Positive emotions
Appreciated
Con�dent
Grateful
Happy
Respected
Valued
Negative emotions
Annoyed
Disappointed
Frustrated
Base: 110,828 US online consumers (18+) who interacted with a speci�c brand within the past 12 months
Source: Forrester Analytics Customer Experience Index Online Survey, US Consumers 2018
For Customer experienCe proFessionals
The US Customer Experience Index, 2018June 19, 2018
© 2018 Forrester research, inc. unauthorized copying or distributing is a violation of copyright law. [email protected] or +1 866-367-7378
38
How Brands Build Loyalty With The Quality Of Their Experience
How Forrester Can Help
Even a minor improvement to a brand’s customer experience quality can add tens of millions of dollars of revenue by reducing customer churn and increasing share of wallet.8 What’s more, happier customers are more willing to pay a premium price for the same products and services.9 When you add in other benefits of superior CX — like reduced service costs and low-cost customer acquisition through word of mouth — the ROI of even small-scale CX transformations can be jaw-dropping.10 CX pros can earn these benefits for their brands via a disciplined approach to envisioning, designing, and delivering a consistently high-quality experience. Forrester can help you:
› Understand the drivers of great CX for your brand with CX Index data. Forrester collects CX Index data from over 200,000 consumers on almost 600 brands in 20 industries across seven markets: Australia, Canada, France, India, Singapore, the UK, and the US. Underlying data behind the CX Index can help brands identify the key drivers of a great CX for their customers. This allows you to focus on improving the aspects of experiences that matter most for driving revenue and avoid wasting time and money on those that don’t move the needle.
› Prove the rOI of CX transformation. To get the benefits of improved CX, companies need to invest in areas like training, technology, and professional services. Do the benefits of CX transformation outweigh the costs and result in a positive ROI? And how can you determine that for your company? Forrester analysts working in concert with our Total Economic Impact (TEI™) group can calculate the benefits, costs, and ROI of an enterprisewide CX transformation. You can use the resulting ROI model to fuel a winning business case for CX transformation.
› Partner with us to develop breakaway CX. Work with Forrester’s experts to create your customized road map to CX that drives top-line growth. We tailor our data, frameworks, and best-practice research to accelerate your success.
To learn more about how Forrester can help, contact your account manager or email us at [email protected].
For Customer experienCe proFessionals
The US Customer Experience Index, 2018June 19, 2018
© 2018 Forrester research, inc. unauthorized copying or distributing is a violation of copyright law. [email protected] or +1 866-367-7378
39
How Brands Build Loyalty With The Quality Of Their Experience
Supplemental Material
Survey methodology
Forrester conducted an online survey fielded in February through May 2018 of 110,828 US individuals ages 18 to 88. For results based on a randomly chosen sample of this size (N = 110,828), there is 95% confidence that the results have a statistical precision of plus or minus 0.01% of what they would be if the entire population of US adults who are online weekly or more often had been surveyed. The final data set was stacked by brand (287 US brands) and weighted by age, gender, region, income, and broadband adoption to represent 215,540 weighted respondents answering for all brands. (Note: Weighted sample sizes can be different from the actual number of respondents to account for individuals generally underrepresented in online panels.) Please note that respondents who participate in online surveys generally have more experience with the internet and feel more comfortable transacting online.
Engage With An Analyst
Gain greater confidence in your decisions by working with Forrester thought leaders to apply our research to your specific business and technology initiatives.
forrester’s research apps for iOS and Android.Stay ahead of your competition no matter where you are.
Analyst Inquiry
To help you put research into practice, connect with an analyst to discuss your questions in a 30-minute phone session — or opt for a response via email.
Learn more.
Analyst Advisory
Translate research into action by working with an analyst on a specific engagement in the form of custom strategy sessions, workshops, or speeches.
Learn more.
Webinar
Join our online sessions on the latest research affecting your business. Each call includes analyst Q&A and slides and is available on-demand.
Learn more.
For Customer experienCe proFessionals
The US Customer Experience Index, 2018June 19, 2018
© 2018 Forrester research, inc. unauthorized copying or distributing is a violation of copyright law. [email protected] or +1 866-367-7378
40
How Brands Build Loyalty With The Quality Of Their Experience
Bases: For each industry in 2018, the number of US online adults (18+) who interacted with a specific brand within the past 12 months is as follows: airlines: 8,450; auto and home insurers: 14,046; auto manufacturers (luxury): 5,493; auto manufacturers (mass market): 10,824; banks (direct): 7,421; banks (multichannel): 13,229; brokerages (direct): 9,088; brokerages (multichannel): 8,215; credit card issuers: 11,155; federal government agencies: 11,649; health insurers: 12,696; hotels: 26,218; internet service providers: 8,995; OTT providers: 4,605; rental cars: 7,701; retailers (digital): 8,148; retailers (multichannel): 31,620; TV service providers: 7,529; wireless service providers: 8,457.
For the Forrester Analytics Customer Experience Index Online Survey, US Consumers 2017, Forrester conducted an online survey fielded in February through May 2017 of 118,992 US individuals ages 18 to 88. For results based on a randomly chosen sample of this size (N = 118,992), there is 95% confidence that the results have a statistical precision of plus or minus 0.01% of what they would be if the entire population of US adults who are online weekly or more often had been surveyed. The final data set was stacked by brand (314 US brands) and weighted by age, gender, region, income, and broadband adoption to represent 234,889 weighted respondents answering for all brands.
Bases: For each industry in 2017, the number of US online adults (18+) who interacted with a specific brand within the past 12 months is as follows: airlines: 9,123; auto and home insurance providers: 14,097; auto manufacturers: 16,118; credit card providers: 11,137; digital-only retailers: 10,275; direct banks: 7,367; direct or discount brokerages: 8,786; full-service investment firms: 7,915; health insurance providers: 12,598; hotels: 25,860; internet service providers: 10,439; mobile device manufacturers: 9,167; OTT providers: 4,529; parcel shipping/delivery providers: 2,394; PC manufacturers: 7,757; rental car providers: 7,396; traditional retail banks: 13,345; traditional retailers (stores and digital): 27,236; TV service providers: 9,014; US federal government agencies: 11,665; wireless service providers: 8,673.
(Note: Weighted sample sizes can be different from the actual number of respondents to account for individuals generally underrepresented in online panels.) Please note that respondents who participate in online surveys generally have more experience with the internet and feel more comfortable transacting online.
How To Get Access To forrester’s CX Index Data Analysis And Insights
Forrester’s CX Index helps companies do three things. It: 1) arms you with a deep and actionable understanding of the quality of your customer experience; 2) provides competitive benchmark data so you know how you stack up against your peers; and 3) enables the ability to model which improvements will have the biggest impact on revenue and other key business metrics.
Forrester collects CX Index data on almost 600 brands in 20 industries across seven key markets (Australia, Canada, France, India, Singapore, the UK, and the US). If you wish to find out more regarding Forrester’s CX Index data and services or how you can leverage the methodology, please contact your account manager or email [email protected].
For Customer experienCe proFessionals
The US Customer Experience Index, 2018June 19, 2018
© 2018 Forrester research, inc. unauthorized copying or distributing is a violation of copyright law. [email protected] or +1 866-367-7378
41
How Brands Build Loyalty With The Quality Of Their Experience
External citations, unauthorized reproduction, and distribution of any parts of this report are prohibited without prior written consent from Forrester.
Endnotes1 See the Forrester report “Improving CX Through Business Discipline Drives Growth.”
2 In 2018, we added and removed some brands from our rankings. The net result of these changes was four additional brands in the OK category and one additional brand in the good category. This contributed to, but does not fully explain, the shift toward the middle, which was primarily caused by score changes.
3 In 2018, we divided the automotive industry into luxury auto and mass-market auto, turning it into two industries to better reflect their competitive dynamics. We also dropped the PC manufacturer and parcel shipping/delivery provider industries. In order to get a true year-over-year comparison between the 2017 and 2018 industry rankings, we cut the 2017 automotive data into the current two groupings, eliminated the dropped industries, and created a new (albeit retroactive) order for 2017.
4 One of the new elite brands, Trader Joe’s, is new to the CX Index for 2018.
5 The brands that held elite status in 2017 but lost it this year are Homewood Suites By Hilton, Regions Bank, Etsy, The Hartford, BB&T, and The Vanguard Group. However, only BB&T saw a statistically significant point loss.
6 Forrester used data from its CX Index methodology to model how changes in customer experience affect revenue potential for 13 industries. The models take into account industry-specific dynamics like barriers to switching and recommendation effectiveness. See the Forrester report “The ROI Of CX Transformation.”
7 See the Forrester report “The ROI Of CX Transformation.”
8 See the Forrester report “Drive Revenue With Great Customer Experience, 2017.”
9 Our models showed that improving CX indirectly drives willingness to pay by increasing brand preference and trust. Other factors like elements of the price experience, exceeding customers’ expectations, membership in a loyalty program, and willingness to forgive also influence willingness to pay a premium. See the Forrester report “The Price Premium Of Customer Experience.”
10 See the Forrester report “The ROI Of CX Transformation.”
We work with business and technology leaders to develop customer-obsessed strategies that drive growth.
Products and services
› core research and tools › data and analytics › Peer collaboration › analyst engagement › consulting › events
Forrester research (nasdaq: Forr) is one of the most influential research and advisory firms in the world. We work with business and technology leaders to develop customer-obsessed strategies that drive growth. through proprietary research, data, custom consulting, exclusive executive peer groups, and events, the Forrester experience is about a singular and powerful purpose: to challenge the thinking of our clients to help them lead change in their organizations. For more information, visit forrester.com.
client suPPort
For information on hard-copy or electronic reprints, please contact client support at +1 866-367-7378, +1 617-613-5730, or [email protected]. We offer quantity discounts and special pricing for academic and nonprofit institutions.
Forrester’s research and insights are tailored to your role and critical business initiatives.
roles We serve
Marketing & Strategy ProfessionalscMoB2B MarketingB2c Marketing
› customer experiencecustomer insightseBusiness & channel strategy
Technology Management Professionalscioapplication development & deliveryenterprise architectureinfrastructure & operationssecurity & risksourcing & vendor Management
Technology Industry Professionalsanalyst relations
142377
© 2018 Forrester Research, Inc. All rights reserved. Forrester and CX Index™ are registered trademarks of Forrester Research, Inc. FORRESTER.COM
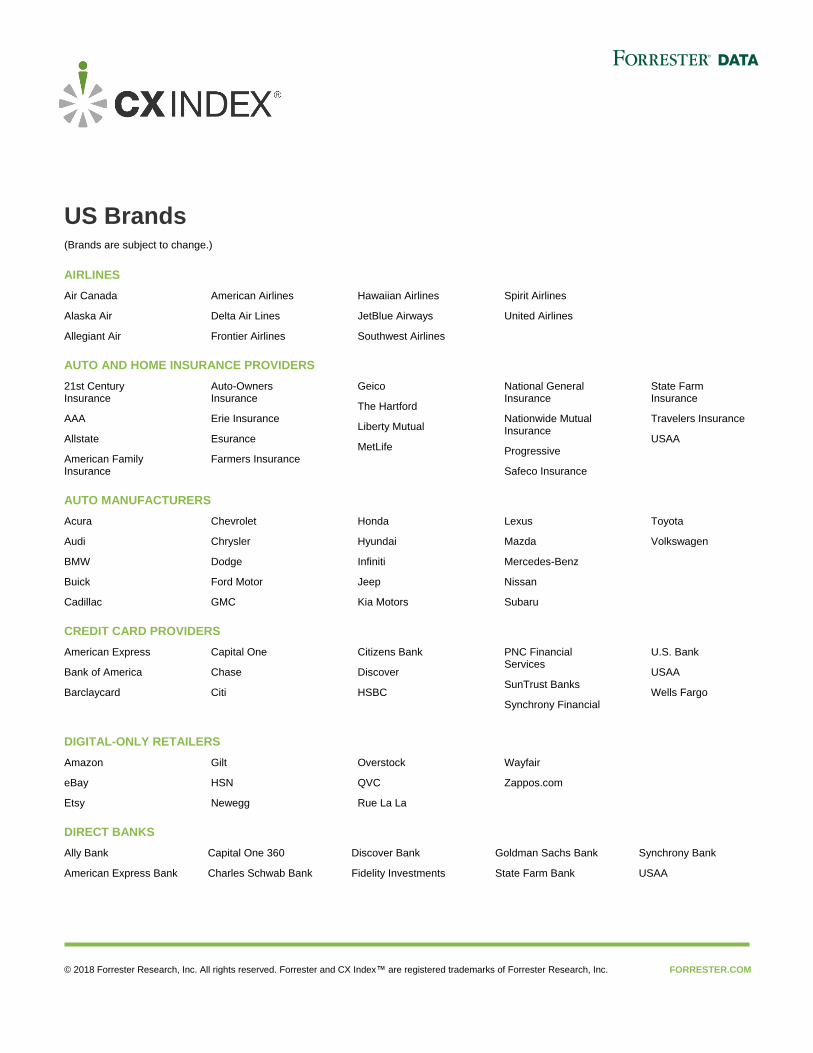
US Brands (Brands are subject to change.)
AIRLINES
Air Canada
Alaska Air
Allegiant Air
American Airlines
Delta Air Lines
Frontier Airlines
Hawaiian Airlines
JetBlue Airways
Southwest Airlines
Spirit Airlines
United Airlines
AUTO AND HOME INSURANCE PROVIDERS
21st Century Insurance
AAA
Allstate
American Family Insurance
Auto-Owners Insurance
Erie Insurance
Esurance
Farmers Insurance
Geico
The Hartford
Liberty Mutual
MetLife
National General Insurance
Nationwide Mutual Insurance
Progressive
Safeco Insurance
State Farm Insurance
Travelers Insurance
USAA
AUTO MANUFACTURERS
Acura
Audi
BMW
Buick
Cadillac
Chevrolet
Chrysler
Dodge
Ford Motor
GMC
Honda
Hyundai
Infiniti
Jeep
Kia Motors
Lexus
Mazda
Mercedes-Benz
Nissan
Subaru
Toyota
Volkswagen
CREDIT CARD PROVIDERS
American Express
Bank of America
Barclaycard
Capital One
Chase
Citi
Citizens Bank
Discover
HSBC
PNC Financial Services
SunTrust Banks
Synchrony Financial
U.S. Bank
USAA
Wells Fargo
DIGITAL-ONLY RETAILERS
Amazon
eBay
Etsy
Gilt
HSN
Newegg
Overstock
QVC
Rue La La
Wayfair
Zappos.com
DIRECT BANKS
Ally Bank Capital One 360 Discover Bank Goldman Sachs Bank Synchrony Bank
American Express Bank Charles Schwab Bank Fidelity Investments State Farm Bank USAA
2
© 2017 Forrester Research, Inc. All rights reserved. Forrester and CX Index are registered trademarks of Forrester Research, Inc. FORRESTER.COM
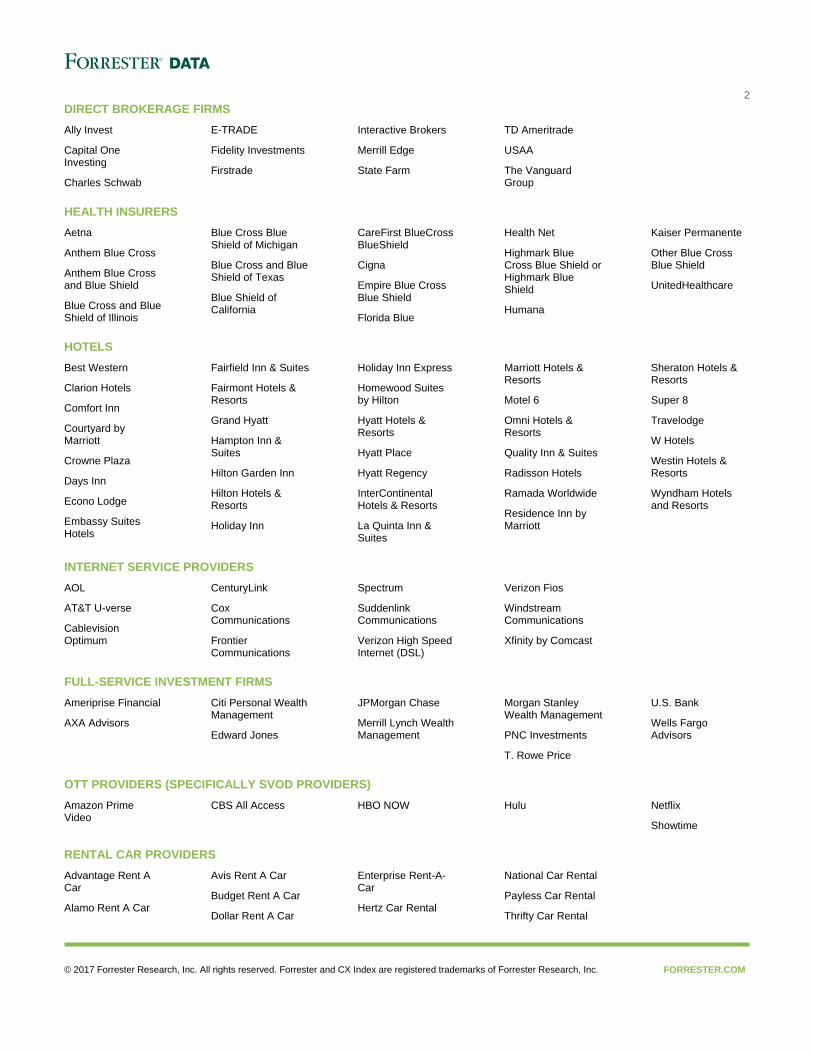
DIRECT BROKERAGE FIRMS
Ally Invest
Capital One Investing
Charles Schwab
E-TRADE
Fidelity Investments
Firstrade
Interactive Brokers
Merrill Edge
State Farm
TD Ameritrade
USAA
The Vanguard Group
HEALTH INSURERS
Aetna
Anthem Blue Cross
Anthem Blue Cross and Blue Shield
Blue Cross and Blue Shield of Illinois
Blue Cross Blue Shield of Michigan
Blue Cross and Blue Shield of Texas
Blue Shield of California
CareFirst BlueCross BlueShield
Cigna
Empire Blue Cross Blue Shield
Florida Blue
Health Net
Highmark Blue Cross Blue Shield or Highmark Blue Shield
Humana
Kaiser Permanente
Other Blue Cross Blue Shield
UnitedHealthcare
HOTELS
Best Western
Clarion Hotels
Comfort Inn
Courtyard by Marriott
Crowne Plaza
Days Inn
Econo Lodge
Embassy Suites Hotels
Fairfield Inn & Suites
Fairmont Hotels & Resorts
Grand Hyatt
Hampton Inn & Suites
Hilton Garden Inn
Hilton Hotels & Resorts
Holiday Inn
Holiday Inn Express
Homewood Suites by Hilton
Hyatt Hotels & Resorts
Hyatt Place
Hyatt Regency
InterContinental Hotels & Resorts
La Quinta Inn & Suites
Marriott Hotels & Resorts
Motel 6
Omni Hotels & Resorts
Quality Inn & Suites
Radisson Hotels
Ramada Worldwide
Residence Inn by Marriott
Sheraton Hotels & Resorts
Super 8
Travelodge
W Hotels
Westin Hotels & Resorts
Wyndham Hotels and Resorts
INTERNET SERVICE PROVIDERS
AOL
AT&T U-verse
Cablevision Optimum
CenturyLink
Cox Communications
Frontier Communications
Spectrum
Suddenlink Communications
Verizon High Speed Internet (DSL)
Verizon Fios
Windstream Communications
Xfinity by Comcast
FULL-SERVICE INVESTMENT FIRMS
Ameriprise Financial
AXA Advisors
Citi Personal Wealth Management
Edward Jones
JPMorgan Chase
Merrill Lynch Wealth Management
Morgan Stanley Wealth Management
PNC Investments
T. Rowe Price
U.S. Bank
Wells Fargo Advisors
OTT PROVIDERS (SPECIFICALLY SVOD PROVIDERS)
Amazon Prime Video
CBS All Access
HBO NOW
Hulu
Netflix
Showtime
RENTAL CAR PROVIDERS
Advantage Rent A Car
Alamo Rent A Car
Avis Rent A Car
Budget Rent A Car
Dollar Rent A Car
Enterprise Rent-A-Car
Hertz Car Rental
National Car Rental
Payless Car Rental
Thrifty Car Rental
3
© 2018 Forrester Research, Inc. All rights reserved. Forrester and CX Index™ are registered trademarks of Forrester Research, Inc. FORRESTER.COM
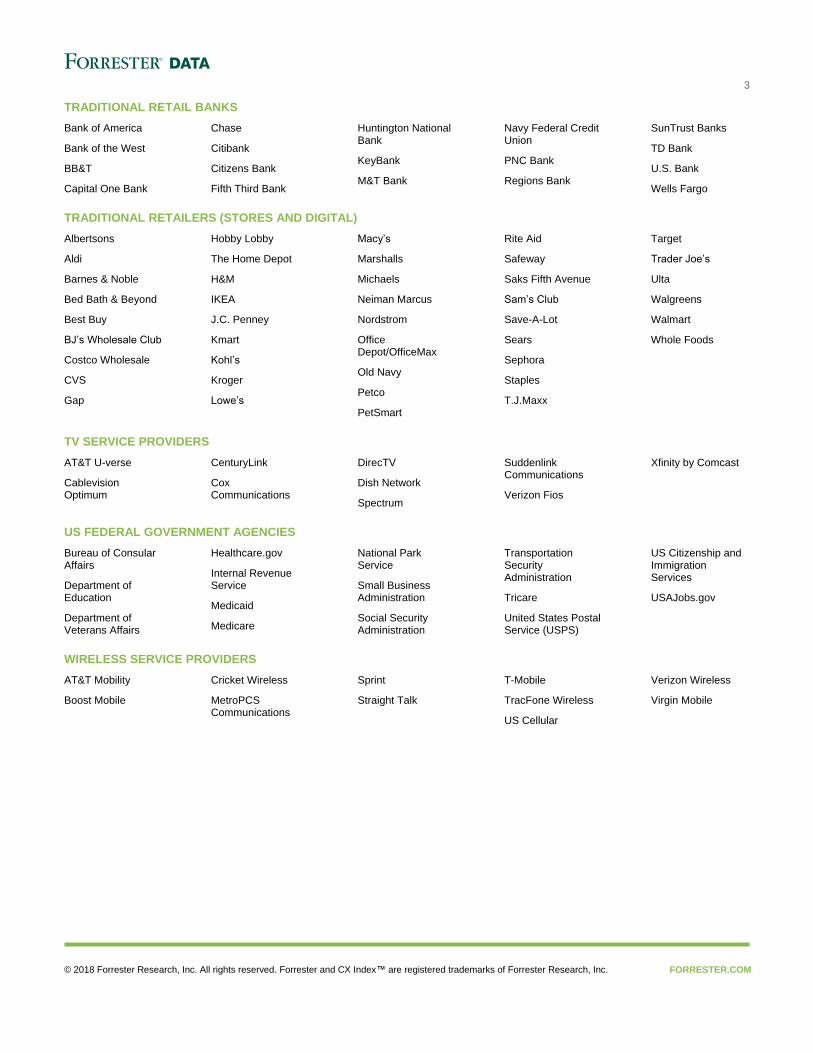
TRADITIONAL RETAIL BANKS
Bank of America
Bank of the West
BB&T
Capital One Bank
Chase
Citibank
Citizens Bank
Fifth Third Bank
Huntington National Bank
KeyBank
M&T Bank
Navy Federal Credit Union
PNC Bank
Regions Bank
SunTrust Banks
TD Bank
U.S. Bank
Wells Fargo
TRADITIONAL RETAILERS (STORES AND DIGITAL)
Albertsons
Aldi
Barnes & Noble
Bed Bath & Beyond
Best Buy
BJ’s Wholesale Club
Costco Wholesale
CVS
Gap
Hobby Lobby
The Home Depot
H&M
IKEA
J.C. Penney
Kmart
Kohl’s
Kroger
Lowe’s
Macy’s
Marshalls
Michaels
Neiman Marcus
Nordstrom
Office Depot/OfficeMax
Old Navy
Petco
PetSmart
Rite Aid
Safeway
Saks Fifth Avenue
Sam’s Club
Save-A-Lot
Sears
Sephora
Staples
T.J.Maxx
Target
Trader Joe’s
Ulta
Walgreens
Walmart
Whole Foods
TV SERVICE PROVIDERS
AT&T U-verse
Cablevision Optimum
CenturyLink
Cox Communications
DirecTV
Dish Network
Spectrum
Suddenlink Communications
Verizon Fios
Xfinity by Comcast
US FEDERAL GOVERNMENT AGENCIES
Bureau of Consular Affairs
Department of Education
Department of Veterans Affairs
Healthcare.gov
Internal Revenue Service
Medicaid
Medicare
National Park Service
Small Business Administration
Social Security Administration
Transportation Security Administration
Tricare
United States Postal Service (USPS)
US Citizenship and Immigration Services
USAJobs.gov
WIRELESS SERVICE PROVIDERS
AT&T Mobility
Boost Mobile
Cricket Wireless
MetroPCS Communications
Sprint
Straight Talk
T-Mobile
TracFone Wireless
US Cellular
Verizon Wireless
Virgin Mobile


