
The use of analytical tools to determine debt
management strategies National Treasury
Asset and Liability Management Division | 27 June 2013

Outline
• Core elements in designing debt management strategies
• South Africa’s analytical tools
• Public debt analytical tools
2
Core elements in designing debt
management strategies
3

Key steps in formulating a debt management
strategy
• Identify objectives for debt management and scope of the MTDS
• Identify cost and risk of the existing debt
• Identify potential funding sources
• Identify baseline projections and risks for key policy areas – fiscal,
monetary and market
• Review key longer-term structural factors and determine implications for
MTDS
• Identify the cost-risk trade-offs for alternative strategies, and rank their
performance
• Review implications of preferred strategy with fiscal and monetary policy
authorities, and for market conditions
• Submit recommendation and secure agreement on MTDS from decision
makers
4
Source: Developing a MTDS – Guidance Note for Country Authorities (World Bank, IMF, 2009)

Debt strategy and annual borrowing plan
Annual
Borrowing
Plan
Medium-term Debt
Management Strategy
Govt.
Budget
Govt. Cash
Flow Forecast
Market Conditions
& Demand Factors
Regular & Stable
Issuance Calendar
Benchmark
Bond Policy or
New Issuance
Macro-economic
coordination
Buyback/Switches
Other LM Opns
Cost-Risk
Consistency
Borrowing Mix
Integration of
Cash & Debt
Management
Risk Mitigation
Debt Market
Development
5

South Africa’s analytical tools
6

Macro-
economic
forecast
Model
Risk
benchmark
Funding strategy
Cash flows
Funding instruments
Budget deficit
Gross borrowing
requirement
Output
Extraordinary
receipts/
payments
Scenarios Risk
benchmarks Volume of debt
Debt service costs
Debt and debt-service cost forecasting model
Redemptions
7
Switches
(Exchanges)/
buy-backs
Current
portfolio

Management of refinancing risk
8
0
50
100
150
200
250
300
350
400
450
2013/2
014
2014/2
015
2015/2
016
2016/2
017
2017/2
018
2018/2
019
2019/2
020
2020/2
021
2021/2
022
2022/2
023
2023/2
024
2024/2
025
2025/2
026
2026/2
027
2027/2
028
2028/2
029
2029/2
030
2030/2
031
2031/2
032
2032/2
033
2033/2
034
2034/2
035
2035/2
036
2036/2
037
2037/2
038
2038/2
039
2039/2
040
2040/2
041
2041/2
042
2042/2
043
2043/2
044
2044/2
045
2045/2
046
2046/2
047
2047/2
048
2048/2
049
2049/2
050
2050/2
051
2051/2
052
R b
illi
on
FRB ILB Zeros Foreign T-Bills Smoothning (R39bn) 6%

9
3-year monthly forecast
Quality of cash management and forecasting is
important
Year 1 Year 2 Year 3
90-day daily forecasts (or longer if needed)
Lo
ng
-te
rm
Sh
ort
-te
rm
1 2 3 4 5 6 7 8 9 11 12 1 2 3 4 5 6 7 8 9 11 12 1 2 3 4 5 6 7 8 9 11 12
Year 1
1 2 3 4 5 6 7 8 9 11 12
Months
Months Months Months
1 - 90
Days
Rolling into year two
Current day firm forecasts (11:00 and 15:00)
3-year annual forecast
Current year rolling monthly forecast

Total net government debt
10
15
20
25
30
35
40
45
0
200
400
600
800
1,000
1,200
1,400
1,600
1,800
2,00020
00/0
1
2001
/02
2002
/03
2003
/04
2004
/05
2005
/06
2006
/07
2007
/08
2008
/09
2009
/10
2010
/11
2011
/12
2012
/13
2013
/14
2014
/15
2015
/16
R b
illi
on
Gross loan debt
Net loan debt
Total net debt as % of GDP (Right axis)
Per
cen
t o
f G
DP
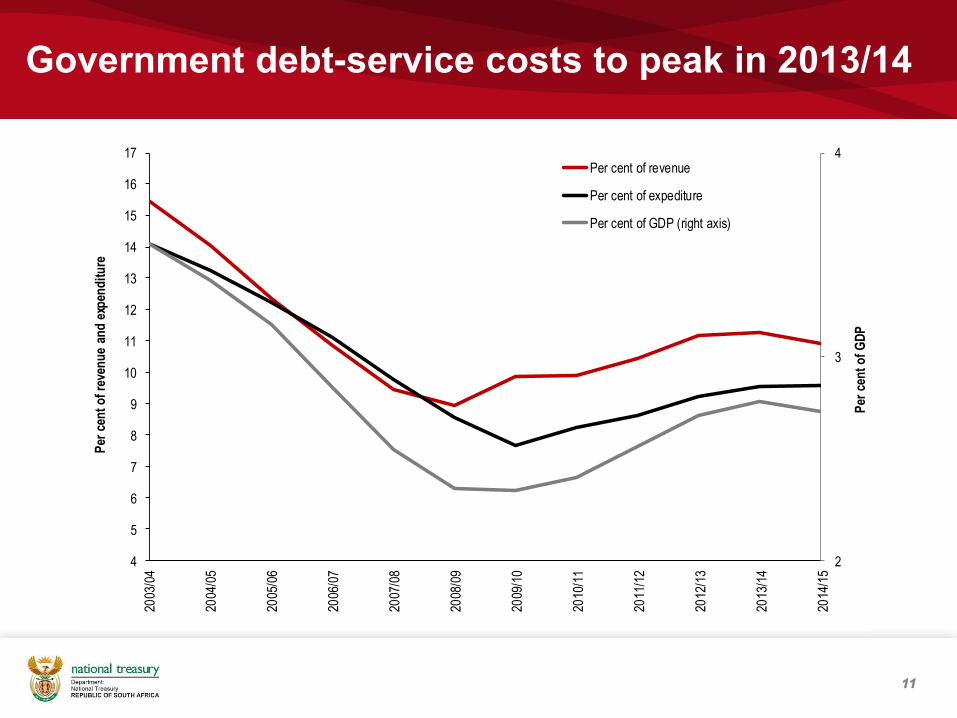
Government debt-service costs to peak in 2013/14
11
2
3
4
4
5
6
7
8
9
10
11
12
13
14
15
16
1720
03/0
4
2004
/05
2005
/06
2006
/07
2007
/08
2008
/09
2009
/10
2010
/11
2011
/12
2012
/13
2013
/14
2014
/15
Per cent of revenue
Per cent of expediture
Per cent of GDP (right axis)
Per
cen
t o
f re
ven
ue
and
exp
end
itu
re
Per
cen
t o
f G
DP

12
9.2%
Domestic Foreign
64.9%
35.1%
Fixed rate Non-fixed rate
Composition of the debt portfolio – 31 March 2013
90.8%

Managing contingency liabilities
13
RiskCalc
• Moody’s KMV analytical tool is used to determine the probability of default
by state-owned companies
• Models used indicators such as: profitability, leverage, debt coverage,
liquidity
• The model is used to managed the national government’s guarantee
exposure
CreditEdge
• The model is used to determine the National Treasury’s credit risk
exposure for investing surplus cash
• Model includes business and financial risk indicators

Net debt, provision and contingent liabilities
14
0
10
20
30
40
50
60
2006
/07
2007
/08
2008
/09
2009
/10
2010
/11
2011
/12
2012
/13
2013
/14
2014
/15
2015
/16
Per
cen
t o
f G
DP
Net debt Provisions Contingent liabilities Tolerance benchmark Net debt + Provisions + Contingent liabilities

Public Debt Analytical Tools
15

Available analytical tools
• Only few developing countries have a formal debt analytical tool
• Mostly build in-house
• MTDS “Toolkit” - IMF-World Bank
• DMFAS - UNCTAD
• Horizon - Commonwealth Secretariat
• Commercial software (CreditEdge/RiskCalc)
16

17
Analytical framework of Horizon: An overview
Source: Commonwealth Secretariat

Benefits of using Horizon by National Treasury
• Improving the formulation of our debt management strategy through an
explicit, transparent and audit trails on cost-risk analysis
• Use the yield curve across the term structure for better forecasting of cash
flows on future borrowings and valuation of debt
• Have the formulation and implementation of debt strategy in the same
system and framework for continuity and consistency
• Better integration of cash and debt management
• Improve portfolio analysis through more risk indicators
• Improve analytical reporting on debt management
• Improved monitoring of annual borrowing plan
18

Thank You
19


