The Use of Decision Trees for
Adaptive Item Selection and
Score Estimation
Barth B. Riley
Rodney Funk
Michael L. Dennis
Richard D. Lennox
Matthew Finkelman

Why Not Standard CAT?
• Not all measures or indices conform to an
IRT model, which is often the basis of CAT
• Example: network size
• IRT-based item banks are expensive to
develop and maintain, and require
specialized skills

Purpose
• Provide an overview of decision tree
methods
• Compare the use of decision tree
approaches to IRT-based CAT using
instruments consisting of dichotomous and
polytomous items.

Decision Trees
• A decision tree predicts membership on an
outcome based on one or more predictor variables.
• Predictors are used to partition the sample into
subsamples that are increasingly homogeneous on
the outcome.
• Each subsample is represented by a node in the
tree structure.
• The partitioning process is repeated until a
stopping rule is met

Decision Trees cont.
• Stopping criterion can be based on:
• Number of levels or depth of the tree
• A minimum sample size for a given node
• Terminal nodes (nodes at the lowest level of the tree)
• associated with an estimated probability of being in a particular category on the outcome variable
• in the case of interval-level outcomes, a mean value on that variable.
Partitioning Algorithms
• Regression trees
• Similar to ANOVA and discriminant analysis and generally used to predict a continuous outcome
• Nodes are divided into 2 sub nodes
• CHAID – chi-square automatic interaction detection
• Used to predict a categorical outcome
• Nodes can be divided into two or more sub nodes.

Health prob.
Family/friend
Fights w. boss,
coworkers
Divorce
Change in relation.
Death of
Family/Friend
Death of
Family/friend
Death of
Family/Friend
Fights w. boss
coworkers
Death of
Family/Friend
Death of
Family/friend
N Y
Y N Y N Y N
Example: Personal Sources of
Stress

Decision Tree Pros and Cons
• Pros
• Does not require assumptions of unidimensionality or
local independence
• Can handle item non-response more easily than CAT
• Less computationally intensive during administration
• Can incorporate demographic variables to control
“DIF”
• Cons
• Error propagation: A wrong decision (item) can lead to
all subsequent decisions being wrong as well.

Study
• Conducted post-hoc simulations comparing the relative efficiency, and precision of decision trees (using CHAID and CART) vs. IRT-based CAT.
• Measure: Global Appraisal of Individual Needs (GAIN) Substance Problem Scale (16 items)
• Past-year symptom count (SPSy)
• Recency of symptom scale (SPSr)

Data Source
• Data from 26,390 participants entering substance abuse treatment
• Dataset was split into two random samples
• The first sample was used for development of the decision-tree models and for IRT parameter estimation
• The second sample was used to compare CAT vs. decision-tree efficiency and precision.
• IRT model
• 2 parameter dichotomous model (SPSy)
• 2 parameter graded response model (SPSr)
Stop Rule Criterion
• Decision Trees
• Maximum number of levels (4-10)
• No nodes w. N < 100 and no new nodes created
w. a parent node of N < 200
• CAT
• Maximum number of items
• Standard error of measurement < .4475
(measure reliability = .80)

Procedures
• Decision-tree models were developed using SPSS (v. 19).
• Mplus (v. 6) was used to estimate IRT item parameters
• CAT simulations used maximum Fisher’s information and were performed using Firestar version 1.33
• Since the decision tree models were used to estimate raw scores, raw score equivalents of IRT measures were used for comparison.
Comparison Criteria
• Correlation w. Total Score (R)
• Efficiency (R2 x % items saved)
• Bias (Mean CAT/Tree vs. Mean Full)
• Root Mean Squared Error (RMSE)
difference between estimated and full scores
• Effect Size (Comparison between persons in
outpatient vs. residential treatment)

SPSy: Corr. With Total Score
0.9
0.91
0.92
0.93
0.94
0.95
0.96
0.97
0.98
4 5 6 7 8 9 10
Max. Number of Items
Co
rre
lati
on
CAT
CART
CHAID

SPSr: Corr. w. Total Score
0.87
0.88
0.89
0.9
0.91
0.92
0.93
0.94
0.95
0.96
4 5 6 7 8 9 10
Max. Number of Items
Co
rre
lati
on
CAT
CART
CHAID

SPSy: Efficiency
0
0.1
0.2
0.3
0.4
0.5
0.6
0.7
4 5 6 7 8 9 10
Max. Number of Items
Eff
icie
nc
y
CAT
CART
CHAID

SPSr: Efficiency
0
0.1
0.2
0.3
0.4
0.5
0.6
0.7
4 5 6 7 8 9 10
Max. Number of Items
Eff
icie
nc
y
CAT
CART
CHAID

SPSy: Measurement Bias
-0.12
-0.1
-0.08
-0.06
-0.04
-0.02
0
0.02
0.04
4 5 6 7 8 9 10
Max. Number of Items
Bia
s CAT
CART
CHAID

SPSr: Measurement Bias
-0.04
-0.02
0
0.02
0.04
0.06
0.08
0.1
4 5 6 7 8 9 10
Max. Number of Items
Bia
s CAT
CART
CHAID

SPSy: RMSE
0
0.2
0.4
0.6
0.8
1
1.2
1.4
1.6
1.8
2
4 5 6 7 8 9 10
Max. Number of Items
RM
SE CAT
CART
CHAID

SPSr: RMSE
0
1
2
3
4
5
6
4 5 6 7 8 9 10
Max. Number of Items
RM
SE CAT
CART
CHAID

SPSy: Effect Size
0.4
0.42
0.44
0.46
0.48
0.5
0.52
4 5 6 7 8 9 10
Max. Number of Items
Ab
so
lute
Eff
ec
t S
ize
CAT
CART
CHAID
All Items
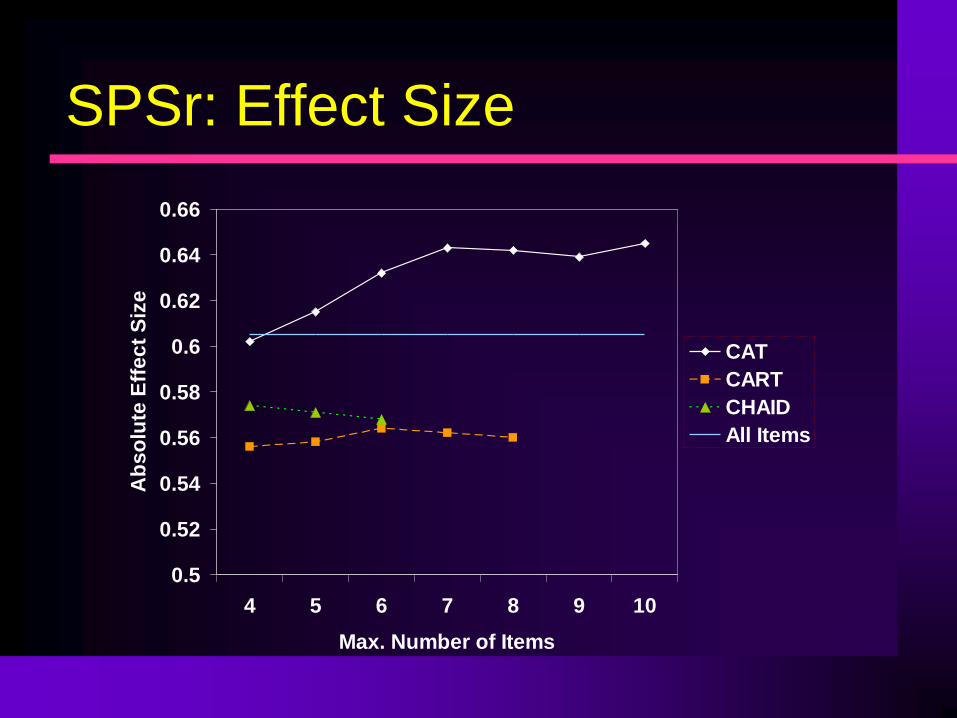
SPSr: Effect Size
0.5
0.52
0.54
0.56
0.58
0.6
0.62
0.64
0.66
4 5 6 7 8 9 10
Max. Number of Items
Ab
so
lute
Eff
ec
t S
ize
CAT
CART
CHAID
All Items

Conclusions
• Decision tree methods were more efficient than
CAT
• CART for dichotomous items (SPSy)
• CHAID for polytomous items (SPSr)
• Score bias was low in all conditions, particularly for
decision trees using dichotomous items
• In early stages of administration, decision trees
provided slightly higher correlations with the full
scale and lower RMSE values.
• But…

Conclusions
• CAT outperformed decision tree methods in
later stages of administration.
• CAT also outperformed decision trees with
respect to sensitivity to group differences as
measured by effect size.

CAT vs. Decision Trees
• CAT selects items based on two criteria:
• Item location relative to current estimate of theta
• Item discrimination
• Decision Trees select items that best discriminate between groups defined by the total score.
• CAT is optimal only when trait level is well estimated.
• Findings suggest that combining decision tree followed by CAT item selection may be advantageous.

Thank You!
For further information, contact:
Barth Riley -- [email protected]
For psychometric information on the Global
Appraisal of Individual Needs, go to: http://www.chestnut.org/li/gain/#GAIN%20Working%20Papers


