
The value of measuring and treating post-prandial hyperglycaemia – Evidence from
prospective studies
M. Hanefeld
Zentrum für Klinische Studien, GWT TU Dresden

Breakfast Lunch Dinner 0:00 4:00
Legend:
Postprandial state
Postabsorptive state
Fasting state
Monnier L. Eur J Clin Invest 2000;30(Suppl 2):3–11.
Most of our life we are spending in
the postprandial state
Breakfast
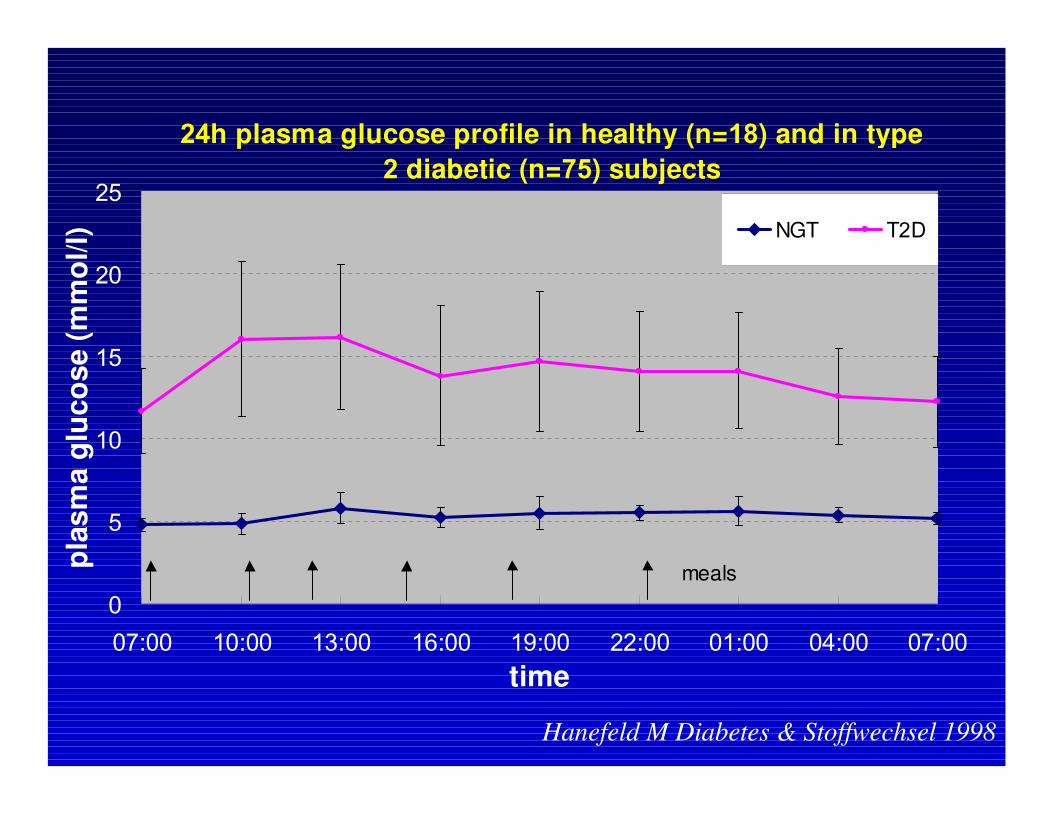
24h plasma glucose profile in healthy (n=18) and in type
2 diabetic (n=75) subjects
0
5
10
15
20
25
07:00 10:00 13:00 16:00 19:00 22:00 01:00 04:00 07:00
time
pla
sm
a g
luco
se (
mm
ol/l) NGT T2D
meals
Hanefeld M Diabetes & Stoffwechsel 1998
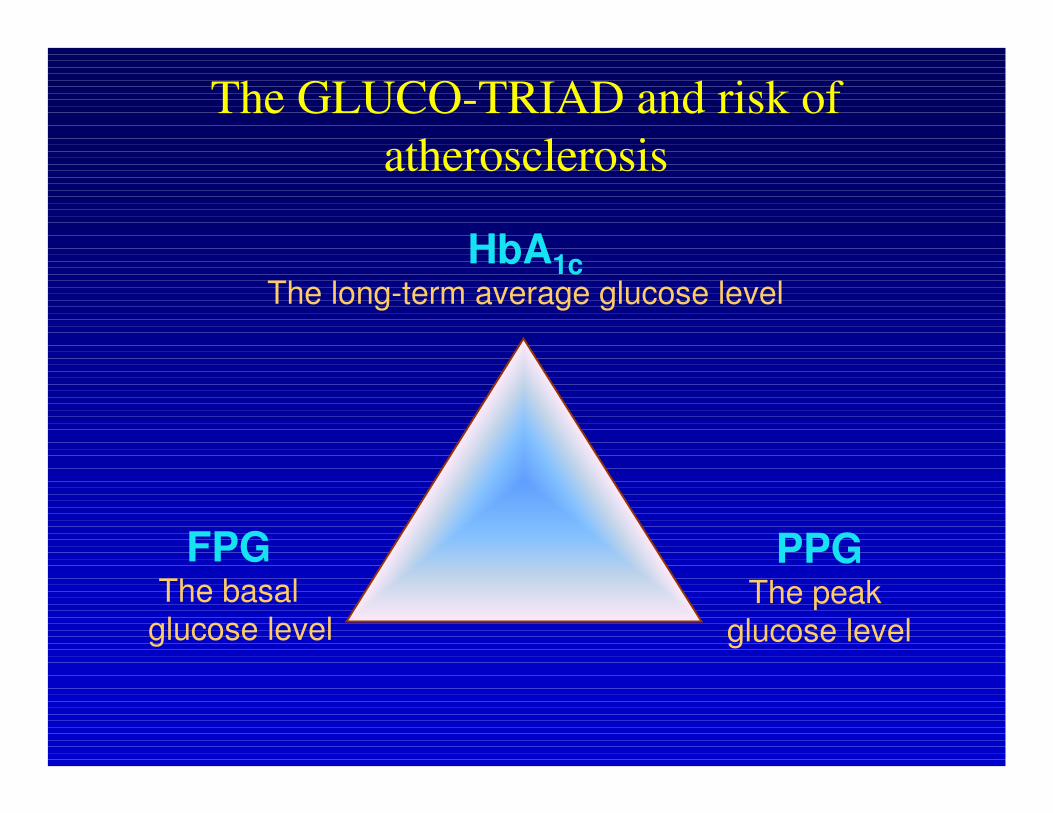
The GLUCO-TRIAD and risk of
atherosclerosis
FPG The basal
glucose level
PPGThe peak
glucose level
HbA1cThe long-term average glucose level
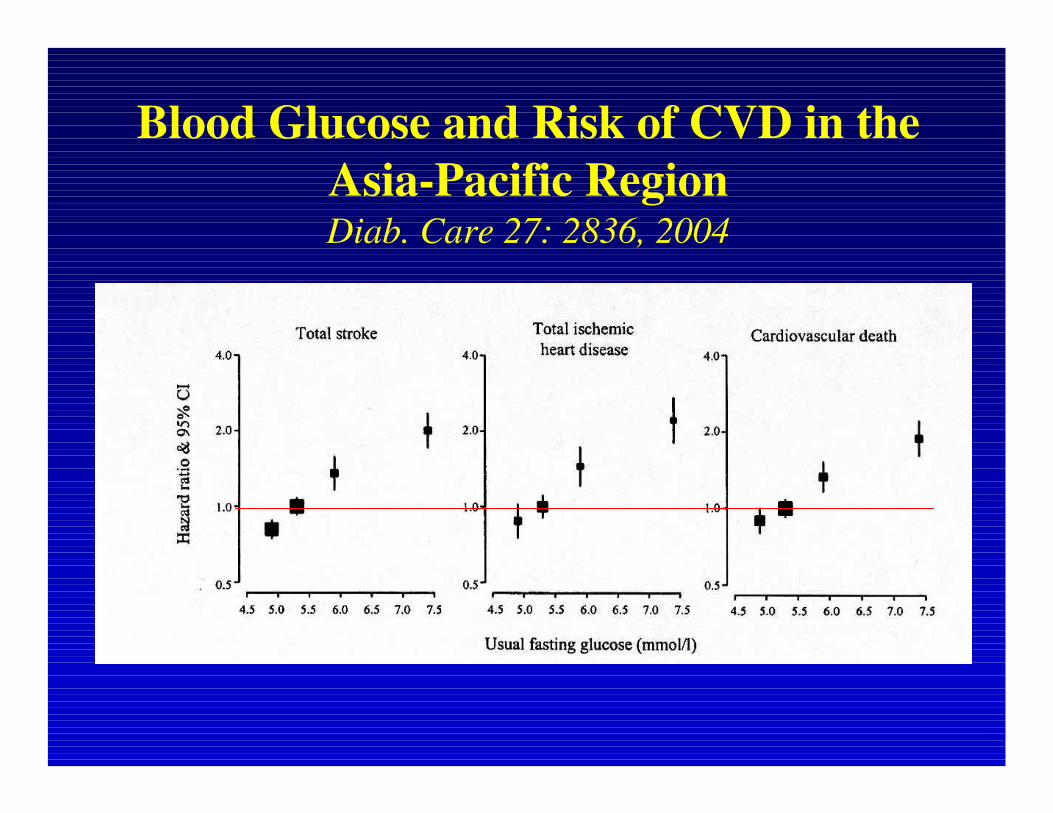
Blood Glucose and Risk of CVD in the
Asia-Pacific RegionDiab. Care 27: 2836, 2004
Evidence for 2-hour
postprandial/postchallenge to be an
independent risk factor
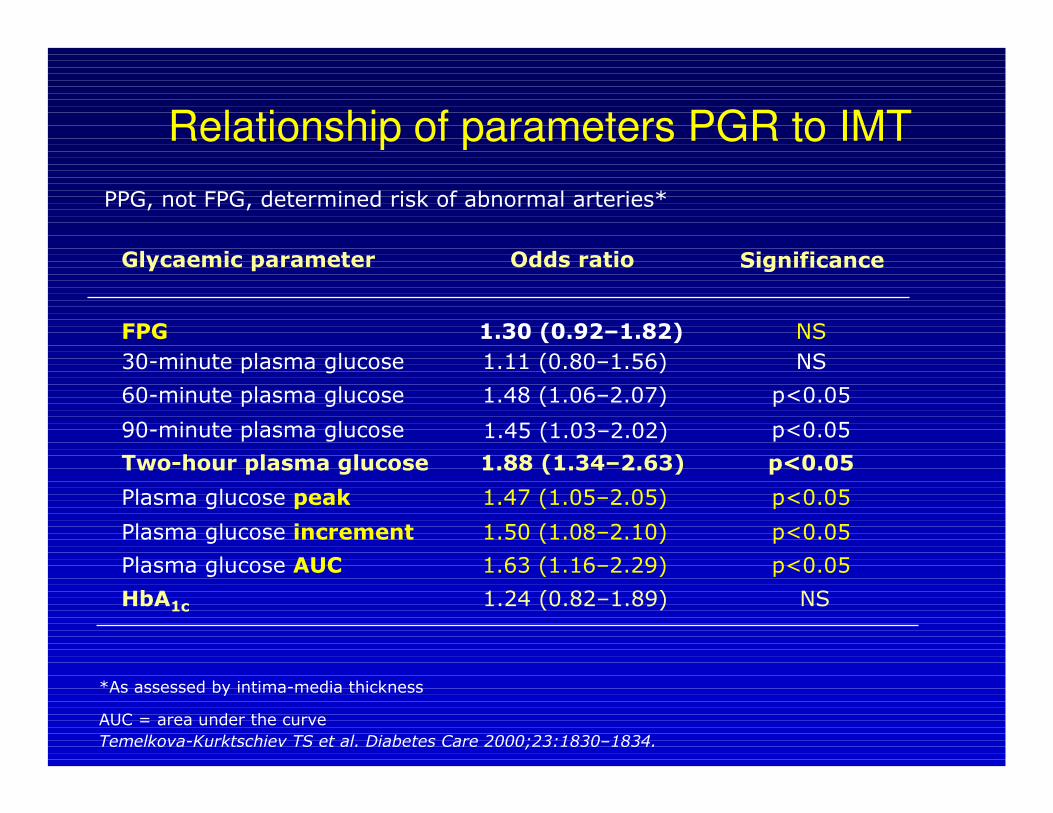
*As assessed by intima-media thickness
AUC = area under the curve
Significance
FPG 1.30 (0.92–1.82) NS
30-minute plasma glucose 1.11 (0.80–1.56) NS
60-minute plasma glucose 1.48 (1.06–2.07) p<0.05
90-minute plasma glucose p<0.05
Two-hour plasma glucose 1.88 (1.34–2.63) p<0.05
Plasma glucose peak 1.47 (1.05–2.05) p<0.05
Plasma glucose increment 1.50 (1.08–2.10) p<0.05
Plasma glucose AUC 1.63 (1.16–2.29) p<0.05
Glycaemic parameter Odds ratio
HbA1c 1.24 (0.82–1.89) NS
1.45 (1.03–2.02)
Temelkova-Kurktschiev TS et al. Diabetes Care 2000;23:1830–1834.
Relationship of parameters PGR to IMT
PPG, not FPG, determined risk of abnormal arteries*

Model 1 Model 2
Variable ß-coefficient p Variable ß-coefficient p
Age 0.326 < 0.001 Age 0.322 < 0.001
Sex - 0.242 < 0.001 Sex - 0.230 < 0.001
Plasma glucose
2h
0.140 0.001 Plasma glucose
2h
0.178 < 0.001
HDL cholesterol - 0.103 0.025 HDL cholesterol - 0.124 0.013
Albuminuria 0.098 0.021 Albuminuria 0.112 0.011
Leukocytes
count
0.083 0.045 Leukocytes
count
0.104 0.016
Total cholesterol 0.101 0.019
DeterminantsDeterminants of of carotidcarotid IMTIMTmeanmean: :
thethe RIAD RIAD StudyStudy
Temelkova-Kurktschiev T et al. Diabetes Care 2000; 23:1830-34

Relation between postprandial blood glucose levels and cardiovascular mortality
DECODE
19991Pacific and
Indian Ocean
19992
Funagata
Diabetes Study
19993
Whitehall, Paris and
Helsinki Study
19984
Diabetes
Intervention Study
19965
The
Rancho–Bernardo
Study 19986
ppBG
Honolulu
Heart Programme
19877
CVD death
4 Balkau B et al. Diabetes Care 19985 Hanefeld M et al. Diabetologia 1996
6 Barrett-Connor E et al. Diabetes Care 19987 Donahue R. Diabetes 1987
1 DECODE Study Group. Lancet 19992 Shaw J et al. Diabetologia 1999
3 Tominaga M et al. Diabetes Care 1999

Evidence from intervention
studies
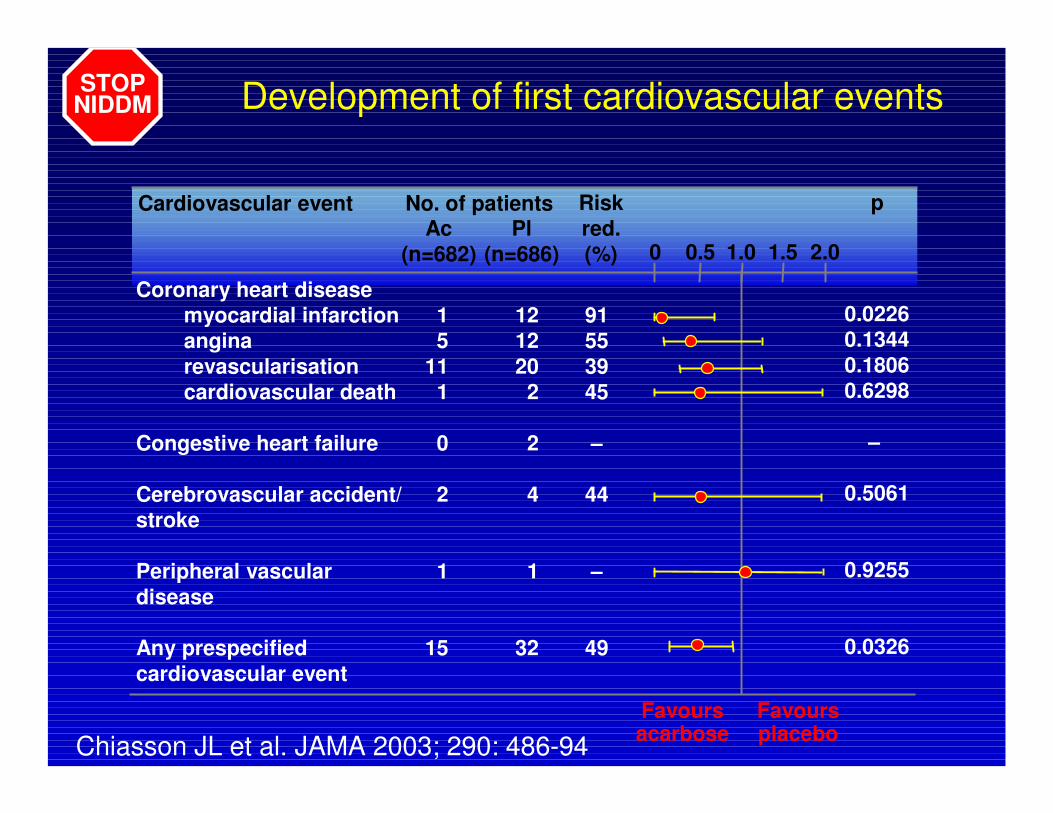
Development of first cardiovascular events
Risk
red.
(%)
p
Ac
(n=682)
Pl
(n=686)
No. of patients
Favoursacarbose
Favoursplacebo
0 0.5 1.0 1.5 2.0
Coronary heart disease
myocardial infarction 1 12 91
angina 5 12 55
revascularisation 11 20 39
cardiovascular death 1 2 45
Congestive heart failure 0 2 –
Cerebrovascular accident/ 2 4 44
stroke
Peripheral vascular 1 1 –
disease
Any prespecified 15 32 49
cardiovascular event
0.0226
0.1344
0.1806
0.6298
–
0.5061
0.9255
0.0326
Cardiovascular event
STOPNIDDM
Chiasson JL et al. JAMA 2003; 290: 486-94

Changes of IMTmean and IMTmax between baseline and
endpoint of the study: Effect of acarbose in STOP-NIDDM
subgroup analysis
(average time of treatment 3.9 years)
Acarbose (A) Placebo (Pl) p
Baseline Endpoint Baseline Endpoint
IMTmean (mm)* 0.91
(0.18)
0.93
(0.18)
0.93
(0.19)
0.97
(0.20)
A 0.02
Pl<0.001
∆IMTmean(mm) † 0.02 (0.07) 0.05 (0.06) 0.027
∆IMTmean/year †
(mm/y)
0.007 (0.019) 0.013 (0.018) 0.021
IMTmax (mm)* 1.03
(0.24)
1.05
(0.23)
1.05
(0.22)
1.08
(0.22)
A 0.044
Pl 0.007
∆IMTmax (mm) † 0.02 (0.08) 0.03 (0.08) n.s.
* Differences between baseline and endpoint † Differences between the groups
Hanefeld M et al Stroke 2004

Adapted from Esposito K et al. Circulation 2004;110:214-219.
Repaglinide vs. glyburide:
significant regression of
atherosclerosis despite no
significant change in other risk
factors:
(eg, BMI, blood pressure, total
cholesterol, triglycerides)
Targeting PPG slows progression of
atherosclerosis in carotid arteries

The decrease in IMT was associated with
changes in postprandial but not fasting
hyperglycaemia
0
5
10
15
20
25
30
35
40
45
50
Repaglinide Glyburide
Treatment group
Perc
enta
ge o
f pa
tients
achie
vin
g
glu
cose p
eak <
140 m
g/d
L
p=0.01
0
10
20
30
40
50
60
Repaglinide Glyburide
Treatment group
Perc
enta
ge o
f pa
tients
achie
vin
g
fasting g
lucose level <
110 m
g/d
L
p=0.01
Esposito K et al. Circulation 2004;110:214-219.

Incidence of MI and Mortality-Rate according to categories of
the NIDDM-Policy Group: 11 years follow-up(Hanefeld et al. Diab Med 1997)
Incidence of MI and Mortality-Rate according to categories of
the NIDDM-Policy Group: 11 years follow-up(Hanefeld et al. Diab Med 1997)
0
50
100
150
200
250
good borderline poor 0
50
100
150
200
250
300
good borderline poor
0
50
100
150
200
250
good borderline poor
FBG pp BG
0
50
100
150
200
250
good borderline poor
Triglycerides Blood pressure
Rate
pe
r 1000
Rate
pe
r 1000
Rate
pe
r 1000
Rate
pe
r 1000
MI
Mortality
*
** ** **
*) p < 0.05
**) p < 0.01
*

Effect of acarbose on developing cardiovascular events during the treatment phase: MeRIA7 study
M. Hanefeld et al. Eur Heart J 2004 Cox proportional hazards model

Inflammation as link between
postprandial hyperglycemia and
atherogenesis
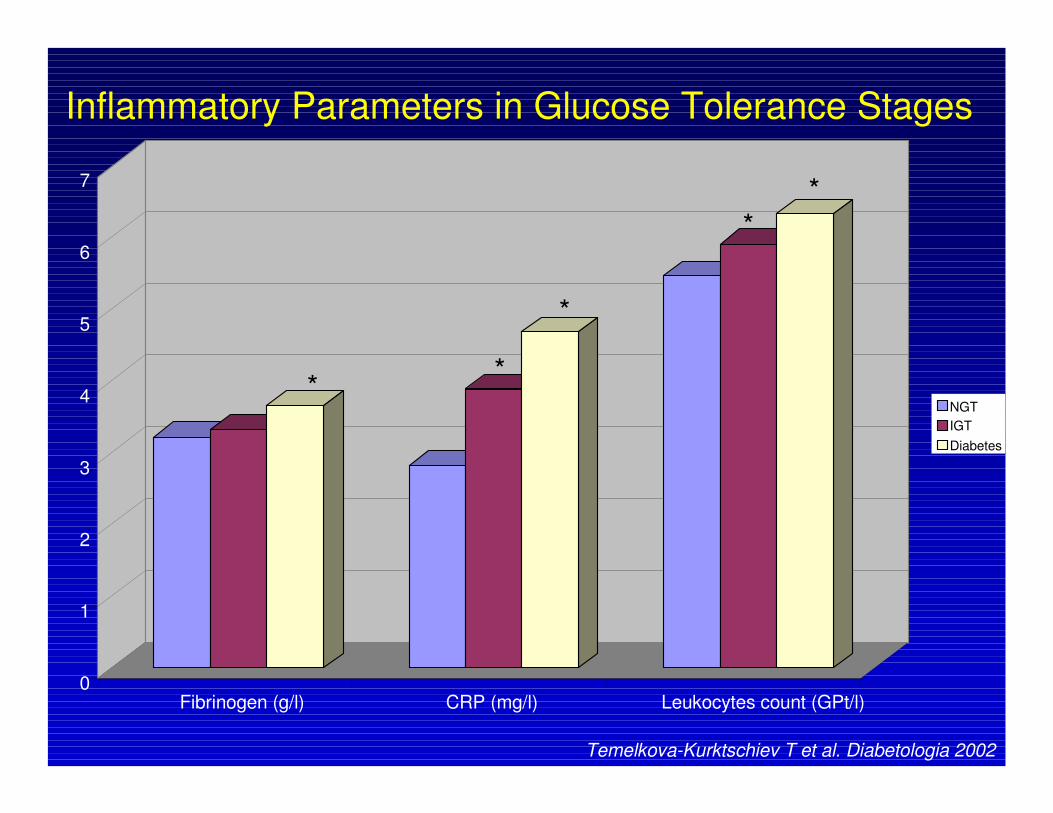
0
1
2
3
4
5
6
7
Fibrinogen (g/l) CRP (mg/l) Leukocytes count (GPt/l)
NGT
IGT
Diabetes
*
*
*
*
*
Inflammatory Parameters in Glucose Tolerance Stages
Temelkova-Kurktschiev T et al. Diabetologia 2002
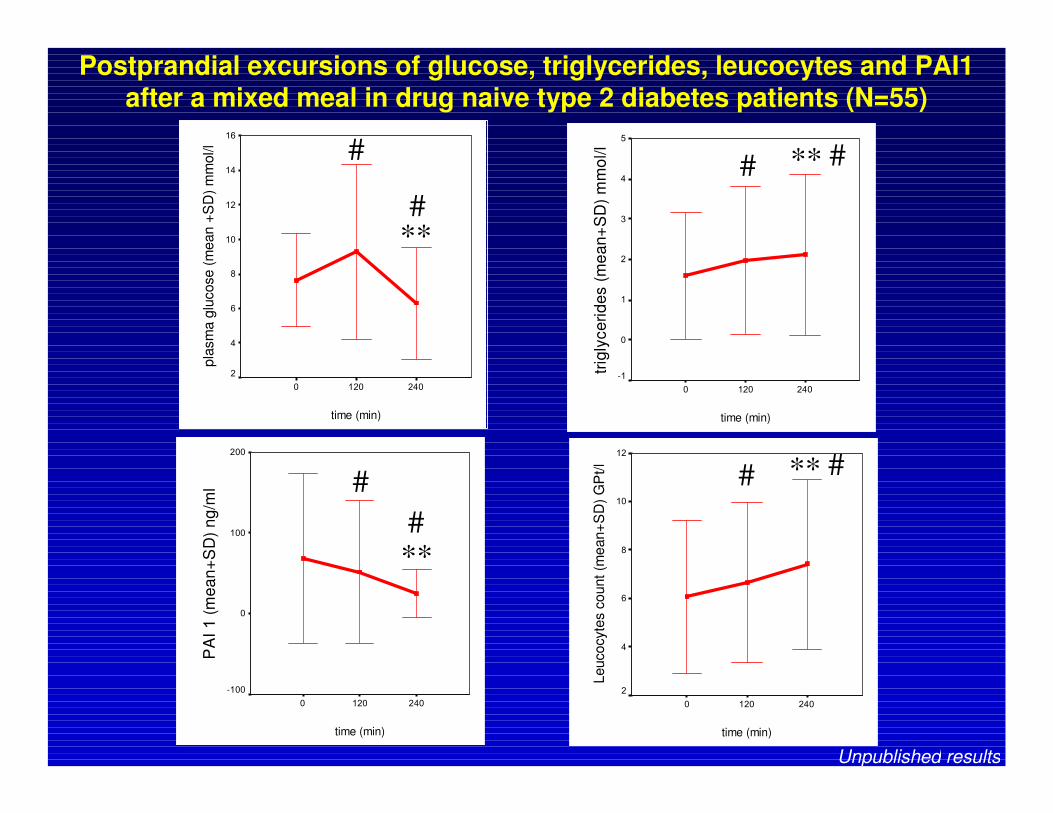
Postprandial excursions of glucose, triglycerides, leucocytes and PAI1 after a mixed meal in drug naive type 2 diabetes patients (N=55)
Unpublished results
time (min)
2401200
trig
lyce
rid
es (
me
an
+S
D)
mm
ol/l
5
4
3
2
1
0
-1
time (min)
2401200
PA
I 1 (
me
an
+S
D)
ng
/ml
200
100
0
-100
time (min)
2401200
pla
sm
a g
lucose (
mean +
SD
) m
mol/l
16
14
12
10
8
6
4
2
time (min)
2401200
Leucocyte
s c
ount (m
ean+
SD
) G
Pt/l
12
10
8
6
4
2
# ** #
# ** ##
**#
#
**#

Impact of postprandial glucose control by acarbose on
postprandial leucocyte excursion: AIDA-study
unpublished
5
6
7
8
9
0 2 4
Time after testmeal (h)
leu
co
cyte
s (
GP
t/l)
Placebo V2
Acarbose V2
Placebo V5
Acarbose V5
*
*Acarbose: V2 vs. V5 p=0.01

Pathopysiology of pp state due to excessive hyperglycemia
excessive pp
hyperglycemia
blood
coagulation ↑HDL-C catabolism ↑
plaque stability ↓
TG-rich lipoproteins
LDL removal ↓
endothelial
dysfunction
(NO release ↓)
insulin
resistance ↑
FFA ↑fibrinolysis ↓
B-cell function ↓
oxidative
stress ↑
Hanefeld M. 1999 Diabetes & Stoffw.
subclinical
inflammtion ↑
Practical consequences
Insulin treatment guided by pp (2h)
glucose value
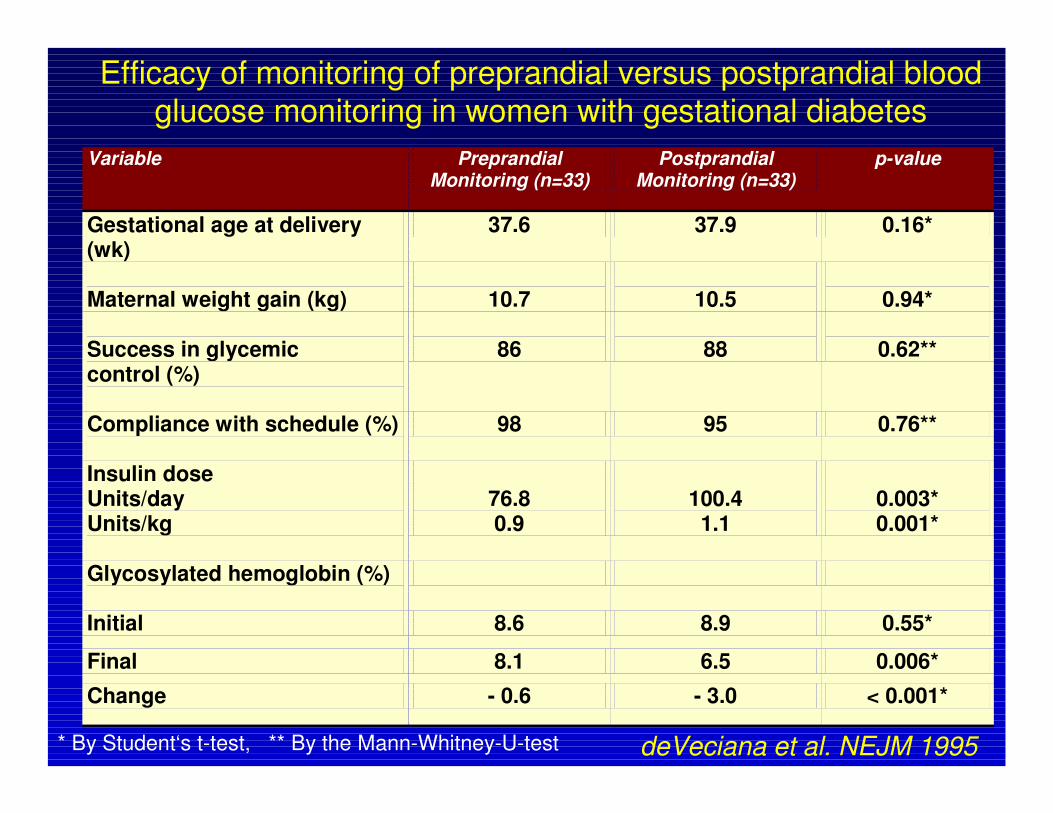
Variable Preprandial Monitoring (n=33)
Postprandial Monitoring (n=33)
p-value
Gestational age at delivery (wk)
37.6 37.9 0.16*
Maternal weight gain (kg)
10.7
10.5
0.94*
Success in glycemic control (%)
86
88
0.62**
Compliance with schedule (%)
98 95 0.76**
Insulin dose Units/day Units/kg
76.8 0.9
100.4
1.1
0.003* 0.001*
Glycosylated hemoglobin (%)
Initial 8.6 8.9 0.55*
Final 8.1 6.5 0.006*
Change - 0.6 - 3.0 < 0.001*
Efficacy of monitoring of preprandial versus postprandial bloodglucose monitoring in women with gestational diabetes
* By Student‘s t-test, ** By the Mann-Whitney-U-test deVeciana et al. NEJM 1995

Impact of Impact of qualityquality of of metabolicmetabolic controlcontrol on on CesareanCesarean sectionsection
and and neonatalneonatal outcomesoutcomes byby preprandialpreprandial and postprandial and postprandial
controlcontrol
Variable Preprandial Monitoring
(n=33)
Postprandial Monitoring
(n=33)
p-value
Cesarean section Total For CPD
13 12
8 4
0.29** 0.04**
Birth weight (g) 3848 3469 0.01*
Large for gestational age 14 4 0.01**
Birth weight > 4000g 12 3 0.01**
Small for gestational age 0 1 1.00**
Shoulder dystocia 6 1 0.10**
Neonatal hypoglycemia 7 1 0.05** Hyperbilirubinemia 4 3 1.00**
Transient tachypnea 2 2 1.00**
Apgar score at 5 min ≤≤≤≤ 7 3 1 0.61**
Stillbirth*** 1 0 1.00**
* By Student‘s t-test; ** By Fisher‘s exact test (two tailed)
*** One unexplained stillbirth at 21 weeks, the autopsy was normal
deVecianadeVeciana et al. NEJM 1995et al. NEJM 1995
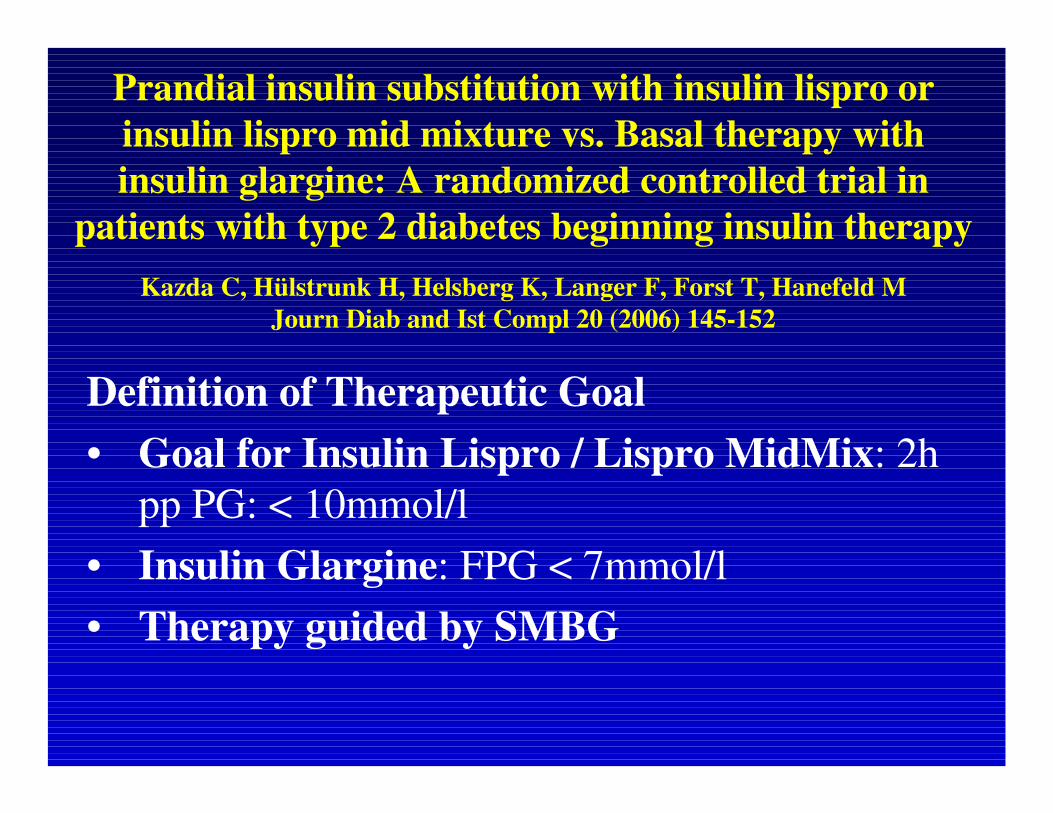
Prandial insulin substitution with insulin lispro or
insulin lispro mid mixture vs. Basal therapy with
insulin glargine: A randomized controlled trial in
patients with type 2 diabetes beginning insulin therapy
Kazda C, Hülstrunk H, Helsberg K, Langer F, Forst T, Hanefeld M
Journ Diab and Ist Compl 20 (2006) 145-152
Definition of Therapeutic Goal
• Goal for Insulin Lispro / Lispro MidMix: 2h
pp PG: < 10mmol/l
• Insulin Glargine: FPG < 7mmol/l
• Therapy guided by SMBG
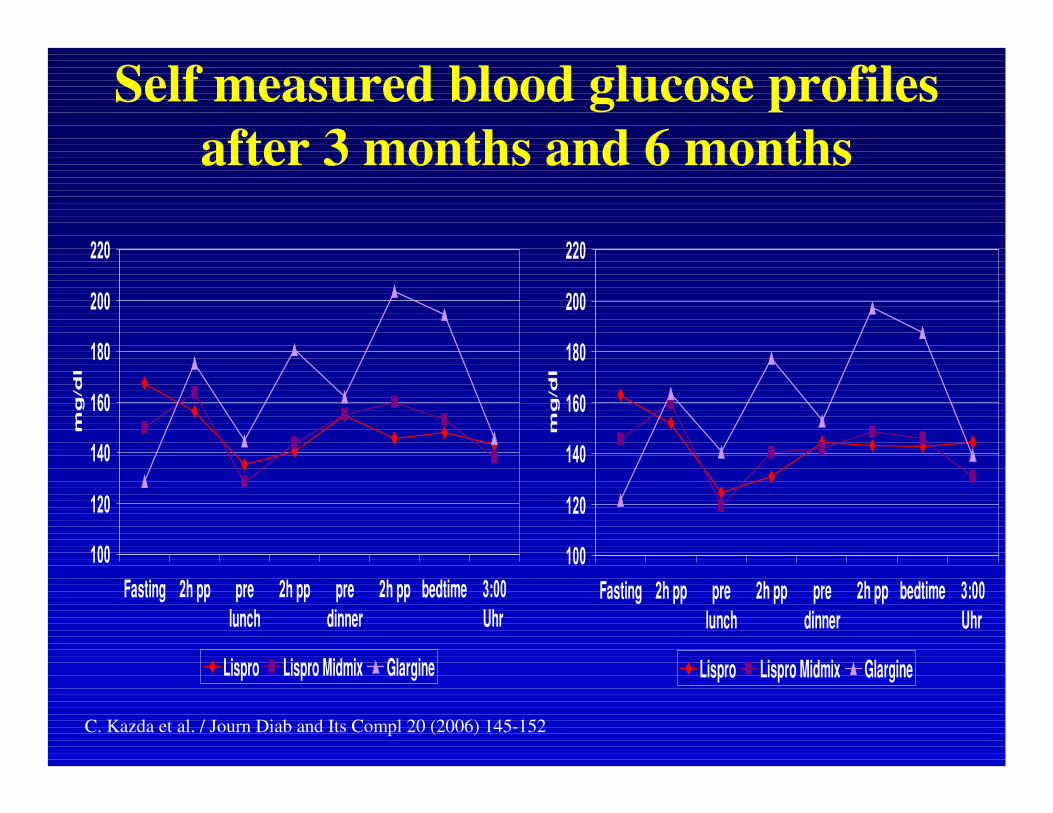
Self measured blood glucose profiles
after 3 months and 6 months
100
120
140
160
180
200
220
Fasting 2h pp pre
lunch
2h pp pre
dinner
2h pp bedtime 3:00
Uhr
mg
/d
l
Lispro Lispro Midmix Glargine
100
120
140
160
180
200
220
Fasting 2h pp pre
lunch
2h pp pre
dinner
2h pp bedtime 3:00
Uhr
mg
/d
l
Lispro Lispro Midmix Glargine
C. Kazda et al. / Journ Diab and Its Compl 20 (2006) 145-152
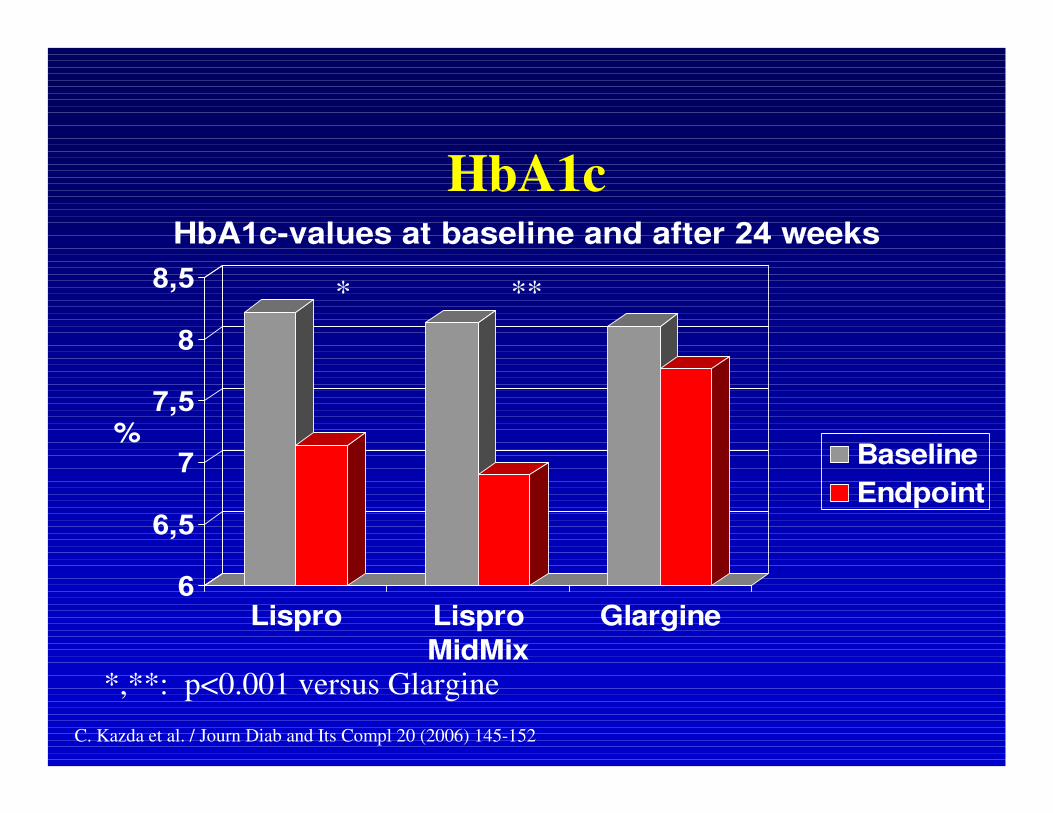
HbA1c
6
6,5
7
7,5
8
8,5
%
Lispro Lispro
MidMix
Glargine
HbA1c-values at baseline and after 24 weeks
Baseline
Endpoint
* **
*,**: p<0.001 versus Glargine
C. Kazda et al. / Journ Diab and Its Compl 20 (2006) 145-152
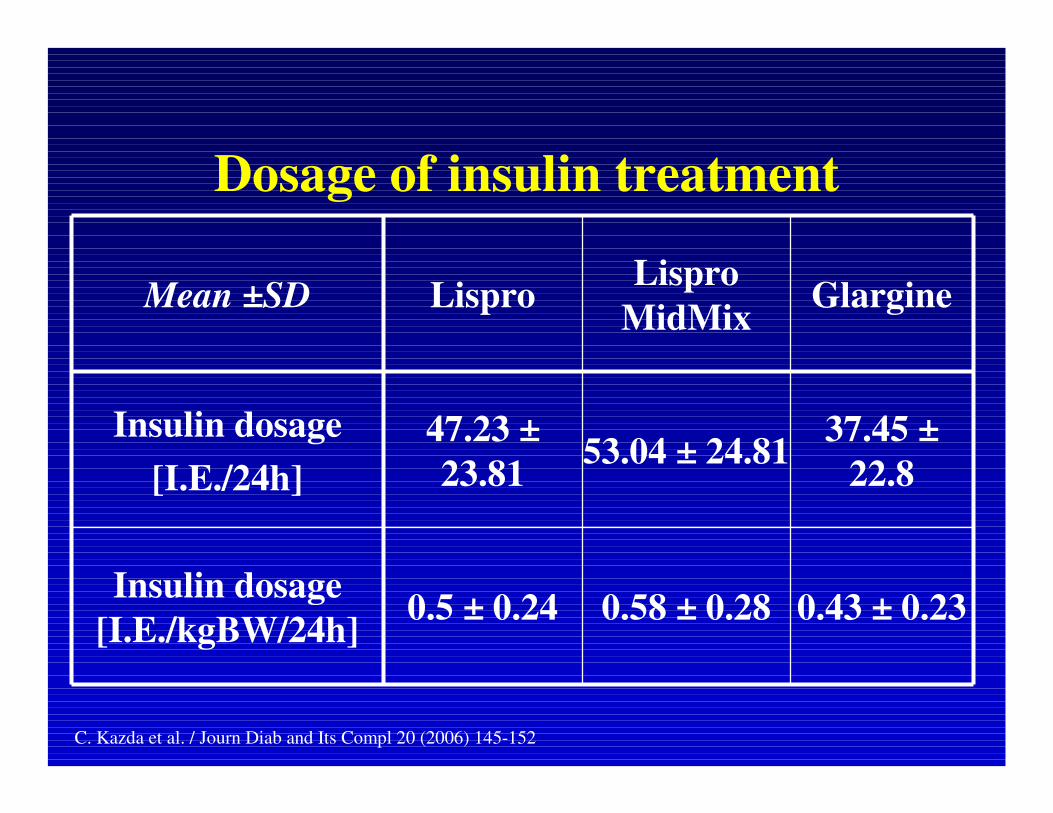
Dosage of insulin treatment
0.43 ± 0.230.58 ± 0.280.5 ± 0.24Insulin dosage
[I.E./kgBW/24h]
37.45 ±
22.853.04 ± 24.81
47.23 ±
23.81
Insulin dosage
[I.E./24h]
GlargineLispro
MidMixLisproMean ±SD
C. Kazda et al. / Journ Diab and Its Compl 20 (2006) 145-152

Postmeal blood glucose monitoring is
essential for good diabetes control
Examination Schedule
Morning
get upBreakfast Lunch Dinner
30‘ pre-meal monitoring for insulin dosage adjustment
monitoring 2 hours after meal

By extrapolation
A normalisation of postprandial glucose
excursion is a powerful tool to improve
endothelial dysfunction, protect unstable
plaques and prevent cardiovascular
complications.


