
FOR IMMEDIATE RELEASE May 12, 2004
THE WALT DISNEY COMPANY REPORTS HIGHER RESULTS FOR THE QUARTER AND SIX MONTHS ENDED
MARCH 31, 2004 • EPS for the second fiscal quarter grew 73% versus the prior year, led
by segment operating income growth at the Media Networks, Parks and Resorts and Consumer Products segments, partially offset by a decline at Studio Entertainment
• Cash flow from operations for the first half of the year was $2.5
billion, well more than double the prior-year period. Free cash flow for the first half of the year totaled $2.0 billion compared to $481 million for the first half of the prior year
BURBANK, Calif. – The Walt Disney Company today reported
earnings for the quarter and six months ended March 31, 2004.
Diluted earnings per share for the second quarter were $0.26, up 73%
from $0.15 in the prior-year second quarter.
For the six month period, diluted earnings per share were $0.59,
which was an increase of $0.38 from the prior-year period before the
cumulative effect of an accounting change. Earnings per share for the first
quarter of the prior year included an approximately $0.04 negative impact
due to the write-off of an aircraft leveraged lease investment.

2
“Disney is benefiting from the unique strengths of the Company’s
assets as well as the long-term growth strategies we’ve put in place as we
are seeing solid growth in attendance at our theme parks from both
domestic and international visitors, in global sales of DVDs and in the
financial results of our Media Networks businesses,” said Michael Eisner,
Disney chief executive officer. “Disney’s talented and experienced
management team is committed to creating the best in quality family
entertainment while maintaining an unwavering focus on increasing
earnings, cash flow and returns on invested capital.”
Revenues, segment operating income, income before the cumulative
effect of accounting change, net income and diluted earnings per share
amounts for the quarter and six months are as follows (in millions, except
per share amounts):
Three Months Ended
March 31, Six Months Ended
March 31,
2004(1) 2003(2) Change 2004(1) 2003(2) Change Revenues $ 7,189 $ 6,500 11 % $ 15,738 $ 13,670 15 % Segment operating income 1,120 814 38 % 2,391 1,296 84 % Income before the cumulative effect of accounting change $ 537 $ 314 71 % $ 1,225 $ 421 191 % Net income $ 537 $ 314 71 % $ 1,225 $ 350 250 % Diluted earnings per share before the cumulative effect of accounting change $ 0.26 $ 0.15 73 % $ 0.59 $ 0.21 181 % Diluted earnings per share $ 0.26 $ 0.15 73 % $ 0.59 $ 0.17 247 %
(1) As discussed further below, the Company adopted FIN 46R and as a result,
consolidated the balance sheets of Euro Disney and Hong Kong Disneyland as of March 31, 2004. FIN 46R requires that Euro Disney and Hong Kong Disneyland’s operating results continue to be accounted for on the equity method for the three and six-month periods ended March 31, 2004. The Company will consolidate their income and cash flow statements beginning April 1, 2004, the beginning of the Company’s fiscal third quarter.
(2) The Company adopted EITF No. 00-21, Revenue Arrangements with Multiple Deliverables (EITF 00-21) effective at the beginning of fiscal 2003. Accordingly, the prior-year second quarter and year-to-date results have been restated to reflect the implementation of EITF 00-21.
3
Fiscal 2004 Outlook
Barring negative changes in the environment and given the strength
of our recent results and the positive trends we are seeing in our
businesses, we now believe that we will deliver growth in earnings for the
full year of 50% or more excluding the potential impact from items like the
sale of the Disney Stores, versus the $0.65 reported last year. We are also
keeping an eye on the exposure we have from airline lease investments
made in the early nineties, which could impact our outlook as discussed
more fully in our quarterly report on Form 10-Q. We are also expecting to
deliver double-digit average annual earnings growth from 2004 through at
least 2007.
Operating Results
Studio Entertainment
Studio Entertainment revenues increased 16% to $2.2 billion and
segment operating income decreased 26% to $153 million.
The decline in segment operating income for the quarter primarily
reflected declines in worldwide theatrical motion picture distribution,
partially offset by increases in worldwide home entertainment. Current
quarter theatrical results reflected higher film write-downs and higher
marketing and distribution costs for films released after the quarter-end. In
addition, results reflected the performance during the quarter of Cold
Mountain, Hidalgo and Miracle, compared to the prior-year quarter which
included the stronger overall performance of Chicago, Bringing Down the
House and Shanghai Knights. Increases in worldwide home entertainment
reflected higher DVD sales. The current quarter results included The Lion
King 1½, Finding Nemo, Pirates of the Caribbean and Brother Bear as compared

4
to the prior-year quarter, which included Signs, Sweet Home Alabama and
101 Dalmatians II: Patch’s London Adventure.
Media Networks
Media Networks revenues for the quarter increased 7% to $2.8
billion, and segment operating income increased 76% to $704 million. See
Table A for further detail of Media Networks results.
Cable Networks contributed $171 million of the increase in segment
operating income, primarily due to higher affiliate revenue at ESPN.
Cable results also benefited from higher advertising revenues and the
favorable impact of a bankruptcy settlement with a cable operator in Latin
America, partially offset by higher programming costs. Higher affiliate
revenue at ESPN was due primarily to contractual rate adjustments.
During the quarter, the Company reached a settlement with DirecTV
Latin America, the Company’s major distributor in that region, which had
declared bankruptcy in fiscal 2003. As a result of the settlement, the
Company received payment for receivables that had been fully reserved in
the second quarter of the prior year and prior period revenues that had not
been previously recognized.
Broadcasting contributed $133 million of the increase in segment
operating income, primarily due to higher advertising rates received in the
upfront sales market and the absence of the Super Bowl in the current-year
quarter, partially offset by the impact of lower ratings at the ABC television
network.
5
Parks and Resorts
Parks and Resorts revenue for the quarter increased 12% to $1.7
billion and segment operating income increased 21% to $188 million.
The increase in revenue at Parks and Resorts reflected higher theme
park attendance and hotel occupancy at the Walt Disney World Resort.
Higher visitation from both domestic and international tourists as well as
residents reflected the continued success of Mission: SPACE, Mickey’s
PhilharMagic and Disney’s Pop Century Resort and improvements in
travel and tourism as well as the impact of promotional programs offered
during the quarter.
The revenue increases were partially offset by higher operating costs
due primarily to higher volume-related and employee benefit costs, and
increased depreciation expense. Increased depreciation was driven by
investments in new resort properties and theme park attractions including
Disney’s Pop Century Resort, Mission: SPACE and Mickey’s PhilharMagic
and information technology systems.
Parks and Resorts results also reflected higher theme park
attendance, hotel occupancy and guest spending at the Disneyland Resort.
Higher theme park attendance and hotel occupancy at the Disneyland
Resort were driven by promotional programs offered during the quarter.
These increases were more than offset by higher operating costs primarily
due to fixed asset retirements and higher volume-related, marketing and
employee benefits costs.
Higher employee benefits costs at both Walt Disney World and
Disneyland reflected increased pension and post-retirement medical costs,
which grew by $34 million across the entire segment. On a full year basis,
6
we expect that these costs will increase by approximately $137 million over
the prior year.
Consumer Products
Revenues for the quarter increased 2% to $512 million and segment
operating income increased 42% to $75 million.
Results for the quarter were driven by improvements at the Disney
Store and at Publishing, partially offset by a decrease at Buena Vista
Games. The improvement at the Disney Store reflected decreased losses
due to overhead savings and gross margin improvements at continuing
stores in North America as well as the impact of the closure of
underperforming stores. Publishing growth reflected strong performance
of Finding Nemo products and W.i.t.c.h. magazine sales in Europe. The
decrease at Buena Vista Games was due to a contract termination payment
received in the prior-year quarter. Licensing results for the quarter
increased modestly versus the prior-year quarter as the current quarter
reflected strong sales of the Disney Princess line and continued strong
performance of direct-to-retail license agreements in Europe.
Corporate and Unallocated Shared Expenses
Corporate and unallocated shared expenses decreased 12% to $82
million for the quarter. The decrease for the quarter reflected adjustments
to litigation reserves, partially offset by administrative cost increases.

7
Net Interest Expense
Net interest expense was as follows:
Quarter Ended March 31,
(in millions) 2004 2003 Interest expense $ (140) $ (172) Interest and investment income (loss) (7) (6) Net interest expense $ (147) $ (178)
Interest expense decreased by 19% to $140 million primarily
reflecting lower average debt balances.
Equity in the Income of Investees
Income from equity investees, consisting primarily of Euro Disney,
A&E Television, Lifetime Television and E! Entertainment Television,
increased 51% to $77 million for the quarter primarily due to higher
affiliate and advertising revenue at Lifetime, A&E, E!, and the History
Channel, partially offset by a decline at Euro Disney due to higher costs.
FIN 46
In December 2003, the Financial Accounting Standards Board
amended FASB Interpretation No. 46, Consolidation of Variable Interest
Entities (FIN 46) by issuing FIN 46R which generally deferred the effective
date of FIN 46 to March 31, 2004. The Company adopted FIN 46R and, as a
result, consolidated the balance sheets of Euro Disney and Hong Kong
Disneyland on March 31, 2004. See Table D for the condensed
consolidating balance sheet of the Company, reflecting the impact of
consolidating Euro Disney and Hong Kong Disneyland as of March 31,
2004. Under FIN 46R, the operating results of Euro Disney and Hong

8
Kong Disneyland continue to be accounted for on the equity method for
the six-month period ended March 31, 2004. The Company will
consolidate the income and cash flow statements of Euro Disney and Hong
Kong Disneyland beginning April 1, 2004.
The recognition of additional liabilities as a result of consolidating
Euro Disney and Hong Kong Disneyland does not result in any
incremental increase in the level of claims on the general assets of the
Company and its other subsidiaries; rather, the additional liabilities
represent claims against the additional assets recognized by the Company
as a result of the consolidations. Conversely, the additional assets
recognized as a result of consolidating Euro Disney and Hong Kong
Disneyland do not represent additional assets of the Company that could
be used to satisfy claims by the creditors of the Company and its other
subsidiaries.
Quarterly results for fiscal 2003 and the first two quarters of fiscal
2004, as if the Company had consolidated the income statements of Euro
Disney and Hong Kong Disneyland commencing at the beginning of fiscal
2003, are presented at Table C.
9
Balance Sheet and Cash Flow
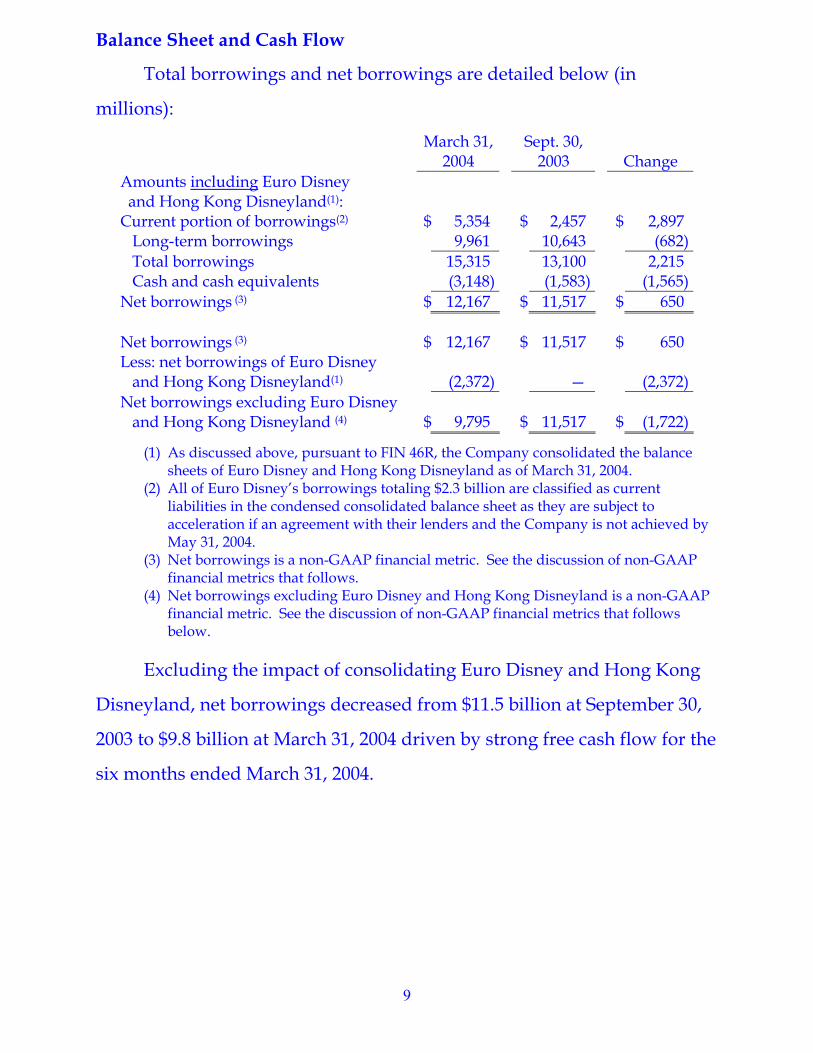
Total borrowings and net borrowings are detailed below (in
millions):
March 31, 2004
Sept. 30, 2003
Change
Amounts including Euro Disney and Hong Kong Disneyland(1): Current portion of borrowings(2) $ 5,354 $ 2,457 $ 2,897 Long-term borrowings 9,961 10,643 (682) Total borrowings 15,315 13,100 2,215 Cash and cash equivalents (3,148) (1,583) (1,565) Net borrowings (3) $ 12,167 $ 11,517 $ 650
Net borrowings (3) $ 12,167 $ 11,517 $ 650 Less: net borrowings of Euro Disney and Hong Kong Disneyland(1) (2,372) — (2,372) Net borrowings excluding Euro Disney and Hong Kong Disneyland (4) $ 9,795 $ 11,517 $ (1,722)
(1) As discussed above, pursuant to FIN 46R, the Company consolidated the balance sheets of Euro Disney and Hong Kong Disneyland as of March 31, 2004.
(2) All of Euro Disney’s borrowings totaling $2.3 billion are classified as current liabilities in the condensed consolidated balance sheet as they are subject to acceleration if an agreement with their lenders and the Company is not achieved by May 31, 2004.
(3) Net borrowings is a non-GAAP financial metric. See the discussion of non-GAAP financial metrics that follows.
(4) Net borrowings excluding Euro Disney and Hong Kong Disneyland is a non-GAAP financial metric. See the discussion of non-GAAP financial metrics that follows below.
Excluding the impact of consolidating Euro Disney and Hong Kong
Disneyland, net borrowings decreased from $11.5 billion at September 30,
2003 to $9.8 billion at March 31, 2004 driven by strong free cash flow for the
six months ended March 31, 2004.

10
Cash provided by operations and free cash flow for the six months
ended March 31, 2004 are detailed below (in millions):
Six Months Ended
March 31, 2004 2003 Change Cash provided by operations $ 2,504 $ 929 $ 1,575 Investments in parks, resorts and other property (468) (448) (20) Free cash flow (1) $ 2,036 $ 481 $ 1,555
(1) Free cash flow is a non-GAAP financial metric. See the discussion of non-GAAP financial metrics that follows below.
The increase in free cash flow for the six months as compared to the
prior-year period was due primarily to higher earnings, lower film and
television production spending and decreased funding to Euro Disney
through its line of credit.
Investments in parks, resorts and other property were primarily for
new rides and attractions at the theme parks and company-wide
information technology projects. Capital expenditures by business
segment are as follows (in millions):
Six Months Ended March 31, 2004 2003 Media Networks $ 75 $ 60 Parks and Resorts 301 255 Studio Entertainment 16 24 Consumer Products 6 15 Corporate and unallocated shared expenditures 70 94 $ 468 $ 448
Euro Disney
During November 2003, Euro Disney obtained waivers from its
lenders, effective through March 31, 2004, with respect to debt covenants

11
for fiscal 2003. On March 22, 2004, Euro Disney obtained an extension of
these waivers through May 31, 2004. The waivers are expected to give
Euro Disney, its lenders and the Company time to find a resolution to Euro
Disney's financial situation. In conjunction with the extension, the
Company agreed to replace its supplemental €45 million subordinated
credit facility, which expired on March 31, 2004, with a €25 million ($31
million at March 31, 2004 exchange rates) subordinated credit facility,
which will expire on May 31, 2004. Additionally, Euro Disney agreed not
to allow the outstanding balance of its €168 million ($207 million at March
31, 2004 exchange rates) line of credit with the Company to fall below €110
million during the extension period. As of March 31, 2004, Euro Disney had
borrowed €110 million ($136 million at March 31, 2004 exchange rates) on
this credit line. This line of credit is excluded from the Company’s balance
sheet as it is eliminated when consolidating Euro Disney. As of May 7,
2004, Euro Disney had not borrowed any amounts under the €25 million
subordinated credit facility and the balance of the €168 million credit
facility was €125 million ($149 million at May 7, 2004 exchange rates).
Euro Disney is currently engaged in discussions with its lenders and
the Company to obtain supplemental financing to address its cash
requirements. Such financing may include an extension or change in the
terms associated with the Company’s credit line and/or additional
commitments from the Company. If a resolution to Euro Disney's future
financing needs is not obtained by May 31, 2004 and assuming the waiver
period is not extended again, the waivers would expire and Euro Disney's
lenders could accelerate the maturity of Euro Disney's debt. Should that
occur, Euro Disney would be unable to meet all of its debt obligations. The

12
Company believes that Euro Disney will ultimately obtain the requisite
loan modifications and additional financing; however, there can be no
assurance that this will be the case. Should Euro Disney be unable to
obtain loan modifications and/or additional financing, the assets of Euro
Disney could become impaired, potentially resulting in corresponding
charges in our consolidated financial statements.
Non-GAAP Financial Metrics
This earnings release presents net borrowings, net borrowings
excluding Euro Disney and Hong Kong Disneyland, free cash flow and
aggregate segment operating income which are important financial metrics
for the Company but are not GAAP-defined metrics.
Net borrowings – The Company believes that net borrowings provide
investors with useful information regarding our financial condition. Net
borrowings reflects the subtraction of cash and cash equivalents from total
borrowings. Since we earn interest income on our cash balances that
offsets a portion of the interest expense we pay on our borrowings, net
borrowings can be used as a measure to gauge net interest expense. In
addition, a portion of our cash and cash equivalents is available to repay
outstanding indebtedness when the indebtedness matures or when other
circumstances arise. However, we may not immediately apply cash and
cash equivalents to the reduction of debt, nor do we expect that we would
use all of our available cash and cash equivalents to repay debt in the
ordinary course of business.
13
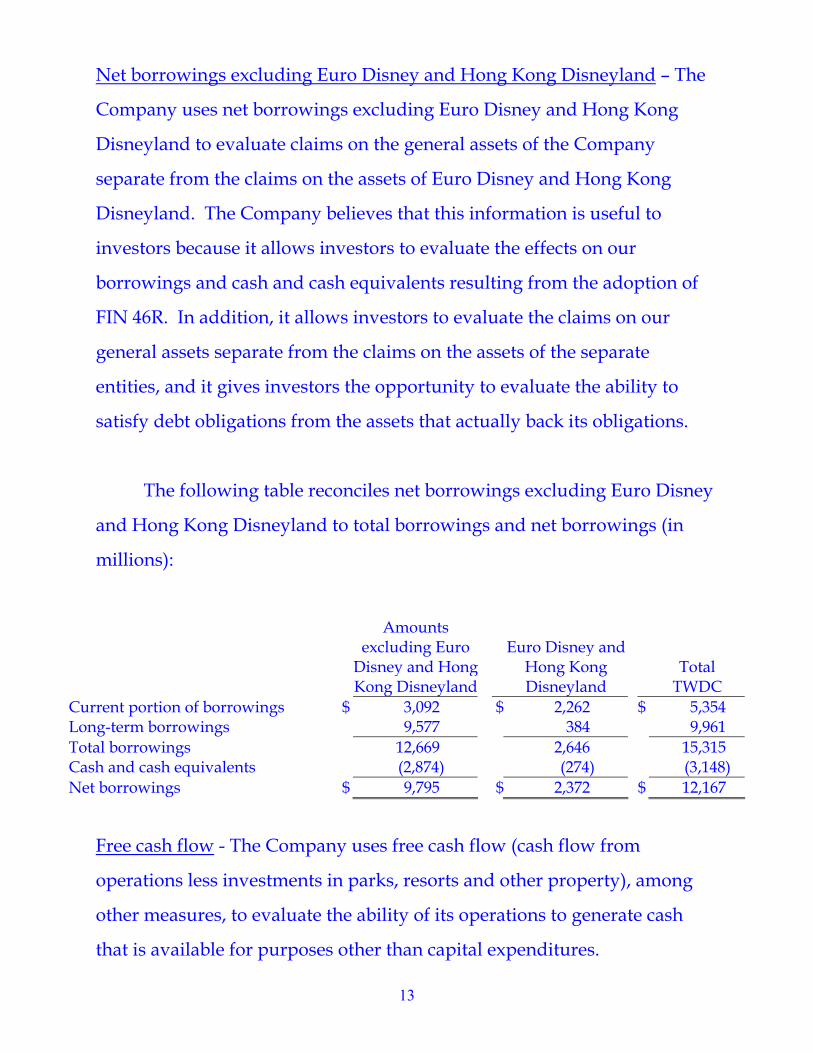
Net borrowings excluding Euro Disney and Hong Kong Disneyland – The
Company uses net borrowings excluding Euro Disney and Hong Kong
Disneyland to evaluate claims on the general assets of the Company
separate from the claims on the assets of Euro Disney and Hong Kong
Disneyland. The Company believes that this information is useful to
investors because it allows investors to evaluate the effects on our
borrowings and cash and cash equivalents resulting from the adoption of
FIN 46R. In addition, it allows investors to evaluate the claims on our
general assets separate from the claims on the assets of the separate
entities, and it gives investors the opportunity to evaluate the ability to
satisfy debt obligations from the assets that actually back its obligations.
The following table reconciles net borrowings excluding Euro Disney
and Hong Kong Disneyland to total borrowings and net borrowings (in
millions):
Amounts excluding Euro
Disney and HongKong Disneyland
Euro Disney and Hong Kong Disneyland
Total TWDC
Current portion of borrowings $ 3,092 $ 2,262 $ 5,354 Long-term borrowings 9,577 384 9,961 Total borrowings 12,669 2,646 15,315 Cash and cash equivalents (2,874) (274) (3,148) Net borrowings $ 9,795 $ 2,372 $ 12,167
Free cash flow - The Company uses free cash flow (cash flow from
operations less investments in parks, resorts and other property), among
other measures, to evaluate the ability of its operations to generate cash
that is available for purposes other than capital expenditures.

14
Management believes free cash flow provides investors with an important
perspective on the cash available to service debt, make strategic
acquisitions and investments and pay dividends.
Aggregate segment operating income - The Company evaluates the
performance of its operating segments based on segment operating income,
and management uses aggregate segment operating income as a measure
of the performance of operating businesses separate from non-operating
factors. The Company believes that aggregate segment operating income
assists investors by allowing them to evaluate changes in the operating
results of the Company's portfolio of businesses separate from non-
operational factors that affect net income, thus providing separate insight
into both operations and the other factors that affect reported results.
These measures should be used in conjunction with GAAP financial
measures and are not presented as alternative measures of borrowings,
cash flow or net income as determined in accordance with GAAP. Net
borrowings, net borrowings excluding Euro Disney and Hong Kong
Disneyland, free cash flow and aggregate segment operating income as we
have calculated them may not be comparable to similarly titled measures
reported by other companies.

15
FORWARD-LOOKING STATEMENTS
Management believes certain statements in this earnings release may
constitute “forward-looking statements” within the meaning of the Private
Securities Litigation Reform Act of 1995. These statements are made on the
basis of management’s views and assumptions regarding future events and
business performance as of the time the statements are made and
management does not undertake any obligation to update these
statements. Actual results may differ materially from those expressed or
implied. Such differences may result from actions taken by the Company,
including restructuring or strategic initiatives and information technology
improvements, as well as from developments beyond the Company’s
control, including international, political, health concern and military
developments that may affect travel and leisure businesses generally and
changes in domestic and global economic conditions that may, among
other things, affect the performance of the Company’s theatrical and home
entertainment releases, the advertising market for broadcast and cable
television programming, expenses of providing medical and pension
benefits and demand for consumer products. Changes in domestic
competitive conditions and technological developments may also affect
performance of all significant company businesses.
Additional factors are set forth in the Company’s Annual Report on
Form 10-K for the year ended September 30, 2003 under the heading
“Factors that may affect forward-looking statements.”

16
The Walt Disney Company CONSOLIDATED STATEMENTS OF INCOME (unaudited, in millions, except per share data)
Three Months Ended
March 31, Six Months Ended
March 31, 2004 2003 2004 2003
Revenues $ 7,189 $ 6,500 $ 15,738 $ 13,670
Costs and expenses (6,153) (5,786) (13,537) (12,581)
Restructuring and impairment charges (3) — (3) —
Net interest expense (147) (178) (295) (474)
Equity in the income of investees 77 51 174 141
Income before income taxes, minority interests and the cumulative effect of accounting change 963 587 2,077 756
Income taxes (357) (219) (767) (296)
Minority interests (69) (54) (85) (39)
Income before the cumulative effect of accounting change 537 314 1,225 421
Cumulative effect of accounting change — — — (71) Net income $ 537 $ 314 $ 1,225 $ 350 Earnings per share before the cumulative effect of
accounting change: Diluted(1) $ 0.26 $ 0.15 $ 0.59 $ 0.21
Basic $ 0.26 $ 0.15 $ 0.60 $ 0.21
Earnings per share:
Diluted(1) $ 0.26 $ 0.15 $ 0.59 $ 0.17 Basic $ 0.26 $ 0.15 $ 0.60 $ 0.17
Average number of common and common equivalent shares outstanding:
Diluted 2,110 2,043 2,104 2,043 Basic 2,048 2,042 2,047 2,042
(1) The calculation of diluted earnings per share assumes the conversion of the Company’s convertible senior
notes issued in April 2003, and adds back interest expense (net of tax) of $5 million and $10 million for the quarter and six months ended March 31, 2004, respectively.

17
The Walt Disney Company SEGMENT RESULTS
(unaudited, in millions)
Three Months Ended
March 31, Six Months Ended
March 31,
2004 2003 Change 2004 2003 Change Revenues: Media Networks $ 2,846 $ 2,653 7 % $ 5,960 $ 5,597 6 % Parks and Resorts 1,669 1,485 12 % 3,300 3,033 9 % Studio Entertainment 2,162 1,862 16 % 5,126 3,753 37 % Consumer Products 512 500 2 % 1,352 1,287 5 % $ 7,189 $ 6,500 11 % $ 15,738 $ 13,670 15 % Segment operating income: Media Networks $ 704 $ 400 76 % $ 1,048 $ 329 219 % Parks and Resorts 188 155 21 % 420 380 11 % Studio Entertainment 153 206 (26)% 611 344 78 % Consumer Products 75 53 42 % 312 243 28 % $ 1,120 $ 814 38 % $ 2,391 $ 1,296 84 %
The Company evaluates the performance of its operating segments based on segment operating income. A reconciliation of segment operating income to income before income taxes, minority interests and the cumulative effect of accounting change is as follows:
Three Months Ended
March 31, Six Months Ended
March 31, 2004 2003 2004 2003
Segment operating income $ 1,120 $ 814 $ 2,391 $ 1,296 Corporate and unallocated shared expenses (82) (93) (185) (195) Amortization of intangible assets (2) (7) (5) (12) Restructuring and impairment charges (3) - (3) - Net interest expense (147) (178) (295) (474) Equity in the income of investees 77 51 174 141 Income before income taxes, minority interests and the cumulative effect of accounting change $ 963 $ 587
$ 2,077 $ 756
Depreciation expense is as follows:
Three Months Ended
March 31, Six Months Ended
March 31, 2004 2003 2004 2003 Media Networks $ 42 $ 43 $ 84 $ 85 Parks and Resorts 181 170 358 340 Studio Entertainment 6 10 10 19 Consumer Products 13 18 26 33 Segment depreciation expense 242 241 478 477 Corporate 37 28 74 53 Total depreciation expense $ 279 $ 269 $ 552 $ 530 Segment depreciation expense is included in segment operating income and corporate depreciation expense is included in corporate and unallocated shared expenses.

18
The Walt Disney Company CONSOLIDATED BALANCE SHEETS
(in millions, except per share data)
March 31, 2004
September 30, 2003
(unaudited) ASSETS Current assets
Cash and cash equivalents $ 3,148 $ 1,583 Receivables 4,612 4,238 Inventories 742 703 Television costs 754 568 Deferred income taxes 675 674 Other assets 817 548
Total current assets 10,748 8,314
Film and television costs 6,022 6,205 Investments 1,256 1,849 Parks, resorts and other property, at cost
Attractions, buildings and equipment 24,785 19,499 Accumulated depreciation (11,516) (8,794)
13,269 10,705 Projects in progress 1,871 1,076 Land 1,138 897
16,278 12,678
Intangible assets, net 2,775 2,786 Goodwill 16,966 16,966 Other assets 1,051 1,190 $ 55,096 $ 49,988 LIABILITIES AND SHAREHOLDERS’ EQUITY Current liabilities
Accounts payable and other accrued liabilities $ 5,738 $ 5,044 Current portion of borrowings 5,354 2,457 Unearned royalties and other advances 1,684 1,168
Total current liabilities 12,776 8,669
Borrowings 9,961 10,643 Deferred income taxes 2,894 2,712 Other long term liabilities 3,972 3,745 Minority interests 733 428 Commitments and contingencies Shareholders’ equity
Preferred stock, $.01 par value Authorized – 100 million shares, Issued – none — — Common stock Common stock – Disney, $.01 par value Authorized – 3.6 billion shares, Issued – 2.1 billion shares 12,327 12,154 Common stock – Internet Group, $.01 par value Authorized – 1.0 billion shares, Issued – none — — Retained earnings 14,612 13,817 Accumulated other comprehensive loss (653) (653)
26,286 25,318 Treasury stock, at cost, 86.7 million shares (1,526) (1,527) 24,760 23,791
$ 55,096 $ 49,988

19
The Walt Disney Company
CONSOLIDATED STATEMENTS OF CASH FLOWS (unaudited, in millions)
Six Months Ended March 31,
2004 2003 OPERATING ACTIVITIES Net income $ 1,225 $ 350 Depreciation 552 530 Amortization of intangible assets 5 12 Deferred income taxes 199 141 Equity in the income of investees (174) (141) Cash distributions received from equity investees 175 168 Write-off of aircraft leveraged lease — 114 Minority interests 85 39 Change in film and television costs 243 (165) Changes in noncurrent assets and liabilities, and other 245 36 1,330 734 Changes in working capital (51) (155)
Cash provided by operations 2,504 929 INVESTING ACTIVITIES Investments in parks, resorts and other property (468) (448) Other 39 (22) Cash used by investing activities (429) (470) FINANCING ACTIVITIES Borrowings — 300 Reduction of borrowings (1,117) (1,072) Commercial paper borrowings, net 622 1,226 Dividends (430) (429) Exercise of stock options and other 141 29 Cash (used by) provided by financing activities (784) 54 Increase in cash and cash equivalents 1,291 513 Cash and cash equivalents due to the consolidation of Euro Disney and Hong Kong Disneyland
274 —
Cash and cash equivalents, beginning of period 1,583 1,239 Cash and cash equivalents, end of period $ 3,148 $ 1,752

20
Table A
MEDIA NETWORKS (unaudited, in millions)
Three Months Ended March 31, 2004 2003 Change Revenues: Broadcasting $ 1,338 $ 1,407 (5)% Cable Networks 1,508 1,246 21 % $ 2,846 $ 2,653 7 % Segment operating income (loss): Broadcasting $ 28 $ (105) n/m Cable Networks 676 505 34 % $ 704 $ 400 76 % Depreciation expense: Broadcasting $ 25 $ 24 4 % Cable Networks 17 19 (11)% $ 42 $ 43 (2)%
Six Months Ended March 31, 2004 2003 Change Revenues: Broadcasting $ 2,892 $ 2,971 (3)% Cable Networks 3,068 2,626 17 % $ 5,960 $ 5,597 6 % Segment operating income (loss): Broadcasting $ 176 $ (67) n/m Cable Networks 872 396 120 % $ 1,048 $ 329 219 % Depreciation expense: Broadcasting $ 50 $ 44 14 % Cable Networks 34 41 (17)% $ 84 $ 85 (1)%
21
Table B
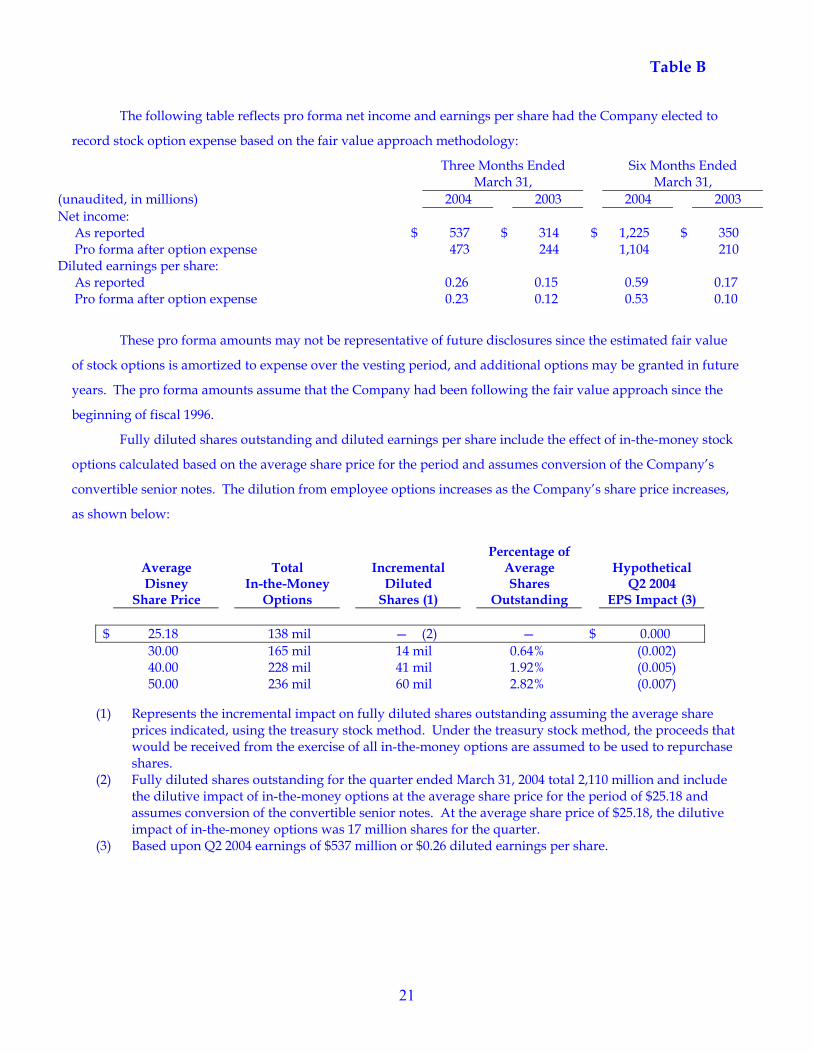
The following table reflects pro forma net income and earnings per share had the Company elected to
record stock option expense based on the fair value approach methodology:
Three Months Ended March 31,
Six Months Ended March 31,
(unaudited, in millions) 2004 2003 2004 2003 Net income: As reported $ 537 $ 314 $ 1,225 $ 350 Pro forma after option expense 473 244 1,104 210 Diluted earnings per share: As reported 0.26 0.15 0.59 0.17 Pro forma after option expense 0.23 0.12 0.53 0.10
These pro forma amounts may not be representative of future disclosures since the estimated fair value
of stock options is amortized to expense over the vesting period, and additional options may be granted in future
years. The pro forma amounts assume that the Company had been following the fair value approach since the
beginning of fiscal 1996.
Fully diluted shares outstanding and diluted earnings per share include the effect of in-the-money stock
options calculated based on the average share price for the period and assumes conversion of the Company’s
convertible senior notes. The dilution from employee options increases as the Company’s share price increases,
as shown below:
Average Disney
Share Price
Total
In-the-Money Options
Incremental
Diluted Shares (1)
Percentage of Average Shares
Outstanding
Hypothetical
Q2 2004 EPS Impact (3)
$ 25.18 138 mil — (2) — $ 0.000 30.00 165 mil 14 mil 0.64% (0.002) 40.00 228 mil 41 mil 1.92% (0.005) 50.00 236 mil 60 mil 2.82% (0.007)
(1) Represents the incremental impact on fully diluted shares outstanding assuming the average share
prices indicated, using the treasury stock method. Under the treasury stock method, the proceeds that would be received from the exercise of all in-the-money options are assumed to be used to repurchase shares.
(2) Fully diluted shares outstanding for the quarter ended March 31, 2004 total 2,110 million and include the dilutive impact of in-the-money options at the average share price for the period of $25.18 and assumes conversion of the convertible senior notes. At the average share price of $25.18, the dilutive impact of in-the-money options was 17 million shares for the quarter.
(3) Based upon Q2 2004 earnings of $537 million or $0.26 diluted earnings per share.
22
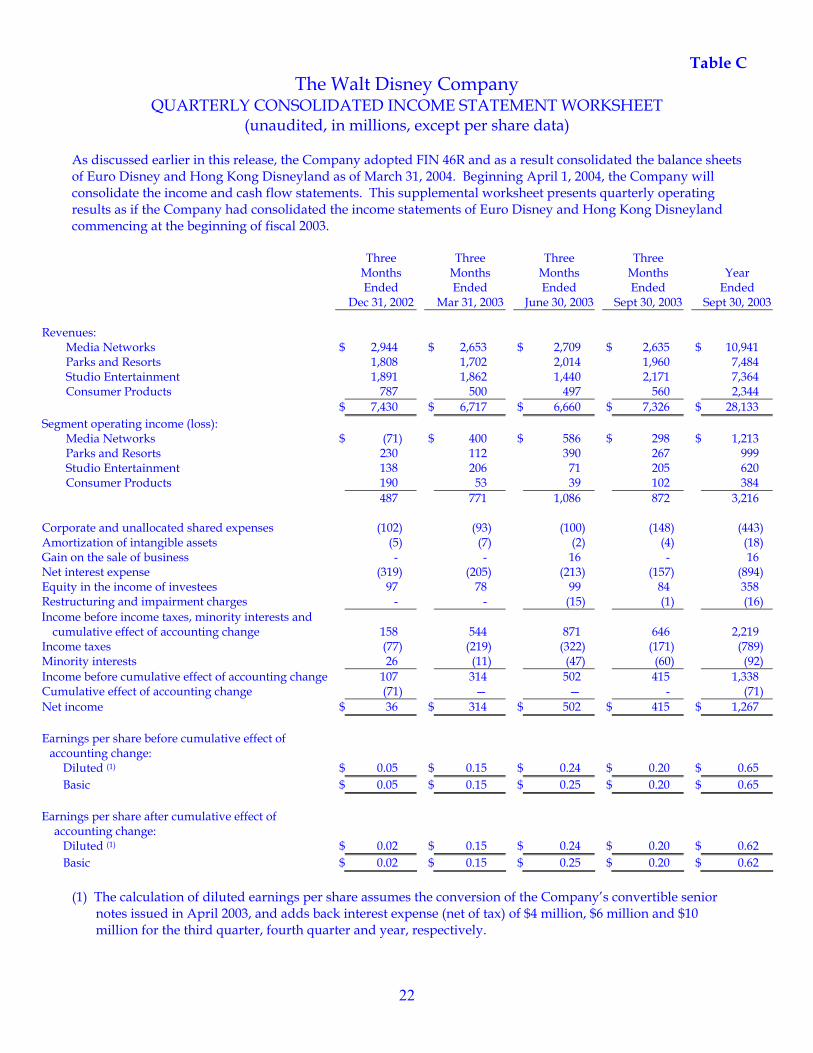
Table C The Walt Disney Company
QUARTERLY CONSOLIDATED INCOME STATEMENT WORKSHEET (unaudited, in millions, except per share data)
As discussed earlier in this release, the Company adopted FIN 46R and as a result consolidated the balance sheets of Euro Disney and Hong Kong Disneyland as of March 31, 2004. Beginning April 1, 2004, the Company will consolidate the income and cash flow statements. This supplemental worksheet presents quarterly operating results as if the Company had consolidated the income statements of Euro Disney and Hong Kong Disneyland commencing at the beginning of fiscal 2003.
Three Months Ended
Dec 31, 2002
Three Months Ended
Mar 31, 2003
Three Months Ended
June 30, 2003
Three Months Ended
Sept 30, 2003
Year
Ended Sept 30, 2003
Revenues: Media Networks $ 2,944 $ 2,653 $ 2,709 $ 2,635 $ 10,941 Parks and Resorts 1,808 1,702 2,014 1,960 7,484 Studio Entertainment 1,891 1,862 1,440 2,171 7,364 Consumer Products 787 500 497 560 2,344 $ 7,430 $ 6,717 $ 6,660 $ 7,326 $ 28,133 Segment operating income (loss): Media Networks $ (71) $ 400 $ 586 $ 298 $ 1,213 Parks and Resorts 230 112 390 267 999 Studio Entertainment 138 206 71 205 620 Consumer Products 190 53 39 102 384 487 771 1,086 872 3,216 Corporate and unallocated shared expenses (102) (93) (100) (148) (443) Amortization of intangible assets (5) (7) (2) (4) (18) Gain on the sale of business - - 16 - 16 Net interest expense (319) (205) (213) (157) (894) Equity in the income of investees 97 78 99 84 358 Restructuring and impairment charges - - (15) (1) (16) Income before income taxes, minority interests and
cumulative effect of accounting change 158 544 871 646
2,219 Income taxes (77) (219) (322) (171) (789) Minority interests 26 (11) (47) (60) (92) Income before cumulative effect of accounting change 107 314 502 415 1,338 Cumulative effect of accounting change (71) — — - (71) Net income $ 36 $ 314 $ 502 $ 415 $ 1,267 Earnings per share before cumulative effect of
accounting change:
Diluted (1) $ 0.05 $ 0.15 $ 0.24 $ 0.20 $ 0.65 Basic $ 0.05 $ 0.15 $ 0.25 $ 0.20 $ 0.65
Earnings per share after cumulative effect of
accounting change:
Diluted (1) $ 0.02 $ 0.15 $ 0.24 $ 0.20 $ 0.62 Basic $ 0.02 $ 0.15 $ 0.25 $ 0.20 $ 0.62
(1) The calculation of diluted earnings per share assumes the conversion of the Company’s convertible senior
notes issued in April 2003, and adds back interest expense (net of tax) of $4 million, $6 million and $10 million for the third quarter, fourth quarter and year, respectively.

23
Table C The Walt Disney Company
QUARTERLY CONSOLIDATED INCOME STATEMENT WORKSHEET - continued (unaudited, in millions, except per share data)
As discussed earlier in this release, the Company adopted FIN 46R and as a result consolidated the balance sheets of Euro Disney and Hong Kong Disneyland as of March 31, 2004. Beginning April 1, 2004, the Company will consolidate the income and cash flow statements. This supplemental worksheet presents quarterly operating results as if the Company had consolidated the income statements of Euro Disney and Hong Kong Disneyland commencing at the beginning of fiscal 2003.
Three Months Ended
Dec 31, 2003
Three Months Ended
Mar 31, 2004
Six Months Ended
Mar 31, 2004
Revenues: Media Networks $ 3,114 $ 2,846 $ 5,960 Parks and Resorts 1,944 1,940 3,884 Studio Entertainment 2,964 2,162 5,126 Consumer Products 840 512 1,352 $ 8,862 $ 7,460 $ 16,322 Segment operating income: Media Networks $ 344 $ 704 $ 1,048 Parks and Resorts 238 139 377 Studio Entertainment 458 153 611 Consumer Products 237 75 312 1,277 1,071 2,348 Corporate and unallocated shared expenses (103) (82) (185) Amortization of intangible assets (3) (2) (5) Restructuring and impairment charges — (3) (3) Net interest expense (181) (183) (364) Equity in the income of investees 113 124 237 Income before income taxes and minority interests 1,103 925 2,028 Income taxes (410) (357) (767) Minority interests (5) (31) (36) Net income $ 688 $ 537 $ 1,225 Earnings per share:
Diluted (1) $ 0.33 $ 0.26 $ 0.59 Basic $ 0.34 $ 0.26 $ 0.60
(1) The calculation of diluted earnings per share assumes the conversion of the Company’s convertible senior
notes issued in April 2003, and adds back interest expense (net of tax) of $5 million, $5 million and $10 million for the first quarter, second quarter and six months ended March 31, 2004, respectively.

24
Table D The Walt Disney Company
CONDENSED CONSOLIDATING BALANCE SHEET WORKSHEET (unaudited, in millions, except per share data)
As discussed earlier in this release, the Company adopted FIN 46R and as a result consolidated the balance sheets of Euro Disney and Hong Kong Disneyland as of March 31, 2004. This supplemental worksheet presents the condensed consolidating balance sheet of the Company, reflecting the impact of consolidating the balance sheets of Euro Disney and Hong Kong Disneyland as of March 31, 2004.
TWDC before Euro Disney
and Hong Kong Disneyland
Euro Disney, Hong Kong
Disneyland and Adjustments TWDC
Cash and cash equivalents $ 2,874 $ 274 $ 3,148 Other current assets 7,418 182 7,600 Total current assets 10,292 456 10,748 Investments 1,880 (624) 1,256 Fixed assets 12,500 3,778 16,278 Intangible assets 2,775 — 2,775 Goodwill 16,966 — 16,966 Other assets 7,002 71 7,073 Total assets $ 51,415 $ 3,681 $ 55,096 Current portion of borrowings(1) $ 3,092 $ 2,262 $ 5,354 Other current liabilities 6,742 680 7,422 Total current liabilities 9,834 2,942 12,776 Borrowings 9,577 384 9,961 Deferred income taxes 2,894 — 2,894 Other long-term liabilities 3,836 136 3,972 Minority interest 514 219 733 Shareholders' equity 24,760 — 24,760 Total liabilities and shareholders' equity $ 51,415 $ 3,681 $ 55,096
__________ (1) All of Euro Disney's borrowings are classified as current as they are subject to acceleration if an
agreement with their lenders and the Company is not achieved by May 31, 2004. Management believes that recognition of additional liabilities as a result of consolidating Euro Disney and
Hong Kong Disneyland does not result in any incremental increase in the level of claims on the general assets of the Company and its other subsidiaries; rather, they represent claims against the additional assets recognized by the Company as a result of the consolidations. Conversely, we believe that additional assets recognized as a result of consolidating Euro Disney and Hong Kong Disneyland do not represent additional assets of the Company that could be used to satisfy claims by the creditors of the Company and its other subsidiaries.


