

For more resources on the economics of Oil & Gas, visit our dedicated Economics Blog Channel
Market volatility
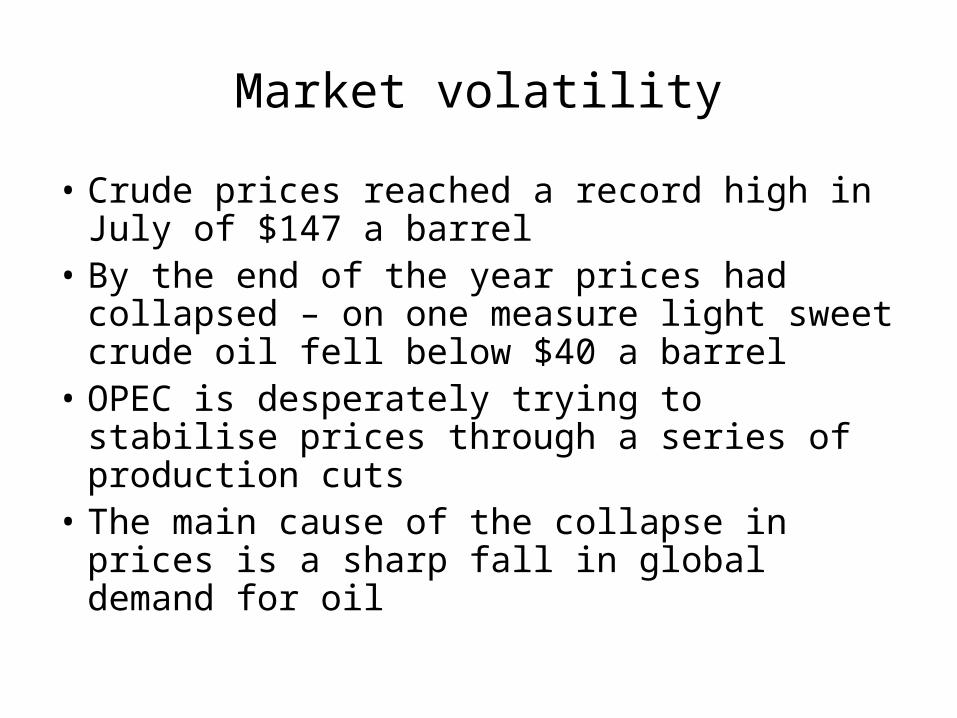
• Crude prices reached a record high in July of $147 a barrel
• By the end of the year prices had collapsed – on one measure light sweet crude oil fell below $40 a barrel
• OPEC is desperately trying to stabilise prices through a series of production cuts
• The main cause of the collapse in prices is a sharp fall in global demand for oil
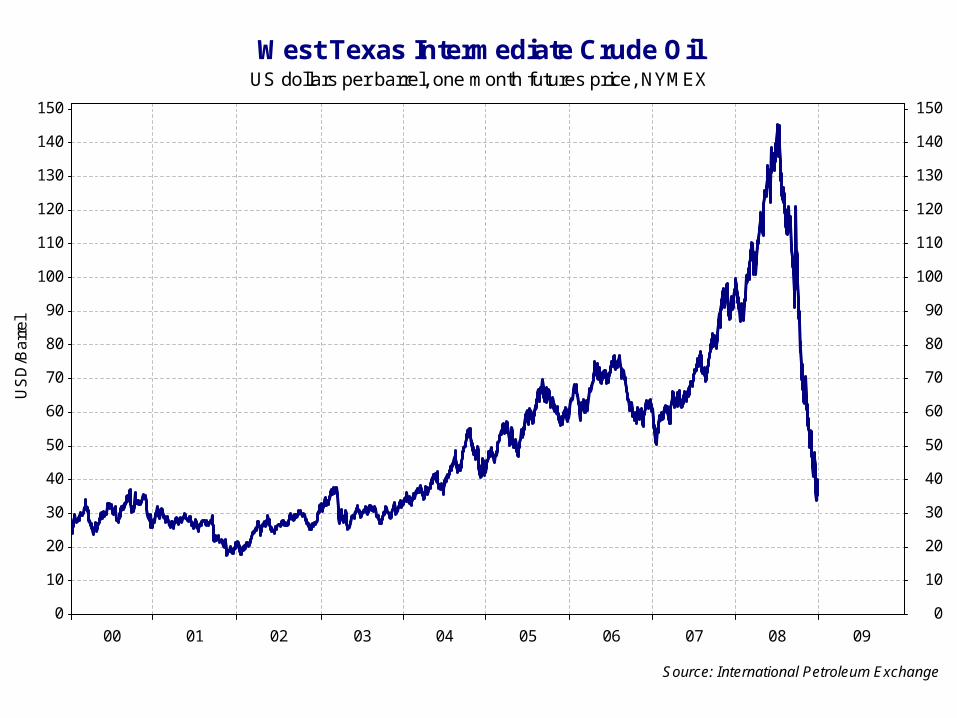
A super-spike in pricesUS dollars per barrel, one month futures price, NYMEX
West Texas Intermediate Crude Oil
Source: International Petroleum Exchange
00 01 02 03 04 05 06 07 08 09
0
10
20
30
40
50
60
70
80
90
100
110
120
130
140
150
US
D/B
arr
el
0
10
20
30
40
50
60
70
80
90
100
110
120
130
140
150
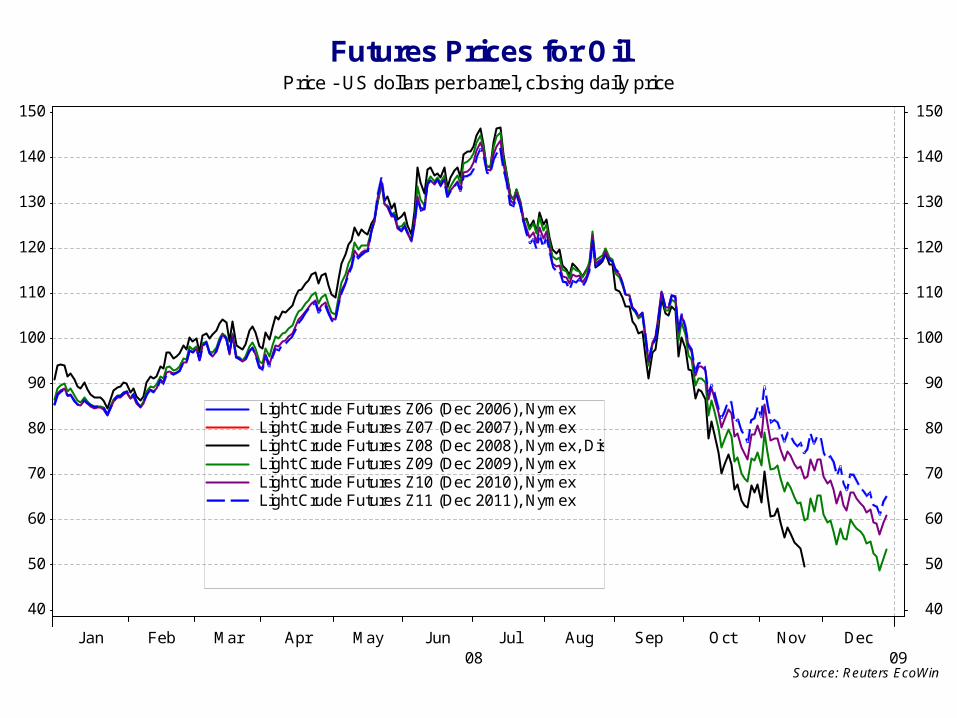
Where next?Price - US dollars per barrel, closing daily price
Futures Prices for Oil
Source: Reuters EcoWin
Jan08
Feb Mar Apr May Jun Jul Aug Sep Oct Nov Dec09
40
50
60
70
80
90
100
110
120
130
140
150
40
50
60
70
80
90
100
110
120
130
140
150
Light Crude Futures Z06 (Dec 2006), Nymex Light Crude Futures Z07 (Dec 2007), Nymex Light Crude Futures Z08 (Dec 2008), Nymex, Discontinued Light Crude Futures Z09 (Dec 2009), Nymex Light Crude Futures Z10 (Dec 2010), Nymex Light Crude Futures Z11 (Dec 2011), Nymex

Oil – a case study in price volatility
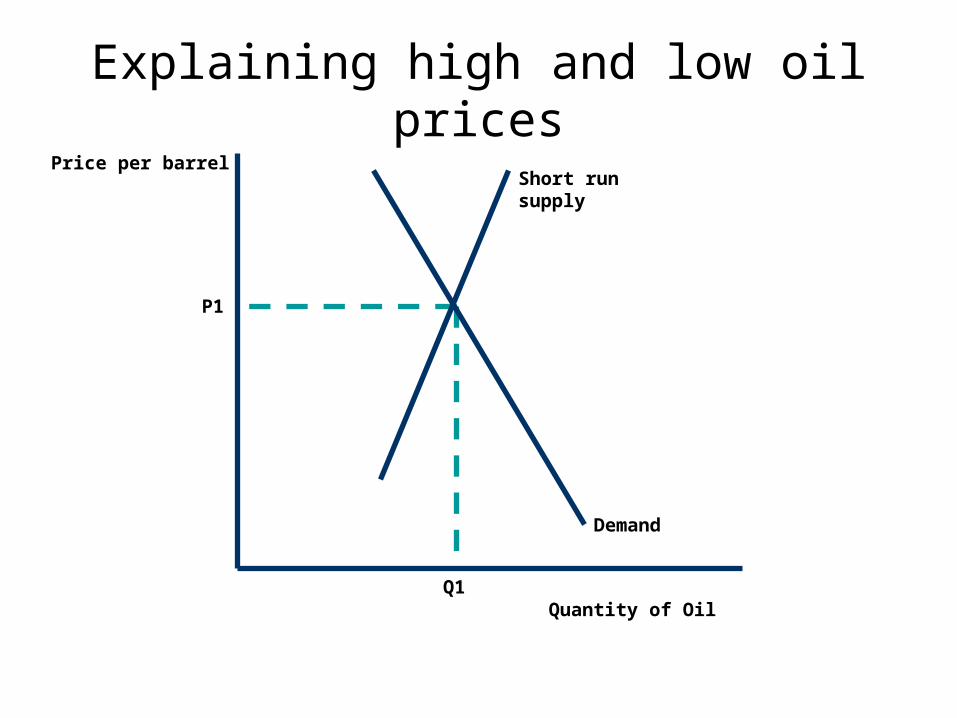
Explaining high and low oil prices
Quantity of Oil
Price per barrelShort run supply
Demand
P1
Q1

Explaining high and low oil prices
Quantity of Oil
Price per barrelShort run supply
Demand
P1
Q1
D2
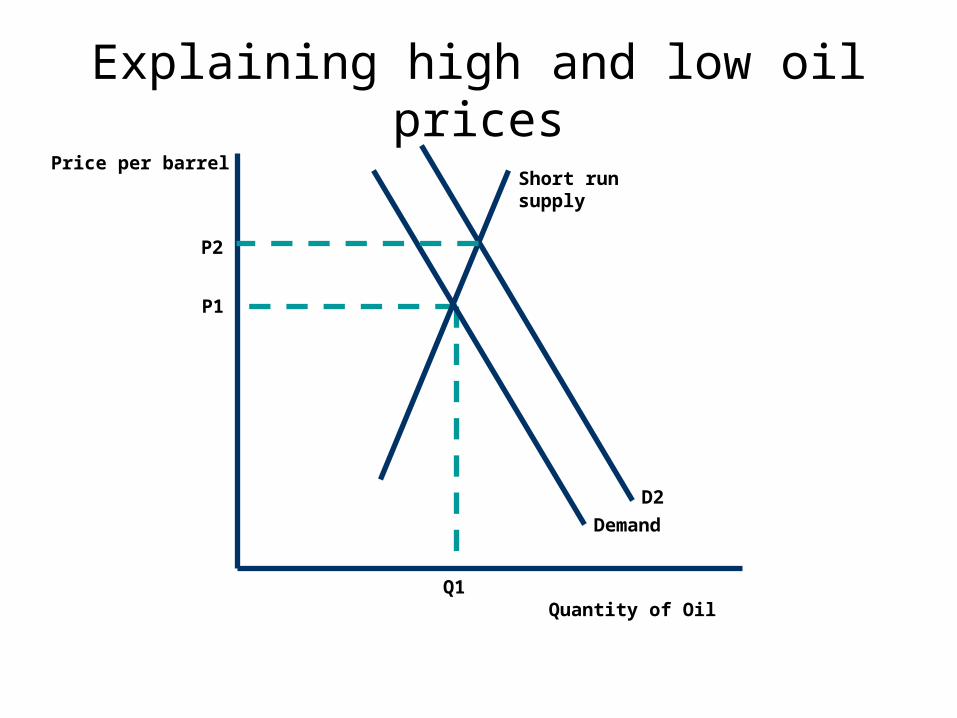
Explaining high and low oil prices
Quantity of Oil
Price per barrelShort run supply
Demand
P1
Q1
D2
P2
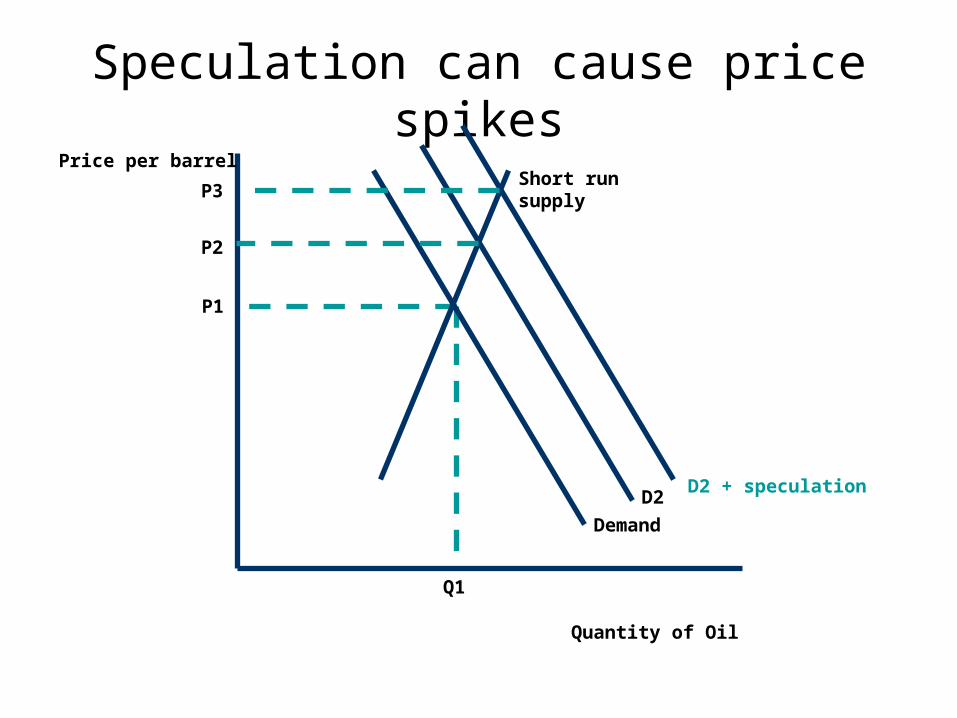
Speculation can cause price spikes
Short run supply
Demand
P1
Q1
D2D2 + speculation
P2
P3
Quantity of Oil
Price per barrel

Supply more responsive over time……
Short run supply
Demand
P1
Q1
D2D2 + speculation
P2
P3
Medium term supply
P4
Quantity of Oil
Price per barrel
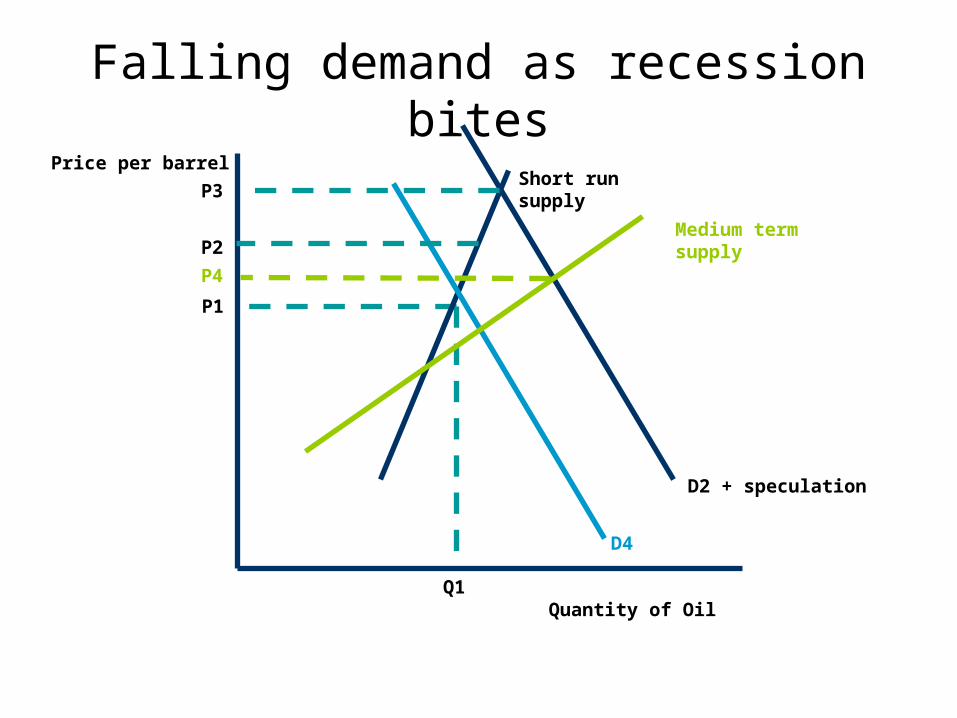
Falling demand as recession bites
Short run supply
D4
P1
Q1
D2 + speculation
P2
P3
Medium term supply
P4
Quantity of Oil
Price per barrel
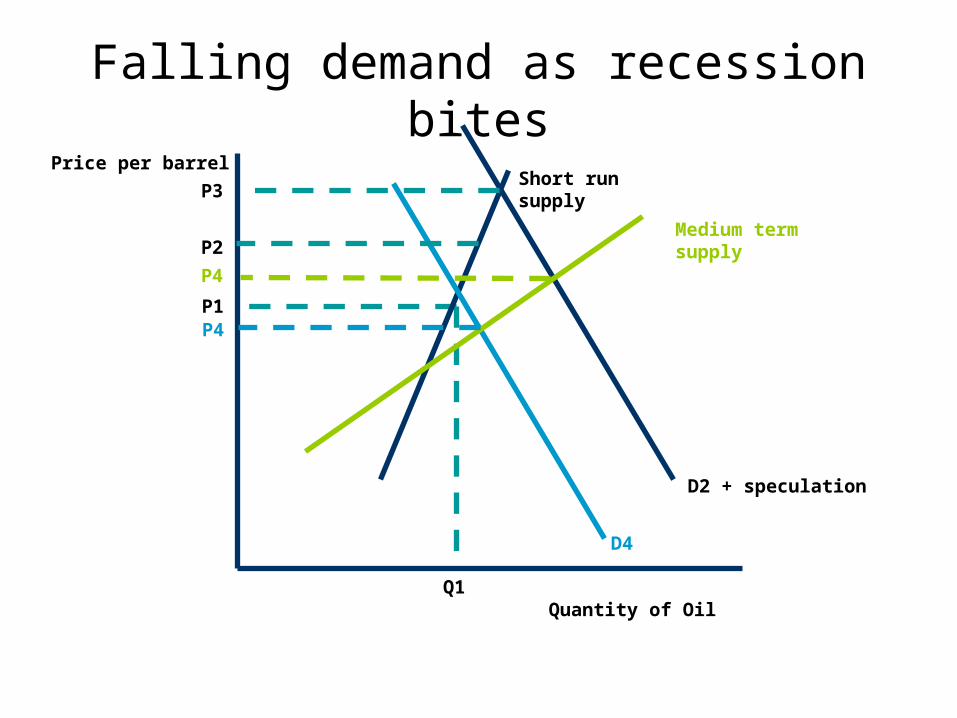
Falling demand as recession bites
Short run supply
D4
P1
Q1
D2 + speculation
P2
P3
Medium term supply
P4
P4
Quantity of Oil
Price per barrel
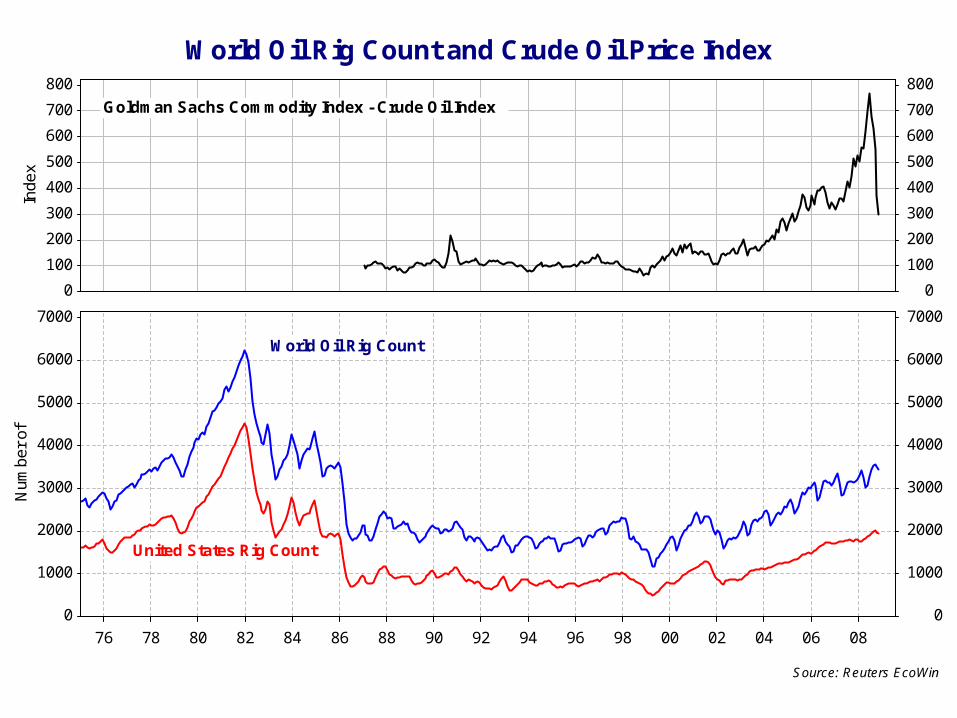
Oil prices and the number of rigsWorld Oil Rig Count and Crude Oil Price Index
Source: Reuters EcoWin
76 78 80 82 84 86 88 90 92 94 96 98 00 02 04 06 08
0
1000
2000
3000
4000
5000
6000
7000
Nu
mb
er
of
0
1000
2000
3000
4000
5000
6000
7000
United States Rig Count
World Oil Rig Count
0
100
200
300
400
500
600
700
800
Ind
ex
0
100
200
300
400
500
600
700
800
Goldman Sachs Commodity Index - Crude Oil Index

Will OPEC succeed in cutting output and stabilising prices?
Barrels per day (million)
OPEC Oil Production
Source: Reuters EcoWin
01 02 03 04 05 06 07 08
mill
ion
s
26
27
28
29
30
31
32
33
34
35
Ba
rre
l/Da
y (m
illio
ns)
26
27
28
29
30
31
32
33
34
35
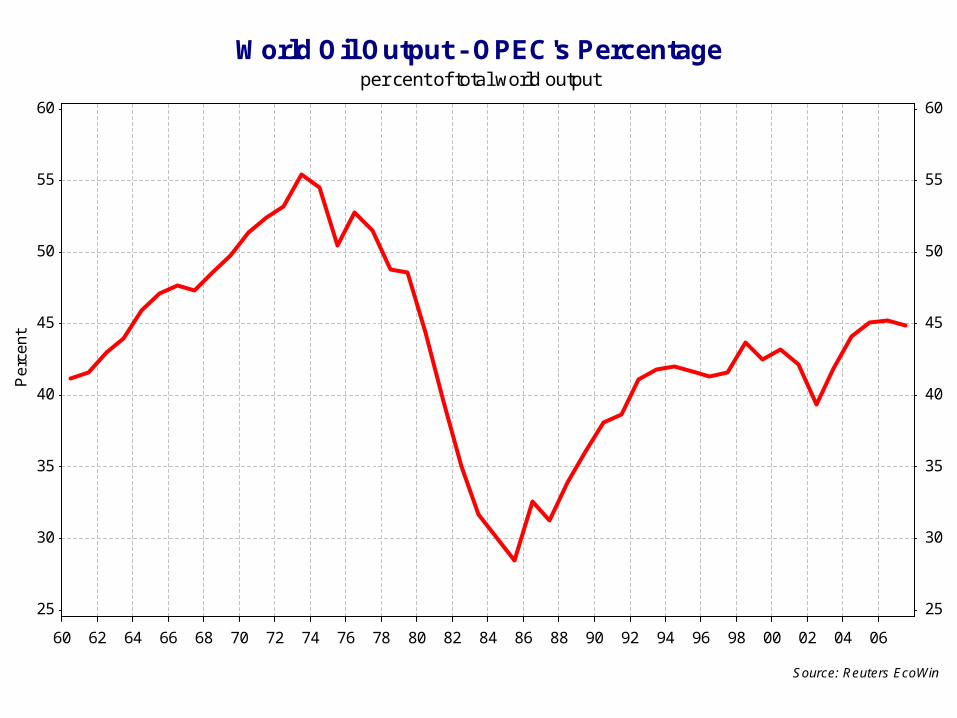
OPEC’s share of world supplyper cent of total world output
World Oil Output - OPEC's Percentage
Source: Reuters EcoWin
60 62 64 66 68 70 72 74 76 78 80 82 84 86 88 90 92 94 96 98 00 02 04 06
25
30
35
40
45
50
55
60
Pe
rce
nt
25
30
35
40
45
50
55
60
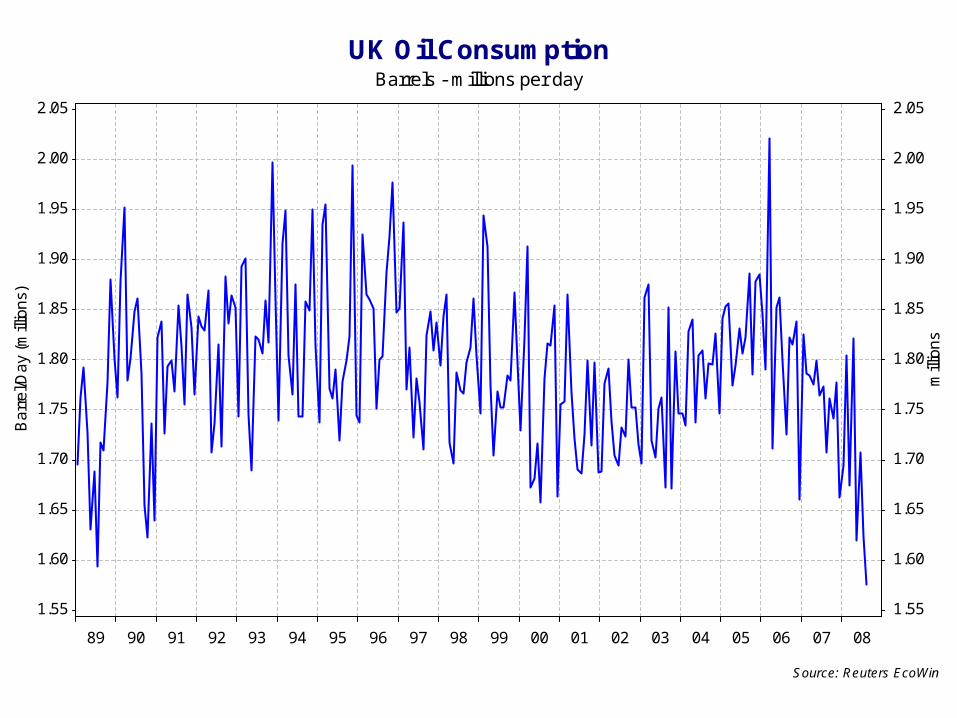
UK oil consumption now at a twenty year low
Barrels - millions per day
UK Oil Consumption
Source: Reuters EcoWin
89 90 91 92 93 94 95 96 97 98 99 00 01 02 03 04 05 06 07 08
mill
ion
s
1.55
1.60
1.65
1.70
1.75
1.80
1.85
1.90
1.95
2.00
2.05
Ba
rre
l/Da
y (m
illio
ns)
1.55
1.60
1.65
1.70
1.75
1.80
1.85
1.90
1.95
2.00
2.05

Oil producers – selected countriesMillions of barrels per day
Oil Production - Selected Countries
Saudi Arabia Russia United Arab Emirates Nigeria IranSource: Reuters EcoWin
01 02 03 04 05 06 07 08
mill
ion
s
1
2
3
4
5
6
7
8
9
10
Ba
rre
l/Da
y (m
illio
ns)
1
2
3
4
5
6
7
8
9
10 Saudi Arabia 9.4MRussia 9.4058MUnited Arab Emirates 2.710724MNigeria 2.21MIran 4.1M
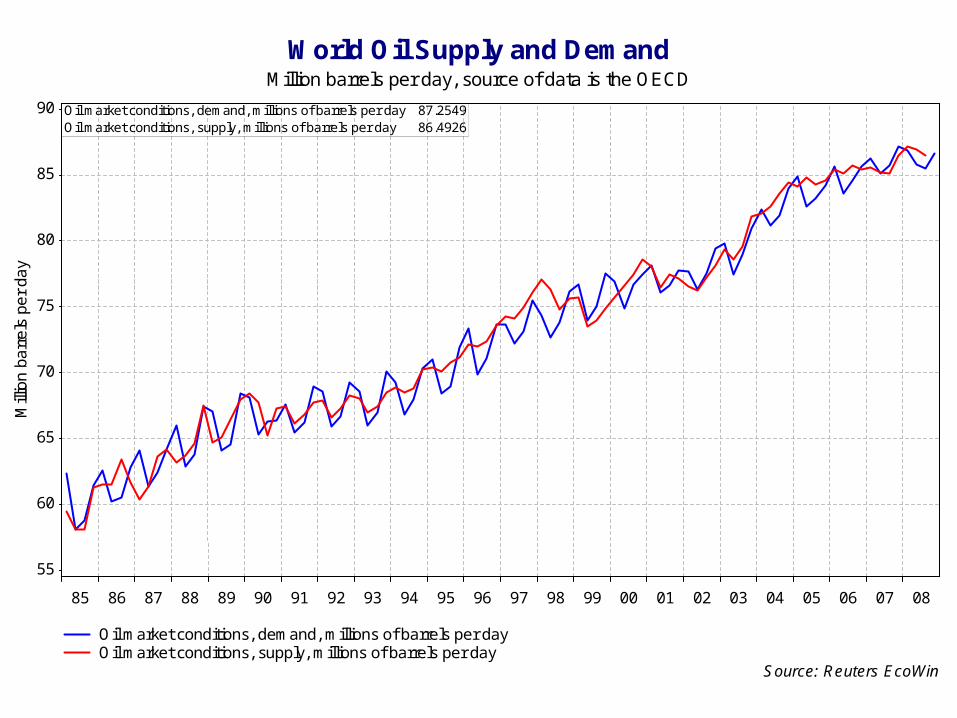
How much will world demand fall in 2009?Million barrels per day, source of data is the OECD
World Oil Supply and Demand
Oil market conditions, demand, millions of barrels per day Oil market conditions, supply, millions of barrels per day
Source: Reuters EcoWin
85 86 87 88 89 90 91 92 93 94 95 96 97 98 99 00 01 02 03 04 05 06 07 08
Mill
ion
ba
rre
ls p
er
da
y
55
60
65
70
75
80
85
90 Oil market conditions, demand, millions of barrels per day 87.2549Oil market conditions, supply, millions of barrels per day 86.4926
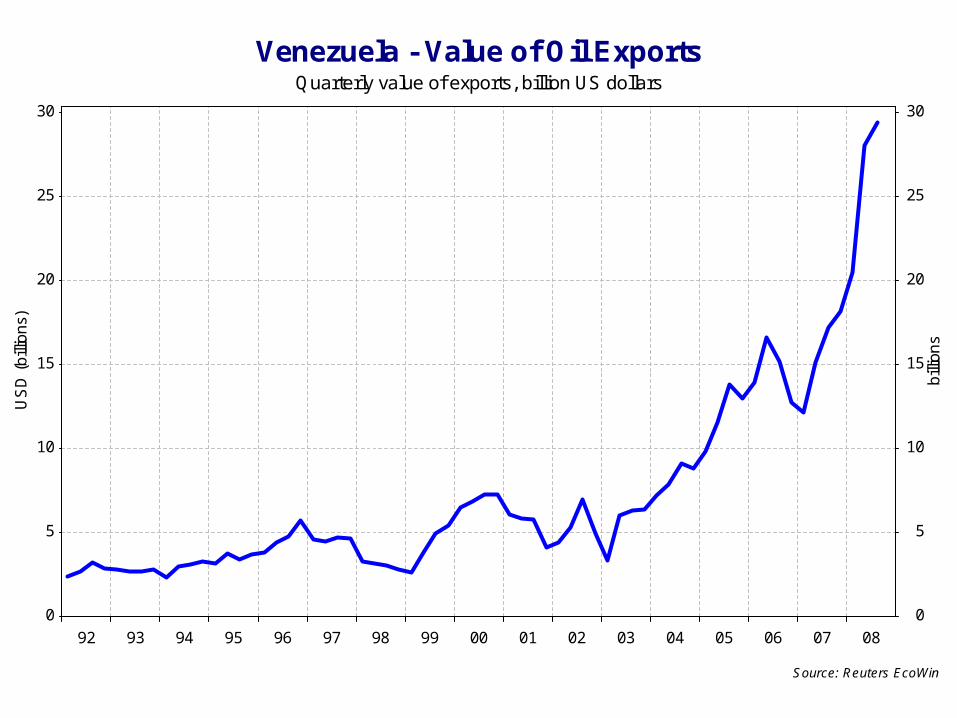
Oil provides a bonanza for someQuarterly value of exports, billion US dollars
Venezuela - Value of Oil Exports
Source: Reuters EcoWin
92 93 94 95 96 97 98 99 00 01 02 03 04 05 06 07 08
bill
ion
s
0
5
10
15
20
25
30
US
D (
bill
ion
s)
0
5
10
15
20
25
30

The UK is now a net oil importerTrade Balance £bn and Brent Crude ($s per barrel)
UK Trade in Oil and Brent Crude Oil Price
Source: Reuters EcoWin
97 98 99 00 01 02 03 04 05 06 07
10
20
30
40
50
60
70
80
90
100
US
D/B
arr
el
10
20
30
40
50
60
70
80
90
100
Annual average price for Brent crude oil
bill
ion
s
-5-4-3-2-101234567
GB
P (
bill
ion
s)
-5-4-3-2-101234567
Annual UK balance of trade in oil
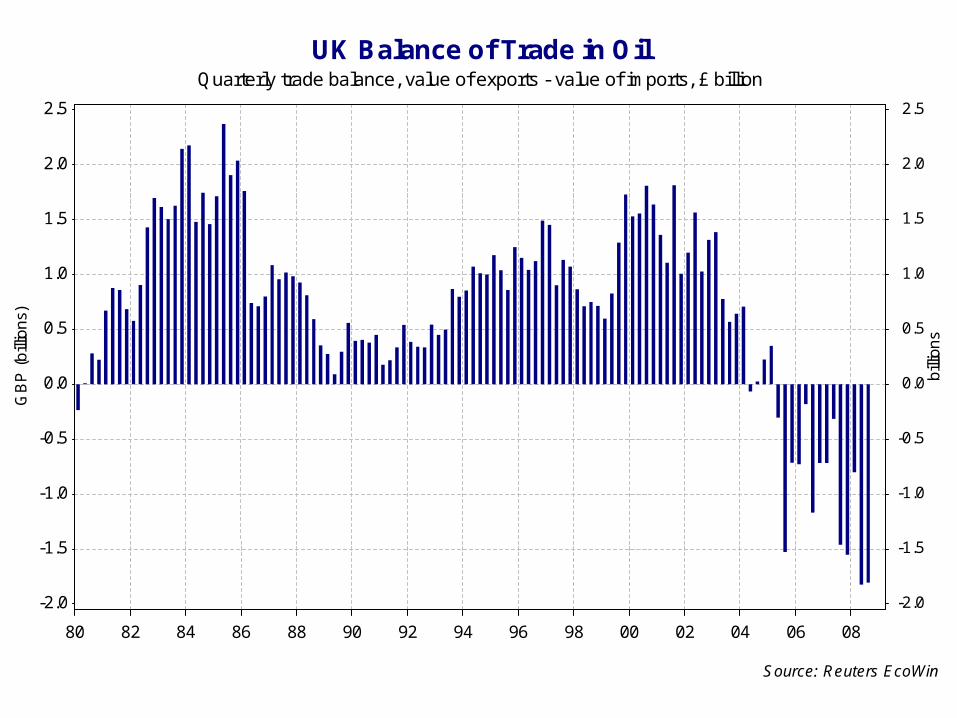
UK quarterly balance of trade in oilQuarterly trade balance, value of exports - value of imports, £ billion
UK Balance of Trade in Oil
Source: Reuters EcoWin
80 82 84 86 88 90 92 94 96 98 00 02 04 06 08
bill
ion
s
-2.0
-1.5
-1.0
-0.5
0.0
0.5
1.0
1.5
2.0
2.5
GB
P (
bill
ion
s)
-2.0
-1.5
-1.0
-0.5
0.0
0.5
1.0
1.5
2.0
2.5
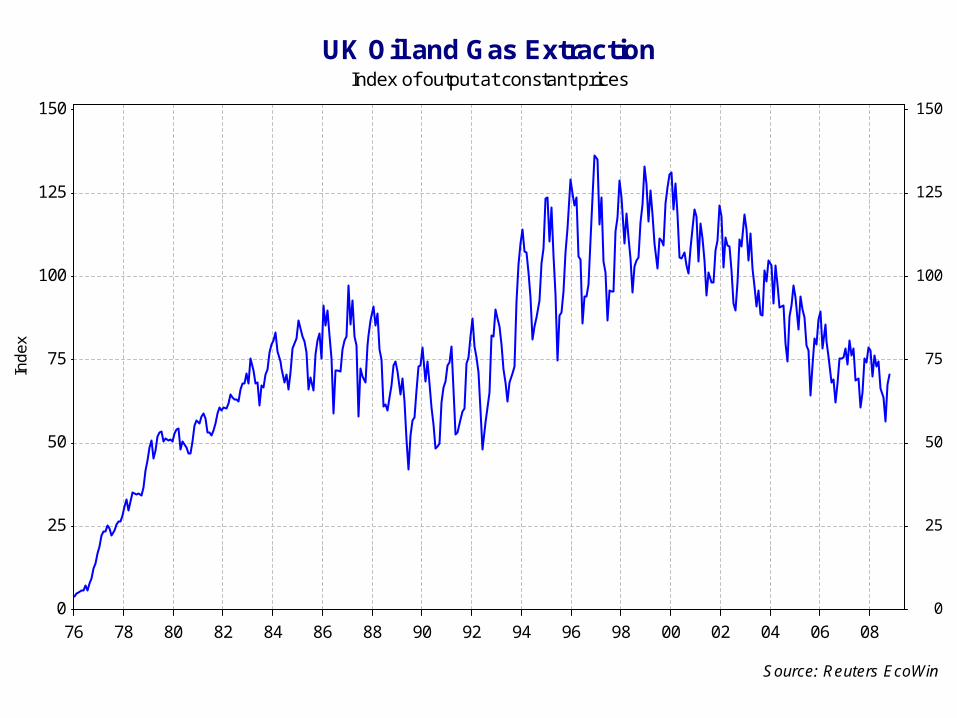
And North Sea oil output is well beyond the peak
Index of output at constant prices
UK Oil and Gas Extraction
Source: Reuters EcoWin
76 78 80 82 84 86 88 90 92 94 96 98 00 02 04 06 08
0
25
50
75
100
125
150
Ind
ex
0
25
50
75
100
125
150
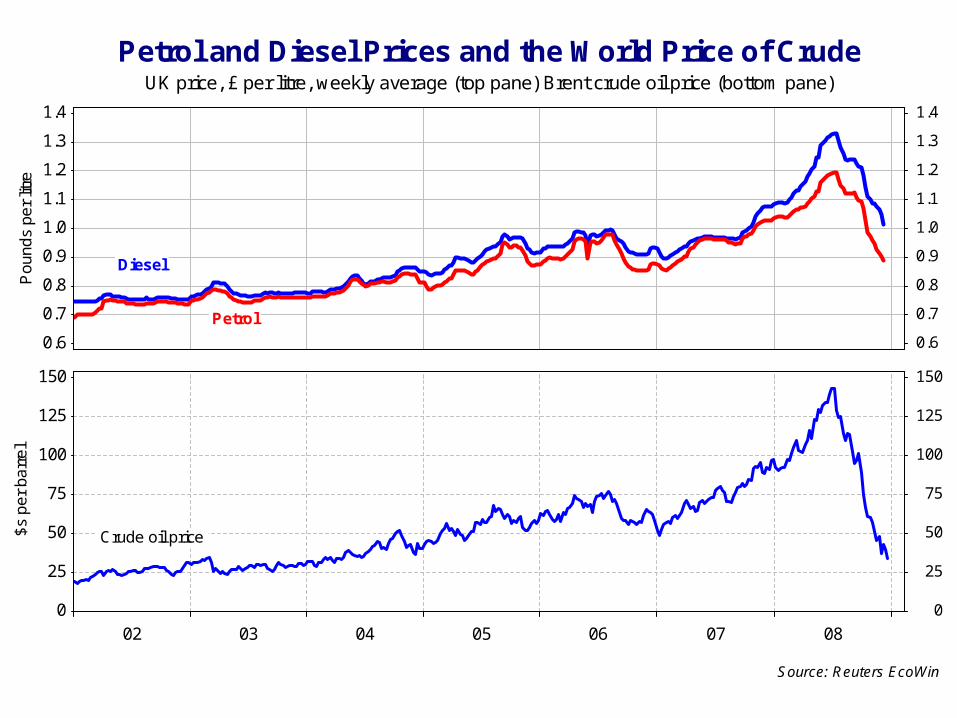
Crude prices and prices at the pumpsUK price, £ per litre, weekly average (top pane) Brent crude oil price (bottom pane)
Petrol and Diesel Prices and the World Price of Crude
Source: Reuters EcoWin
02 03 04 05 06 07 08
0
25
50
75
100
125
150
$s
pe
r b
arr
el
0
25
50
75
100
125
150
Crude oil price
0.6
0.7
0.8
0.9
1.0
1.1
1.2
1.3
1.4
Po
un
ds
pe
r lit
re
0.6
0.7
0.8
0.9
1.0
1.1
1.2
1.3
1.4
Petrol
Diesel
Marginal and average cost
• It has been estimated that the average cost of oil per barrel is around $50
• And that the marginal cost of bringing on additional output is between $75-$80 per barrel
• Explain some of the reasons why there is a difference between the marginal and average cost of production.

Oil Market Videos
• OPEC agrees record oil output cut
• Russia rues oil price fall
• Oil prices fall below $50 per barrel
• Oil price affects crayon firm
• High oil prices lifts BP profits
• New battle over Arctic oil
• Why High Oil Prices Hits Us All


