
THERMAL COMFORT STUDY FOR STUDENT LABORATORY
MOHD HILMAN BIN KAMARUZAMAN
UNIVERSITI TEKNIKAL MALAYSIA MELAKA

THERMAL COMFORT STUDY FOR STUDENT LABORATORY
MOHD HILMAN BIN KAMARUZAMAN
This report is submitted as partial requirement for the completion of the Bachelor of
Mechanical Engineering (Thermal Fluids) Degree Program
Faculty of Mechanical Engineering
Universiti Teknikal Malaysia Melaka
JUNE 2013
SUPERVISOR DECLARATION
“I hereby declare that I have read this thesis and in my opinion this report is sufficient in terms
of scope and quality for the award of the degree of Bachelor of Mechanical Engineering
(Thermal Fluids)”.
Signature: …………………………
Supervisor: …………………………
Date: …………………………
DECLARATION
“I hereby declare that the work in this report is my own except for summaries and quatations
which have been duly acknowledge.”
Signature: …………………………
Author: …………………………
Date: …………………………
i
ABSTRACT
Thermal comfort can be defined as a state of mind that expresses satisfaction
toward the surrounding thermal environment. There are several parameters that can
affect a persons’ perception in terms of thermal comfort mark. European Standard ISO
7730 stated that thermal comfort is a combination of four environmental parameters
such as air temperature, relative humidity, air velocity, and mean radiant temperature,
and plus two personal factors that is clothing (the clothes that occupants wear during the
experiment being conducted) and metabolic rate (the activity of occupants during the
experiment). This study aims on measurement of thermal comfort at faculty mechanical
engineering laboratory. There are two different laboratories that will be conducted in this
experiment, one with an air-conditioning system where as another one with no air-
conditioning system. The procedure to determine occupants’ responses toward thermal
comfort in student laboratory is through observation method associated with a survey.
Measurement of actual thermal comfort in student laboratory is accomplished through
technical measurement associated with a thermal comfort monitor and correlation of
Predicted Thermal Votes (PTVc), Predicted Airflow (PAF), Preferred Airflow (PRAF),
Skin Dryness (SD) and etc. The result for experimental laboratory with air conditioning
system is 23.4:C to 23.9:C, relative humidity of 58.2% to 60.1%, and air velocity of
0.01 m/s to 0.08 m/s. Whereas fabrication laboratory with no air conditioning system
recorded a temperature of 31.3:C to 32.9:C, relative humidity of 63.6% to 68.7%, and air
velocity of 0.13 m/s and 0.34 m/s.
ii
ABSTRAK
Keselesaan termal boleh ditakrifkan sebagai keadaan minda yang menyatakan
kepuasan terhadap persekitaran termal. Terdapat beberapa parameter yang boleh
menjejaskan persepsi seseorang terhadap keselesaan termal. Piawaian Eropah ISO 7730
menyatakan bahawa keseleasaan termal adalah gabungan empat parameter alam sekitar,
contohnya ialah suhu udara, kelembapan relatif, halaju udara, dan bermakna suhu
berseri, dan digabungkan dengan dua faktor tamabahan iaitu cara pemakaian individu
semasa eksperimen dijalankan dan jumlah aktiviti yang dilakukan semasa eksperimen
dijalankan. Kajian ini bertujuan untuk mengukur tahap keselesaan termal di Makmal
Fakulti Kejuruteraan Mekanikal. Dua makmal telah dipilh sebagai kes kajian untuk
projek ini. Satu menggunakan sistem penyejukan udara manakala makmal yang satu lagi
tidak mengunakan sistem penyejukan. Kaedah untuk menentukan jawapan penilai ke
arah keselesaan termal dalam makmal pelajar adalah melalui kaedah pemerhatian
dibantu dengan kaji selidik. Pengukuran keselesaan sebenar haba dalam makmal pelajar
dicapai melalui pengukuran lurus teknikal berkaitan dengan monitor keselesaan terma
dan analisis sebagai Undian Anggaran Termal (PTVc), Aliran Udara Aggaran (PAF),
Aliran Udara Pilihan (PRAF), Kekeringan Kulit (SD) dan sebagainya. Makmal ujikaji
menggunakan sistem penyejukan udara mencatatkan suhu pada 23.4:C sehingga 23.9:C,
kelembapan udara 58.2% sehingga 60.1%, kelajuan udara 0.01 m/s sehingga 0.08 m/s.
manakala untuk makmal fabrikasi tidak menggunakan sistem penyejukan udara
mencatatkan suhu 31.3:C sehingga 32.9:C, kelembapan udara 63.6% sehingga 68.7%
dan kelajuan udara 0.13 m/s sehingga 0.34 m/s
iii
DEDICATION
For my beloved mother and father.
iv
ACKNOWLEDGEMENTS
I sincerely like to express my gratitude to those who have helped me during my
final year project in some ways or another. I owe the accomplishment in this project to
them. First and foremost, my deep appreciation to my supervisor, Engr. Dr. Tee Boon
Tuan for his excellent supervision, invaluable guidance, trust, advice and constant help,
support, encouragement, and assistance towards me throughout this project.
My gratitude also goes towards the technicians at FKM workshop, who always
show their sincere kindness in helping and gave me useful information especially in
related to thermal comfort toward this project.
Lastly, I would like to say thanks to my family whose endless encouragement
and support gave me added strength and inspiration to carry out this project to the best
of my ability. At the same time, I would like to thank my friends for haring their ideas
and comments in order to accomplish my project.
v
TABLE OF CONTENTS
NO ITEMS PAGE
Abstract i
Abstrak ii
Dedication iii
Acknowledgements iv
Table of Contents v
List of Figures ix
List of Tables xi
List of Abbreviations, Symbols, Specialized Nomenclature xii
List of Appendix xiii
1.0 INTRODUCTION
1.1 Background of Study 1
1.1.1 Relationship Between Student Laboratory And Thermal
Comfort
2
1.2 Problem Statements 3
1.3 Objectives 4

vi
1.4 Scope and Limitation of Project 5
1.5 Potential Benefits of Study 5
1.6 Project Outline 6
1.6.1 Determination of the Occupants’ Responses regarding to Thermal
Comfort at Classroom
6
1.6.2 Measurement of Actual Thermal Comfort at laboratory 7
1.7 Structure of the Report 7
2.0 LITERATURE REVIEW
2.1 Introduction to Thermal Comfort 8
2.1.1 Factors Affecting Thermal Comfort 9
2.1.2 Predicted Mean Vote (PMV) and Predicted Percentage
Dissatisfied (PPD) scales
14
2.2 Methods and Tools Used for Thermal Comfort Study 16
2.2.1 Observation Method 16
2.2.1.1 Human Thermal Comfort Survey by using Questionnaire
Tool
16
2.2.1.2 Quantitative Survey by using Interview Tool 17
2.2.2 Direct Measurement Method 18
2.2.2.1 Direct Measurement by using the anemometer 18
2.3 Previous Study Related to Thermal Comfort 19
2.4 Summary of Literature Review 24
3.0 METHODOLOGY
3.1 Student Laboratory 26
3.2 Instrumentation 26
3.2.1 Room Physical Data Measurement 26
3.2.2 Indoor Air Parameters Measurement 27
vii
3.2.3 Thermal Comfort Questionnaire 28
3.3 Experimental Procedures 28
3.4 Overall Structure of the Methods 29
3.5 Analysis Methods 31
3.5.1 Questionnaire Vote Analysis 31
3.5.2 Thermal Comfort Result Analysis 32
3.6 Experimental Condition Assumptions 34
4.0 RESULTS ANALYSIS
4.1 Result of Actual Measurement 36
4.1.1 Result of Actual Measurement for Experimental Laboratory 36
4.1.2 Result of Actual Measurement for Fabrication Laboratory 37
4.2 Comparison between ASHRAE Standard 55-2004 with Each Zone 39
4.2.1 Comparison between ASHRAE Standard 55-2004 with Each
Zone for Experimental Laboratory
39
4.2.2 Comparison between ASHRAE Standard 55-2004 with Each
Zone for Fabrication Laboratory
42
4.3 Thermal Comfort Analysis 46
4.3.1 Subject Analysis for Experimental Laboratory 46
4.3.2 Subject Analysis for Fabrication Laboratory 47
4.4 Thermal Comfort Vote Analysis 48
4.4.1 Thermal Comfort Mean Vote Analysis for Experimental
Laboratory
48
4.4.2 Thermal Comfort Mean Vote Analysis for Fabrication Laboratory 49
4.4.3 Summary for Thermal Comfort Mean Vote Analysis 49
4.5 Linear Regression Equation Analysis 50
4.5.1 Linear Regression Analysis for Experimental Laboratory 51

viii
4.5.2 Linear Regression Analysis for Fabrication Laboratory 52
4.5.3 Summary Linear Regression and Thermal Comfort Analysis 52
5.0 DISCUSSION AND CONCLUSION
5.1 Discussion 54
5.1.1 Actual Air Properties Measurement 55
5.1.2 Thermal Comfort Analysis 56
5.2 Conclusion 58
5.3 Problem in Study 60
5.4 Recommendation for Future Study 61
REFERENCES 62
APPENDIX 65
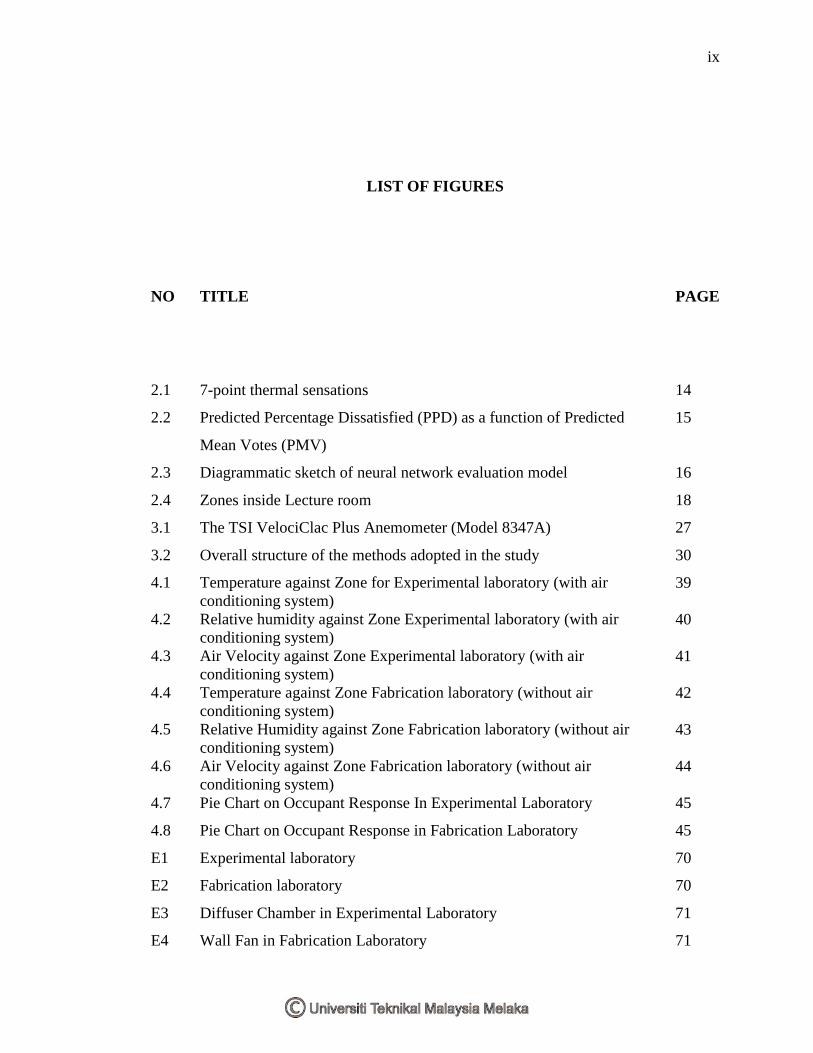
ix
LIST OF FIGURES
NO TITLE PAGE
2.1 7-point thermal sensations 14
2.2 Predicted Percentage Dissatisfied (PPD) as a function of Predicted
Mean Votes (PMV)
15
2.3 Diagrammatic sketch of neural network evaluation model 16
2.4 Zones inside Lecture room 18
3.1 The TSI VelociClac Plus Anemometer (Model 8347A) 27
3.2 Overall structure of the methods adopted in the study 30
4.1 Temperature against Zone for Experimental laboratory (with air
conditioning system)
39
4.2 Relative humidity against Zone Experimental laboratory (with air
conditioning system)
40
4.3 Air Velocity against Zone Experimental laboratory (with air
conditioning system)
41
4.4 Temperature against Zone Fabrication laboratory (without air
conditioning system)
42
4.5 Relative Humidity against Zone Fabrication laboratory (without air
conditioning system)
43
4.6 Air Velocity against Zone Fabrication laboratory (without air
conditioning system)
44
4.7 Pie Chart on Occupant Response In Experimental Laboratory 45
4.8 Pie Chart on Occupant Response in Fabrication Laboratory 45
E1 Experimental laboratory 70
E2 Fabrication laboratory 70
E3 Diffuser Chamber in Experimental Laboratory 71
E4 Wall Fan in Fabrication Laboratory 71
x
E5 Anemometer Setting 72
E6 Plan Layout for Experimental Laboratory with 20 Zones 73
E7 Plan Layout for Fabrication Laboratory with 20 Zones 74
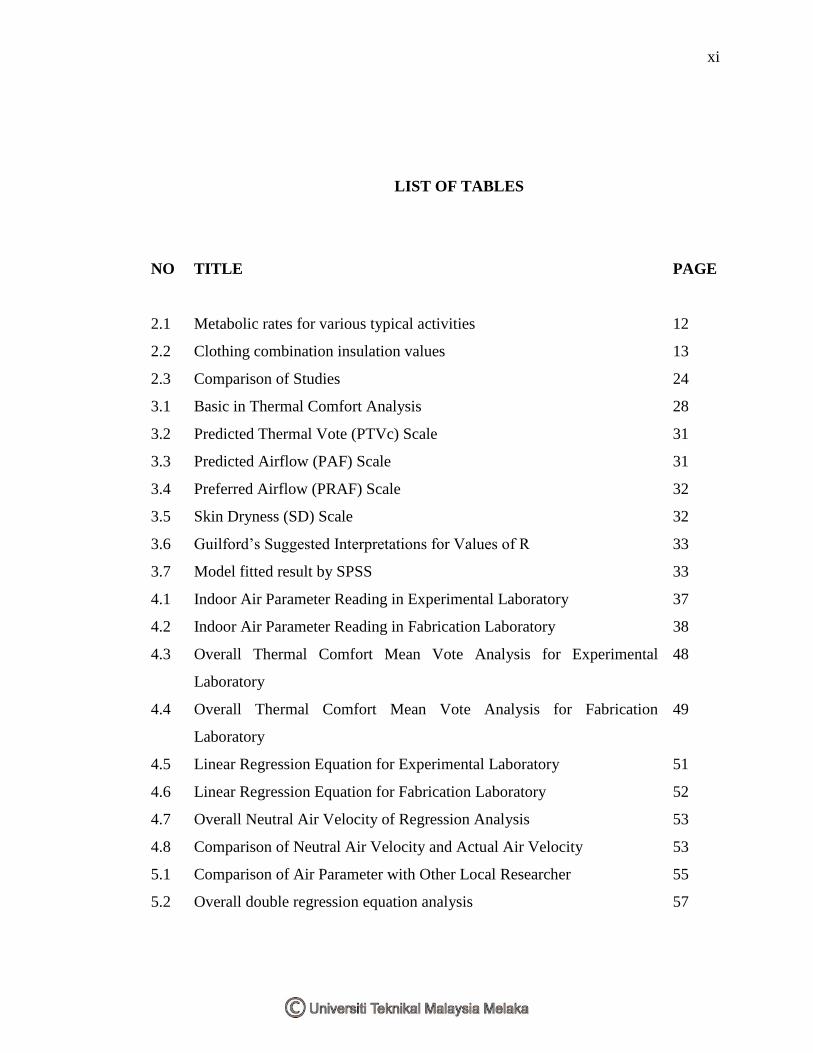
xi
LIST OF TABLES
NO TITLE PAGE
2.1 Metabolic rates for various typical activities 12
2.2 Clothing combination insulation values 13
2.3 Comparison of Studies 24
3.1 Basic in Thermal Comfort Analysis 28
3.2 Predicted Thermal Vote (PTVc) Scale 31
3.3 Predicted Airflow (PAF) Scale 31
3.4 Preferred Airflow (PRAF) Scale 32
3.5 Skin Dryness (SD) Scale 32
3.6 Guilford’s Suggested Interpretations for Values of R 33
3.7 Model fitted result by SPSS 33
4.1 Indoor Air Parameter Reading in Experimental Laboratory 37
4.2 Indoor Air Parameter Reading in Fabrication Laboratory 38
4.3 Overall Thermal Comfort Mean Vote Analysis for Experimental
Laboratory
48
4.4 Overall Thermal Comfort Mean Vote Analysis for Fabrication
Laboratory
49
4.5 Linear Regression Equation for Experimental Laboratory 51
4.6 Linear Regression Equation for Fabrication Laboratory 52
4.7 Overall Neutral Air Velocity of Regression Analysis 53
4.8 Comparison of Neutral Air Velocity and Actual Air Velocity 53
5.1 Comparison of Air Parameter with Other Local Researcher 55
5.2 Overall double regression equation analysis 57

xii
LIST OF ABBREVIATIONS, SYMBOLS, SPECIALIZED
NOMENCLATURE
ASHRAE - American Society of Heating, Refrigerating and Air Conditioning
Engineers
CATI - Computer-Assisted Telephone Interview
DB - Dry Bulb Temperature
HI - Heat Index
HVAC - Heating, Ventilating, and Air Conditioning
IPTA - Institusi Pengajian Tinggi Awam
ISO - International Organization for Standardization
NIOSH - National Institute for Occupational Safety and Health
No. - Number
NWBT - Natural Wet Bulb Temperature
PD - Percentage Dissatisfied
PhD - Doctor of Philosophy
PMV - Predicted Mean Vote
PPD - Predicted Percentage Dissatisfied
RH - Relative Humidity
UTeM - Universiti Teknikal Malaysia Melaka
WB - Wet Bulb Temperature
m - Meter
lbs - Pounds
C - Degree Celsius
e.g. - Exempli Gratia (Latin), means “For Example”

xiii
LIST OF APPENDIX
A Metabolic Rate for More Various Typical Activities
B Thermal Insulation Values for Each Clothing Separation Description
C Estimates of Energy Expenditure Rates for Various Activities
D Gantt Chart for PSM I & II
E Actual Condition in Student Laboratories
F Thermal Comfort Vote Questionnaire Form
G Linear Regression Analysis

1
CHAPTER 1
INTRODUCTION
This chapter provides background information of the study. Generally it covers
background of study, problem statements, objectives, scope and limitation of project,
potential benefits of study, project outline, and structure of the report.
1.1 Background of Study
The study is concerning the quantification of thermal comfort at laboratory in
Universiti Teknikal Malaysia Melaka (UTeM). The study will be carried-out within the
Complex Mechanical Engineering Laboratory or can be called FASA B at Taman Tasik
Utama.
2
1.1.1 Relationship between Student Laboratory and Thermal Comfort
ISO 7730 and ASHRAE 55-92 state that thermal comfort can be defined as a
condition of mind which expresses satisfaction with the surrounding thermal
environment. While Karimipanah, T. (2007) state that good thermal comfort and indoor
air quality can actually have a positive impact not just on students‘ health but can also
improve learning.
Thermal comfort for a student‘s is affected by several parameter such as air
movement or velocity in the laboratory, humidity in laboratory, air temperature in
laboratory, the clothing they worn to lecture, the average temperature of the walls,
amount of physical work activity done in laboratory, mean radiant temperature, floor
windows, and some other factors.
However, the high occupant density and machine in the laboratory has to be
considered seriously to achieve a thermal comfort in laboratory. Students learning and
performance will be affected greatly if they feel thermal discomfort with the
environmental throughout the lab session.
A fresh and uncontaminated environment in a laboratory can make the lecturer
and students to feel comfortable, energetic and active. Therefore reduce their physical
stress, hence the students and lecturer can be improving their learning and teaching skills
to present a good performance.
3
1.2 Problem Statements
From the related sources, some of the problem statements had found which
relevant to the effects of the thermal comfort or discomfort in the environment of
classrooms. People working in uncomfortably hot and cold environments are more likely
to behave unsafely. This is because their ability to make decisions or perform manual
tasks deteriorates as mentioned in previous research by Paulo (2004). A long side these
Budaiwi (2007) state that undesirable thermal conditions can lead to occupant
dissatisfaction, which in turn has an adverse effect on their health, productivity, and
performance By implementing this case study in UTeM‘s laboratories, thermal
discomfort can be prevent therefore students can performed at their best level. Orosa
(2010) found that, in order to conduct a research in the field of thermal comfort, there
are six most important thermal variables such as the human activity level, clothing
insulation, mean radiant temperature, humidity, temperature and velocity of the indoor
air. Those thermal variables will be the main parameters to assess the thermal comfort
level in student laboratories for this project.
1.3 Objectives
Within acknowledgement the importance regarding thermal comfort inside the
laboratory, the study was carried out to achieve the following objectives:
(1) To explore the indoor climate in mechanically ventilated student laboratories.
Laboratory session usually is being spent at indoor environment. Therefore
ventilated is one of parameter that should be considered to get a good thermal
comfort in the laboratory.
(2) To investigate occupants perception of the accepted level of indoor thermal
comfort in a tropical region.

4
In this objective the occupant response will be noted during the learning and
teaching process in the laboratory. Each occupant has their own opinion about
the classroom environment.
1.4 Scope and Limitation of Project
The scope of the project is mainly focus on the thermal comfort at FASA B
laboratory. Two laboratories had been chose to carry out the thermal comfort
measurement, which are the welding workshop for the non-air conditioning type and the
other one is computer aided room for the air conditioning type.
The report will evaluates the current thermal comfort conditions by using
objective measurement, computational fluid dynamic (CFD) modeling and subjective
assessment.
1.5 Potential Benefits of Study
From the determination and measurement of thermal comfort in classroom, the
study was carried out to achieve the potential benefits to the following parties:
(1) University
The University laboratory can maintain the satisfied thermal comfort and make
an improvement to the unsatisfied laboratory, which is thermal discomfort such
as overheated or too cold classrooms. Furthermore, there are many types of
machine that can release heat. as a result the thermal comfort for a laboratory
become more difficult to achieve.

5
(2) Students
The study can be a guideline for the students‘ future studies that concerned in
thermal comfort. It is also revealed the students responses due to thermal comfort
in the laboratory. The students would know the thermal comfort in some of the
laboratory that provided a fresh and clean environment.
(3) Author
The study was carried out to show the thermal comfort knowledge, which
including the Predicted Mean Vote (PMV) and Predicted Percentage Dissatisfied
(PPD), the personal factors and environmental parameters which affect the
thermal comfort in laboratory. The author also had learned to use the equipment
for measuring the thermal comfort in laboratory. Through the study, author can
improve his knowledge on thermal comfort and gain an experience on how to
conduct measurement of thermal comfort. From the knowledge experience, it is
very useful when working in factory environments for author future career.
1.6 Project Outline
1.6.1 Determination of the Occupants’ Responses regarding to Thermal Comfort at Classroom.
The students will be asked to complete a questionnaire during the measurement
data been taken. It is consists of general personal information included classroom
number, the date and time during completing the questionnaire, students‘ gender, age,
height and weight and six factors of thermal comfort such as air temperature, mean
radiant temperature, air velocity, humidity, metabolic rates for work activity, clothing
insulation, and final synthesis information.
6
The thermal comfort was only divided into two levels, which were comfortable
and uncomfortable. Furthermore, the thermal sensation was tested by using 7-point
ASHRAE scale in the air temperature section. At the last section of the questionnaire,
the final synthesis judgement about the perception of the thermal environments in
classroom was asked to the students.
1.6.2 Measurement of Actual Thermal Comfort at Laboratory.
Four basic environmental parameters, which are air temperature, mean radiant
temperature, air velocity, and relative humidity, were measured while the students and
lecturers were completing their questionnaire. The measurement apparatus for the study
is VelociCalc plus Anemometer (Model 8347A).
The VelociCalc plus Anemometer measures four parameters, which are ambient
or dry bulb temperature (DB), natural wet bulb temperature (WB), globe temperature
(G), and relative humidity (RH). It allow the user to log 1394 samples with a time and
date stamp, the data can be recorded simultaneously, it can reviewed the data on screen
or downloaded to a computer spreadsheet program, with a wide velocity range of 0 to
50m/s depend on the study that will be performed. It also have statistics function
displays average, minimum and maximum values, and the number of recorded samples
1.7 Structure of the Report
There are seven chapters in this report. Chapter one will be discussing on the
introduction of this study such as background of study, problem statements, objectives
of the study, scope and limitation of the study and potential benefit of study.

7
In chapter two, there it will discuss on the literature review on the study which
involve theoretical of thermal comfort, equation of PMV and PPD, methods and tools
used from journals, important of thermal comfort, and summaries of journals. From this
chapter, we can know more details about thermal comfort and methods and tools have
been used in thermal experimental.
Chapter three will specially deliberate the methodology of the thermal comfort
study. According to methods and tools section, there are two methods have been used in
this study such as survey and measurement experimental. In survey method, the tool
would be selected is questionnaire where that can be obtained the response of students
about thermal comfort at workshop areas. Additionally, the second method that used the
direct measurement that is VelociCalc plus Anemometer.
In chapter four, there are two methods of determination on thermal comfort
where will show out the results from response students and actual environment
condition. After the collection data have be taken from Questionnaire and measurement
of thermal comfort around workshop, there are difference results at each section among
thermal environment.
Chapter five is the results analysis. Here student will be using the data that have
been taken that is by surveying and direct measurement and use mathematically solution
to get the end results.
In chapter six, that is discussion parts of the study which is explanation and
distribution about the reasons of difference thermal comfort and environment condition
based on the results obtained. By the ways, the improvement of thermal comfort will be
discussed so that the temperature and heat generated around workshop will be decreased
and maintained thermal environment along working time.


