www.wrsc.unr.edu ; www.arc.unr.edu Slide No. 1
Thermal Cracking Analysis ModelAND
Pavement Temperature Profile Prediction Model

www.wrsc.unr.edu ; www.arc.unr.edu Slide No. 2
THERMAL CRACKING ANALYSIS PACKAGE (TCAP)
Comprehensive Evaluation of Thermal Cracking in Asphalt Pavements

www.wrsc.unr.edu ; www.arc.unr.edu Slide No. 3
Thermal Cracking AnalysisInfluential Factors• Pavement Structure
Asphalt layer thickness. Interface condition.
• Environmental Conditions Pavement temperatures. Cooling/warming rates.
• Asphalt mixture properties Viscoelastic properties Thermal Volumetric properties Fracture and Crack Initiation Properties
• Asphalt mixture aging Property change with oxidative aging

www.wrsc.unr.edu ; www.arc.unr.edu Slide No. 4
Thermal Cracking AnalysisExisting Models• Aging of asphalt binder over time is not considered
“viscoelastic, fracture, and volumetric properties of asphalt material constant over time.”
• Thermal coefficient of contraction (CTC) is considered constant with temperature and usually estimated.
• Tensile strength is considered constant with temperature and time.
• Pavement temperature model (currently EICM) can be improved.

www.wrsc.unr.edu ; www.arc.unr.edu Slide No. 5
Thermal Cracking AnalysisSupportive Experimental Plan (Morian, N. 2014)
Asphalt Binder Testing
• 15 asphalt binder typesUnmodified, polymer modified, lime modified
• Testing Carbonyl Area (FT-IR) Binder Master Curves and LSV
1 mm film asphalt binder pan aging over different times and durations
(50, 60, 85 and 100°C up to 320 days)
Asphalt Mixture Testing (partial factorial)
• 5 Agg. Sources (Abs. from 0.9 to 5.97%)• 3 Gradations (coarse, interm. & fine)• 2 Binders (PG64-22, PG64-28 SBS mod.)• Binder Contents (3.62 to 9.14% TWM)• 3 Air Void levels (4, 7, 11%)
• Testing Dynamic modulus (E*) Uniaxial Thermal Stress & Strain
Test (UTSST)
Asphalt Mixture aging: 4 Levels(0, 3, 6, and 9 months at 60°C)
www.wrsc.unr.edu ; www.arc.unr.edu Slide No. 6
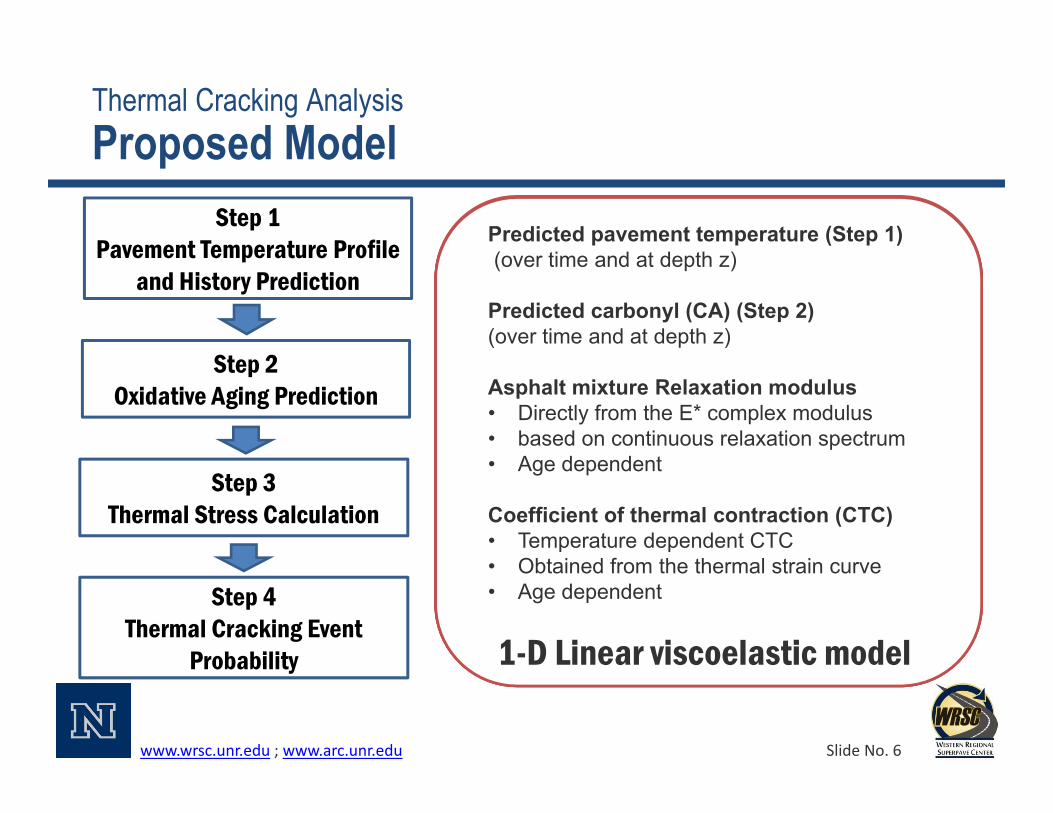
Thermal Cracking AnalysisProposed Model
Step 1Pavement Temperature Profile
and History Prediction
Step 2Oxidative Aging Prediction
Step 3Thermal Stress Calculation
Step 4Thermal Cracking Event
Probability
Pavement temperature at depth z (Step 1)
Asphalt binder aging properties• Kinetics (Ea, and AP)• Hardening parameters (HS, m)
Asphalt mixture properties• Air void size• Effective aging zone
Predict Carbonyl (CA) as a function of time and depth
Climatic and meteorological data:• air temperature• solar radiation and• Wind speed
Layer properties:• Pavement layers’ thicknesses• Thermal diffusivity
Surface radiation properties• Albedo, emissivity, absorption coefficients
1-D Heat Diffusion EquationTEMPS Software
Predicted hourly thermal stress • Considering aging effect • temperature dependent CTC
Predicted carbonyl (CA) (Step 2)
Asphalt mixture crack initiation stress (CIS)• Measured using UTSST (i.e., thermal loading)• Age-dependent
Coefficient of thermal contraction• Temperature dependent CTC• Obtained from the thermal strain curve
Compare , to % of CISNumbers of events over design life
Predicted pavement temperature (Step 1)(over time and at depth z)
Predicted carbonyl (CA) (Step 2)(over time and at depth z)
Asphalt mixture Relaxation modulus• Directly from the E* complex modulus• based on continuous relaxation spectrum• Age dependent
Coefficient of thermal contraction (CTC)• Temperature dependent CTC• Obtained from the thermal strain curve• Age dependent
1-D Linear viscoelastic model

www.wrsc.unr.edu ; www.arc.unr.edu Slide No. 7
Thermal Cracking AnalysisPrediction of Field Aging (Numerical solution using FCVM)
Pavement location: Reno, NVAggregate: Northern Nevada Binder type: PG64-28 (SBS mod.)Binder content: 5.22%Air voids: 7%
Ea= 72.53 kJol/molAPα = 4.08 E+8 ln(CA/day)HS = 2.7 (1/CA)m = 9.24 (poise)Air void diameter = 0.5 mmEff. aging zone = 1.0 mm(film thickness)

www.wrsc.unr.edu ; www.arc.unr.edu Slide No. 8
Thermal Cracking AnalysisLab Simulation of Field Aging
NV_PG64-28(SBS)_5.22%AC_7.0%Va long-termlab aging
Field aging (Reno, NV)
3 months at 60°C 5.9 years 6 months at 60°C ~ 10.9 years9 months at 60°C ~16.7 years
0.5 months at 85°C Over 20 yearsModeling of fast-rate aging is needed
X
www.wrsc.unr.edu ; www.arc.unr.edu Slide No. 9
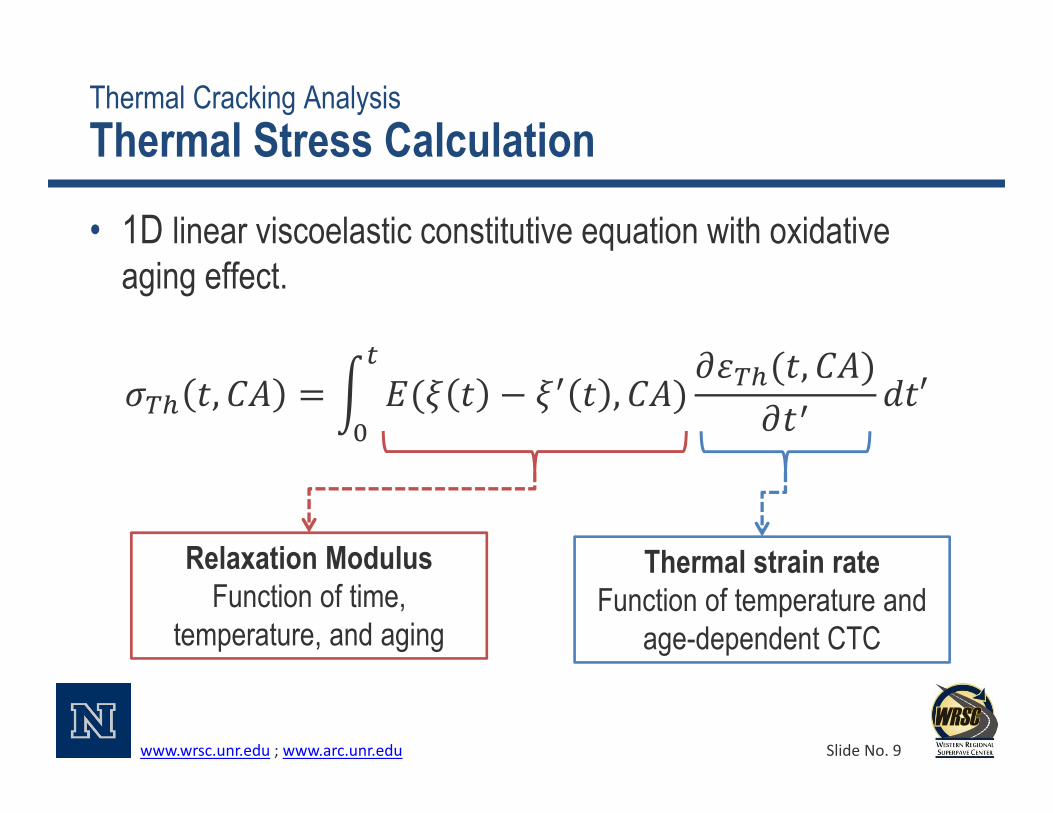
Thermal Cracking AnalysisThermal Stress Calculation
• 1D linear viscoelastic constitutive equation with oxidative aging effect.
Relaxation ModulusFunction of time,
temperature, and aging
Thermal strain rateFunction of temperature and
age-dependent CTC
www.wrsc.unr.edu ; www.arc.unr.edu Slide No. 10
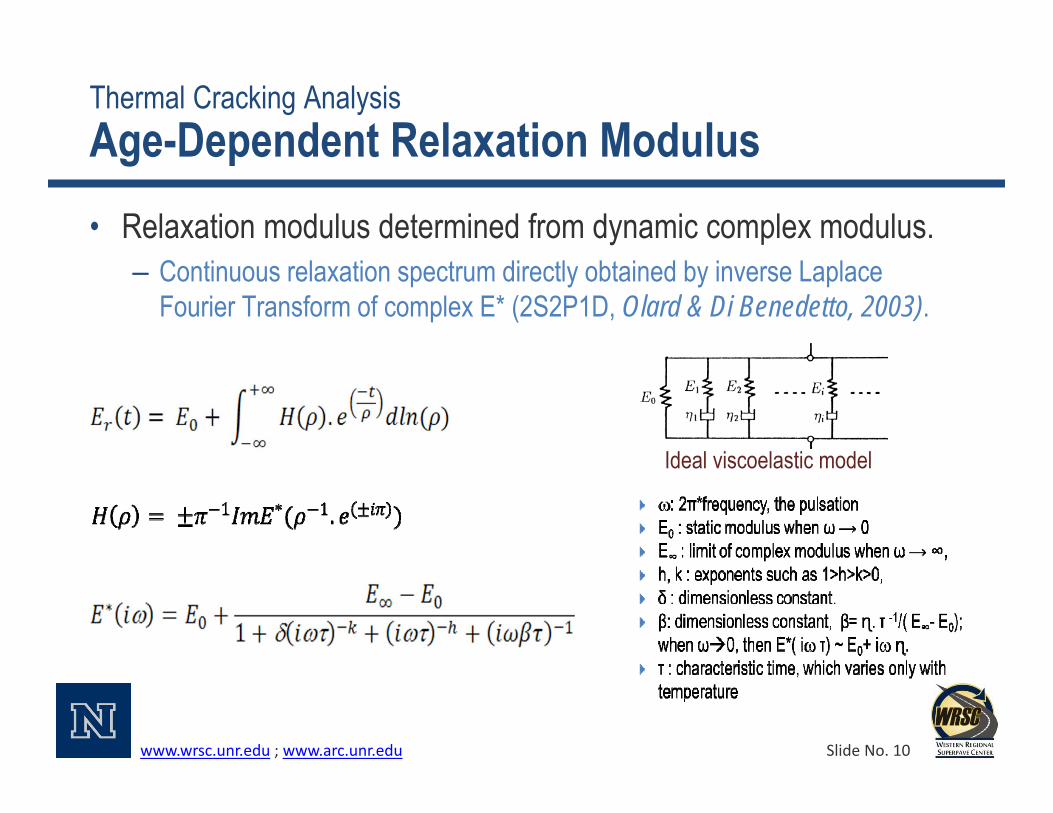
Thermal Cracking AnalysisAge-Dependent Relaxation Modulus• Relaxation modulus determined from dynamic complex modulus.
– Continuous relaxation spectrum directly obtained by inverse Laplace Fourier Transform of complex E* (2S2P1D, Olard & Di Benedetto, 2003).
Ideal viscoelastic model

www.wrsc.unr.edu ; www.arc.unr.edu Slide No. 11
Thermal Cracking AnalysisEvolution of 2S2P1D Coefficient with Aging
Consistent trends were found for the evaluated mixtures!
1
10
100
1,000
0.00 0.20 0.40 0.60
E0 (M
Pa)
CA-CA0
1,000
10,000
100,000
0.00 0.20 0.40 0.60
E∞ (M
Pa)
CA-CA0
0.10
1.00
10.00
0.00 0.20 0.40 0.60
δ
CA-CA0
0.30
0.40
0.50
0.00 0.20 0.40 0.60
k
CA-CA0
0.01
0.10
1.00
0.00 0.20 0.40 0.60
h
CA-CA0
1.0E-04
1.0E-03
1.0E-02
1.0E-01
0.00 0.20 0.40 0.60
T0
CA-CA0
0.005.00
0.00 0.20 0.40 0.60CTCL
(E
05/
°C)
CA CA0NV19I28_5.22_4%_60°C NV19I28_5.22_7%_60°C NV19I28_5.22_11%_60°C
(

www.wrsc.unr.edu ; www.arc.unr.edu Slide No. 12
Thermal Cracking AnalysisEvolution of 2S2P1D Coefficient with Aging
2S2P1D coeff. CA Va (%) Abs. (%) LSVTank
(poise)B.C. (%) Retained # 8 Passing # 200
E0 √ √ √ √ √
E∞ √ √ √ √ √ √ √
δ √ √ √ √ √ √
k √ √ √ √
h √ √ √
T0 √ √ √
Mixture variable
www.wrsc.unr.edu ; www.arc.unr.edu Slide No. 13
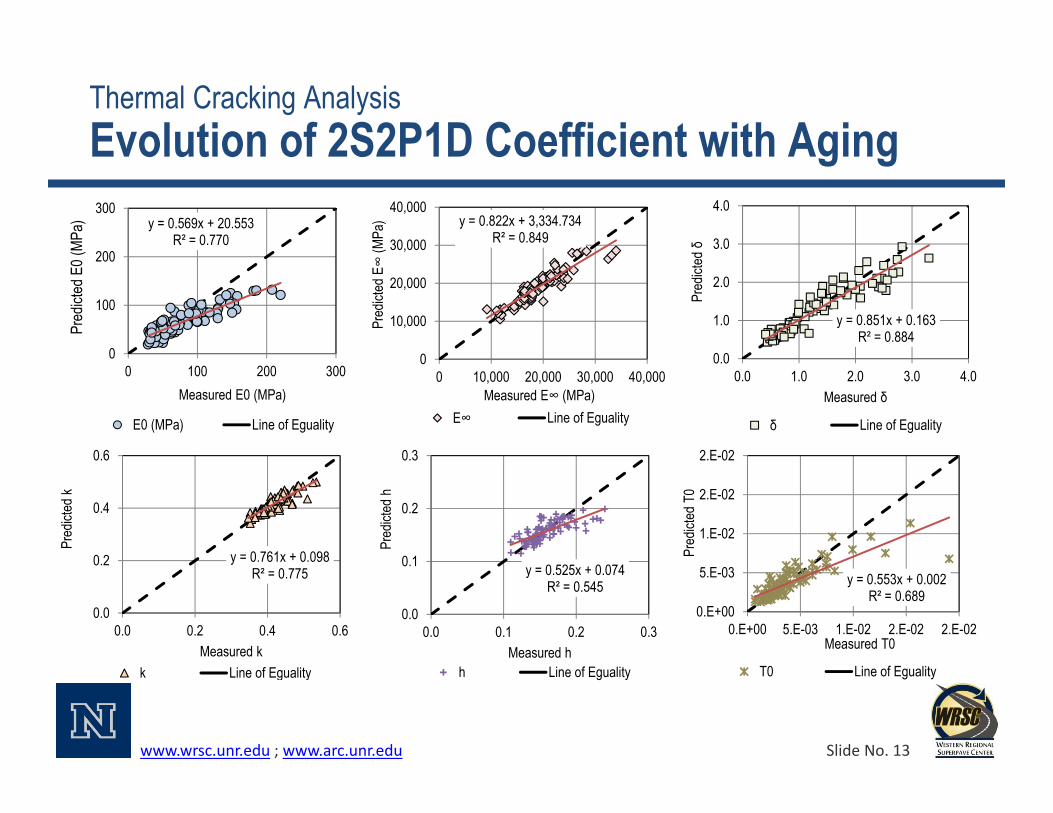
Thermal Cracking AnalysisEvolution of 2S2P1D Coefficient with Aging
y = 0.569x + 20.553R² = 0.770
0
100
200
300
0 100 200 300
Pred
icted
E0 (
MPa)
Measured E0 (MPa)
E0 (MPa) Line of Eguality
y = 0.822x + 3,334.734R² = 0.849
0
10,000
20,000
30,000
40,000
0 10,000 20,000 30,000 40,000Pr
edict
ed E∞
(MPa
)Measured E∞ (MPa)
E∞ Line of Eguality
y = 0.851x + 0.163R² = 0.884
0.0
1.0
2.0
3.0
4.0
0.0 1.0 2.0 3.0 4.0
Pred
icted
δ
Measured δ
δ Line of Eguality
y = 0.761x + 0.098R² = 0.775
0.0
0.2
0.4
0.6
0.0 0.2 0.4 0.6
Pred
icted
k
Measured kk Line of Eguality
y = 0.525x + 0.074R² = 0.545
0.0
0.1
0.2
0.3
0.0 0.1 0.2 0.3
Pred
icted
h
Measured hh Line of Eguality
y = 0.553x + 0.002R² = 0.689
0.E+00
5.E-03
1.E-02
2.E-02
2.E-02
0.E+00 5.E-03 1.E-02 2.E-02 2.E-02
Pred
icted
T0
Measured T0
T0 Line of Eguality

www.wrsc.unr.edu ; www.arc.unr.edu Slide No. 14
Thermal Cracking AnalysisTemperature and Age-Dependent CTC•
-0.0015
-0.001
-0.0005
0
-50 -40 -30 -20 -10 0 10 20
Ther
mal S
train
(mm/
mm)
Temperature (°C)
CTCl
CTCg
Tg
Unrestrained Specimen
Restrained Specimen
Dummy Specimen
Uniaxial Thermal Stress & Strain Test (UTSST)
∆1
′
1
www.wrsc.unr.edu ; www.arc.unr.edu Slide No. 15
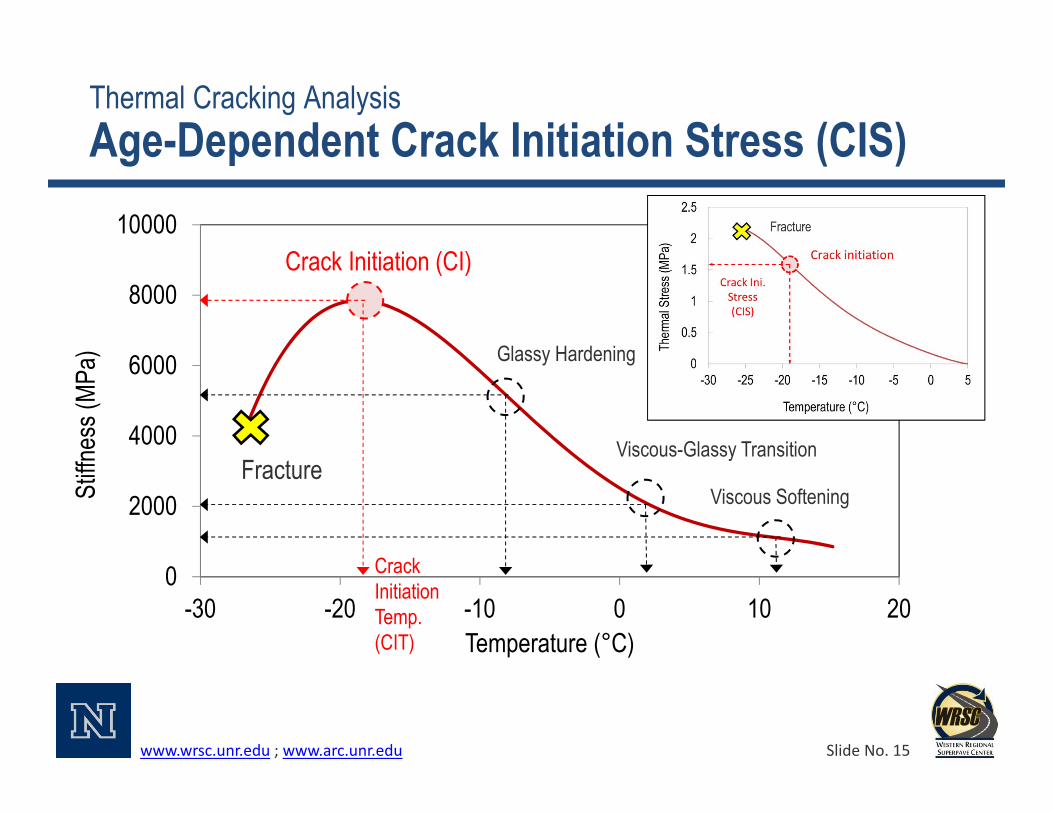
Thermal Cracking AnalysisAge-Dependent Crack Initiation Stress (CIS)
0
2000
4000
6000
8000
10000
-30 -20 -10 0 10 20
Stiffn
ess (
MPa)
Temperature (°C)
Crack Initiation (CI)
Glassy Hardening
Viscous-Glassy Transition
Viscous SofteningFracture
Crack Initiation Temp. (CIT)

www.wrsc.unr.edu ; www.arc.unr.edu Slide No. 16
Thermal Cracking AnalysisAge-Dependent Crack Initiation Stress (CIS)
• Validation of CIS with VECD.– Elastic-Viscoelastic Correspondence Principle
I1
′ ′
0
0.5
1
1.5
2
2.5
3
-40 -30 -20 -10 0 10 20
Ther
mal S
tress
(MPa
)
Temperature (°C)
Mesured thermal stress from UTSSTPredicted stress without continuum damageing
Damage Initiation Temperature (DIT)
0
0.5
1
1.5
2
2.5
3
0 1 2 3
Ther
mal S
tress
(MPa
)
Thermal Pseudo-Strain *
Start of nonlinearity due to damage

www.wrsc.unr.edu ; www.arc.unr.edu Slide No. 17
Thermal Cracking AnalysisAge-Dependent Crack Initiation Stress (CIS)
• Validation of CIS with VECD.
y = 1.24x + 4.54R² = 0.93
-40
-30
-20
-10
0
10
-40 -30 -20 -10 0 10
Dama
ge In
itiatio
n Tem
pera
ture
(°C)
Crack Initiation Temperature (°C)
Various mixtures with different binder grades, aggregates, and mix designs.
www.wrsc.unr.edu ; www.arc.unr.edu Slide No. 18
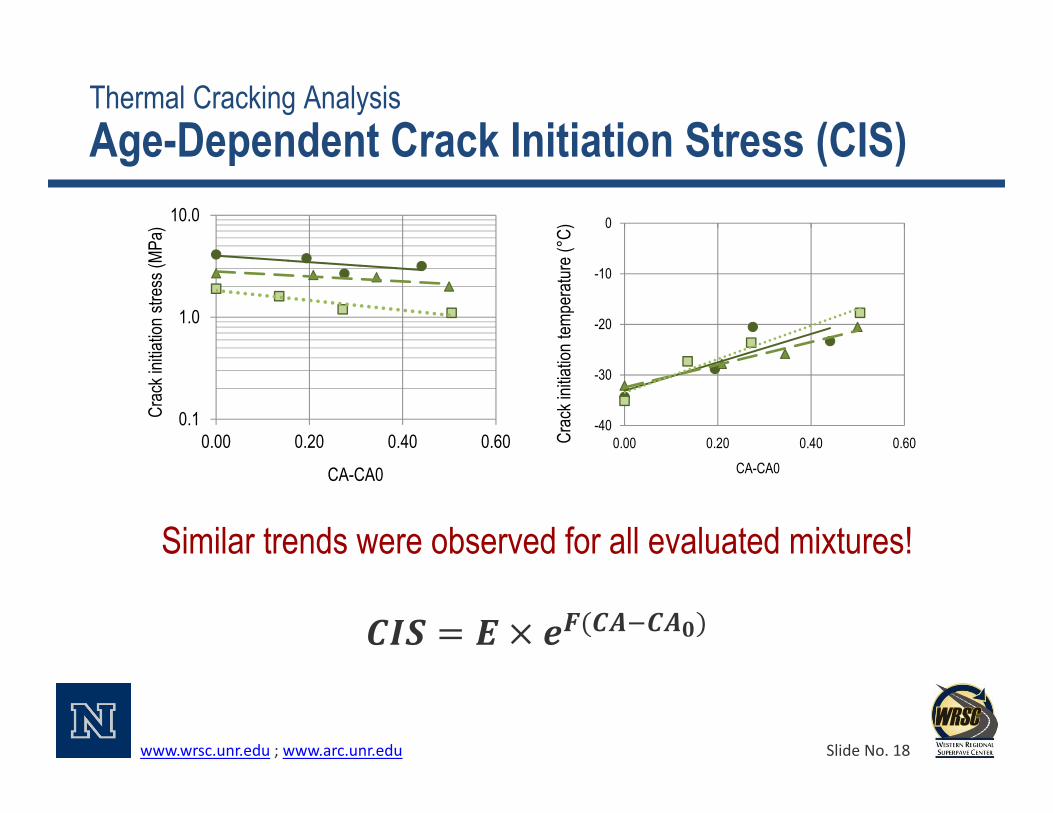
Thermal Cracking AnalysisAge-Dependent Crack Initiation Stress (CIS)
Similar trends were observed for all evaluated mixtures!
0.1
1.0
10.0
0.00 0.20 0.40 0.60
Crac
k init
iation
stre
ss (M
Pa)
CA-CA0
-40
-30
-20
-10
0
0.00 0.20 0.40 0.60Crac
k init
iation
temp
eratu
re (°
C)
CA-CA0

www.wrsc.unr.edu ; www.arc.unr.edu Slide No. 19
Thermal Cracking AnalysisAge-Dependent Crack Initiation Stress (CIS)
CA Va (%) Abs. (%)
LSVTank (poise)
B.C. (%)
Retained # 8
Passing # 200
CIS √ √ √ √ √
CIT √ √ √ √ √ √
Mixture variable
y = 0.98xR² = 0.89
-40
-30
-20
-10
0
10
-40 -30 -20 -10 0 10
Pred
icted
Cra
ck in
i. Tem
p (°C
)
Measured Crack ini. Temp (°C)Crack initiation temperature Line of equality
y = 0.97xR² = 0.72
0
1
2
3
4
5
0 1 2 3 4 5
Pred
icted
Cra
ck in
i stre
ss (M
Pa)
Measured Crack ini stress (MPa)
Crack initiation stress Line of equality

www.wrsc.unr.edu ; www.arc.unr.edu Slide No. 20
Thermal Cracking AnalysisThermal Cracking Event Probability• The accumulative events during which thermal stress reaches
a defined percentage of the asphalt mixture Crack Initiation Stress (CIS) over the analysis period!
Possible Cracking events

www.wrsc.unr.edu ; www.arc.unr.edu Slide No. 21
MATLAB Graphical User Interface (GUI)Thermal Cracking Analysis Package (TCAP)
www.wrsc.unr.edu ; www.arc.unr.edu Slide No. 22
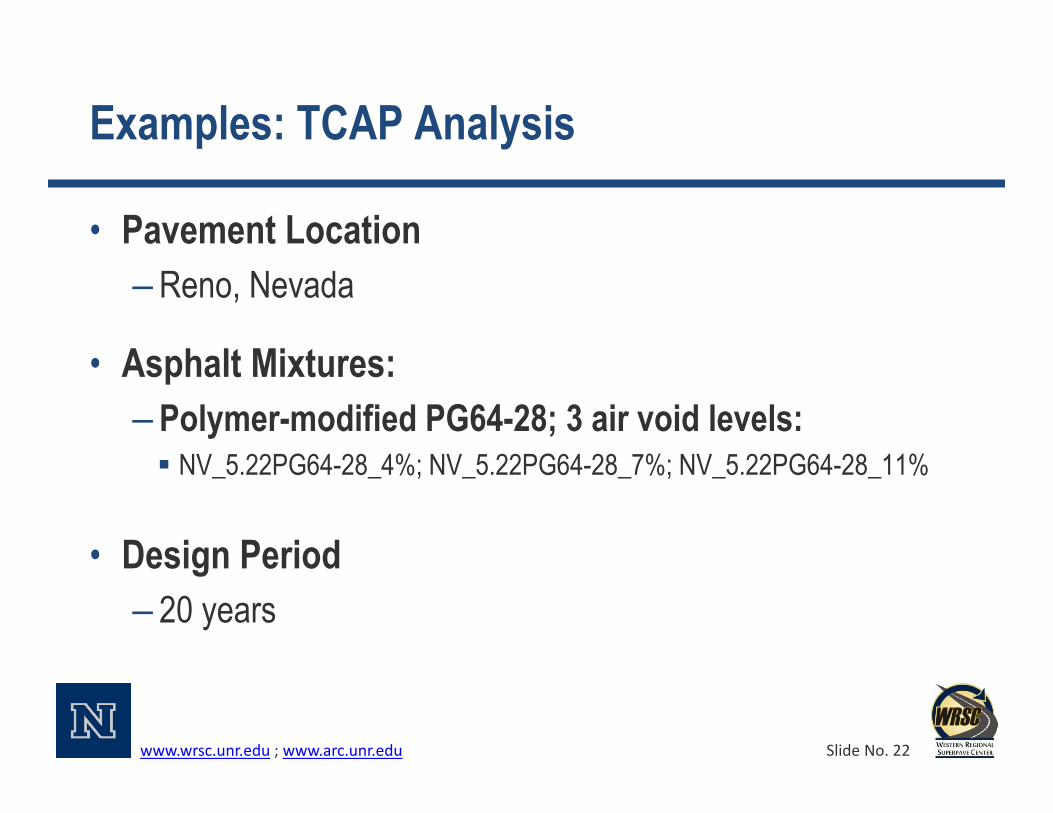
Examples: TCAP Analysis
• Pavement Location– Reno, Nevada
• Asphalt Mixtures: – Polymer-modified PG64-28; 3 air void levels: NV_5.22PG64-28_4%; NV_5.22PG64-28_7%; NV_5.22PG64-28_11%
• Design Period– 20 years

www.wrsc.unr.edu ; www.arc.unr.edu Slide No. 23
Examples: TCAP analysisEffect of Oxidative Aging on Thermal Stresses
Difference in predicted thermal stresses between aging and no-aging effect analyses.
4% Air Voids
7% Air Voids
11% Air Voids

www.wrsc.unr.edu ; www.arc.unr.edu Slide No. 24
Examples: TCAP analysisThermal Stress vs. Crack Initiation Stress (CIS)

www.wrsc.unr.edu ; www.arc.unr.edu Slide No. 25
Examples: TCAP analysis
Effect of Mixtures Air Voids
Cracking likelihoods increase for mixture with higher air voids level….
11 yrs
Acc. CI = Weighted average of number of events at which thermal stresses reach different % of CIS.
∑ % %
∑ % ,
100, 80, 70, 60, 50

www.wrsc.unr.edu ; www.arc.unr.edu Slide No. 26
Examples: TCAP analysisEffect of Modification (Two field projects from Reno, NV)
Un-modifiedPG64-22 (Moana, 2006)
SBS polymer-modified PG64-28 (Sparks, 2008)

www.wrsc.unr.edu ; www.arc.unr.edu Slide No. 27
TCAP Implementation
Asphalt Mixture(s)(Agg., Binder, Mix Design)
Pavement Structure & Location
Pavement Temperature Prediction
Oxidative Aging Prediction
Materials InputComplex modulus (E*), CTC, CIS
Thermal Cracking Analysis ✔ Pass✖ Fail
• Level 1: Measured kinetics (Mix-aged)• Level 2: Accelerated Aging• Level 3: Database
• Level 1: Measured (Full Testing) • Level 2: Measured (Reduced Testing)• Level 3: Predictive Equations
• Climatic/meteorological data• Material thermal prop.• Surface radiation prop.

www.wrsc.unr.edu ; www.arc.unr.edu Slide No. 28
Future Research and Improvements
• Field validation of TCAP model.
• Sensitivity analysis of TCAP model.
• Level 3 material input: – Regression models for materials oxidative aging, viscoelastic,
and crack initiation properties.
• Development of a stand-alone TCAP software.
www.wrsc.unr.edu ; www.arc.unr.edu Slide No. 29
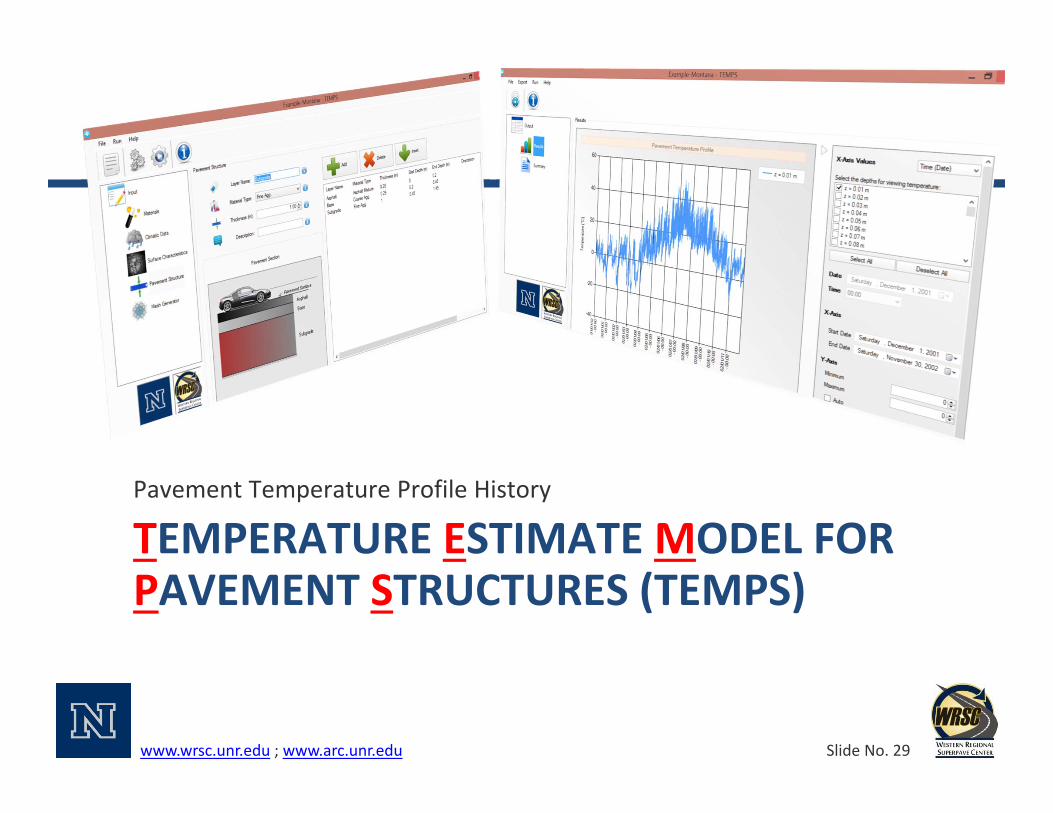
TEMPERATURE ESTIMATE MODEL FOR PAVEMENT STRUCTURES (TEMPS)
Pavement Temperature Profile History

www.wrsc.unr.edu ; www.arc.unr.edu Slide No. 30
Pavement Temperature Profile Prediction
Improvement of the Heat Transfer model [Han et al., 2011 (TAMU)]
Enhanced boundary conditions. Variable pavement surface radiation properties.
Application of Finite Control Volume method (FCV) with Implicit Scheme [Alavi et al., 2014 (UNR)] Considering discontinuity in pavement layers’ material. Improving the time efficiency of calculation.

www.wrsc.unr.edu ; www.arc.unr.edu Slide No. 31
Pavement Temperature Profile PredictionHeat Transfer Model Concept
Heat Transfer Balance Between Pavement Structure & Surrounding Environment
Solar Radiation (Albedo)
Incoming (Absorption) and Outgoing (Emissivity) RadiationHeat Convection
(Wind speed)
Heat Diffusion

www.wrsc.unr.edu ; www.arc.unr.edu Slide No. 32
Pavement Temperature Profile PredictionNumerical Computation: Finite Control Volume Method (FCVM)
Energy Balance in Each of Control Elements

www.wrsc.unr.edu ; www.arc.unr.edu Slide No. 33
Pavement Temperature Profile PredictionStandalone Software: TEMPS (Alpha Version)Temperature Estimate Model for Pavement Structures (TEMPS)
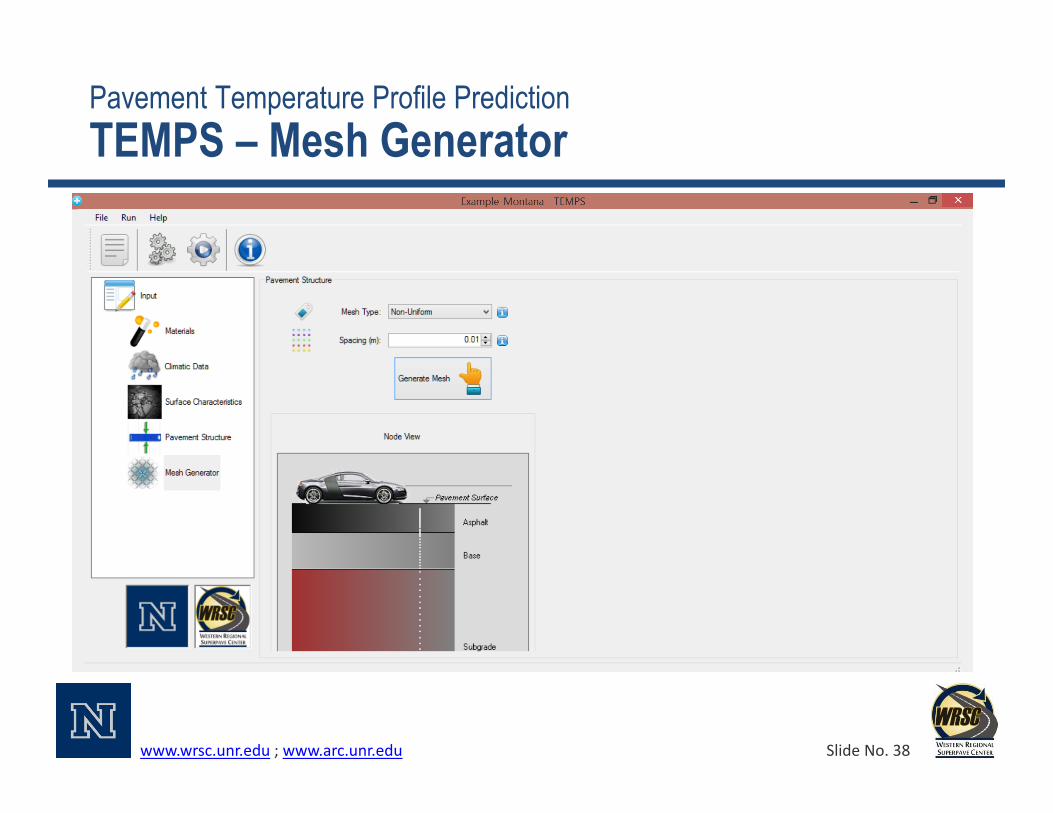
• Materials• Climatic Data• Surface Characteristics• Pavement Structure• Mesh Generator

www.wrsc.unr.edu ; www.arc.unr.edu Slide No. 34
Pavement Temperature Profile PredictionTEMPS – Materials Input

www.wrsc.unr.edu ; www.arc.unr.edu Slide No. 35
Pavement Temperature Profile PredictionTEMPS – Climatic Data Input

www.wrsc.unr.edu ; www.arc.unr.edu Slide No. 36
Pavement Temperature Profile PredictionTEMPS – Surface Characteristics Input

www.wrsc.unr.edu ; www.arc.unr.edu Slide No. 37
Pavement Temperature Profile PredictionTEMPS – Pavement Structure
www.wrsc.unr.edu ; www.arc.unr.edu Slide No. 38
Pavement Temperature Profile PredictionTEMPS – Mesh Generator

www.wrsc.unr.edu ; www.arc.unr.edu Slide No. 39
Pavement Temperature Profile PredictionTEMPS – Run Analysis
Time Efficiency of Computation: Implicit Scheme
Run time for 1 years analysis period (3.10 GHz proc. and 4.00 GB RAM)
< 10 seconds using 1 hour time step*
* Note: 1 hour time step was chosen without jeopardizing the model accuracy for prediction.

www.wrsc.unr.edu ; www.arc.unr.edu Slide No. 40
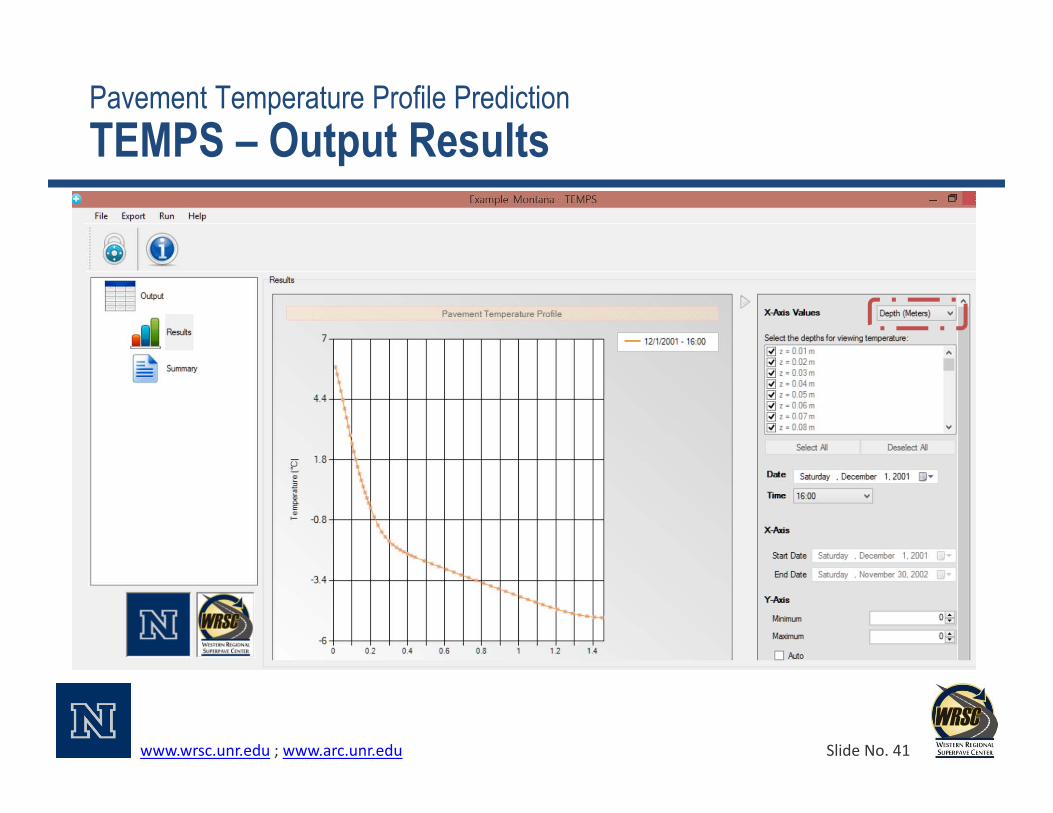
Pavement Temperature Profile PredictionTEMPS – Output Results
www.wrsc.unr.edu ; www.arc.unr.edu Slide No. 41
Pavement Temperature Profile PredictionTEMPS – Output Results

www.wrsc.unr.edu ; www.arc.unr.edu Slide No. 42
Pavement Temperature Profile PredictionTEMPS – Output Summary

www.wrsc.unr.edu ; www.arc.unr.edu Slide No. 43
Pavement Temperature Profile PredictionTEMPS – Output Summary

www.wrsc.unr.edu ; www.arc.unr.edu Slide No. 44
Pavement Temperature Profile PredictionTEMPS – Predicted versus MeasuredGreat Falls, MT at depth of 0.09 m (3.5 inch)
-20-10
01020304050
11/5/2001 12/25/2001 2/13/2002 4/4/2002 5/24/2002 7/13/2002 9/1/2002 10/21/2002 12/10/2002 1/29/2003
Temp
eratu
re (
C)
Predicted TemperatureMeasured Temperature (LTPP)
-20-10
01020304050
11/5/2001 12/25/2001 2/13/2002 4/4/2002 5/24/2002 7/13/2002 9/1/2002 10/21/2002 12/10/2002 1/29/2003
Temp
eratu
re (
C)
Calibrated TemperatureMeasured Temperature (LTPP)
Particle Swarm Optimization (PSO) Algorithm: Single yearly surface characteristics

www.wrsc.unr.edu ; www.arc.unr.edu Slide No. 45
Pavement Temperature Profile PredictionTEMPS – Predicted versus MeasuredGreat Falls, MT at depth of 0.09 m (3.5 inch)
-20
-10
0
10
20
30
40
50
-20 -10 0 10 20 30 40 50
Max D
aily C
alibr
ated T
empe
ratur
e (De
gree
s C)
Max Daily Measured Temperature (Degrees C)
-20
-10
0
10
20
30
40
50
-20 -10 0 10 20 30 40 50
Max D
aily P
redic
ted Te
mper
ature
(Deg
rees
C)
Max Daily Measured Temperature (Degrees C)
Particle Swarm Optimization (PSO) Algorithm: Single yearly surface characteristics
Optimization need to be refined to include monthly surface characteristics

www.wrsc.unr.edu ; www.arc.unr.edu Slide No. 46
Pavement Temperature Profile PredictionTEMPS – Additional Improvements
• Optimize the surface characteristics for the US (Albedo, Emissivity, Absorption) using Particle Swarm Optimization (PSO) Algorithm– Monthly or seasonal values.
• Create/Include input files for LTPP SMP sections.• Provide a summary of the average 7-day pavement
temperature at various depths.• Provide a summary of pavement cooling/warming rates

www.wrsc.unr.edu ; www.arc.unr.edu Slide No. 47


