
IJERS/ BIMONTHLY/DR. JEET SINGH RANA (598-618)
JULY-AUG, 2016, VOL-II, ISSUE-VIII www.srjis.com Page 598
THINKING STYLES OF SCHOOL STUDENTS AS RELATED TO CULTURE,
GENDER AND STREAM
Jeet Singh Rana, Ph. D.
Research Scholar, Department of Education Himachal Pradesh University Summerhill,
Shimla
Abstract
The present study is designed to study the effects of culture, gender and stream on thinking styles of
school students. The sample was drawn by cluster random method of sampling by which 304 students
were selected from three Indian Senior Secondary Schools and 251 Students from Two Tibetan Senior
Secondary Schools students studying in Shimla and Dharamshala city of Himachal Pradesh. As the
purpose of the study was to ascertain the main and interaction effects of culture, gender and stream
on thinking styles of students, a Three-way Analysis of Variance technique was employed. Indian
students showed greater preference for Legislative, Executive, Local Liberal, Conservative,
Hierarchic, Monarchic and Internal style than their counterparts whereas Tibetan students were
higher than Indian in the use of Oligarchic style indicating the main effect of culture. Female students
had significantly stronger preference than Male students for Legislative, Executive, Judicial, Global,
Local, Liberal, Hierarchic, Monarchic, Oligarchic, and Anarchic thinking styles.
Keywords: Culture, Gender, Stream and Thinking Styles
Introduction
India is a secular country where the people of different culture, religion, caste and
community live together with peace and harmony without any fear. To respect the culture
and feelings of other is the rich cultural heritage of India. The people of different countries
live here with all freedom in respect to their education and living. Education is a prerequisite
for cultural and socio-economic development, for all the sections that are living in a country.
There are some sections of the community as refugee who have all along been subjected to
various kinds of deprivation and discrimination and therefore, stand in need of instant
development. Education is a right and all citizens of the country should have access to it.
The Tibetan refugee account for a very small percentage of the Indian population. It is
through education that they can fully utilize the opportunities for socio-economic
development. Education is also an instrument of liberation and endows the deprived groups
with confidence, courage and ability to resist exploitation. Article 46 of the Indian
constitution specially stated that “The state shall promote with special care the

IJERS/ BIMONTHLY/DR. JEET SINGH RANA (598-618)
JULY-AUG, 2016, VOL-II, ISSUE-VIII www.srjis.com Page 599
educational and economic interests of the weaker sections of the people and in
particular of the scheduled castes and the scheduled tribes and shall protect them from
social injustice and all forms of exploitation”. But there is no such provision as such for
Education of Refugees living in India like Tibetan. Tibetans are living in India since 1959
like refugees and thus are facing various problems of their adaption to a new physical and
socio cultural environment in India.
Tibet, the country so isolated, lies in the heart of central Asia buttressed by higher
mountain, so irresponsive, so lofty to outside influences has held herself so far apart from
the madding interferences of the busy commercial world. It lies between 28th
and 36th
parallels of the world latitude and 79th
and 99th
of east longitude. Tibet lies on the west of
China, North of India and Nepal, East of Persia and South of Russia and Mongolia. The
southern border of Tibet has three main provinces known as U-Tang, Dotod and Domed,
China Britain and Russia expanded their empires edging ever closed to Tibet‟s ill guarded
frontiers. Chinese made their presence felt since the beginning of 18th
century. In 1950, the
people liberation army of communist China invaded – a Himalayan kingdom so deeply
committed to Buddhism that its kings are named as Avalokitesvara. Before the Chinese put
an end to the fighting his holiness, the XIVth Dalai Lama, Gyalwa Tenzin Gyatso flied to
India with a large chunk of his people.
According to the Webster‟s New World Dictionary a style is a distinctive or
characteristic manner, or method of acting or performing. Styles represent a set of
preferences. The style corresponds to a discrete notion of coherent singularity in a variety of
contexts and has a wide appeal to human life.
Thinking styles are the individual‟s preferred ways of using abilities. These are in
fact related to cognition, which includes perceiving, sensing, problem solving, thinking and
remembering. However, thinking styles are different from cognitive styles in the sense that
these are more general and instead of one they have many dimensions. For instance, filed
dependence/independence, impulsivity/reflectivity etc. cognitive styles have only one
dimension whereas Sternberg‟s thinking styles based on multi dimensions such as functions,
forms, levels, scope and learning. These thinking styles are thinking intellectually or
creatively.
The objective of mental self-government theory is to integrate various approaches to style
and to provide new directions for theory applied to educational practice.
According to Sternberg (1988, 1994) the basic idea of this theory is that the people like
societies, and they have to organize as government themselves. Thus the theory answers the

IJERS/ BIMONTHLY/DR. JEET SINGH RANA (598-618)
JULY-AUG, 2016, VOL-II, ISSUE-VIII www.srjis.com Page 600
question of how people govern and manage their every day cognitive activities within the
school and outside the school, in mental self-government a style of thinking is defined as a
preferred way of thinking. It is not ability but rather a favored way of expressing or using
one or more abilities. Two or more people with some levels of abilities might nevertheless
have very different styles of thinking. Whereas two peoples with similar personality
characteristics might differ in their thinking styles. Thus according to this theory the, styles
of thinking do not reside in the domain of ability or in the domain of personality but in the
interface between the two.Sternberg has identified thirteen thinking styles based on
functions, forms, levels, scope and learning.
Some researchers have reported that different cultures and different educational systems
influence student‟s ways of processing information. In this section the review of such
studies has been presented.
Review of Related Researches
There are some studies on culture and styles of thinking which are as follows:
Raj Kumar (2006) in his study found that culture had significant effect on cognitive
style of senior secondary students; non tribal students were ground to be higher than tribal
students on filled independence cognitive style.
Zhang, Postinglione and Gino(2012) Explored thinking style of Tibetan Minority University
students vis-han Chinese Majority students. Participants were 408 Tibetan students and 920
Han Chinese‟s students. Result of the study indicated that compared with Han Chinese‟s
students, Tibetan students scored significantly higher on the more norm conforming thinking
style but significantly lower on the creativity generation style more over the Tibetan
student s indicated strong preference for working with other as opposed with other
independently.
Some studies have been conducted on gender differences in styles of thinking. For
instance:Siqueira and Wechslar(2004) reported that among high school students female
students preferred to be more intuitive and emotional their male colleagues.
Rajkumar(2006) reported that male students were higher on filled independent
cognitive style than female senior secondary students.
Mundim and Wechsler (2007) when comparing business people, they observed
women have a style demonstrating more emotional sensibility than men.
Yildizlar (2011) designed a study to compare teacher candidate thinking styles
according to some demographical factors the participants of the study were 212 teacher
candidate (118 females, 94 males) were enrolled at international Cyprus university in North
IJERS/ BIMONTHLY/DR. JEET SINGH RANA (598-618)
JULY-AUG, 2016, VOL-II, ISSUE-VIII www.srjis.com Page 601
Cyprus Turkish republic. Sternberg and Wagner‟s thinking style inventory was used for data
collections. According to data analysis, Scores showed meaningful differences according to
gender in legislative style sub questions in favours of males. Meaningful difference was not
found in other 12 thinking styles.
Several investigations made attempt to examine differences in thinking style for students
of different academic majors and subjects. Some studies have been revised in the following
paragraphs.
Sagone and Caroli(2012)studied the relationship of creativity and thinking style in Arts,
Science and Humanities high school students. Thinking style inventory of Stenrberg and
Wagner was used for data collection. Results showed the more sciences students preferred to
work with concrete problems and details the more transformed Idea from one to another
different mental sets ; The more science students preferred to go beyond exciting rule and
maximize changes, the more they were able to change the ideas in different mental set, the
more science students preferred to maximize changes the more they were able to process
uncommon and meaningful idea, in addition, the more science students preferred to work
with other people and to follow existing rule and minimize changes the less they were able
to enrich and elaborate their Ideas in different ways.
Sood,(2014) conducted a study on relationship of thinking style to creativity and
academic streams . The sample comprises 345 students of senior secondary school. Thinking
style Inventory( Hindi adaptation by B.P Verma was used for the data collection along with
a test of verbal creativity of results of the study revealed that stream had significance effect
on Monarchic and external Thinking styles , arts students tended to rate them higher on
Monarchic thinking style than science students
Need and Significance of the Study:
Many style constructs have been proposed as important dimensions of individual
differences in law. They approach cognitive tasks across situation. If all style constructs,
cognitive styles have received the most extensive scientific inquiry. To list but a few major
dimensions of cognitive style, the most popular examples of a few major dimensions of
cognitive styles are field dependence-independence (Witkin& Good Enough,1978);
conceptual Tempo (Kagan, 1966); cognitive complexity-simplicity (Harvey, Hunt &
Schroder,1961; Kelley,1995; Messick,1994).
Although focusing in different stylistic aspect of cognitive functioning. Cognitive
style theorist‟s anomic, implicitly or explicitly. These styles are general modules and

IJERS/ BIMONTHLY/DR. JEET SINGH RANA (598-618)
JULY-AUG, 2016, VOL-II, ISSUE-VIII www.srjis.com Page 602
structural properties of cognitive systems, not merely personal preferences that are more or
less under volitional control and therefore, changeable with conscious decision.
Thinking form the part of cognition like intelligence. Hence, in the present research work,
styles of thinking have been treated under cognition.
Several researchers and writers have underlined the significance of styles of thinking in
terms of keys to understand student performance and classroom teaching. (Sternberg, 1990;
Stone, 1976; Dunn et al. 1975). Sternberg (1994) categorically remarked that teacher must
accommodate an array of styles (thinking and learning), by systematically varying teaching
and assessment methods to reach every student. If they do it, they will observe immediate
and powerful increases to student‟s performance. It is needless to mention that styles of
thinking will render a great help to all working in the field of education as students,
teachers, guidance workers, counselors, curriculum designers as well as educational
managers in the improvement and the betterment of total education process.
Delimitations Of The Study:
The study was delimited with reference to objectives, hypotheses, variables, research
method, tools, statistical technique, culture, stream, style, etc.,which are elaborated as under:
The investigation was delimited in terms of sample. The sample was comprised 555 senior
secondary students of Indian and Tibetan culture. It was drawn by random cluster method.
1. The study was delimited in term of two cultural groups only ( Indian and Tibetan). India
has its own cultural Identity and similarly the Tibet is also known for his unique culture.
2. The study was further was delimited in terms of area. It was carried out in Shimla and
Dharamsala city of Himachal Pradesh.
3. The study was delimited in terms of stream, only arts and science streams were taken in
to consideration.
4. The study was delimited in terms of class also. The students of class10 +1 and 10+2(
senior secondary) were selected.
5. The study was delimited with reference to dependent and independent variables.
Dependent variables were 13 thinking styles. The independent variables were culture,
stream and gender.
6. The study was delimited with regard to statistical technique i.e. Three-Way -ANOVA
was used for the analysis of data.
7. The study was delimited with reference to factorial design. A 2x2x2 factorial design was
used.
IJERS/ BIMONTHLY/DR. JEET SINGH RANA (598-618)
JULY-AUG, 2016, VOL-II, ISSUE-VIII www.srjis.com Page 603
8. The study was confined to the research tools also Sternberg and Wegner‟s Thinking
styles inventory was used in the study.
9. The selection of the schools for sample was made by random method and it was confined
to only four schools of Shimla and one school of Dharamshala.
10. The conclusions were confined to the delimitations of the study.
Research Method
In the present study, descriptive survey method of research was applied. According
to Ary et al (1972) Descriptive research studies are designed to obtain information
concerning the current status of phenomena. They are directed towards determining the
nature of a situation as it exists at the time of study. There is no administration or control or
treatment as is found in experimental research. Their aim is to describe what exists with
respect to variables or conditions in a situation. It is most commonly used research method
in educational research endeavor.
Population
According to Best and Kahn (1993) a population is any group of individuals that have
one or more characteristics in common that are of interest to the researcher. The population
may be all individuals of a particular type or a more restricted part of that group. Population
of the present research comprised all senior secondary students studying in Tibetan and
Indian schools located in Himachal Pradesh.
Sample
In the present study initial sample comprised 555 senior secondary students (Indian
and Tibetan students). The subjects were drawn by cluster random method. 304 students
were selected from three Indian Senior Secondary Schools and 251 Students from Two
Tibetan Senior Secondary Schools. Out of 555 students 263 were Male students and 292
female students.Out of 555 students 316 students were science students and 229 were Arts
students.
Tool used:
In the present study the Hindi version of 65 – items TSI was prepared by B.P. Verma and
Kamal Prakash and was shown to the teacher of education knowing Hindi English well for
checking language accuracy as well as content of the statement. On the basis of unanimous
agreements statements were retained if in some statements some revision was needed it was
done by the Investigator. It may be mentioned here that in the beginning of TSI instead of 7
point Likert scale, 5 point Likert scale was used.

IJERS/ BIMONTHLY/DR. JEET SINGH RANA (598-618)
JULY-AUG, 2016, VOL-II, ISSUE-VIII www.srjis.com Page 604
An attempt was to determine its concurrent validity by administering English and
Hindi version on the same sample, drawn randomly from two institutes of B.Ed . the sample
comprised of 50 subjects. Before administrations of the inventory necessary instructions
were given to the subjects and they were told to give their response using 5. Scale with
objectivity. 10 minutes interval was also given between the administration of two versions of
TSI ( i.e.; Hindi and English ) on the completion of both the tools scoring was done with the
help of standard key.
Test-retest reliability was also established for the Hindi version of TSI with the
interval of 2 weeks. In view of the concurrent validity and test-retest validity of Hindi
adapted version of TSI was treated appropriate to use with the indented sample of the study.
Statistical Techniques Used
As the purpose of the study was to ascertain the main and interaction effects of culture,
gender and stream on thinking a three-way-analysis of variables technique was employed in
the present study.
Analysis of Data
Thirteen thinking styles have been included in this section. Main and interaction
effects of culture, gender and stream have been analyzed in context of each of the thirteen
thinking styles.
Summary of Three-Way-ANOVA with respect to legislative style has been presented in
Table 1.1 given below:-
Table 1.1 2x2x2 ANOVA for LegislativeStyle.
Source of
Variation
SS df MS F-Ratio Significance
Culture A 377.2321 1 377.2321 38.76147 **
Gender B 104.4321 1 104.4321 10.73084 **
Stream C 127.575 1 127.575 13.10862 **
A x B 1.575 1 1.575 0.161835 NS
B x C 0.289286 1 0.289286 0.029725 NS
A x C 9.289286 1 9.289286 0.954495 NS
A x B x C 4.889286 1 4.889286 0.502385 NS
Within 2647.143 272 9.732143
Total 3272.425 279
NS = Not Significant at .05 level, ** = Significant at .01 level,
* = Significant at .05 level,
It may be seen in Table 1.1 that F-ratio (38.76) representing main effect for factor
„A‟ (Culture) was found to be significant at .01 level. Alternatively it may be said that
students belonging to Indian and Tibetan cultures differed significantly with regard to
legislative thinking style. Since mean difference was in favour of Indian students (M=20.59

IJERS/ BIMONTHLY/DR. JEET SINGH RANA (598-618)
JULY-AUG, 2016, VOL-II, ISSUE-VIII www.srjis.com Page 605
> M=18.26), it may be said that students hailing from Indian culture had more liking for the
use of legislative style as compared to students belonging to Tibetan culture.
Table 1.1 further shows that sex of the students had significant effect on legislative thinking
style (F=10.73, P < .01,dfs =1 and 272), it implies that there was significant difference
between male and female students for their preference for the use of legislative style. Female
students had significantly greater magnitude of preference for legislative style than male
students (M=18.81 < M=20.4).
It may also be observed from Table 1.1 that F- ratio (13.108) turned out to be highly
significant. (P < .01,dfs 1and 272). This suggests that stream also had significant effect on
legislative style. Students belonging to arts stream exhibited more preference for this style
than students belonging to Science stream (M=18.75 < M=20.1)
Table 1.1 further discloses that all the interaction effects (A x B, B x C, A x C and A x B x
C) came out to be non-significant at .05 level of significance with dfs 1 and 272 with
reference to legislative thinking style. From this, it may be inferred that effect of A (Culture)
was not dependent on factor B (Gender), effect of gender (B) was not dependent on factor
„C‟(stream), effect of factor „A‟ was not dependent on factor C (Stream), and A x B
interaction effect was not dependent on factor „C‟ stream with regard to legislative style.
A summary of Three-Way-ANOVA with regard to executive style has been given in Table
1.2
Table 1.2 2x2x2 ANOVA for Executive Style
Source of
Variation
SS df MS F-Ratio Significance
Culture A 40.1285 1 40.1285 4.5194 *
Gender B 84.7 1 84.7 9.5393 **
Stream C 14.6285 1 14.6285 1.6475 NS
AxB 2.4142 1 2.4142 0.2719 NS
BxC 38.6285 1 38.6285 4.3505 *
AxC 0.2285 1 0.2285 0.0257 NS
AxBxC 20.6285 1 20.6285 2.3233 NS
Within 2415.086 272 8.8789
Total 2616.443 279
NS = Not Significant at .05 level, * = Significant at .05 level
** = Significant at .01 level
It may be observed in Table 1.2 that F- ratio (4.519) was significant (P < .05, dfs 1 and
272). It leads to the conclusion that executive thinking style of students was significantly
influenced by the culture variation. Mean score of Indian students was found to be greater
than Tibetan students (M=20.11 > M=19.36). It indicates that Indian culture was more prone
to use executive thinking style than Tibetan culture.

IJERS/ BIMONTHLY/DR. JEET SINGH RANA (598-618)
JULY-AUG, 2016, VOL-II, ISSUE-VIII www.srjis.com Page 606
Table 1.2 shows that main effect of gender (B) was also significant (F=9.539, P < .01, dfs 1
and 272). It means that male and female students had marked difference in the preference for
executive thinking style. As mean difference resulted in favour of female group (M=19.19 <
M=20.29). It may be stated that female students were more inclined to use executive
thinking style in comparison to male students.
Table 1.2 reveals that F-ratio (1.647) was less than the required F value of the Table
at .05 level with dfs 1 and 272. It corresponds to the main effect of factor „C‟ (Stream).
Hence it may be said that stream had no significant effect for executive thinking style. In
other words, students belonging to both streams- science and arts had similar preference for
the use of executive style.
Table 1.2 exhibits that A x B interaction effect was non-significant (F=272, P > .05,
dfs 1 and 272). It simply conveys that effect of „A‟ factor (Culture) did not vary for the two
levels of factor „B‟ (Gender) with reference to executive style.
Table 1.2 reveals that F-ratio of 4.35 representing interaction effect of B x C
(Stream) was significant at .05 level of confidence. It leads to the inference that joint effect
of sex and stream on executive thinking style was beyond chance factor. In other words,
effect of sex was dependent on stream.
Table 1.2 indicates that F-ratios (0.25 and 2.32) were non- significant. From this, it may be
said that effect of culture (A) was independent of stream (C). Also A x B interaction effect
was independent of factor „C‟ Thus A x C interaction and A x B x C interaction did not exist
with reference to executive style of students.
Table 1.3 provides the summary of Three Way-Analysis of variance with reference to
judicial thinking style.
Table 1.3 2 x 2 x 2 ANOVA for Judicial style.
Source of
Variation
SS df MS F-Ratio Significance
Culture A 135.6035 1 135.6035 14.2616 **
Gender B 81.4321 1 81.4321 8.5517 **
Stream C 1.575 1 1.575 0.1654 NS
AxB 17.0035 1 17.0035 1.7856 NS
BxC 6.0035 1 6.0035 0.6304 NS
AxC 65.0892 1 65.0892 6.8354 **
AxBxC 6.603570 1 6.6035 0.6934 NS
Within 2590.057 272 9.5222
Total 2903.568 279
It may be seen in Table 1.3 that F=14.261 were significant at .01 level with dfs 1 and 272. It
implies that culture had main effect on judicial style. This means that students belonging to
Indian and Tibetan cultures differed significantly with reference to use of Judicial thinking

IJERS/ BIMONTHLY/DR. JEET SINGH RANA (598-618)
JULY-AUG, 2016, VOL-II, ISSUE-VIII www.srjis.com Page 607
style. Indian students had greater mean score than Tibetan students (M=18.99 > M=17.59),
meaning thereby, Indian students had more inclination towards use of Judicial thinking style
than their counterpart Tibetan students.
Table 1.3 reveals that main effect of sex on Judicial thinking style was highly significant
(F=8.551, P < .01, dfs 1 and 272 mean score of female students was found greater than male
students (M=17.75 < M=18.83). This indicated that female students superseded their
counterpart male students in the use of Judicial thinking style.
Table 1.3 shows that main effect of stream for Judicial thinking style was found to be non-
significant. (P >.05). It means that there was no difference in use of judicial style of students
of Science and Arts streams. Both the groups had almost similar tendency to use judicial
style.
Table 1.3 further reveals that A x B and B x C interaction effects were not
statistically significant (P >.05, df 1 and 272). It leads to the conclusion that combined effect
of culture and gender and gender and stream on Judicial thinking style was not significant
beyond chance factor. Table 4.3 further shows that A x C interaction was significant (F=
6.835, P < .07, dfs 1and272). From this it may be inferred that effect of A (Culture) was not
similar for the two levels of stream (Science and Arts) or vice versa with reference to
judicial thinking style.
It may be observed that three factors (A x B x C) interaction effect was also non- significant
(F= 0.693, P > .05,dfs 1 and 272). It implies that A x B interaction effect was almost the
same for two level of factor „C‟ (stream) or it may be said that B x C (gender x stream)
interaction was the same at the level of factor „A‟ (Culture) or A x C interaction was similar
for the two levels of factor „B‟ (Gender) with reference to Judicial thinking style.
Table 1.4 presents summary of Three-Way-ANOVA with reference to global thinking style
Table 1.4 2x2x2 ANOVA For Global Style.
Source of
Variation
SS df MS F-Ratio Significance
Culture A 1.1571 1 1.1571 0.1291 NS
Gender B 64.1285 1 64.1285 7.1559 **
Stream C 98.4142 1 98.4142 10.9818 **
AxB 3.6571 1 3.6571 0.4080 NS
BxC 3.6571 1 3.6571 0.4080 NS
AxC 3.6571 1 3.6571 0.4080 NS
AxBxC 3.6571 1 3.6571 0.0398 NS
Within 2437.543 272 2437.543
Total 2612.671 279 2612.671
It may be noted in Table 1.4 that effect of culture (A) for global thinking style was found to
be non-significant (F= 0.129, P >.05 dfs 1 and 272). It implies that there was no marked
difference between Indian and Tibetan students with regard to global style.

IJERS/ BIMONTHLY/DR. JEET SINGH RANA (598-618)
JULY-AUG, 2016, VOL-II, ISSUE-VIII www.srjis.com Page 608
Table 1.4 further shows that gender had significant effect for global style as obtained
F- ratio (7.1556) was highly significant (P < .01,dfs 1 and 272) Mean score of female
students superseded male students for global thinking style (M=15.45 < M=16.4).It means
that female students had the tendency to make use of global thinking style more than male
students.
Table 1.4 further shows that stream C had significant main effect of global thinking style
(F= 10.98, P < .01, dfs 1 and 272) mean value of science students (M=16.52) was higher
than the mean value of arts students (M=15.34). It leads to the conclusion that students of
science stream had more inclination towards global thinking style in comparison to students
of arts stream.
As regards interaction effects of A x B, B x C and A x C, factors for global thinking style,
they were not found to be significant (0.05) as F-ratios for these interactions were much less
than the required F-values. It means that culture (A) had similar effect for two levels of
gender (males and females) or gender had similar effect on two levels of stream (Science
and Arts) with regard to global thinking style. Also culture had same effect on stream with
reference to global style.
Table 1.4 shows that A x B x C interaction effect was also found non-significant
(F=0.398, P > .05, dfs 1 and 272). It conveys that culture, gender and stream combined
together had no significant influence on global style. In other works A x B interaction was
independent of factor „C‟ (Stream), B x C interaction was independent of factors A (culture)
and A x C interaction was independent of factor B (Gender).
Table 1.5 provides a summary of Three-Way analysis of variance with reference to local
styles
Table 1.5 2x2x2 ANOVA for local Style.
Source of
Variation
SS df MS F-Ratio Significan
ce
Culture A 85.8035 1 85.8035 10.1285 **
Gender B 114.4321 1 114.4321 13.5080 **
Stream C 0.175 1 0.175 0.0206 NS
A x B 27.0321 1 27.0321 3.1909 NS
B x C 44.0035 1 44.0035 5.1943 *
A x C 1.2892 1 1.2892 0.1521 NS
A x B x C 1.0321 1 1.0321 0.1218 NS
Within 2304.229 272 8.471429
Total 2577.996 279
Table 1.5 discloses that main effect of culture for local thinking style was highly significant
(F= 10.128, P < .01, dfs 1 & 272). It implies that students of Indian and Tibetan Culture
were markedly different on local thinking style. The mean value of local thinking style for

IJERS/ BIMONTHLY/DR. JEET SINGH RANA (598-618)
JULY-AUG, 2016, VOL-II, ISSUE-VIII www.srjis.com Page 609
Indian culture group was greater than that of mean value for Tibetan culture
group.(M=18.91 >M=17.8), On the basis of the observation it may be concluded that the
students belonging to Indian culture were more prone to use Local thinking style than
students belonging to Tibetan culture.
Table 1.5 further indicates that F-ratio (13.508) corresponding to gender effect was found to
be statistically significant at 0.01 level of significance. It shows that male and female
students had different levels of inclination for the use of local thinking style. Since mean
score of female group (M=18.99) was greater than the mean scores of male group
(M=17.71). It may be inferred that female students were superior to male students with
regard to use of Local thinking style. However no significant effect was found for stream.
Meaning thereby that the students of science and arts stream were similar with respect to use
of local thinking style (F= 0.020, P >.05, dfs 1 & 272) .
Table 1.5 reveals that interaction effect of factors A and B was non-significant (F=
5.1994, P >.05,dfs 1 and 272).It leads to the conclusion that effect of A factor (Culture) was
similar for two levels of „B‟ (gender).
Another interaction effect of factors B and C (gender & stream) was found to be
highly significant (F=5.194,P<.01,). It implies that gender had differential effect for two
levels of stream i.e. Science and Arts. In other words the difference between local thinking
styles mean scores of male and female students in science was highly significant from the
difference between local thinking style mean scores of male and female students in arts
group.
Interaction effect of A x C (culture and stream) was not found to be significant (F=0.222, P
> .05, dfs 1 and 272).
This conveys that effect of cultures was the same for two levels of stream (i.e.
Science and Arts).The three factor interaction between A, Band C factors was also non
significant (F= 0.889, P > .05,dfs. 1 and 272). It implies that the interaction between culture
(A) and gender (B) was similar for the two levels of factor C i.e. stream(science and arts)
Summary of the Three- Way-ANOVA in context of liberal style is presented in Table 1.6
that follows:-

IJERS/ BIMONTHLY/DR. JEET SINGH RANA (598-618)
JULY-AUG, 2016, VOL-II, ISSUE-VIII www.srjis.com Page 610
Table 1.6 2x2x2 ANOVA for Liberal Style
Source of
Variation
SS df MS F-Ratio Significan
ce
Culture A 128.9286 1 128.9286 13.9391 **
Gender B 44.8 1 44.8 4.8437 *
Stream C 2.4142 1 2.4142 0.2610 NS
A x B 40.1285 1 40.1285 4.3385 *
B x C 19.5571 1 19.5571 2.1144 NS
A x C 2.0571 1 2.0571 0.2224 NS
A x B x C 8.228571 1 8.228571 0.8896 NS
Within 2515.829 272 9.24937
Total 2761.943 279
F-ratio (13.939) was significant at .01 level of confidence. It corresponds to the main
effect of culture on liberal style. It implies that the students belonging to Indian and Tibetan
cultures differed significantly with regard to liberal style preference .The mean difference
of two culture groups was infavour of Indian culture (M=19.59 > M=18.24). From this it
may be concluded that students of Indian culture had more liking for the use of Liberal style
than Tibetan students.
The F-ratio (4.843) corresponds to main effect of gender. It was significant at .05
level of significance. It indicates that male and female students differed significantly with
regard to liberal style. Further, female students more preferred the use of liberal style then
their counterpart male students as the mean of latter group was greater than the former group
(M= 18.51 < M =19.31).
The third F-Ratio (0.261) was much lower than the required F-ratio to be significant
at .05 levels. It leads to the inference that there was no statistical significant difference
between uses of liberal style by the students of two streams. In other words students of
science and arts stream were similar in the use of liberal style. F-ratio (4.338) in respect of
interaction effect of A x B (culture x gender) was found to be significant at .05 level of
confidence. It means that effect of culture was not independent of gender.
Other two-factor interactions (B x C, and A x C) were non -significant. It points to the fact
that effect of gender was not dependent on stream and effect of culture was also not
dependent on stream.
Table 1.6 also makes clear that three –factor interaction (A x B x C) was non –significant (p
> .05, F= 0.889). It means that interaction effect of Ax B (Culture & Gender)
wasindependent of stream.
The results obtained from Three-Way-ANOVA have been summarized in table 1.7.as
follows-

IJERS/ BIMONTHLY/DR. JEET SINGH RANA (598-618)
JULY-AUG, 2016, VOL-II, ISSUE-VIII www.srjis.com Page 611
Table 1.7 2x2x2 ANOVA for Conservative Style
Source of
Variation
SS df MS F-Ratio Significa
nce
Culture A 221.432
1
1 221.4321 21.4130 **
Gender B 9 .2892 1 9 .2892 0.8982 NS
Stream C 73.0321 1 73.0321 7.0624 **
A x B 7.2321 1 7.2321 0.69936
8
NS
B x C 2.2321 1 2.2321 0.2158 NS
A x C 0.175 1 0.175 0.01692
3
NS
A x B x C 3.4321 1 3.4321 0.33189
8
NS
Within 2812.74
3
272 10.3409
Total 3129.56
8
279
Table 1.7 shows that first F-ratio (21.41)with respect to main effect of culture was found to
be highly significant , indicating that both groups of culture differed significantly for their
liking for Conservative style of thinking . Higher mean of Indian students than Tibetan
students (M=18.18 > M=16.4) indicates that students of Indian culture had more inclination
to use Conservative style of thinking than Tibetan students.
But non -significant F-Ratio (.898) in respect of gender shows that male and female students
had similar tendency to use conservative style. So far, main effect of streams is concerned, it
was found highly significant (F=7.062, P < .01,dfs 1 & 272). Further, higher mean value of
Conservative style in favour of arts stream group (M=17.8), reveals that arts students had
more tendency to use conservative style of thinking than their counterparts.
Table 1.7 further shows that none of the F-ratios for interaction effects of two-factors (A x B
, B x C , A x C) came out to be significant at .05 level , indicating that culture , gender and
stream factors jointly did not affect use of Conservative thinking style of secondary students.
Table 1.8 provides the statistical results of Three-Way-ANOVA with reference to Hierarchic
thinking style.
TABLE: 1.8 2x2x2 ANOVA for Hierarchic style
Source of
variation
SS df MS F-Ratio Significance
Culture A 64.12857 1 64.12857 8.11862 **
Gender B 78.22857 1 78.22857 9.903667 **
Stream C 22.85714 1 22.85714 2.893694 NS
A x B 18.51429 1 18.51429 2.343892 NS
B x C 98.41429 1 98.41429 12.45916 **
A x C 4.628571 1 4.628571 0.585973 NS
Ax B x C 2.414286 1 2.414286 0.305646 NS
Within 2148.514 272 7.89895
Total 2437.7 279

IJERS/ BIMONTHLY/DR. JEET SINGH RANA (598-618)
JULY-AUG, 2016, VOL-II, ISSUE-VIII www.srjis.com Page 612
Table shows that out of three, two F-Ratios (8.118 and 9.90) turned out to be highly
significant (P < .01 Level). These values correspond to the main effects of culture and
gender. From this it may be said that culture and gender had significant effect on the use of
hierarchic thinking style. Higher mean value in favour of Indian culture (M=19.13) points to
the fact that students belonging to Indian culture had more tendency to use Hierarchic style
than their counterparts (M= 18.17).
Similarly, higher mean value in favour of female students (M=19.18) reveals that female
students had greater preference for the use of Hierarchic style than their male counterparts
(M= 18 .12).But stream had no effect on hierarchic thinking style.In other words, science
and arts students had similar preferences for hierarchic thinking style.
As regards interaction effects, except B x C, none was found to be significant at 0.5 levels.
Significant B x C interaction effect suggests that effect of „A‟ (Gender) was dependent on
two levels of stream C (i.e. science and arts).
A summary of Three–Way-ANOVA with reference to monarchic thinking styles is given
below in tables 1.9 that follow
Table 1.9 2x2x2 ANOVA for Monarchic Style
Source of variation SS df MS F-Ratio Significance
Culture A 286.175 1 286.175 34.04247 **
Gender B 94.88929 1 94.88929 12.13587 **
Stream C 45.80357 1 45.80357 5.832472 *
A x B 36.43214 1 36.43214 4.659492 *
B x C 2.603571 1 2.603571 0.332984 NS
A x C 0.432143 1 0.432143 0.055269 NS
A x B x C 2.232143 1 2.232143 0.28548 NS
Within 2126.
743
272 7.818908
Total 2575.111 279
It may be seen in table 1.9 that the main effects of culture, gender and stream were
significant for Monarchic thinking style as F-ratios for the culture and gender were found
to be significant at .01 levels and F-ratio for stream was found to be significant at .05 levels.
Based on mean values of Monarchic style of thinking for various subgroups of students
preferred use of Monarchic style more than Tibetan students (M= 20.14 > M= 18.19).
Further, female students had more preference for the use of Monarchic style than their
counterpart‟s male students. (M=18.59 < M= 19.75); and arts stream students had more
preference for the use of Monarchic style than science stream students.

IJERS/ BIMONTHLY/DR. JEET SINGH RANA (598-618)
JULY-AUG, 2016, VOL-II, ISSUE-VIII www.srjis.com Page 613
It may also be observed that A x B interaction was found to be significant at .05 levels. (F=
4.65 P < .05,dfs 1 and 272.). From this it may be concluded that effect of culture was not
independent of gender with reference to Monarchic style of thinking
However, interaction effects of B x C (gender and stream), A x C (culture and stream) and A
x B x C (culture x Gender x Stream) were non – significant at .05 level of significance. From
this it may be said that joint effects of gender and stream, culture and stream, and culture,
gender and stream did not exist with reference to Monarchic thinking Style.
Table 1.10 provides a summary of Three-Way-ANOVA with regard to oligarchic style.
Table 1.10 2X2X2 ANOVA for Oligarchic style
Source of
variation
SS df MS F-Ratio Significance
Culture A 154.5143 1 154.5143 12.92439 **
Gender B 103.2143 1 103.2143 8.633386 **
Stream C 12.01429 1 12.01429 1.004938 NS
A x B 53.15714 1 53.15714 4.446343 *
B x C 48.05714 1 48.05714 4.019752 *
A x C 1.157143 1 1.157143 0.09679 NS
A x B x C 14.62857 1 14.62857 1.223611 NS
Within 3251.829 272 11.95525
Total 3638.571 279
It may be observed in table 1.10 that first F-ratio (12.924) came out to be highly significant
(P < .01, df 1 and 272). It conveys that main effect of culture existed on Oligarchic style.
Tibetan senior secondary students had more preferences for Oligarchic style than Indian
students.( M=16.69< M=18.17) Hence it may be said that the Tibetan culture was more
favorable for the use of Oligarchic thinking style.
Second F ratio (8.633) was also significant at .01 levels. This indicates that the gender had
marked effect on the use of Oligarchic style .Since female students had greater mean value
than male students (M=16.82 < M=18.04), it could be said that the female students were
more inclined to use oligarchic thinking style in comparison to male counterparts .
The third F-ratio (1.005) was non-significant. It suggests that there was no significant effect
of stream on the use of oligarchic style. In other words, students of science and arts streams
were having similar tendency to use oligarchic thinking style.
Table 1.10 further shows that interaction effect of „A‟ and „B‟ factors with reference to
oligarchic style was significant at .05 level. It means that the effect of culture was dependent
on gender for oligarchic style. There was difference in the effect of culture for male students
and female students.
B x C Interaction effect in oligarchic style was also significant at .05 levels. It implies that
there was a differential effect of gender for two levels of stream i.e. Science and Arts.
IJERS/ BIMONTHLY/DR. JEET SINGH RANA (598-618)
JULY-AUG, 2016, VOL-II, ISSUE-VIII www.srjis.com Page 614
However, interaction effect of A x C factors was not significant at .05 level. It means that
effect and culture was the same for two levels of stream (science and Arts)
Table 1.10 further shows that interaction effects of three factors A,B, and C (culture ,
Gender and stream ) was non-significant (f= 1. 223, P > .05) .This suggests that interaction
between A and B was not dependent on interaction effects of B x C and A and C . All the
three two factor interaction effects were independent of each other.
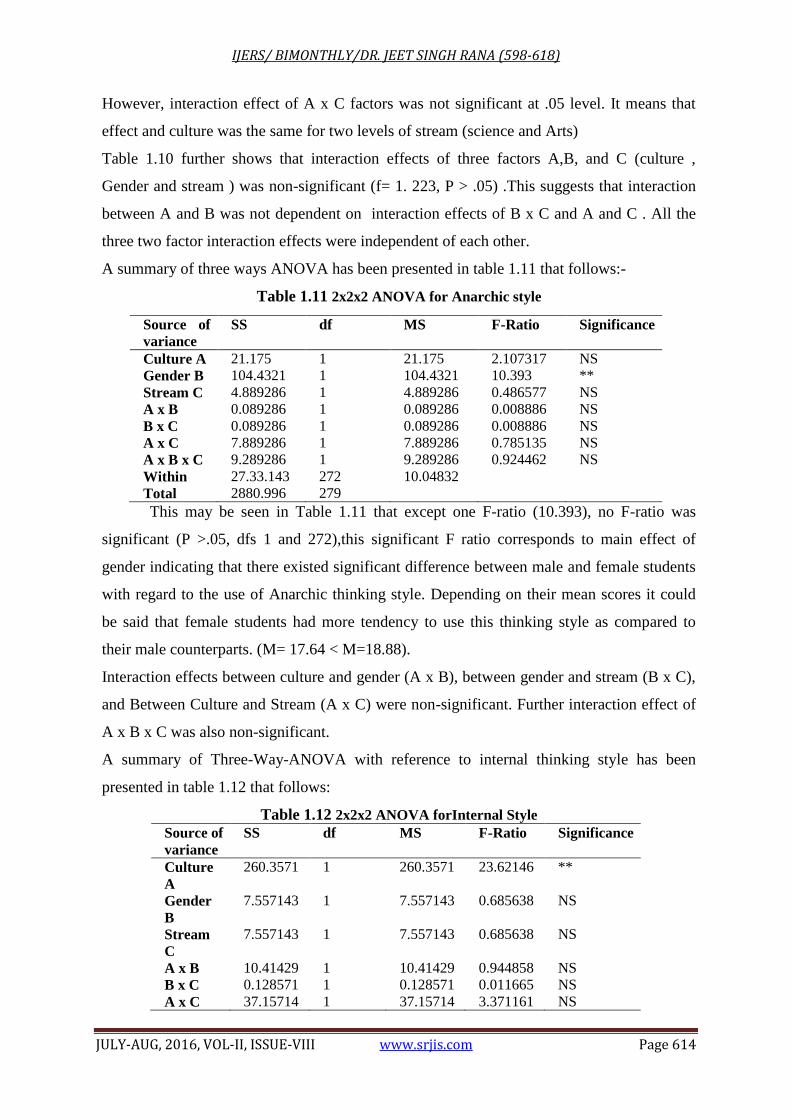
A summary of three ways ANOVA has been presented in table 1.11 that follows:-
Table 1.11 2x2x2 ANOVA for Anarchic style
Source of
variance
SS df MS F-Ratio Significance
Culture A 21.175 1 21.175 2.107317 NS
Gender B 104.4321 1 104.4321 10.393 **
Stream C 4.889286 1 4.889286 0.486577 NS
A x B 0.089286 1 0.089286 0.008886 NS
B x C 0.089286 1 0.089286 0.008886 NS
A x C 7.889286 1 7.889286 0.785135 NS
A x B x C 9.289286 1 9.289286 0.924462 NS
Within 27.33.143 272 10.04832
Total 2880.996 279
This may be seen in Table 1.11 that except one F-ratio (10.393), no F-ratio was
significant (P >.05, dfs 1 and 272),this significant F ratio corresponds to main effect of
gender indicating that there existed significant difference between male and female students
with regard to the use of Anarchic thinking style. Depending on their mean scores it could
be said that female students had more tendency to use this thinking style as compared to
their male counterparts. (M= 17.64 < M=18.88).
Interaction effects between culture and gender (A x B), between gender and stream (B x C),
and Between Culture and Stream (A x C) were non-significant. Further interaction effect of
A x B x C was also non-significant.
A summary of Three-Way-ANOVA with reference to internal thinking style has been
presented in table 1.12 that follows:
Table 1.12 2x2x2 ANOVA forInternal Style
Source of
variance
SS df MS F-Ratio Significance
Culture
A
260.3571 1 260.3571 23.62146 **
Gender
B
7.557143 1 7.557143 0.685638 NS
Stream
C
7.557143 1 7.557143 0.685638 NS
A x B 10.41429 1 10.41429 0.944858 NS
B x C 0.128571 1 0.128571 0.011665 NS
A x C 37.15714 1 37.15714 3.371161 NS

IJERS/ BIMONTHLY/DR. JEET SINGH RANA (598-618)
JULY-AUG, 2016, VOL-II, ISSUE-VIII www.srjis.com Page 615
A x B x
C
0.7 1 0.7 0.063509 NS
Within 2998 272 11.02206
Total 3321.871 279
A perusal of table 1.12 reveals that F-ratio (23.621) was highly significant. It corresponds to
the effect of culture. This means that students of Indian and Tibetan culture were
significantly different with regard to the use of Internal thinking style .Based on their means
it could be said that Indian students were superior to Tibetan students with regard to use of
Internal thinking style (M=18.44 > M=16.51).
Table 1.12 further reveals that main effect of gender and main effect of stream were non-
significant for the use of Internal thinking style. Two factor interaction effects were also
non-significant .In other words, interaction effect of culture and gender (A x B), interaction
effect of gender and stream (B x C), and interaction effect of culture and stream were not
found significant for Internal thinking style. It may also be observed in Table that A x B x C
interaction effect i.e. joint effects of culture, gender and stream was also non-significant at
.05 level for Internal thinking style.
Table 1.13 presents a summary of Three-Way-ANOVA of variance with regard to external
thinking style
Table 1.13 2x2x2 ANOVA for External style
Source of
variation
SS df MS F-Ratio Significan
ce
Culture A 0.003571 1 0.003571 0.000326 NS
Gender B 37.88929 1 37.88929 3.460-
474
NS
Stream C 3.432143 1 3.432143 0.313462 NS
A x B 8.576 1 8.576 0.783165 NS
B x C 75.089929 1 75.08992
9
6.857995 **
A x C 59.43214 1 59.43214 5.428009 *
A x B x C 7.232143 1 7.232143 0.66052 NS
Within 2978.171 272 10.94916
Total 3169.825 279
A perusal of F- ratio given in table 1.13 reveals that main effects of culture ,gender
and stream turned out to be non-significant (p >.05, df 1 and 272) as the corresponding F-
ratios were less than F-table value . It further means that students belonging to Indian and
Tibetan cultures did not differ significantly with regard to external thinking style. Also, male
and female students had similar tendency to use external thinking style. And there did not
exist significant difference in external thinking style of science and arts students.
F-ratio (0.783) was also non- significant at .05 level .It implies that main effect of „A‟
(Culture), factor was independent of factor „B‟ (Gender) or vice-versa.

IJERS/ BIMONTHLY/DR. JEET SINGH RANA (598-618)
JULY-AUG, 2016, VOL-II, ISSUE-VIII www.srjis.com Page 616
However, interaction effect of B x C and A x C factor came out to be significant at.01 and
at.05 level respectively. From this it may be said that effect of „B (gender) was dependent on
factor ‟C‟ (stream) and effect of „A‟ (culture) was also dependent on factor „C‟ (stream)
Table1.13 further indicates that A x B x C interaction effect was not statistically significant
(f=0.850) for External thinking style. It implies that A x B interaction was almost the same
for two levels of factor „C‟ (science and arts) or B x C interaction was almost same for two
levels of factor (culture)„A‟ or A x C interaction was almost the same for levels of factor „B‟
(Gender).
Discussion of the Results
Indian students showed greater preference for Legislative, Executive, LocalLiberal,
Conservative, Hierarchic, Monarchic and Internal style than their counterparts whereas
Tibetan students were higher than Indian in the use of Oligarchic style indicating the main
effect of culture. The obtained findings was not to the line of previous studies by Zhang et-
al (2012) which ascertained validity of Sternberg‟s theory of mental self Government for
Tibetan minority university students and to compare thinking styles of Tibetan students of
Han Chinese majority students. In this study, compared with Han Chinese students, Tibetan
students showed more inclination towards norm referenced thinking styles and less liking for
creativity generating thinking styles. Same sort of results were expected in context of Indian
vs. Tibetan students which were lacking in the study.
female students had significantly stronger preference than Male students for
Legislative, Executive, Judicial, Global, Local, Liberal, Hierarchic, Monarchic, Oligarchic,
and Anarchic thinking styles. These results appear to be inconsistent with several previous
studies, for example Grigorenko and Sternberg (1997),Zhang 1999, Gridley (2006) and
Chhabra 2008 did not report any gender difference in thinking style based on mental self
Government.Model of Sternberg‟s. But a number of studies have indicated that gender effect
existed in thinking style. For instance, Zhang and Sach 1999,Sood (2000), Nora (2000),
Verma (2001), Verma( 2001b),Chen (2001),Gillers and Sternberg(2001) Zhang and
Siller and Sternberg (2002), Kumari (2003), Verma and Sharma (2003), Tafti and
Babali (2007), Sheng-Pin Hasiag, (2009) Murphy (2009), Sood (2010)reported significant
effect of gender with reference to certain thinking style. It appears convincing as gender
being socialized variable has the characteristic to affect the style male and female do think.
Science students were higher on Global Thinking Styles and Arts students were
higher on Legislative, Conservative and Monarchic thinking Style. Some previous studies
have also stream related difference in thinking styles. Sternberg and Gregorenko (1995)

IJERS/ BIMONTHLY/DR. JEET SINGH RANA (598-618)
JULY-AUG, 2016, VOL-II, ISSUE-VIII www.srjis.com Page 617
reported a significant effect of discipline/subject on thinking styles. Humanities teachers
were found more Liberal than science teachers and science teachers were found more local
than humanities teachers. Zang and Sachs (1997)found that students of natural science and
technological subjects had more global thinking style than those in areas of social science
and humanities.
Implications for Education:
The study ascertained the difference in thinking styles of Indian and Tibetan culture groups
of senior secondary students and it was revealed that thinking styles may follow specific
cultures. Hence, this bears the implication that our ability to give every student a chance to
succeed depends upon a full understanding of culture and different type of thinking styles.
After all effective educational planning and practices must emanate from and understanding
of the ways an individual thinks,learns and take decision Consequently, knowing each
student ,especially his culture, is essential, preparation for facilitating structuring, and
validating successful learning for all students (Pat Guild, 1994). It is also recommended that
educators should acquire more explicit knowledge about particular cultural values and
expectation because such knowledge would enable educators to be more sensitive and
effective with students of particular culture. Proponents of thinking styles advocate that
teaching-learning and evaluation process should be based on culture specific style, in order
to yield best results in the classroom. However, some authors were against this practice.
For instance Hillgard (1989) thinks that, “ I remained unconvinced that the explanation for
low performance of culturally different “minority groups” students will be found by
pursuing questions of behavioral styles……. Children, no matter what their style ,are failing
primarily because of systematic inequities in the delivery of whatever pedagogical approach
the teacher claim to master – not because students cannot learn from teachers whose styles
do not match their own.”He further says that, “Educator need not to avoid addressing the
question of style for fear they may be guietly of stereotypying students. Empirical
observations are not the same as stereotyping but the observations must be empirical and
must be interpreted properly for each student.”
The present research also led to the inferences that gender and stream were
significant with reference to thinking styles. These findings have the implications that
variations in thinking styles due to gender and stream/ faculties/subjects should be given due
consideration in teaching. Educators should match teaching styles and techniques with those
styles differences. Simultaneously he should use and accommodate various thinking styles in
his teaching to benefit all students.

IJERS/ BIMONTHLY/DR. JEET SINGH RANA (598-618)
JULY-AUG, 2016, VOL-II, ISSUE-VIII www.srjis.com Page 618
However, no educational implication may be suggested based on two factor and three
factor interactions related findings.
Broadly speaking variation in culture, thinking styles should find an important place in
school education to make it more meaningful and more effective.
References
Chabbra,P(2008) A study of thinking style of B.E.d. students in relation to self-esteem M.Ed
Dissertation , SCOE,KU.
Chen, Chun Hsien (2001) Preffered Learning Styles and Predominant Thinking Styles of Taiwanese
Students in Accounting Classes. Dissertation Abstracts International , 62 (3), 1113-A.
Dunn, R.Dunn, K.and Price, G.E. (1975) Learning style Inventory (LSI) Lawrence, Kans : Price
Systems.
Gridley, M.C (2006) Preferred Thinking styles of professional Fine Artits. Creativity Research
Journal, 18 (2), 247-248.
Kumar Raj (2006) A study of Cognitive and Learning Style among Tribal and Nontribal senior
students of Himachal Pradesh.
Kumari , V .(2003) A study of Motivational , Learning strategies and thinking styles of University
students in Relation to Gender , Residence and Study Track. M.E.d. Dissertations, HPU.
Mundim, M.C.B &Wechsler,S.M ( 2006) Creative style among organizational leaders. Boletin de
psychologia V, VII, 15-32
Murphy, A. (2009) A comparison of the emotional Intelligence and thinking Styles of students in
different University Study Fields. Doctoral Dissertation, University of south Africa.
Nora, L. (2000) A usefulness of Thinking Styles in Reflecting How individuals Think and Explaining
School Performance M.A (Edu.) Dissertation,University of HongKong
Sagone, E.andCarli , M. Eide (2012) Creativity and thinking style in arts , sciences and humanistic
high school department of education sciences , University of Catania
Sood, Monika (2010) A study of Thinking, learning and Problem solving styles of Teacher Trainees
aid Function of their creativity and Gender Ph.D. Thesis Edu. H.P.U.
Sternberg R.J. (1997),Thinking styles. New York : Cambridge University Press.
Tafti and Babbli ,F. (2007) A study of Comparability of Thinking Styles with The field of studies and
Creativity Of University Students . M.A Tesis, Alzahr University Iran.
VermaAmila (2001) Effect of Culture,gender and Stream on Students styles of thinking and Decision
Making M.Ed. Dissertation,HPU.
VermaSaroj and Sharma, K (2003) Thinking Styles Among Prospective Secondary Teachers.
PsycholinguaVol.33 (2), 101-108.
Yildizlar, M. (2011) Comparison of candidates Thinking style according to some Demographic
Variables. International Online Journal of Educational Sciences,3(1), 294-320.
Zhang L.F. (2002) Are thinking styles and personality types Related? Educational Psychology,
Vol.20 (3), 271-283.
Zhang, L, F &Sach .J (1997) Assessing thinking styles in the theory of mental self –government: A
Hong Kong validity study .Psychology Reports, 81.915-928


