
THREE ESSAYS ON BANKS’ TRADING ACTIVITIES
Mohammad Tanvir Ansari
Bachelor of Technology ABV-IIITM
Master of Business Administration ABV-IIITM
Submitted in fulfillment of the requirements
of the degree of Doctor of Philosophy
School of Economics and Finance
Queensland University of Technology
Brisbane, Australia
October 2014

ii
Keywords and Abbreviations
Akaike Information Criterion (AIC)
American Stock Exchange (AMEX)
Asset-backed Securities (ABS)
Bank Holding Company (BHC)
Call Report Agency (CRA)
Capital Adequacy Ratio (CAR)
Central Data Repository (CDR)
Certificate of Deposits (CD)
Collateralized Debt Obligation (CDO)
Credit Risk Transfer (CRT)
Earnings per Share (EPS)
Exchange Traded (ET)
Federal Deposit Insurance Corporation (FDIC)
Federal Financial Institutions Examination Council (FFIEC)
Federal Reserve Bank (FRB)
Generalized Least Square (GLS)
Global Financial Crisis (GFC)
Gross Negative Fair Value (GNFV)
Gross Positive Fair Value (GPFV)
Held to Maturity (HTM)
London Interbank Offered Rate (LIBOR)
Money Market Deposit Account (MMDA)
Multinomial Logistic (ML)
National Association of Securities Dealers Automated Quotations (NASDAQ)
New York Stock Exchange (NYSE)
Non-Financial Commercial Paper (NFCP)
Off-Balance Sheet (OBS)
Office of the Comptroller of the Currency (OCC)
Ordinary Least Squares (OLS)
Originate to Distribute (OTD)
Originate to Hold (OTH)
Over the Counter (OTC)
Panel Vector Autoregression (PVAR)
Repurchase Agreement (REPO)
Residential Mortgage Backed Securities (RMBS)
Risk Weighted Asset (RWA)
Special Purpose Vehicle/Entity (SPV/SPE)
Structured Investment Vehicle (SIV)
Uniform Bank Performance Report (UBPR)

iii
Abstract
With a fair share of the blame for the subprime crisis pointing to banks’ extensive
involvement in trading, this thesis examines three closely related issues: (i) the
factors that motivate banks to become extensively involved in trading; (ii) the
impact of banks’ trading activities on information opacity; and (iii) the existence of
a trading channel, and whether banks’ trading activities have insulated lending and
capital channels from monetary policy.
Using logit, OLS, and multinomial logistic regression frameworks for a large
unbalanced panel dataset of 1,523 U.S. commercial banks during 2003Q4 to 2013Q2,
the first essay shows that regulatory capital arbitrage, insolvency risk, and non-
interest income are all important reasons for banks to become involved in trading.
For a sub-sample of banks that are engaged in trading, we find that an increase in
credit risk and liquidity risk decreases banks’ trading exposure in the following
quarter. In contrast, an increase in non-interest income and regulatory capital
arbitrage opportunity encourages banks to increase their trading exposure in the
following quarter. Comparing banks that are extensively involved in trading to
those that are only marginally involved, we find that regulatory capital constraint
(arbitrage) encourages banks to be extensively engaged in securitization and asset
sales but not in off-balance sheet derivatives. Further, credit risk and liquidity risk
discourage banks to become extensively engaged in trading, while non-interest
income encourages banks to extensively involve in trading. Overall, our results
suggest that banks are extensively involved in trading as intermediaries to facilitate
risk management for small banks and other market participants as end users.
Using a panel regression framework for a sample of 275 U.S. commercial
banks listed on the NASDAQ/NYSE/AMEX from 1999Q4 to 2012Q2, our second essay
examines the impact of banks’ trading activities on information opacity. Our
findings support the widely held perception that banks’ off-balance sheet trading
activities, in particular, derivatives (equity, commodity, interest rate and foreign
exchange rate derivatives) and swaps (interest rate and foreign exchange rate
swaps) are making banks more opaque followed by asset sales and securitization
such as family residential mortgages and auto loans. Overall, our results suggest
that concerns surrounding the measurement and reporting of banks’ trading
activities appear warranted.
With banks’ business model changing from ‘‘originate and hold’’ to
‘‘originate, repackage, and sell’’, our last essay examines whether a trading channel
exists besides capital and lending channels, and whether this channel has
weakened the effectiveness of monetary policy on the banks’ capital and lending
channels. Using a panel vector autoregression (VAR) framework for a sample of
580 U.S. commercial banks during 2003Q1 to 2012Q4, our findings confirm the
existence of a trading channel. That is, when banks’ asset funding is restricted due

iv
to an increase in the cost of borrowing, banks tend to reduce lending, liquidate their
securities holdings, and freeze asset sales and securitization so as to maintain their
capital and risk-taking profile. In contrast, when banks’ income sources are
squeezed (due to decreased lending, asset sales, and securitization), the observed
increase in off-balance sheet trading activities seems to be motivated by income
rather than hedging. Of key concern to regulators, we find no evidence that banks’
involvement in trading activities has changed the transmission of exogenous
shocks through the capital and lending channels; banks still prioritize their balance
sheet adjustments first through their traditional business activities and then
through their trading activities.
v
Table of Contents
CHAPTER 1: INTRODUCTION ............................................................................................. 1
ESSAY 1: What Drives Banks to Trading? .......................................................................... 2
ESSAY 2: Banks Opacity and Information risk .................................................................. 4
ESSAY 3: Trading Channel and Transmission of Monetary Policy Shocks ...................... 5
THESIS LAYOUT .................................................................................................................. 7
CHAPTER 2: WHAT DRIVES BANKS TO TRADING? ........................................................... 9
2.1. Introduction ............................................................................................................. 9
2.2. Literature Review ................................................................................................... 16
2.3. Data and Research Method .................................................................................... 21
2.4. Empirical Results .................................................................................................... 28
2.5. Conclusion .............................................................................................................. 39
CHAPTER 3: BANKS OPACITY AND INFORMATION RISK .............................................. 45
3.1. Introduction ........................................................................................................... 45
3.2. Literature Review ................................................................................................... 51
3.3. Hypotheses ............................................................................................................ 60
3.4. Data and Research Method ...................................................................................64
3.5. Empirical Results ................................................................................................... 80
3.6. Conclusion .............................................................................................................. 95
CHAPTER 4: TRADING CHANNEL AND TRANSMISSION OF MONETARY POLICY
SHOCKS .......................................................................................................................... 104
4.1. Introduction ......................................................................................................... 104
4.2. Data and Research Method ................................................................................... 111
4.3. Empirical Results ................................................................................................... 119
4.4. Conclusion ............................................................................................................. 135
CHAPTER 5: SUMMARY AND CONCLUSION .................................................................. 141

vi
List of Tables
Table 2.1: Descriptive Statistics ...................................................................................... 29
Table 2.2: Logit Regression Analysis of Propensity of Banks to Engage in Trading .... 31
Table 2.3: OLS Regression Analysis of Banks’ Trading Activity .................................... 35
Table 2.4: Multinomial Logistic Regression Analysis of Banks’ Trading Activity ........ 37
Table 3.1: Distribution of U.S. Banking Industry ......................................................... 66
Table 3.2: Verification of I/B/E/S Earnings Announcement Dates ................................ 68
Table 3.3: Descriptive Statistics ..................................................................................... 76
Table 3.4: Notional Value of Assets Held to Maturity (HTM) on the Bid-Ask Spread . 81
Table 3.5: Notional Value of Available for Sale (AFS) Securities on the Bid-Ask
Spread ............................................................................................................................... 83
Table 3.6: Notional Value of Trading Securities (Derivatives) on the Bid-Ask Spread 85
Table 3.7: Fair Value of Trading Securities (Derivatives) on the Bid-Ask Spread ......... 87
Table 3.8: Notional Value of Trading Securities (Swaps) on the Bid-Ask Spread ....... 88
Table 3.9: Robustness Tests for Opacity by Bank Size ................................................. 90
Table 3.10: Robustness Tests Using Alternative Proxy of Information Risk ................. 92
Table 3.11: Economic Significance .................................................................................. 93
Table 4.1: Descriptive Statistics ..................................................................................... 120
Table 4.2: PVAR Results for Exogenous Shocks .......................................................... 123
Table 4.3: PVAR Results of the Impact of Shocks in Banks’ Traditional Activities on
Trading Activities ............................................................................................................ 130
Table 4.4: PVAR Results of Shocks in Banks’ Trading Activities on Traditional
Activities ........................................................................................................................... 133

vii
List of Figures
Figure 4.1: Impulse responses of growth in banks’ capital, deposits, and lending to a
one-standard deviation shock in CD spread, NFCP spread and FF spread ................... 125
Figure 4.2: Impulse responses of growth in banks’ trading activities to a one-standard
deviation shock in the CD spread, NFCP spread and FF spread .................................. 128
Figure 4.3: Impulse response of growth in banks’ trading activities to a one-standard
deviation shock in the growth of banks’ capital, deposits, and lending ..................... 132
Figure 4.4: Impulse responses of growth in banks’ capital, deposits, and lending
activities to a one-standard deviation shock in growth of banks’ trading activities .. 134

viii
Statement of Original Authorship
The work contained in this thesis has not been previously submitted to meet
requirements for an award at this or any other higher education institutions. To the
best of my knowledge and belief, the thesis contains no material previously
published or written by another person except where due reference is made.
13 October 2014
QUT Verified Signature

ix
Dedication
This thesis is dedicated to the Creator of Knowledge (S.W.T.), the City of
Knowledge (S.A.W.), and the Door (A.S.) to the City of Knowledge.

x
Acknowledgements
I would like to thank Allah for his grace, blessings, and wisdom throughout this
journey of knowledge that I wish to be never ending.
First and foremost, I am deeply grateful to my supervisor, A/Prof Peter Verhoeven.
His consistent encouragement, support, and deep interest in the PhD projects
enabled me to work harder. I am also indebted to my supervisor for his support
during the times when I was coping with personal issues. In his words, “PhD is a
journey, enjoy and make it memorable, Tanvir”, and I did just that. Thank you for
everything! I also want to express my gratitude to Prof Janice How, my associate
supervisor, for her help and support throughout the process. I find the winning
qualities of challenge and support in my supervisors, Peter and Janice. Nothing I
proposed went unchallenged, and steadfast support was always there.
I am also grateful to Prof Terry Walter, Prof Douglas Foster, Dr John Chen, Dr
Doureige Jurdi, and Dr Jason Park who freely gave their valuable time to review the
work and share their experiences with me. Their contributions are much
appreciated.
I am proud to have completed this thesis while studying at Queensland University
of Technology, and I am thankful for the professional and financial support
University has provided me, especially Prof Michael Kidd, Dr Stephen Cox, Dr
Jonathan Bader, Ms Carol O’Brien and Mr Dennis O’Connell.
There is no way I could have completed this thesis without benevolent prayers and
blessings of Muslim Ansari (late), Wahid Ali Ansari (late), Sultana Khatoon (late),
Sharifoon Nisa (late), Imtiyaz Ansari (father), Maqbool Mohammad, Shaheen
Perveen (mother), and Mahe Talath. My father was a major motivation to start off
my PhD journey and my mother has been a source of inspiration. There are not
enough words to express my feelings of gratitude to them. I am also thankful to
Prof S. G. Deshmukh and A/Prof Joydip Dhar for motivating me to start my PhD
journey.
Last but not least, I am deeply obliged to my wife (Arfa) for her understanding,
emotional support, and taking care of many issues pertaining to my family
throughout the process of learning and this journey. I am also thankful to my
brothers (Faijan, Sufiyan, and Aamir), Azad Ansari, Intekhab Ansari, Manoj Kumar,
and all my friends who have always encouraged me throughout this journey. I also
want to share my happiness with my colleagues at QUT. By the end of this journey
of knowledge, I would like to welcome my new born baby girl, Aisha Tanvir. Her
presence made a perfect ending of my PhD journey.

xi
Note
I have presented the findings of this thesis at the following conferences:
1. Presented paper titled “Balance Sheet Adjustments, Banks’ Trading Channel and the
Transmission of Monetary Policy Shocks” at The 5th Financial Markets and Corporate
Governance Conference, Brisbane (Australia) – 2014
Runner up for “Financial Institutions and Markets” best research paper award.
2. Presented paper titled “Complexity or Transparency: What Makes Banks Opaque?”
at The 21st International Business Research Conference, Toronto (Canada) – 2013
Won “Banking research” best paper award.
3. Presented paper titled “A Conditional VAR Analysis of Banks’ Trading Channel” at The
SIRCA Second Young Researcher Workshop, Sydney (Australia) – 2013
Selected among “top 15” invited presenters.
4. Presented paper titled “Balance Sheet Adjustments, Banks’ Trading Channel and the
Transmission of Monetary Policy Shocks” at The 26th Australasian Finance and
Banking Conference, Sydney (Australia) – 2013
5. Presented paper titled “Shock Transmission through Banks Traditional and Trading
Activities: A PVAR Analysis” at QUT PhD Symposium, Brisbane (Australia) – 2013
Symposium fees waived.
6. Presented paper titled “Banks Opacity and Information Asymmetry around Quarterly
Earnings Announcements” at The 25th PhD Conference in Economics and Business
at University of Western Australia, Perth (Australia) – 2012
Symposium fees waived.

1
CHAPTER 1:
INTRODUCTION
The U.S. banking industry has reshaped itself over the last few decades as extensive
regulations implemented since the Great Depression in the 1930s were steadily repealed.
Debates on banking deregulation began in the 1970s, but it took nearly three decades to
endorse the Riegle-Neal Act of 1994 and Gramm–Leach–Bliley Act of 1999. Both Acts
encouraged banks to embrace financial innovations throughout the era of rapid technological
advancement in information flow. Deregulations fostered real competition between bank and
non-bank financial companies and gradually eroded interest margins from traditional banking
activities. In response, banks altered their business model from “originate and hold” to
“originate, repackage, and sell”. Moving away from their traditional business model, (some)
banks adopted a high output, short-term oriented, and low cost business model that relied
primarily on economies of scale, with automated production and distribution processes to
deliver standardized financial products and services.
The increasingly fee-income focused business strategies and greater accessibility to
unrestricted credit expansion through trading activities in the early 2000s fundamentally
altered banks’ risk-return profile. At the start of 2007, problems surfaced in banks’ credit
expansion, especially in the U.S. residential mortgage market, with an increasing number of
foreclosures and loan defaults resulting in plummeting values of mortgage-backed securities.
This culminated in a liquidity freeze in the wholesale lending market and the subsequent credit
crunch. In response, the U.S. Federal Reserve initiated the largest government bailout seen

2
to date, along with a range of other liquidity interventions aiming to revive lending and
financial markets liquidity.
While studies on the global financial crisis (GFC) point to various reasons for the turmoil,
the rapid expansion of banks’ trading activities, including short-term borrowings funded
lending, securitization, asset sales, and off-balance sheet (OBS) derivative activities have been
singled out as the most significant contributors. The purpose of this thesis is to shed more
light on the implications of trading-based banking. In particular, this thesis examines three key
concerns relating to banks’ trading activities: (i) what motivates banks to become extensively
involved in trading; (ii) what is the impact of banks’ trading activities on information opacity;
and (iii) do banks’ trading activities moderate the impact of monetary policy on banks’ capital
and lending channels. These issues form the basis of the three essays in this thesis.
ESSAY 1: WHAT DRIVES BANKS TO TRADING?
Following the debate on the role of banks’ trading activities in exacerbating the recent
financial crisis, this essay investigates key factors that drive banks to engage in trading. A
special emphasis is given to the widespread debate on the extent to which income and risk
mitigation motivates banks to switch from being primarily an intermediary in the economy to
that of being a trader. First, we ask why some banks engage in trading and others abstain.
Second, of regulatory key concern, we ask why some banks are heavily involved in trading
while others only marginally. Our experimental setup uses logit, OLS, and multinomial logistic
regression frameworks for a large unbalanced panel dataset of 1,523 U.S. commercial banks
during 2003Q4 to 2013Q2.
3
Consistent with literature, we find that regulatory capital arbitrage, avoiding insolvency,
and non-interest income are the key motivations for banks’ decision to engage in
securitization, asset sales, and OBS derivatives. However, credit risk turned out not an
important factor in banks’ decision to engage in trading. Our results also show that banks’
propensity to engage in trading increases with the size of the lending portfolio and bank size.
In contrast, management efficiency and the size of deposits reduce banks’ propensity to
engage in trading.
For a subsample of banks that are involved in trading, an increase in credit risk and
liquidity risk decreases securitization, asset sales, and OBS derivative exposure in the
following quarter. For banks that are involved in trading, our OLS model also shows that credit
risk is a significant driver of the volume of securitization, asset sales, and OBS derivatives in
the following quarter. In contrast, an increase in non-interest income and regulatory capital
encourages banks to increase their trading exposure in the following quarter. These findings
are consistent with our argument that banks care about their risk-taking profile, and this is an
important deciding factor for engaging in trading activities.
Next, we compare banks that are extensively involved in trading with banks that are
only marginally involved. Our results show that banks with higher liquidity risk are less likely
to be heavily involved in securitization, asset sales, and OBS derivatives. Further, our
multinomial logistic regression shows that credit risk is an important barrier to banks to
become extensively involved in OBS derivatives. For these banks, an increase in credit risk
decreases OBS derivative volume in the following quarter. We also find that when regulatory

4
capital arbitrage opportunities arise, banks are more likely to further increase their exposure
to securitization and asset sales activities in the following quarter. Banks that are heavily
involved in OBS derivatives are insensitive to regulatory capital constraints. Overall, our
finding suggests that banks engage extensively in OBS derivatives as intermediaries to
facilitate risk management for other banks in the economy, while banks that are marginally
involved in OBS trading do so as end users. Findings on non-interest income show that the key
motive behind trading is profitability, as expected.
ESSAY 2: BANKS OPACITY AND INFORMATION RISK
The second essay examines the role of banks’ trading activities in increasing information
opacity. The goal of achieving transparency has become more challenging in recent years as
banks have become increasingly involved in complex and dynamic trading activities, making
it harder for outsiders to comprehend the full extent of banks’ risk exposure. Using a sample
of 275 U.S. commercial banks listed on the NASDAQ/NYSE/AMEX from 1999Q4 to 2012Q2, we
examine various on- and off-balance sheet activities that are thought to be responsible for
bank opacity. In particular, we examine three major categories of financial assets as per the
U.S. accounting standards: (i) financial instruments held to maturity (HTM); (ii) assets for
securitization and sale (AFS); and (iii) trading securities (TS). The on-balance sheet activities
we investigate include: (i) secured loans from the lending books; (ii) various phases of
troubled loans; and (iii) loans securitization and asset sales from trading books. Banks OBS
activities examined consist of (i) notional and fair value of derivative exposures; (ii) net use of
derivatives held (hedging vs. trading purposes); (iii) exchange traded vs. over the counter
5
(OTC) derivative exposure; and (iv) swap exposure. For each banks activity, we examine both
the total exposure and the exposure by asset type to determine which asset category drives
information opacity.
Our findings from panel regression models support our argument that banks’ derivative
exposure contributes the most to information opacity, followed by available for sale
securities, and securitization of family residential loans. Further, of the HTM assets, FDIC
Texas ratio and loans secured by farmlands are the most significant contributors to bank
opacity. We conduct a number of robustness tests and find our results are robust to an
alternative proxy for information risk and for sub-samples of large and small banks. Our
results suggest that concerns surrounding the measurement and reporting of banks’ financial
assets and trading activities appear warranted. Specifically, we provide evidence that
advocates the current disclosure practice in the banking sector is insufficient to mitigate
investors’ perception of information risk associated with banks’ lending and trading activities.
The goal of achieving transparency and reducing information risk requires more timely and
detailed disclosure about the increasingly more complex and dynamic assets and risk
exposures of banks.
ESSAY 3: TRADING CHANNEL AND TRANSMISSION OF MONETARY POLICY SHOCKS
The last essay of this thesis examines the interaction between traditional banking activities
and trading activities in the presence of monetary policy shocks. Since banks’ trading activities
now play an important role in both banks’ revenue and risk management, we propose that
the “originate, repackage, and sell” business model may have changed the way banks absorb
6
monetary policy shocks. We propose that besides the capital and lending channels, there
exists a trading channel in monetary policy shock transmission and that this channel has
weakened the transmission of monetary policy through the capital and lending channels.
Using a panel vector autoregression (VAR) framework for a sample of 580 U.S.
commercial banks during 2003Q1 to 2012Q4, we show the existence of a trading channel
similar to the capital and lending channels in monetary policy shock transmission. When
banks’ asset funding is restricted due to increases in borrowing costs, banks tend to reduce
lending, liquidate their securities holdings, and freeze asset sales and securitization in order
to maintain their capital and risk-taking profile. In contrast, when banks’ income sources are
squeezed due to decreased lending, asset sales, and securitization, the observed increase in
OBS trading activities seems to be motivated by income rather than hedging. Our results can
be interpreted in terms of the capital and lending channels theory, which argues that the
assets side of banks’ balance-sheet drops (e.g., a reduction in loan issues) to match a
reduction in deposits or asset funding following a monetary tightening. In particular, we show
that the unavailability of deposit funding and non-deposit borrowings leads to a reduction in
asset funding. This in turn reduces banks’ lending activity in order to maintain the capital-to-
asset ratio (Bernanke and Lown, 1991; Hancock and Wilcox, 1993-95). The results reveal that
non-deposit funding sources that are easily accessible and provide a cheaper source of capital
to banks have added to the capital and lending channels, and play an important role in
monetary policy shock transmission through balance-sheet adjustments. However, the
7
trading channel has not affected the way monetary policy shocks are absorbed through the
lending and capital channels.
We also find that monetary policy transmission through banks’ traditional capital and
lending channels, and trading channel vary significantly across banks’ reserve levels. Banks
with larger reserves adjust their balance sheet noticeably faster and by a proportionately
larger amount through the capital and lending channels than banks with lower reserves. This
finding supports our argument that well-capitalized banks with higher reserve holdings have
greater opportunity to be involved in trading activities with minimum funding stress. Further,
banks with lower reserves tend to increase short-term borrowings more than banks with
higher reserves in the following quarters to fund their assets. This suggests that for a rise in
non-deposit borrowing costs, banks with lower reserves anticipate scarcity of funding and
liquidity in the near future so they tend to hoard more reserve by borrowing from non-bank
creditors (money-market funds and asset-backed commercial papers). In contrast, as we saw
during the GFC, banks with larger reserves take advantage of other banks’ fire sales and earn
more income by providing costly lending to the other banks.
THESIS LAYOUT
The rest of the thesis is organized as follows. Chapter 2 examines the determinants of banks’
propensity to engage and their exposure to trading activities; Chapter 3 examines the impact
of banks’ trading exposure on information opacity; Chapter 4 investigates the trading channel
and its role in monetary policy shock transmission through the lending and capital channels.
Finally, Chapter 5 provides a summary of the findings and a conclusion.

8
CHAPTER 2:
WHAT DRIVES BANKS TO TRADING?
2.1. INTRODUCTION
“…the boom in subprime mortgage lending was only a part of a much broader credit boom characterized by an underpricing of risk, excessive leverage, and the creation of complex and opaque financial instruments that proved fragile under stress …”
Ben Bernanke Former Federal Reserve Chairman
UCLA Symposium: The Mortgage Meltdown, the Economy, and Public Policy 31 October, 2008
The unique intermediary role that banks play in the economy is an important and widely
discussed topic. Banks pool resources from dispersed capital providers and channel these
funds to borrowers in the form of loans. As fractional-reserve depository institutions, banks
also create credit through new deposits.1 Due to their inherent illiquidity, loans are typically
held on banks’ balance sheet till maturity or default – such is the process under the “originate
and hold” model. Spurred by banking deregulation and financial innovations, a small number
of large banks have become heavily involved in credit risk transfer (CRT) activities, in particular
securitization, asset sales, and OBS derivatives.2 This is the so-called ‘‘originate, repackage,
1 Banks will grant new credits as long as the existing excess reserves are sufficient to cover the new deposits created through bank credit. 2 The process of putting together relatively illiquid assets, using them as collateral for backing new securities, and using the proceeds from the sale of the securities to fund owners of the illiquid assets is called securitization. It is relatively straightforward to comprehend that fractional-reserve banks can grant as much new loans as credits have been securitized; as long as there is demand from investors for asset-backed securities, the process of securitization can be repeated over and over again.
9
and sell’’ model, where loans originated by banks are distributed to investors who fund them
through special purpose vehicles (SPVs) and conduits.
From the bankers’ point of view, the benefits of credit expansion through trading in CRT
markets are fairly well understood (Sinkey and Carter, 2000; Panetta and Pozzolo, 2010).
Securitization and asset sales have provided banks with an alternative source of liquidity for
their illiquid loans, separate from the central bank’s open-market operations, thereby
weakening the impact of monetary policies on banks (Affinito and Tagliaferri, 2010).
Securitization and asset sales improve banks’ capital adequacy ratio, and thus present a way
to circumvent capital adequacy regulations by partially or fully transferring credit risk from
banks’ books to investors in the asset-backed securities. While depriving the credit originator
of the interest yield, which is transferred to the buyers of the asset-backed securities,
securitization and asset sales generate non-interest income through a higher frequency of
bank fees. Since banks can grant as much new loans as the amount of credits that have been
securitized or sold, as long as there is a demand for asset-backed securities, the accumulation
of bank fees from securitized or sold loans may well exceed the interest rates received on a
smaller amount of credit otherwise kept on the balance sheet. Finally, securitization and asset
sales provide opportunities for banks to create value through cross-selling and enhancing
borrower-lender relationship.
Duffee and Zhou’s (2001) model shows that compared to loan sales and securitization,
credit derivatives are well equipped to deal with the lemon problem; they allow for buying
risk protection on a shorter horizon, while informational asymmetries mostly arise in the
10
longer term on banks’ deposits and loans. Nicolo and Pelizzon (2005) demonstrate how
different forms of credit derivatives can be used to signal the quality of banks’ lending under
the regulatory capital requirements, even when credit derivatives are private contracts.
Arping (2014) shows that by insulating lenders against losses from forcing borrowers into
default and liquidation, derivatives markets improve the credibility of foreclosure threats,
which can have positive implications for borrowers’ incentives and credit availability ex ante.
Allen and Santomero (1996) suggest that banks as intermediaries have advantages over
individuals to create and facilitate financial instruments for agents’ risk management or
trading needs.3 As intermediaries, banks help agents to reduce their participation cost
including the cost of learning about the effective use of complex instruments in the market
on a day to day basis. Therefore, agents’ requirement for risk management and banks’ ability
to facilitate such needs have broadened banks’ role in the financial system.
Irrespective of the benefits that trading on CRT markets may bring, the literature shows
that there are significant associated risks which can potentially destabilize the more fragile
banks that are heavily involved in trading. Santomero and Trester (1998) focus on financial
innovations which reduce informational asymmetries when selling assets in a crisis. They find
that such innovations, similar to sophisticated CRT instruments, lead to increased risk-taking
by banks. Kero (2013) shows that financial innovation increases banks’ appetite for risky
investment both in the primary and secondary markets, and that this effect is stronger in
3 The traditional financial intermediation theory would suggest that with falling transaction costs and information asymmetries, the unique role of banks should have disappeared not broadened (Scholtens and Wensveen, 2003).
11
environments with low aggregate macroeconomic risk. Indeed, the empirical literature shows
banks that are engaged in trading become highly leveraged, have higher income volatility, and
take on significantly more risks in subsequent years (Li and Yu, 2000; Cebenoyan and Strahan,
2004; Lepetit et al., 2008; Brunnermeier et al., 2012).
Since CRT trading is limited to just a few banks, the empirical literature has mainly
focused on the financial characteristics of banks that do and do not trade CRT instruments.
Although mixed, the findings generally show banks that are engaged in trading are larger,
have higher profitability, riskier capital structures, greater maturity mismatches between
assets and liabilities (liquidity risk), greater net loan charge-offs, and lower net interest
margins than non-traders (Benveniste and Berger, 1987; Jagtiani et al., 1995; Sinkey and
Carter, 2000; Panetta and Pozzolo, 2010; Shiu and Moles, 2010; Ashraf and Goddard, 2012).
While it is difficult to distinguish from banks’ books whether they use derivatives for hedging
or speculation purposes, the findings appear to be more consistent with enhancing banks’
income than risk hedging as the key reason for trading.
The extant studies are however limited to identifying financial characteristics as hurdles
for banks to get involved in trading. Discrete choice models used in the literature do not reveal
anything about the extent of banks’ involvement in trading. For example, a bank’s
involvement in derivatives at one percent or 100 percent of total assets would be coded
identically. Why some banks are heavily involved in trading and others are only marginally

12
involved remains an important but largely unexplored question.4 Gruber and Warner (1977)
suggest that the costs of bankruptcy and of implementing risk management are relatively
higher for less capitalized and smaller banks. They suggest that these banks would benefit the
most from risk hedging through trading as end users. On the other hand, well capitalized and
larger banks would benefit the most from providing risk hedging through trading to end
users.
Our experimental setup uses logit, ordinary least squares (OLS), and multinomial logistic
regression models for a sample of 1,523 U.S. commercial banks over the period 2003Q4 to
2013Q2. We extend the literature by examining two broad research questions which help to
further our understanding of the changing role of banks in the economy, from purely
functioning as intermediaries to end users. First, we ask why some banks engage in trading
while others abstain? Second, and of key concern to economists and regulators, we ask why
some banks choose to become more extensively involved in trading and others marginally.
Our results show that regulatory capital arbitrage, insolvency risk, and non-interest
income all motivate banks to engage in trading. However, credit risk is insignificantly related
4 For our sample duration from 2003 to 2013, 81 percent of banks participate in at least one type of trading activity, i.e., securitization, asset sales, and OBS derivatives. Around 92 percent of those involved in trading employ only one type of trading instrument and the remaining 8 percent are involved in all types of financial innovations. The most common trading instruments (either as a standalone or in combination with other instruments) are off-balance sheet (OBS) derivatives and loan sales followed by securitization. Generally, large and well capitalized banks are the most active users of trading; with more than 98 percent of large institutions (assets size more than $50 billion) use at least one type of trading instrument. Nearly two-thirds of banks with less than $50 billion in asset size transfer or share their credit risk, predominantly through loan sales followed by securitization, used both in isolation and jointly with other types of trading activity. The top 25 banks account for 97 percent of all the OBS derivative contracts held by banks while the remaining 3 percent is shared between the smaller and less capitalized banks.
13
to banks’ decision to engage in trading, contrary to our prediction. We offer two explanations.
First, the results may be time and sample dependent; earlier studies use different sample
periods from ours, and mostly concentrate on periods before or around bank deregulations
such as the Riegle–Neal Act of 1994 and Gramm–Leach–Bliley Act of 1999 (Pavel and Phillis,
1987; Jagtiani and Khanthavit, 1996; Sinkey and Carter, 2000; Calomiris and Mason, 2004).
Second, credit risk may be less important to banks that are not involved in trading as their
loans are likely to have higher credit quality; banks that are heavily involved in trading may be
inclined to be more lax in writing loans that are subsequently securitized and sold off. Our
results also show that banks’ propensity to engage in trading increases with the size of the
lending portfolio and bank size. In contrast, management efficiency and the size of deposits
reduce banks’ propensity to engage in trading.
For a subsample of banks that are involved in trading, an increase in credit risk and
liquidity risk decreases banks’ securitization, asset sales, and OBS derivatives exposure in the
following quarter. Credit risk is a significant driver of the volume of securitization, asset sales,
and OBS derivatives in the following quarter. In contrast, an increase in non-interest income
and regulatory capital encourages banks to increase their trading exposure in the following
quarter. These findings are consistent with our argument that the two main reasons for
banks’ involvement in trading are mitigating risk and generating fee income.
Next, we compare banks that are extensively involved in trading with banks that are
only marginally involved. Our results show that banks with higher liquidity risk are less likely
to be heavily involved in securitization, asset sales, and OBS derivatives. Further, multinomial
14
logistic regression results show that credit risk is an important barrier to banks that are
already extensively involved in OBS derivatives. For these banks, an increase in credit risk
decreases OBS derivative volume in the following quarter. We also find that when regulatory
capital arbitrage opportunities arise, banks that are already extensively involved in
securitization and asset sales are more likely to further increase their involvement in these
trading activities in the following quarter. Banks that are heavily involved in OBS derivatives
are less sensitive to regulatory capital constraints. Our results also suggest that banks engage
extensively in OBS derivatives as intermediaries to facilitate risk management for small banks
and other market participants in the economy, while banks that are marginally involved in
trading do so as end users. Findings on non-interest income show that the key motive behind
trading is profitability, as expected.
This essay contributes to the literature by showing: (i) that what drives banks to engage
in asset sales, securitization, and OBS derivatives; (ii) determinants of trading volume; and (iii)
why some banks extensively involve in trading while others involve marginally. Our finding
settles Gruber and Warner’s (1977) assertion that small or less capitalized banks benefit the
most from risk hedging through trading as end users because cost of bankruptcy and cost of
implementing risk management are relatively higher for these banks. Our findings also
support Allen and Santomero’s (1996) assertion that banks as intermediaries have advantages
over individuals in creating and facilitating financial instruments for other market participants
risk management and trading needs on a day to day basis.
15
The rest of this essay is organized as follows. The next section presents the literature
review. Section 2.3 discusses sample data and research method, followed by empirical results
in Section 2.4. Section 2.5 summarizes and concludes this study.
2.2. LITERATURE REVIEW
The literature on banks’ motivation for trading is a developing one. Early empirical research
focuses on regulatory capital arbitrage, risk management, and income generation as the main
explanations. Using logit regressions on a sample of 13,763 U.S. commercial bank-quarters
during 1983-1985, Pavel and Phillis (1987) find that asset sales facilitate the management of
maturity gap between assets and liabilities, thereby enhancing banks’ liquidity and risk
diversification. Benveniste and Berger (1987) show that while loan sales and securitization
allow banks to improve risk transfer and sharing, regulatory capital constraints are not an
important factor in banks’ decisions to be involved in OBS derivatives and credit
entrenchments. In contrast, Baer and Pavel (1988) find that banks are involved in
securitization and OBS activities primarily to reduce regulatory capital charges on risky assets.
For a sample of the 86 largest U.S. commercial banks during 1984-1991, Jagtiani et al.
(1995) find regulatory capital constraints are negatively related to banks’ OBS derivatives.
However, contrary to Benveniste and Berger (1987), they find regulatory capital constraints
are positively related to banks’ involvement in OBS credit entrenchments. They find no
significant relation between regulatory capital and securitization and loan sales. Interestingly,
they find that cross-sectional differences in banks’ OBS activities are independent of bank
16
size, which is contrary to the popular belief that only large banks have sufficient capital to
engage in trading.
In a follow up study and using the same sample of banks, Jagtiani and Khanthavit (1996)
show that OBS activities increase in response to regulatory capital imposed through the risk-
based capital requirements under the Basel-I; banks with better income performance and
higher creditworthiness increase their OBS credit entrancements more. The finding is
contrary to their argument that an increase in regulatory capital should decrease banks’ OBS
exposure. They explain that either the cost imposed by regulatory capital is smaller than the
fair cost, or banks may in fact be revenue efficient rather cost efficient.
Sinkey and Carter (2000) examine banks’ involvement in OBS derivatives. For a sample
of 20,485 derivative contracts (notional value of $20.5 trillion) for 1996, they find derivative-
user banks, compared to non-users, are associated with riskier capital structure (more notes
and debentures and less equity capital), greater net loan charge-offs, and lower net interest
income margins. However, they find no evidence to support their capital hypothesis that
banks with stronger capital positions, mostly the larger banks, are more likely to engage in
derivatives activities
Using a sample of 934 bank-quarters for 34 Taiwanese banks, Shiu and Moles (2010) find
the propensity of banks to be involved in OBS derivatives increases with bank size and capital,
while leverage and long-term liabilities diversification reduce it.
Ashraf et al. (2007) find that large and well capitalized banks are more likely to engage
in OBS derivatives and participate extensively in credit derivatives. They use a two-step
17
regression model, first a binary regression for banks’ participation in credit derivatives and a
second regression with the size of credit derivatives as the dependent variable. For a sample
of large U.S. banks with asset size of at least $1 billion during the period 1997-2004, they show
significant support for the notion that entry barrier is related to banks’ past experience in
dealing in any type of OBS derivatives instrument; a positive association between the size of
lending portfolio and credit derivatives exposure exists. They argue and find that banks
transact credit derivatives in order to increase income to match the losses incurred through
lending defaults. However, they find no evidence that banks engage in credit derivatives for
reasons of regulatory capital arbitrage.
For a sample of Spanish commercial banks, saving banks, and credit cooperatives during
the period 1999-2006, Alfredo and Saurina (2007) show that the main driver of loan
securitization is banks’ liquidity needs. Banks with more rapid credit growth, less interbank
funding, and a higher loan-deposit gap have a higher probability of issuing covered bonds and
resorting to asset-backed securitization. The risk-taking profile of banks and their solvency
level do not impact the propensity to securitize or the amount of assets securitized. They
show that Spanish banks have been securitizing assets only to fund their lending growth and
not because their risk level was too high or their solvency ratios were too low. That is, the risk
profile of banks or their level of capital seems to play no role in banks’ decision to engage in
securitization. Finally, they show that for the different classes of assets backing the
securitization (e.g., loans to small and medium sized firms), capital arbitrage becomes
important.
18
Bedendo and Bruno (2012) examine banks involvement in loan sales, securitization, and
credit derivatives. For a sample of 517 U.S. commercial banks over the period 2001-2009, they
find that during the financial crisis, when most short-term funding sources were dry, banks’
need to raise financial resources becomes the incentive behind loan sales, securitization, and
credit derivatives. They also find that the financial resources (capital) released as such are
used to expand bank lending not only in good times but also, although to a lesser extent,
during the recent financial crisis. Riskier banks were more likely to issue lower quality loans,
loan sales, and securitization, which translated into higher default rates during the crisis. In
addition, short-term borrowings funded loan sales, securitization, and credit derivatives were
used to increase the return on bank assets at the expense of higher risk exposure.
Ashraf and Goddard (2012) examine the relationship between the use of derivatives and
banks’ financial condition and accounting performance. For a sample of 1,599 U.S. commercial
banks with asset size greater than $300 million for the period 2001-2009, they find that growth
in bank lending is negatively related to the likelihood of being involved in OBS derivatives. In
contrast to Bedendo and Bruno’s (2012) findings, the likelihood of banks’ involvement in
derivatives is negatively related to their return on assets, risk-weighted capital, and net
income margin. However, it is positively related to loans charge-offs, liquid assets, and bank
size.
Massimiliano and Edoardo (2010) examine banks’ motives behind loan securitization.
For a sample of 3,000 Italian bank-quarters during the period 2000-2006, they show that
banks employ securitization to raise their capital and income. Banks with lower capital, less

19
income, and are more risk-prone tend to securitize more, in larger amounts, and earlier.
Further, large and highly diversified banks with rapidly growing loan portfolios tend to be
more involved in securitization. Banks which previously engaged in securitization tend to
securitize more and do so more frequently. Once banks securitize, they operate with relatively
low capital, have fewer bad loans and deposits, and attain higher profits.
Panetta and Pozzolo (2010) examine the ex-ante determinants of bank securitization.
For a large international sample of banks from 100 countries, they find that securitization is
mainly used by large banks that tend to have greater credit risk and liquidity risk exposure,
and are more willing to improve their capital ratios. The ex-post evidence shows in the years
following the first securitization, banks experience a reduction in their overall riskiness and an
improvement in their capital ratios.
In summary, earlier research findings on banks’ motivation for trading are mixed and
depend on the sample studied and methodology used. Some studies find regulatory capital
arbitrage motivates banks to engage in trading while others find opposite results or no
significant relation. Similarly, findings on risk management as a determinant of trading are
mixed. While most studies find banks’ risk exposure has little or no impact on the extent of
involvement in OBS derivatives, others find loan sales and securitization activities are
independent of banks’ credit risk exposure. Nevertheless, studies consistently find that non-
interest income is the main motivation behind banks’ involvement in trading.
2.3. DATA AND RESEARCH METHOD
Data

20
This study covers the period between 2003Q4 and 2013Q2. Our focus is on U.S. commercial
banks which are insured and supervised by Federal Deposit Insurance Corporation (FDIC) and
Office of the Comptroller of the Currency (OCC). Banks that are major subsidiaries of foreign
banks, defined as those with at least 50 percent of shares outstanding owned by another
domestic bank holding company or foreign banks, are excluded from our sample. After
removing all acquired banks and bank-quarters with missing financial data, we obtain a final
sample of 65,489 quarters for 1,523 state and national charted commercial banks. We collect
quarterly financial data from Federal Financial Institutions Examination Council (FFIEC) Call
Reports and The Uniform Bank Performance Report (UBPR) through the Central Data
Repository (CDR) website (https://cdr.ffiec.gov/public/).
Research methodology
Following the extant literature, we start by examining the factors that motivate banks to
engage in or abstain from trading. To achieve this, we employ the following binary regression
model:
𝑙𝑛 (𝑃𝑟(𝑇𝑟𝑎𝑑𝑖𝑛𝑔𝑡 = 1)
𝑃𝑟(𝑇𝑟𝑎𝑑𝑖𝑛𝑔𝑡 = 0)) = 𝑏10 + ∑(𝑏1𝑖𝑋𝑖,𝑡−1) + ∑(𝑏1𝑗𝑍𝑗,𝑡−1)
4
𝑗=1
4
𝑖=1
(1)
where Trading is assigned the value of 1 if the bank is involved in a specific trading activity
during a quarter, and zero otherwise. As the dependent variable has only two discrete
outcomes, the estimates produced are identical to the logit model used in an early study by
Pavel and Phillis (1987). That is, the log of odds of banks involved in trading (𝑇𝑟𝑎𝑑𝑖𝑛𝑔 = 1) to
21
banks not to involve in trading (𝑇𝑟𝑎𝑑𝑖𝑛𝑔 = 0) is modeled as a linear combination of various
predictors (test variables (X) and control variables (Z)).
The types of trading we examine are securitization (Securitization), asset sales (ASale),
and OBS derivatives (OBSDeriv). Securitization refers to any type of loan securitization, and
includes collateralized debt obligations (CDOs). ASale refers to all types of residential
mortgages, commercial and industrial loans, and consumer loans selling through conduits.
OBSDeriv includes derivatives held for trading and other purposes, as well as exchange-traded
and OTC derivatives. Banks’ involvement in derivatives can be any or a combination of interest
rate, foreign exchange rate, equity, and commodity derivatives.
Our test variables (X) include Credit Risk, Capital Adequacy Ratio (CAR), Liquidity Risk, and
Non-interest Income.5 Credit Risk is proxied by total loans loss allowances as a percentage of
total assets, where loans loss allowances are the calculated reserves that a bank holds in
relation to the estimated credit risk for the lending portfolio. The higher the risk of loan
default, the larger is the loan loss reserve. We expect banks with higher credit risk are more
likely to engage in OBS derivatives in order to hedge their credit risk exposure (Angbazo, 1997;
Bedendo and Bruno, 2012). As securitization and asset sales facilitate the sharing and transfer
of credit risk, we predict that the propensity of banks to be involved in these trading activities
also increases with banks’ credit risk exposure (Cebenoyan and Strahan, 2004).
As per the Basel II guidelines, CAR is computed as the sum of tier-I and tier-II capital
divided by total risk weighted assets (RWAs). The higher this ratio, the lower the banks’ capital
5 For more detailed variables description, see Appendix A.
22
risk. Loan securitization and asset sales are thought to provide a means of arbitraging
regulatory capital requirements by transferring risky loans and assets to off the balance sheet
through the sale of loans to so-called special purpose vehicles (SPVs) or conduits (Calomiris
and Mason, 2004, 2008; Calomiris, 2009).6 By transferring risky assets off their balance sheet,
banks are able to maintain lower regulatory capital and thus appear to be less risky and
healthier than they actually are. Hence, we expect a negative relation between CAR and the
propensity of banks to engage in Securitization and ASale. Since banks’ risk-weighted assets
(RWAs) are directly related to OBS derivative exposure, if CAR is increasing we expect OBS
derivatives exposure to be decreasing in the following quarter.
Liquidity Risk is measured by the ratio of short-term liabilities to short-term assets. This
ratio indicates banks’ liquidity and ability to meet short-term (less than 12-months) liabilities.
The likelihood of insolvency increases as this ratio rises above one. A ratio of less than one is
an indication of a bank’s reserve management inefficiency (Sinkey and Carter, 2000;
Brunnermeier, 2009). An increase in current liabilities and a decrease in current assets indicate
an increase in liquidity risk as the bank is facing problems in reserves and funding in order to
meet its current liabilities and in its ability to continue lending. Funding scarcity leads banks to
three options. First, banks can instead obtain funds non-bank creditors (money-market funds
and asset-backed commercial papers) to maintain their lending. Therefore, funding scarcity
should not affect bank lending and thus securitization and asset sales. In such a situation, our
test results should show no obvious relation exists between liquidity risk and bank
6 The SPV is a separate legal structure that issues asset-backed securities.
23
securitization and asset sales. Second, if banks reduce their lending to avoid insolvency, this
should eventually decrease the size of their lending portfolio and hence securitization and
asset sales. In such a situation, our test results should show the propensity of banks to be
involved in securitization and asset sales decreases with an increase in liquidity risk. Third,
banks may increase securitization by selling off their risky assets or loans to maintain their
capital quality, and as such reducing their regulatory risk-taking profile. In this situation, our
test results should show the propensity of banks to be involved in securitization and asset
sales increases with an increase in liquidity risk. Earlier studies (Panetta and Pozzolo, 2010;
Affinito and Tagliaferri, 2010; Park et al., 2013) argue and show that banks are indeed
concerned about liquidity risk. To avoid insolvency, banks tend to hold a higher share of liquid
assets and avoid risky trading activities. Since OBS derivatives are risky and opaque trading
activities, we predict a decreased involvement of banks in OBS derivatives in response to a
rise in Liquidity risk.
Non-interest Income is measured by total non-interest income as a percentage of total
assets. Regardless of whether banks are engaged in trading as intermediaries or as end users,
bankers recognize the potential lucrative non-interest income that can be generated by
trading. The non-interest income comes from fee income from trading or other forms such as
the opportunities to create value through cross-selling and enhanced customer relation
through risk management. Hence, we expect banks’ propensity to be involved in trading
increases with an increase in non-interest income. The literature finds that non-interest
income is an important incentive for banks to be involved in trading (Sinkey and Carter, 2000;

24
Ashraf et al., 2007; Alfredo and Saurina, 2007; Massimiliano and Edoardo, 2010; and Bedendo
and Bruno, 2012).
We include a number of control variables that have an impact on the propensity of banks
to engage in trading (Sinkey and Carter, 2000; Ashraf et al., 2007; Bedendo and Bruno, 2012).
Our first control variable is Loans, measured by total loans and leases as a percentage of total
assets in the given quarter. The larger the size of the banks’ lending portfolio, the more assets
(or risky assets) are available to securitize or sell. So, we expect the propensity of banks to be
involved in ASale and Securitization increases with Loans. The increased risk profile (mainly
interest rate and credit risk) encourages banks to be involved in OBS derivatives to hedge the
risk exposures through credit and interest rate derivatives. Therefore, we expect a positive
relation between OBSDeriv and Loans.
Our second control variable is Deposits, measured by total deposits as a percentage of
total assets in the given quarter. Banks’ involvement in trading increases with the flexibility
and availability of financial resources to fund their assets and trading activities. Greater
flexibility and availability of financial resources encourage banks to do reckless and eased
lending, which eventually leads to growth in securitization and asset sales. During the last
decade, the exponential growth in securitization and asset sales was mostly funded by non-
bank creditors (money-market funds and asset-backed commercial papers). Due to increased
risky lending and insolvency risk, banks operate with greater leverage and lower reserve
capital (Li and Yu, 2000; Cebenoyan and Strahan, 2004; Lepetit et al., 2008). If banks had the
opportunity to substitute non-deposit funded risky lending, asset sales, securitization, and
25
other related trading with conventional banking activities funded by deposits, banks would
welcome such an opportunity to avoid insolvency. Therefore, we expect the propensity of
banks to engage in trading decreases with an increase in deposits so as to maintain their risk-
taking profile and avoid insolvency.
Our third control variable is Management Efficiency, measured by total earning assets7
as a percentage of total assets in the given quarter. Banks with better management are more
able to manage their risk and income more efficiently by means of trading. Hence, we expect
trading activities to be positively related to management efficiency.
Our final control variable is bank size (Size), proxied by log of total assets. Shiu and Moles
(2010) argue that size is an important factor which supports banks’ involvement in trading
since larger banks have better access to financial resources and risk management.
While the logit regression may provide some answers to the question why some banks
are involved in trading and others abstain, it tells us little about why some banks are more
extensively involved in trading than others. The answer to this question is obtained in two
ways. First, we test the determinants of trading volume in a linear regression model; this
captures any linear relation that exists between the extent of trading and its covariates.
Second, since linear regressions are continuous models, to differentiate between banks that
are extensively involved in trading and banks that trade only marginally, we apply the discrete
7 Earning assets are assets that are employed to earn income.

26
choice, namely the multinomial logistic model. We first employ the following OLS regressions
for the determinants of the extent of bank trading:
𝑇𝑟𝑎𝑑𝑖𝑛𝑔 𝑒𝑥𝑝𝑜𝑠𝑢𝑟𝑒𝑡 = 𝑐𝑜 + ∑(𝑐1𝑖𝑋𝑖,𝑡−1) + ∑(𝑐1𝑗𝑍𝑗,𝑡−1)
4
𝑗=1
4
𝑖=1
(2)
where 𝑇𝑟𝑎𝑑𝑖𝑛𝑔 𝑒𝑥𝑝𝑜𝑠𝑢𝑟𝑒 is the ratio of banks’ trading exposure to total assets. The
independent variables (X and Z) are identical to those described for equation (1).
We then perform a Long’s (1997) multinomial logistic regression where we use an
unordered discrete categorical variable denoting the quartiles of trading exposure:
𝑙𝑛 (𝑃𝑟(𝑇𝑟𝑎𝑑𝑖𝑛𝑔 𝑄𝑢𝑎𝑟𝑡𝑖𝑙𝑒𝑡 > 1)
𝑃𝑟(𝑇𝑟𝑎𝑑𝑖𝑛𝑔 𝑄𝑢𝑎𝑟𝑡𝑖𝑙𝑒𝑡 = 1)) = 𝑏10 + ∑(𝑏1𝑖𝑋𝑖,𝑡−1) + ∑(𝑏1𝑗𝑍𝑗,𝑡−1)
4
𝑗=1
4
𝑖=1
. (3)
We exclude quarters with zero trading involvement. The regression determinants are the
same as for equation (1). The answer we seek from the models given in equations (2) and (3)
respectively will affirm the changing role of banks in the economy as intermediaries, i.e., banks
that are extensively engaged in trading act as intermediaries to facilitate risk management for
other agents or as end users or both.
2.4. EMPIRICAL RESULTS
Descriptive statistics
Descriptive statistics for the sample of 1,523 U.S. banks during the sample period 2003Q4 to
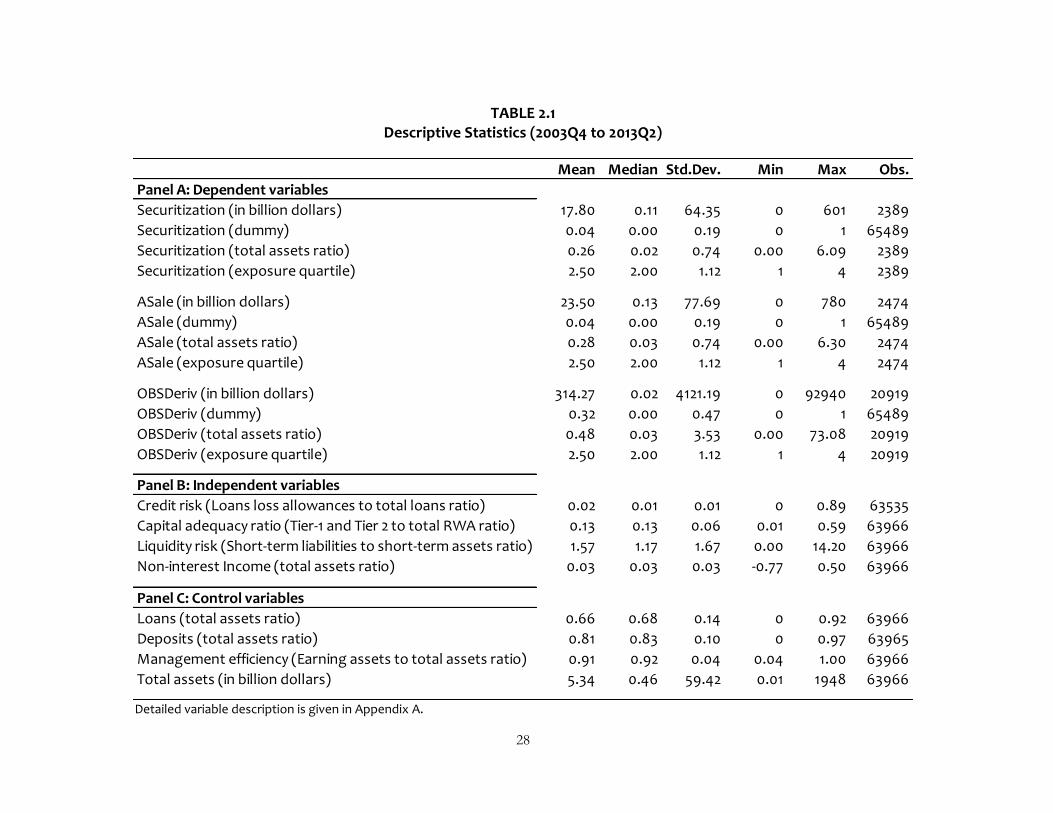
2013Q2 are reported in Table 2.1. Panel A shows that only 4 percent of banks are engaged in
27
Securitization or ASale; the mean exposure of banks that are involved in these trading
activities is 26 percent and 28 percent of total assets respectively. Around one-third of banks
are involved in OBSDeriv, with an average exposure of 48 percent of total assets.
Panel B show that the average Credit Risk for our sample is 2 percent of total assets. The
average CAR is 13 percent, which is slightly higher than the required 12 percent regulatory
capital specified in the Basel-II guidelines. The average Liquidity Risk is 1.57, indicating that
short-term term liabilities are on average 57 percent higher than short-term assets. This figure
also suggests that banks may have relied heavily on non-deposit borrowings from money and
interbank markets to fund their lending activities, exposing banks to increased insolvency risk.
For our sample of banks, the average Non-interest Income accounts for just 3 percent of total
assets.
Panel C shows that Loans is on average less than Deposits, at 66 percent and 81 percent
of total assets, respectively. Management Efficiency has an average value of 91 percent,
implying that the average bank is highly efficient in employing its earnings assets.
28
TABLE 2.1 Descriptive Statistics (2003Q4 to 2013Q2)
Detailed variable description is given in Appendix A.
Mean Median Std.Dev. Min Max Obs.
Panel A: Dependent variables
Securitization (in billion dollars) 17.80 0.11 64.35 0 601 2389
Securitization (dummy) 0.04 0.00 0.19 0 1 65489
Securitization (total assets ratio) 0.26 0.02 0.74 0.00 6.09 2389
Securitization (exposure quartile) 2.50 2.00 1.12 1 4 2389
ASale (in billion dollars) 23.50 0.13 77.69 0 780 2474
ASale (dummy) 0.04 0.00 0.19 0 1 65489
ASale (total assets ratio) 0.28 0.03 0.74 0.00 6.30 2474
ASale (exposure quartile) 2.50 2.00 1.12 1 4 2474
OBSDeriv (in billion dollars) 314.27 0.02 4121.19 0 92940 20919
OBSDeriv (dummy) 0.32 0.00 0.47 0 1 65489
OBSDeriv (total assets ratio) 0.48 0.03 3.53 0.00 73.08 20919
OBSDeriv (exposure quartile) 2.50 2.00 1.12 1 4 20919
Panel B: Independent variables
Credit risk (Loans loss allowances to total loans ratio) 0.02 0.01 0.01 0 0.89 63535
Capital adequacy ratio (Tier-1 and Tier 2 to total RWA ratio) 0.13 0.13 0.06 0.01 0.59 63966
Liquidity risk (Short-term liabilities to short-term assets ratio) 1.57 1.17 1.67 0.00 14.20 63966
Non-interest Income (total assets ratio) 0.03 0.03 0.03 -0.77 0.50 63966
Panel C: Control variables
Loans (total assets ratio) 0.66 0.68 0.14 0 0.92 63966
Deposits (total assets ratio) 0.81 0.83 0.10 0 0.97 63965
Management efficiency (Earning assets to total assets ratio) 0.91 0.92 0.04 0.04 1.00 63966
Total assets (in billion dollars) 5.34 0.46 59.42 0.01 1948 63966
29
The average bank has $5.34 billion in total assets. There is a high dispersion in bank size, as
indicated by the standard deviation of total assets ($59.42 billion).
Determinants of banks’ propensity to engage in trading
Table 2.2 reports the logit regression results for the propensity of banks to engage in trading.
Contrary to our expectation and the literature (e.g., Sinkey and Carter, 2000), we find that
Credit Risk is not significantly related to Securitization, ASale, or OBSDeriv. Therefore, credit
risk is not a significant factor for banks to engage in trading. One possible explanation for our
finding is that during the last decade, banks have moved towards trading-based banking
where Securitization, ASale, and OBSDeriv activities are funded mainly by short-term
borrowings from money or interbank markets. In trading-based banks, credit risk is
significantly higher due to the laxly written loans for securitization and asset sales that
provide banks with more income but at the cost of higher credit risk exposure.
In comparison, for relation-based banks that are not involved in trading, the lending
standards are higher and loan portfolios are relatively less exposed to credit risk. Thus, for
banks that are not involved in trading, credit risk is relatively less important than insolvency
and regulatory capital risk (as we will see later) in the decision to involve in trading.
Consistent with the literature (Jagtiani et al., 1995; Ashraf and Goddard, 2012), CAR is
negatively related to the propensity of banks to be involved in securitization, asset sales, and
OBS derivatives. Therefore, when regulatory capital charge increases, banks tend to avoid
OBS derivatives or arbitrage by transferring risky loans and assets to off the balance sheet
through SPVs and conduits.

30
TABLE 2.2 Logit Regression Analysis of Propensity of Banks to Engage in Trading
This table reports regression coefficients for Logit model specified in equation (1). Robust standard errors are reported in parentheses. The dependent dummy equals one if a bank is involved in the trading activity specified in the quarter, and zero otherwise. Securitization refers to loans securitization, Asset Sale refers to asset sales, and OBS Derivative is off-balance sheet derivative exposure. Test variables are lagged values of Credit risk, Capital adequacy ratio, Liquidity risk, and Non-interest income. Control variables are lagged values of Loans, Deposits, Management efficiency, and Size. Detailed variable description is given in Appendix A. The analysis is based on unbalanced panel data for a sample of 1,523 U.S. banks during 2003Q4 to 2013Q2. ***, **, * indicates significance at 1%, 5%, and 10% level respectively.
Dependent variables →
Credit riskt-1 -3.00 -0.44 0.63(2.09) (1.99) (0.98)
Capital adequacy ratiot-1 -3.26 *** -3.49 *** -6.51 ***
(0.67) (0.65) (0.26)
Liquidity riskt-1 0.03 *** 0.01 *** -0.18 ***
(0.01) (0.01) (0.00)
Non-interest incomet-1 10.97 *** 11.17 *** 5.13 ***
(0.77) (0.77) (0.54)
Loanst-1 0.74 *** 0.48 *** 0.39 ***
(0.20) (0.19) (0.08)
Depositst-1 -0.52 ** -0.89 *** -2.85 ***
(0.25) (0.24) (0.12)
Management efficiencyt-1 -7.13 *** -6.50 *** 1.29 ***
(0.61) (0.60) (0.34)
Sizet-1 0.82 *** 0.83 *** 1.03 ***
(0.01) (0.01) (0.01)
Constant -8.47 *** -8.71 *** -12.14 ***
(0.73) (0.72) (0.39)
Lagged dependent Yes Yes Yes
# Observations 63506 63506 63506
LR χ² 6328 6696 15847
Prob > LR χ² 0.00 0.00 0.00
Log likelihood -6795 -6887 -32080
Pseudo R² 0.32 0.33 0.20
Securitizationt ASalet OBSDerivt

31
Consistent with Baer and Pavel (1988), our findings confirm that regulatory capital constraints
are an important barrier for banks to engage in trading, i.e., banks that are strengthening their
regulatory capital position tend to avoid trading. This finding also supports others that find
trading increases banks’ overall risk-taking profile (Li and Yu, 2000; Cebenoyan and Strahan,
2004; Lepetit et al., 2008).
Liquidity Risk is positively related to Securitization and ASale, confirming earlier findings
(Panetta and Pozzolo, 2010; Riportella et al., 2010). Therefore, when liquidity risk increases,
banks’ propensity to be involved in Securitization and ASale also increases. This positive
relation affirms that the prime motive behind these trading activities is for banks to transfer
or sell risky loans or assets so as to reduce their regulatory risk-taking profile. Earlier studies
show that banks are indeed concerned about liquidity risk, and to avoid insolvency, banks
tend to hold a higher share of liquid assets and avoid risky trading activities (Panetta and
Pozzolo, 2010). Since trading in OBS derivatives is an opaque and risky activity, in response to
an increase in liquidity risk, our results show that banks’ propensity to involve in OBS
derivative trading decreases in the following quarter.
As expected, Non-interest Income is positively related to Securitization, ASale, and
OBSDeriv. These findings are consistent with the literature suggesting that non-interest
income is a prime factor for banks to engage in trading activities (Bedendo and Bruno, 2012).
Among the control variables, banks with a higher proportion of Loans are more likely to
be involved in Securitization and ASale. The finding suggests that when the lending portfolio
increases in size, rather than holding the illiquid assets until maturity, banks convert illiquid

32
assets to liquid securities to realize profits immediately. Loans are positively related to
OBSDeriv, indicating that banks use OBS derivatives to hedge their credit risk, maturity
mismatch risk, and interest rate risk (Bedendo and Bruno, 2012).
As expected, banks with a higher proportion of Deposits are less likely to engage in
Securitization, ASale, and OBSDeriv. This suggests that if banks had the opportunity to avoid
risky non-deposit funded trading activities, they would welcome such activities just to avoid
insolvency. Banks with higher Management Efficiency (proxied by ratio of total earning assets
to total assets) are more likely to engage in OBSDeriv, but are less likely to engage in
Securitization and ASale. The variation may be because involvement in OBS derivatives
requires less capital than securitization and asset sales. Hence, management has a capital
efficiency advantage with OBS derivative trading than with securitization and asset sales.
Consistent with Shiu and Moles (2010), we find larger banks are more likely to engage in
trading, possibly due to their superior access to financial resources.
Determinants of the extent of banks’ involvement in trading activities
The findings from our discrete choice model (Table 2.2) reveal nothing much about the extent
of banks’ involvement in trading. For example, in a logit model, banks that are marginally
involved in OBS derivatives (say one percent) and banks that are extensively involved (say 100
percent) are treated identically. Hence, such an analysis tells us nothing about the extent of
banks’ involvement in trading and its determinants. To this end, we use an OLS regression
framework (equation (2)). As such, bank-quarters that are not involved in trading are removed
from the sample. Table 2.3 reports the OLS regressions results.
33
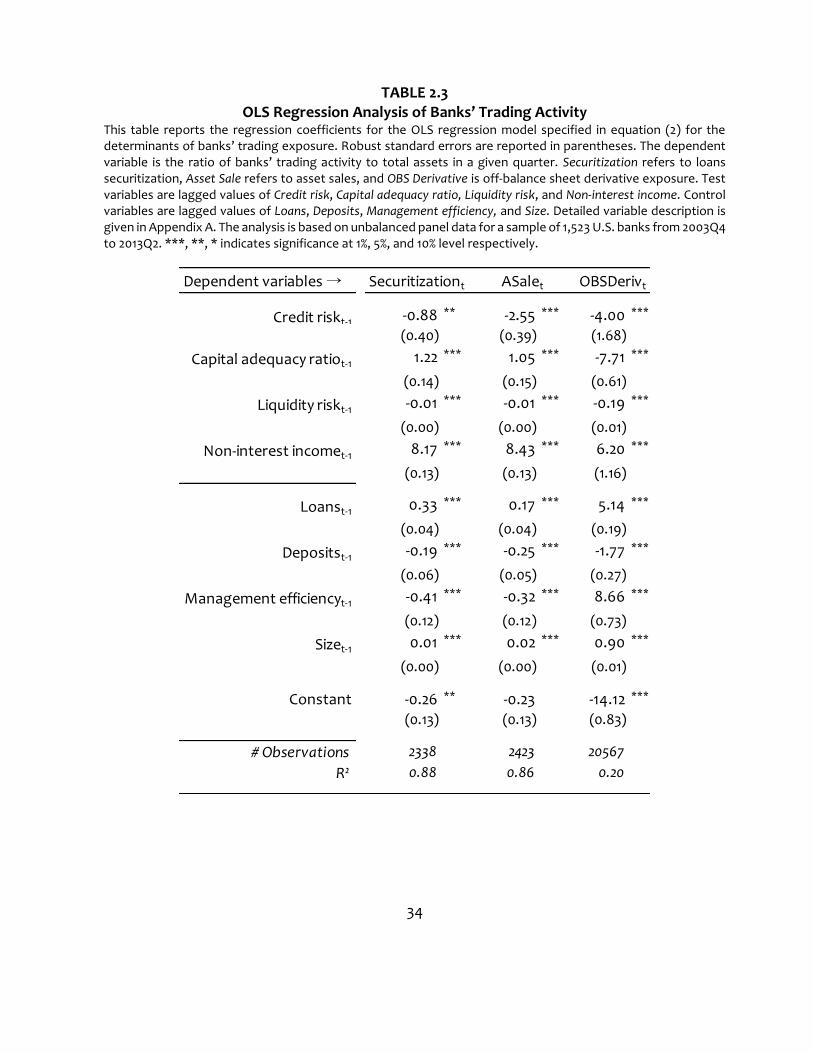
Unlike the discrete choice model (Table 2.2), where we find no significant relations
between Credit Risk and Securitization, ASale, and OBSDeriv, the OLS model shows that Credit
Risk is an important factor that explains the extent of banks’ involvement in Securitization,
ASale, and OBSDeriv. In all specifications, Credit risk is negatively related to Securitization,
ASale, and OBSDeriv. Therefore, when credit risk increases, banks decrease their involvement
in trading in the next quarter so as to maintain their risk-taking profile. Unlike the discrete
choice model (Table 2.2), which indicates that credit risk is less important than regulatory
capital risk and liquidity risk in banks’ decision to be involved in trading, the OLS model shows
banks that are involved in trading do care about the level of credit risk exposure.
Earlier in Table 2.2 we find that CAR is a barrier for banks to become involved in trading.
The positive coefficient on CAR in our OLS model suggests that once banks are involved in
Securitization and ASale, they continue to do so for regulatory capital arbitrage.
Hence, an increase in CAR leads to an increased involvement in Securitization and ASale
in the next quarter. We find a negative relation between CAR and OBSDeriv, indicating an
increased derivative involvement increases the risk-weighted assets and lowers the capital
adequacy ratio. Therefore, to maintain regulatory risk-taking profile and capital charges on
OBS derivative trading, banks reduce their OBS derivative exposure in following quarter.
Liquidity Risk is negatively related to all types of trading activities. Hence, when insolvency risk
increases, banks reduce their involvement in trading activities in order to avoid insolvency.
34
TABLE 2.3 OLS Regression Analysis of Banks’ Trading Activity
This table reports the regression coefficients for the OLS regression model specified in equation (2) for the determinants of banks’ trading exposure. Robust standard errors are reported in parentheses. The dependent variable is the ratio of banks’ trading activity to total assets in a given quarter. Securitization refers to loans securitization, Asset Sale refers to asset sales, and OBS Derivative is off-balance sheet derivative exposure. Test variables are lagged values of Credit risk, Capital adequacy ratio, Liquidity risk, and Non-interest income. Control variables are lagged values of Loans, Deposits, Management efficiency, and Size. Detailed variable description is given in Appendix A. The analysis is based on unbalanced panel data for a sample of 1,523 U.S. banks from 2003Q4 to 2013Q2. ***, **, * indicates significance at 1%, 5%, and 10% level respectively.
Dependent variables →
Credit riskt-1 -0.88 ** -2.55 *** -4.00 ***
(0.40) (0.39) (1.68)
Capital adequacy ratiot-1 1.22 *** 1.05 *** -7.71 ***
(0.14) (0.15) (0.61)
Liquidity riskt-1 -0.01 *** -0.01 *** -0.19 ***
(0.00) (0.00) (0.01)
Non-interest incomet-1 8.17 *** 8.43 *** 6.20 ***
(0.13) (0.13) (1.16)
Loanst-1 0.33 *** 0.17 *** 5.14 ***
(0.04) (0.04) (0.19)
Depositst-1 -0.19 *** -0.25 *** -1.77 ***
(0.06) (0.05) (0.27)
Management efficiencyt-1 -0.41 *** -0.32 *** 8.66 ***
(0.12) (0.12) (0.73)
Sizet-1 0.01 *** 0.02 *** 0.90 ***
(0.00) (0.00) (0.01)
Constant -0.26 ** -0.23 -14.12 ***
(0.13) (0.13) (0.83)
# Observations 2338 2423 20567
R² 0.88 0.86 0.20
ASalet OBSDerivtSecuritizationt
35
This finding is consistent with our earlier findings for the discrete model (Table 2.2). Non-
interest Income is positively related to banks’ exposure to Securitization, ASale, and
OBSDeriv, consistent with results from the discrete choice model.
Determinants of banks’ propensity to marginally or extensively engage in trading
The OLS regression results advance the extant literature and conclusions drawn from the
discrete choice model. However, the reason behind why some banks are extensively involved
in trading and others only marginally involved is still unknown. In other words, we do not
know whether the results obtained so far are driven by banks that are extensively involved in
trading or by those that are marginally involved. Exploring what drives banks’ extensive
involvement in trading may explain whether banks use trading as intermediaries to facilitate
risk management, or as end users, or both.
To examine this, we use the multinomial logistic (ML) regression model as specified in
equation (3). In the ML regression model, the dependent variable is a categorical discrete
unordered variable ranging from one to four, with banks belonging to quartile 4 as the most
heavily involved in trading. The baseline comparison group is quartile 1, which consists of
banks with the lowest trading exposure. As for the OLS regressions, we again exclude banks
with no trading exposure in the quarter. We focus our discussion on the results from the 1st
and 4th quartiles since heavy involvement in trading is of most concern to regulators.
Table 2.4 (quartile 1 vs. quartile 4) shows that Credit risk is negatively related to OBSDeriv
but unrelated to Securitization and ASale. The result suggests that banks with high credit risk
are less likely to be heavily involved in complex and opaque OBS derivatives.

36
TABLE 2.4 Multinomial Logistic Regression Analysis of Banks’ Trading Activity
This table reports regression coefficients for the multinomial logit model specified in equation (3). Robust
standard errors are reported in parentheses. The dependent variable is a categorical discrete unordered variable
ranging from one to four. It is assigned with the value of one for banks with the lowest exposure in a trading
activity (quartile one) for any given quarter, and a value of four if for banks with the highest exposure (quartile
four). The base outcome comparison group is provided by the dependent variable equals one. Test variables are
lagged Credit risk, Capital adequacy ratio, Liquidity risk, and Non-interest income. Control variables are lagged
Loans, Deposits, Management efficiency, and Size. Detailed variable description is given in Appendix A. Analysis is
based on unbalanced panel data for a sample of 1,523 U.S. banks from 2003Q4 to 2013Q2. ***, **, * indicates
significance at 1%, 5%, and 10% level respectively.
1st vs. 2nd quartile exposure
Credit riskt-1 -9.89 -18.14 *** -7.19 ***
(6.29) (6.21) (2.27)
Capital adequacy ratiot-1 5.93 *** 6.53 *** -3.95 ***
(2.51) (2.27) (0.64)
Liquidity riskt-1 -0.09 *** -0.08 ** -0.12 ***
(0.04) (0.04) (0.01)
Non-interest incomet-1 21.92 *** 23.76 *** 6.40 ***
(5.48) (5.50) (1.92)
1st vs. 3nd quartile exposure
Credit riskt-1 -38.73 *** -55.51 *** -6.80 ***
(7.32) (7.42) (2.17)
Capital adequacy ratiot-1 16.91 *** 10.64 *** -1.65 ***
(2.41) (2.25) (0.62)
Liquidity riskt-1 -0.22 *** -0.20 *** -0.20 ***
(0.05) (0.05) (0.01)
Non-interest incomet-1 25.95 *** 32.16 *** 15.73 ***
(5.62) (5.60) (1.88)
1st vs. 4th quartile exposure
Credit riskt-1 -1.52 -5.71 -17.04 ***
(6.22) (6.15) (2.36)
Capital adequacy ratiot-1 17.74 *** 11.10 *** -0.27
(2.65) (2.52) (0.60)
Liquidity riskt-1 -0.09 *** -0.08 *** -0.44 ***
(0.04) (0.04) (0.02)
Non-interest incomet-1 54.79 *** 60.07 *** 37.76 ***
(5.41) (5.50) (1.88)
Control variables (all) Yes Yes Yes
# Observations 2338 2423 20567
LR χ² 944 1189 5665
Prob > LR χ² 0.00 0.00 0.00
Log likelihood -2769 -2764 -25679
Pseudo R² 0.15 0.18 0.10
Dependent exposure quartile increasing →
Securitizationt ASalet OBSDerivt
37
This is consistent with our earlier findings (Table 2.3). However, Credit risk is not related to
Securitization and ASale, suggesting that credit risk only matter to banks that are marginally
involved in securitization and asset sales.
Consistent with our earlier findings from the OLS regression model (Table 2.3), CAR is
positively related to Securitization and ASale. This suggests that banks are more likely to be
extensively involved in securitization and assets selling for regulatory capital arbitrage
reasons. We find the capital adequacy ratio does not explain why banks become extensively
involved in OBS derivatives. Of particular concern to regulators, the result implies that
regulatory capital charges on OBS derivatives is ineffective as a risk controlling tool for banks
that are extensively involved in OBS derivatives.
We find a negative relation between Liquidity Risk and banks’ involvement in all three
types of trading activities, similar to Table 2.3. Therefore, to avoid insolvency, banks are more
likely to be marginally involved in trading. Consistent with our earlier OLS regression results,
Non-interest Income is positively related to Securitization, ASale, and OBSDeriv. The finding
again confirms that non-interest income is a key incentive behind banks’ extensive
involvement in trading activities.
Overall, our results show that both capital arbitrage opportunity and non-interest
income increase the likelihood of banks to be extensively involved in securitization, assets
sales, and OBS derivatives. Credit risk is not an important determinant for banks to be
extensively involved in securitization and assets sales. Our multinomial logistic regression
model also shows the trading activity that is of greatest concern to regulators, i.e., heavy

38
involvement in OBS derivatives, is insensitive to regulatory capital constraints. This finding
affirms that banks are extensively involved in OBS derivatives as intermediaries to facilitate
risk management for other agents in the financial system. Overall, our finding settle Gruber
and Warner’s (1977) assertion that the cost of bankruptcy and of implementing risk
management are relatively higher for smaller or less capitalized banks, which benefit the most
from risk hedging through trading as end users. In contrast, our finding for banks that are
extensively involved in trading supports Allen and Santomero’s (1996) suggestion that banks
as intermediaries have advantages over individuals in creating and facilitating financial
instruments for agents’ risk management or trading needs on a day to day basis.
2.5. CONCLUSION
This study addresses two questions regarding banks’ motives behind trading activities using
logit, OLS, and multinomial logistic frameworks for a large unbalanced panel dataset of 1,523
U.S. commercial banks from 2003Q4 to 2013Q2. First, we ask why some banks engage in
trading and others do not. Second, we ask why some banks are heavily involved in trading and
others only marginally.
Overall, we find that regulatory capital arbitrage, insolvency risk, and non-interest
income all motivate banks to engage in trading activities. However, we find credit risk is not
an important determinant. Banks’ propensity to engage in trading increases with the size of
the banks’ lending portfolio and bank size. In contrast, management efficiency and deposits
reduce the propensity of banks to engage in trading. For banks that are involved in trading,
our OLS model shows that an increase in credit and liquidity risk decreases banks’ trading

39
exposure in the following quarter. In contrast, an increase in non-interest income and
regulatory capital buffer encourages banks to increase their trading exposure in the following
quarter. Consistent with our logit model, bank size and the size of the lending portfolio are
positively related to the extent of trading involvement. The size of bank deposits and
management efficiency, however, are negatively related to banks’ trading exposure.
Earlier studies show banks that are engaged in trading become highly leveraged, have
high income volatility, and take on significantly more risks in subsequent years (Li and Yu,
2000; Cebenoyan and Strahan, 2004; Lepetit et al., 2008; Brunnermeier et al., 2012). We find
that banks with higher liquidity risk are less likely to be heavily involved in trading activities.
Regulatory capital constraints explain why banks are extensively involved in securitization
and asset sales but not in OBS derivatives. Further, banks are more likely to be extensively
involved in securitization and assets selling for regulatory capital arbitrage reasons. Of
particular interest to regulatory, we find that regulatory capital charges on OBS derivatives is
ineffective as a risk controlling tool in reducing banks’ heavy involvement in OBS derivatives.
Our result also establishes that non-interest income is one of the key motives behind bank
trading.

40
REFERENCES
Affinito, M., and Tagliaferri, E. (2010). Why Do (or Did?) Banks Securitize Their Loans? Evidence
from Italy. Journal of Financial Stability 6, 189-202.
Alfredo, M. O., and Saurina, J. (2007). Why do banks securitize assets?. Retrieved on 16 January
2014 from: http://www.finance-innovation.org/risk08/files/3433996.pdf.
Allen, F. and Santomero, A. M. (1996). The Theory of Financial Intermediation. Wharton
Financial Institution Centre. Retrieved on 16 November 2013 from:
http://fic.wharton.upenn.edu/fic/papers/96/9632.pdf.
Angbazo, L. (1997). Commercial Bank Net-interest Margins, Default Risk, Interest-rate Risk,
and Off-balance Sheet Banking. Journal of Banking and Finance 21, 55-87.
Arping, S. (2014). Credit Protection and Lending Relationships, Journal of Financial Stability 10,
7-19.
Ashraf, D., Altunbas, Y., and Goddard, J. (2007). Who Transfers Credit Risk? Determinants of
the Use of Credit Derivatives by Large US Banks. The European Journal of Finance 13 (5),
483-500.
Ashraf, D., and Goddard, J. (2012). Derivatives in the Wake of Disintermediation: A
Simultaneous Equations Model of Commercial and Industrial Lending and the Use of
Derivatives by U.S. Banks. International Journal of Banking, Accounting and Finance 4
(3), 250-271.
Baer, H., and Pavel, C. (1988). Does Regulation Drive Innovation? Federal Reserve Bank of
Chicago Economic Perspectives, 3-16.
Bedendo, M., and Bruno, B. (2012). Credit Risk Transfer in U.S. Commercial Banks: What
Changed During the 2007–2009 Crisis. Journal of Banking and Finance 36, 3260-3273.
Benveniste, L., and Berger, A. (1987). Securitization with Recourse: An Instrument that Offers
Uninsured Depositors Sequential Claims. Journal of Banking and Finance 11, 403-424.
Brunnermeier, M. K. (2009). Deciphering the Liquidity and Credit Crunch 2007–2008. Journal
of Economic Perspectives 23 (1), 77-100.

41
Brunnermeier, M., Dong, G., and Palia, D. (2012). Banks Non-Interest Income and Systemic
Risk. Retrieved on 10 August 2013 from:
http://papers.ssrn.com/sol3/papers.cfm?abstract_id=1786738.
Calomiris, C. (2009). The Subprime Turmoil: What’s Old, What’s New, and What’s Next.
Working Papers 25935, American Enterprise Institute. Retrieved on 10 November 2013
from: https://www.imf.org/external/np/res/seminars/2008/arc/pdf/cwc.pdf.
Calomiris, C., and Mason, J. (2004). Credit Card Securitization and Regulatory Arbitrage.
Journal of Financial Services Research 26(1), 5-27.
Calomiris, C., and Mason, J. (2008). Resolving the Puzzle of the Under-issuance of National
Bank Notes. Explorations in Economic History 45(4), 327-355.
Cebenoyan, A. S., and Strahan, P. E. (2004). Risk Management, Capital Structure and Lending
at Banks. Journal of Banking and Finance 28, 19-43.
Duffee, G.R., and Zhou, C. (2001). Credit Derivatives in Banking: Useful Tools for Managing
Risk? Journal of Monetary Econonomics 48, 25–54.
Gruber, M. J., and Warner, J. B. (1977), Bankruptcy costs: some evidence. The Journal of
Finance 32, 337–347.
Jagtiani, J., and Khanthavit, A. (1996). Scale and Scope Economies at Large Banks: Including
Off-balance Sheet Products and Regulatory Effects (1984-1991) 19 (7), 1175-1189.
Jagtiani, J., Saundersb, A., and Udellb, G. (1995). The Effect of Bank Capital Requirements on
Bank Off-balance Sheet Financial Innovations. Journal of Banking and Finance 19 (3-4),
647-658.
Kero, A. (2013). Banks Risk Taking, Financial Innovation and Macroeconomic Risk. Quarterly
Review of Economics and Finance 53 (2), 112-124.
Lepetit, L., Nys, E., Rous, P., and Tarazi, A. (2008). Bank Income Structure and Risk: An
Empirical Analysis of European Banks. Journal of Banking and Finance 32, 1452-1467.
Li, L., and Yu, Z. (2000). The Impact of Derivatives Activity on Commercial Banks: Evidence
from U.S. Bank Holding Companies. Asia-Pacific Financial Markets 17, 303-322.
Long, J. S. (1997). Regression Models for Categorical and Limited Dependent Variables.
Thousand Oaks, CA Sage.

42
Massimiliano, A., and Edoardo, T. (2010). Why Do (or Did?) Banks Securitize Their Loans?
Evidence from Italy. Retrieved on 10 November 2013 from:
http://ssrn.com/abstract=1601939.
Nicolo, A., and Pelizzon, L. (2005). Credit Derivatives: Capital Requirements and Strategic
Contracting. Working paper, University of Venice. Retrieved on 19 November 2013 from:
https://www.bis.org/bcbs/events/rtf06nicolo_etc.pdf
Panetta, F., and Pozzolo, A. F. (2010). Why Do Banks Securitize Their Assets? Bank-Level
Evidence from over One Hundred Countries. Working Paper, Bank of Italy. Retrieved on
11 November 2013 from: http://apps.olin.wustl.edu/FIRS/PDF/2010/1483.pdf
Park, P., How, J., and Verhoeven, P. (2013). The Diminishing Role of Banks in the U.S. Money
Markets: Evidence from the GFC. Working paper Queensland University of Technology.
Pavel, C., and Phillis, D. (1987). Why Commercial Banks Sell Loans: An Empirical Analysis.
Federal Reserve Bank Chicago: Economic Perspectives (May/June) 3-14.
Riportella, C. C., Medina, R. S., and Ponce, A. T. (2010). What Drives Bank Securitization? The
Spanish Experience. Journal of Banking and Finance 30, 2639-2651.
Santomero, A.M., and Trester, J.J. (1998). Financial Innovation and Bank Risk Taking. Journal
of Economic Behavior and Organization 35, 25-37.
Scholtens, B., and Wensveen, D. V. (2003). The Theory of Financial Intermediation: An Essay
On What It Does (Not) Explain. SUERF Studies, SUERF - The European Money and
Finance Forum.
Shiu, Y. M., and Moles, P. (2010). What Motivates Banks to Use Derivatives: Evidence from
Taiwan. Journal of Derivatives 17 (4), 67-78.
Sinkey, J. F. Jr., and Carter, D. A. (2000). Evidence on the Financial Characteristics of Banks
that Do and Do Not Use Derivatives. The Quarterly Review of Economics and Finance
40, 431-449.

43
Appendix A Variables Description
Descriptor
Securitization (in billion dollars)
Securitization (dummy) A dummy equals one if a bank is involved in securitization in the given quarter otherwise zero.
Securitization (total assets ratio)
Securitization (exposure quartile)
ASale (in billion dollars)
ASale (dummy) A dummy equals one if a bank is involved in assets sales in the given quarter otherwise zero.
ASale (total assets ratio)
ASale (exposure quartile)
OBSDeriv (in billion dollars)
OBSDeriv (dummy) A dummy equals one if a bank is involved in OBS derivatives in the given quarter otherwise zero.
OBSDeriv (total assets ratio)
OBSDeriv (exposure quartile)
Credit risk
Capital adequacy ratio (CAR)
Liquidity risk
Non-interest income
Loans
Deposits
Management efficiency
Assets (Size) Bank total assets in the given quarter. Size is loge of bank total assets in the given quarter.
Bank total earning assets divided by total assets in the given quarter.
Liquidity ratio is ratio of bank total short-term liabilities to total short-term assets in the given quarter.
Bank total loans and leases divided by total assets in the given quarter.
Bank total deposits divided by total assets in the given quarter.
Credit risk is proxy by bank total loans loss allowances as a percentage of total assets in the given quarter.
Bank total non-interest income divided by total assets in the given quarter.
Capital risk is proxy by capital adequacy ratio (CAR). CAR is sum of tier-I and tier-2 capital divided by total risk
weighted assets in the given quarter.
Description
Bank all types of loans securitization volume in any given quarter.
Bank securitization volume ranked and clustered into quartiles for each quarter. Bank securitization volume is
ranked each quarter with all the other banks who have securitization involvement in the given quarter.
Bank all types of loans securitization volume divided by total assets in the given quarter.
Bank all types of assets sales volume in the given quarter.
Bank all types of assets sales volume divided by total assets in the given quarter.
Bank OBS derivatives volume ranked and clustered into quartiles for each quarter. Bank OBS derivatives volume is
ranked each quarter with all the other banks who have OBS derivatives involvement in the given quarter.
Bank assets sales volume ranked and clustered into quartiles for each quarter. Bank assets sales volume is ranked
each quarter with all the other banks who have assets sales involvement in the given quarter.
Bank all types of off-balance sheet derivative exposure in the given quarter. OBS Derivatives includes fair value of all
types of swaps, options, future and forwards, interest rate derivatives and foreign exchange derivatives.
Bank all types of OBS derivative volume divided by total assets in the given quarter.
44
CHAPTER 3:
BANKS OPACITY AND INFORMATION RISK
3.1. INTRODUCTION
“... confidence had been shaken by the ‘complex and opaque’ way banks applied capital to the various risky assets held on their balance sheets, potentially overstating their financial strength ...”
Sir Mervyn King, Governor, Bank of England
29 November 2012 GARP Story Whether the (unintended) consequence of financial deregulation or purposefully designed
with the intent to deceive,8 banks have become increasingly more complex and opaque
institutions. At the heart of opacity is information risk, i.e., uncertainty surrounding the
valuation of banks’ financial assets and risk exposure.9 In its report on “Enhancing Bank
Transparency”, the Basel Committee on Banking Supervision (1998, page 4) defines
8 There are ample of cases supporting the proposition that banks may have exploited information opacity to serve their own (selfish) needs: helping money laundering (HSBC and JPMorgan Stanley); funnelling cash to Iran (Standard Chartered); LIBOR fraud (Barclays and a dozen others); falsifying mortgage records/improperly foreclosing on borrowers (all the large banks); routinely misleading clients (Merrill Lynch, JPMorgan Stanley, and CitiCorp); selling securities known to be “garbage” (Goldman Sachs, Merrill Lynch, and JPMorgan Stanley); concealing information about the risk of loans (Bank of America and JPMorgan Stanley); and secretly betting against clients to profit from their ignorance (Goldman Sachs). Sourced in part from http://www.ritholtz.com/blog/2013/01/big-banks-are-black-boxes-disclosure-is-woeful/ a recent list of cases where parties disagreed about the fair value or pricing practices can be found here: http://expectedloss.blogspot.com.au/2011/04/contested-pricings-list.html. 9 In this essay, we use opacity and information risk interchangeably.
45
transparency (the opposite of opacity)10 as “public disclosure of reliable and timely
information that enables users of that information to make an accurate assessment of bank
financial condition and performance, understanding business activities, identifying risk
profile and review risk management practices.” Despite enhanced risk disclosures, e.g. via
quarterly risk reporting to regulators, banks seem to be unable to provide a fair and accurate
statement of their risk exposure.
Opacity extends well beyond banks’ traditional lending portfolio, extending itself to
banks’ trading activities, much of which involves transforming illiquid assets (loans) into
liquid trading instruments. While bringing about a host of benefits to banks,11 securitization
and asset sales, where loans are mostly financed by short-term money-market and interbank
borrowings, are also thought to bring about lax lending standards and reduced monitoring
10 On page 15 of the report, the critical qualitative characteristics of information that contribute to banks transparency are further elaborated: comprehensiveness, relevance and timeliness, reliability, comparability, and materiality. 11 By moving illiquid assets (such as loans) off the balance sheet through securitization, banks can increase their capital ratio thus providing immediate relief from stringent regulatory capital requirements. Hence, OBS activities expand banks opportunities to provide financial intermediation without adversely affecting their on-balance sheet exposures. The additional income realized in OBS activities, such as fee and trading income, are also welcome compensation for declining margins or spreads on traditional banks lending activities due to financial deregulation. Further, OBS activities supplement banks asset funding (besides deposits) in case of liquidity problems, making banks less vulnerable to depositors run. This is most advantageous for bank with a larger share of illiquid assets (Diamond, 1984, 1989, 1991). Some other motives, prevalent before the sub-prime crisis, emphasize the role of portfolio diversification by credit derivatives and asset sales activity, enabling a more efficient allocation of risk (amongst a wider range of agents) and thus more effective risk management without increasing systematic risk. A more efficient allocation of credit and interest rate risk allows banks to expand granting loans and taking deposits (Affinito and Tagliaferri, 2010). Unfortunately, as has become apparent during the recent crisis, the significant growth in OBS activities has resulted in banks adjusting their decision on granting loans. Banks loosened their lending standards and expanded into new, riskier areas of lending. It has also resulted in a mismatch between credit derivatives and the seller’s exposure to credit risk, with an overall increase in the systematic risk of the banking system.
46
with credit risk ultimately borne by outsiders rather than banks themselves – a simple case
of moral hazard.12
We contribute to the literature on bank opacity by listing banks’ assets that are most
strongly related to information risk. This is of relevance to regulatory authorities so as to
shift policy focus to those activities of banks that are most at risk of destabilizing the
financial system. We employ the bid-ask spread as our metric of bank opacity. Based on
market microstructure theory, if outsiders find it difficult to value firms’ assets or disagree
on their value,13 the bid-ask spread will widen to reflect this fact (Lin et al., 1995; Agrawal et
al., 2004). Bagehot (1971), Copeland and Galai (1983), and Glosten and Milgrom (1985) argue
that, faced with asymmetric information, dealers try to recoup losses from trading against
informed traders by imposing a higher bid‐ask spread on uninformed trades. O’Hara and
Oldfield (1986) contend that dealers change the bid and ask prices to balance off the risk of
carrying imbalanced inventories. In support of this assertion, Comerton‐Forde et al. (2010)
show that when dealers have large inventory positions and incur losses from market making,
12 The U.S. Department of the Treasury (page 6) notes “Securitization, by breaking down the traditional relationship between borrowers and lenders, created conflicts of interest that market discipline failed to correct. Loan originators failed to require sufficient documentation of income and ability to pay. Securitizers failed to set high standards for the loans they were willing to buy, encouraging underwriting standards to decline. Investors were overly reliant on credit rating agencies. Credit ratings often failed to accurately describe the risk of rated products. In each case, lack of transparency prevented market participants from understanding the full nature of the risks they were taking.” 13 This statement implicitly assumes that investors take banks’ trading activities into account when valuing the
banks’ assets. However, this assumption may not be valid. For example, in judging the financial health of
Morgan Stanley as a whole, S&P ratings agency stated it has not - repeat, not - taken into account the risk
involved in "the highly sophisticated" trading activities which bring with them “exposure to the more volatile
capital markets activities as well as to more opaque financial products".

47
they widen the bid‐ask spread. Unlike past studies which measure opacity using the average
(daily closing) bid-ask spread computed over an entire year, we focus on the time
surrounding the day of corporate earnings announcements, which coincides with the date
of the pro-forma balance sheet. We argue that the bid-ask spread computed this way
provides a more accurate proxy for bank opacity as it is well known that informed traders
are most active around these corporate events (Affleck-Graves et al., 1995; Agrawal et al.,
2004; Berkman and Truong, 2009).14
In line with U.S. accounting standards, we group the financial instruments of banks
into the following three asset categories: (i) “held to maturity” (HTM) which reflects
financial assets which banks intends (and is able) to retain until maturity, mostly loans; (ii)
“available for sale” (AFS), which consists of securities and other financial investments that
are neither held for trading nor held to maturity or held for strategic reasons, and that have
a readily available market price. This includes securitization and asset sales activities; and (iii)
“trading securities” (TS), which refers to short-term trading activities of banks. Here, we
focus on banks’ OBS trading activities, including derivatives and swaps.
Using a sample of 275 U.S. commercial banks listed on the NASDAQ/NYSE/AMEX for
1999Q4 to 2012Q2 and the bid-ask spread as our proxy for information risk, we find banks’
14 We also considered two other proxies for information risk from high frequency trading literature, namely PIN (Easley et al., 1996) and VPIN (Easley et al., 2010). Econometric problems with estimating PIN arises due to frequent failure of MLE convergence. For VPIN computation, the size of trading volume bucket is subject to severe biasness (Abad and Yagüe, 2012). Therefore, for reliability reasons we discarded both the PIN and VPIN measures as our proxies for opacity.
48
trading securities exposure (in particular highly leveraged equity derivatives exposures)
contribute most to bank opacity, followed by available for sale securities and securitization
of family residential loans. Further, of held to maturity assets, FDIC Texas ratio and loans
secured by farmlands are the most significant contributors to bank opacity. As expected,
larger banks and those listed on the NYSE exhibit less information risk, as are banks with a
higher capital adequacy ratio, greater analysts following, and a higher credit rating.
From the regression models we obtained economic value of test variables calculated
as multiplying the regression coefficient with the standard error of the test variable. The
economic value can be interpreted as the impact of a one standard deviation increase in the
test variable on the bid-ask spread (in cents). For the HTM category, Texas ratio, non-accrual
loans and loans secured by farmlands contribute most to opacity. A one standard increase
in each of these variables increases the bid-ask spread by 1.4, 1.1, and 1 cent respectively. On
banks’ AFS exposures, available for sale securities and securitization of family residential
loans have the largest economic impact on bank opacity, i.e., one standard deviation
increase in each of these exposures increases the bid-ask spread by 1.7 cents. Banks which
are involved in securitization have a 1.5 cents higher bid-ask spread compared to those not
involved. Finally, of banks’ TS exposures, we find that equity derivatives for hedging and
trading purposes contribute most to opacity, with a one standard deviation increase in their
exposures increasing the bid-ask spread by 5.1 and 2.9 cents respectively.
49
We conduct a number of robustness tests. First, to alleviate concerns that our results
are driven by a few very large banks, the prime users of securitization and OBS trading
activities, we segregate the sample into “large” and “other” banks and rerun the
regressions separately for each subsample. We find our results are robust to this sub-
sampling. Second, we use an alternative proxy for information risk based on the standard
deviation of analysts’ forecast errors.15 Again, our results are robust to this alternative
measure of opacity.
This essay has two main contributions to the literature. Earlier studies mainly focus on
establishing that banks are informationally more opaque than non-financial firms.16 We list
the banking activities that are making banks more opaque and difficult to value for the
outsiders. It is important for regulatory authorities to understand what drives banks opacity
in order to appropriately assess its effects on banks’ risk and regulate banks for continued
financial stability accordingly. Our second contribution to the literature is that we show the
cost of information risk and opacity endured by investors. It is important for investors
because they need to independently assess risk and value of their investments that requires
timely information and more transparency.
15 Other than PIN (Easley et al., 1996) and VPIN (Easley et al., 2010), we also considered credit ratings split across
rating agencies as a proxy for information risk (Iannotta, 2006). However, Hauck and Neyer (2008) find credit
ratings split is not a reliable proxy for opacity as non-financial firms also show credit ratings split similar to
banks. 16 For more details please see: Morgan, 2002; Flannery et al., 2004; Iannotta, 2006; Haggard and Howe, 2007;
Hauck and Neyer, 2008; Iannotta and Navone, 2009; Vallascas and Keasey, 2012.
50
The rest of this essay is organized as follows. The next section presents a literature
review. Section 3.3 provides the hypotheses which are the subject of our empirical tests,
while Section 3.4 outlines the sample selection procedure and research method employed.
Empirical results are discussed extensively in Section 3.5, while a summary of our main
findings and a conclusion is provided in Section 3.6.
3.2. LITERATURE REVIEW
In this section, we summarize the literature that examines whether banks, notwithstanding
their considerable disclosure obligations, represent an especially opaque form of business
organization. Morgan (2002) is the first to document the opacity of banks. Using split ratings
between Moody’s and Standard and Poor’s on nearly 8,000 new bonds issued between 1983
and 1993 to proxy for information risk, he finds that bond ratings disagree more often for
bonds issued by banks than by industrial firms. He contends that banks are like “black
boxes”, with money flowing in and out of the box, with the risks taken in the process of
intermediation are mostly invisible to outsiders. Split ratings are more likely to occur when
banks substitute loans for securities and trading assets, and less likely to occur for fixed
physical assets.
Lanotta (2006) corroborates Morgan’s (2002) results. Using a sample of 2,473 bonds
issued by European firms during the 1993-2003 period, he shows that the probability of
disagreement in ratings increases with financial assets, banks size, and capital ratio but
decreases with fixed assets. In a follow up study, Ianotta and Navone (2009) measure banks

51
opacity by the frequency of “crashes”, defined as large negative market-adjusted returns.
For U.S. stocks during 1990 to 2000, and after controlling for size and leverage, they
conclude that banks are indeed more opaque, generating more frequent equity market
crashes relative to non-bank firms.
A few researchers raise doubt about the relatively higher informational opacity of
banks versus other non-bank firms. Benston and Kaufman (1988, page 48) argue that banks
are much easier to value than non-bank firms, “market value accounting is much more
feasible and inexpensive for financial institutions to adopt than for most other enterprises.
Unlike non-financial firms, banks have relatively small investments in assets for which
current market values are difficult to measure.” However, this conclusion may no longer
hold given the tremendous growth in banks’ trading activities subsequent to their study.
Flannery et al. (2004, page 2) argue that “… loan illiquidity and private information about
specific borrowers don’t necessarily make banks more difficult to value than non-financial
firms. Just as many bank loans do not trade in active secondary markets; neither do many
assets of non-financial firms, e.g., plant and equipment, patents, managers’ human capital,
or accounts receivable. How can outside investors accurately value the public securities
issued by these firms?” They argue that empirical issues in measurement of opacity are more
significant than the question of whether banks are more opaque than non-bank firms.
Indeed, Hauck and Neyer (2008) challenge the use of split ratings as an indicator for opacity
as split ratings may occur irrespective of whether an industry is transparent or opaque.

52
Flannery et al. (2004) assess whether banks are relatively more opaque and thus more
difficult to value than matched (similarly sized and priced) non-financial firms using the bid-
ask spread and analysts’ earnings forecast errors as proxies for opacity. Their sample
consists of 320 banks and bank holding companies (BHCs) traded on the NYSE/AMEX or
NASDAQ between January 1990 and December 1997. Contrary to Morgan (2002), they find
no evidence that large (NYSE/AMEX traded) banks are particularly opaque, suggesting that
investors can evaluate large banking firms as readily as they can non-financial firms. Further,
the fact that smaller (NASDAQ traded) BHCs exhibit substantially lower return volatilities
and more accurate analyst earnings forecasts than the control sample implies that opacity
is not a prominent feature of these banking firms either. They conclude that if banks were
intrinsically opaque, government regulations and banking supervision would well have
reduced that opacity.
In a later study, Flannery et al. (2010) re-examine bank opacity, focusing on the
information role of supervisory stress tests during the GFC and whether such disclosures
reveal new information about banks’ risk exposures. Their proxies of bank opacity, which
are based on equity trading patterns, increase dramatically during the banking crisis,
therefore banks have become more opaque during market panic even if they were not more
opaque in ordinary times. Their findings also show that the recent stress test, which the
Obama government instructed banks to carry out, provides new information to the market
and succeeds in fostering financial stability.
53
Bischof et al. (2012) support this conclusion. They use the 2011 European Union wide
stress-testing exercise and the concurrent Eurozone sovereign debt crisis as a setting to
study the consequences of supervisory disclosure of bank-specific proprietary information
(i.e., stress-test simulations and credit risk exposures). First, they analyze how one time
supervisory disclosures interact with subsequent voluntary disclosure of sovereign credit
exposures in determining bank opacity. Second, they analyze whether stress-test
disclosures induce a change in bank risk-taking behavior, thus mitigating industry-wide risk
exposure and uncertainty in financial markets. They find a substantial increase in stress-test
participants’ voluntary disclosure of sovereign credit risk exposures subsequent to the
release of credit risk tables. Such a commitment to increased disclosure is accompanied by
a decline in banks opacity as measured by the bid-ask spread. However, Bischof et al. (2012)
note a general increase in financial market uncertainty, proxied by liquidity volatility and its
sensitivity to changes in sovereign credit risk. The increased uncertainty is mitigated if the
disclosure reveals a reduction in bank exposure to sovereign credit risk during the crisis.
These findings indicate that negative stress-test results incentivize banks to reduce their risk
exposures.
Ashcraft and Bleakley (2006) shed further light on bank opacity by evaluating how
access to overnight credit is affected by changes in public and private creditworthiness
measures of bank borrowers. Using a plausible exogenous variation in demand for federal
funds, they identify the supply curve facing a bank borrower in the interbank market. They
54
find evidence that lenders respond to adverse changes in public information about credit
quality by restricting access to the market in a disciplined fashion. In turn, borrowers
respond to adverse changes in private information about their credit quality by increasing
leverage so as to offset the future impact on earnings. These findings suggest that banks are
able to manage the real information content of their disclosures. In particular, public
measures of loan portfolio performance contain information about future loan charge-offs,
but only in the quarters when the bank is examined by supervisors. However, the loan supply
curve is no longer sensitive to public disclosures about nonperforming loans in an
examination quarter, suggesting that investors and borrows both are insensitive to banks’
troubled loans disclosure.
Haggard and Howe (2007) measure bank opacity using the theoretical model of Jin and
Myers (2006), which hypothesizes that the stock returns of opaque firms are: (i) more likely
to reflect market information than firm-specific information; and (ii) more likely to
experience stock crashes than firms with more firm-specific information in their returns.
Using a sample of 243 BHCs for the period 1993-2002, representing about half of all assets
held by BHCs at the end of 2003, their findings are consistent with banks being more opaque
than matching industrial firms. Banks have relatively less firm-specific information in their
equity returns, and more opaque banks are more likely to experience sudden drops in their
stock price. In particular, banks with a lower proportion of agricultural and consumer loans
are associated with higher opacity. Contrary to the conclusions of Flannery et al. (2004), they
55
find that NASDAQ banks are more opaque than matching industrial firms. As a caveat, they
admit that their results are tilted towards smaller BHCs, which represent just 16 percent of
all BHCs at the end of 2003.
Riedl and Serafeim (2008) examine whether financial instruments designated as fair
value levels 1, 2, and 3, which indicate progressively more illiquid and opaque financial
instruments, are reflected in banks’ equity beta and bid-ask spread. Consistent with
predictions, results reveal that portfolios of level 3 financial assets have higher implied betas
and larger bid-ask spreads relative to those designated as level 1 or level 2 assets. Both
results are consistent with a higher cost of capital for banks holding more opaque financial
assets, as reflected by the level 3 fair value designation. They suggest that current disclosure
requirements regarding fair values of financial instruments are insufficient to overcome the
perceived higher information risk for more illiquid financial instruments.
Jones et al. (2012) use share price revaluations as a measure of opacity and examine
whether announcements on banks mergers convey information to the market about the
value of non-merging banks, and how it is related to bank opacity. They find evidence of
information transfer since merger announcements convey information about the value of
non-merger banks. Non-merger banks with more loans and fewer transparent assets have
larger positive cumulative abnormal returns surrounding the announcement of a large
merger. Other types of potentially opaque activities, such as trading or intangible assets,
appear to have little influence on the stock price reaction. The cumulative abnormal returns

56
are largest for non-merger banks that hold more loans, consistent with loans being the
primary source of opacity for banks. They conclude that contagion is a characteristic of
opaque markets and that price volatility engendered by opacity contributes to financial
fragility.
Cheng et al. (2008) investigate the effect of asset securitization on BHCs’ information
opacity for the period 2001Q2 to 2007Q2. Using bid-ask spread, share turnover, and analyst
forecast dispersion as proxies of information opacity, they find BHCs that are engaged in
securitization are more opaque, which increases with the magnitude of the securitized
assets.
Vallascas and Keasey (2012) examine the relationship between potential systemic risk
and informational opacity in European banks, and evaluate the extent to which regulatory
initiatives that enhance accounting disclosure reduce banks opacity and increase the
amount of firm-specific information incorporated into stock price. They find stock price
synchronicity is an indicator of potential systemic risk and that opacity is higher in countries
with poorer accounting disclosure. Their results suggest that increased transparency in the
banking system decreases systemic risk. However, additional analysis shows that enhancing
accounting disclosure does not reduce interdependencies between banks. The impact of the
disclosure on synchronicity is closely related to the size of banking firms. For smaller banks,
more disclosure reduces stock price synchronicity. However, above a certain banking size,
there is a positive relationship between accounting disclosure and measures of banking

57
interdependencies. Their results suggest that regulatory initiatives motivated by the
purpose of increasing the flow of information on banks are likely to reduce
interdependencies only for the smaller banks, i.e., those that are less important from a
systemic stability perspective.
Lastly, Jeffery et al. (2013) examine the effects of opacity on bank valuation and
synchronicity in banks’ equity returns over the years prior to the sub-prime crisis. They find
that investments in opaque assets such as securitization, asset sales, and money market
investments are more profitable and have larger valuation discounts relative to transparent
assets. The valuation discount on investments in opaque assets declined over the 2000-2006
period only to be followed by a sharp rise in 2007. The decline coincides with a rise in share
price, a decrease in transparent asset holdings, and greater return synchronicity – all this
evidence is consistent with a feedback effect in banks.
Their result suggests two reasons why opacity hinders the ability of financial markets
to effectively discipline bank risk taking and creates systemic risk. First, accounting for
profitability and other factors that impact banks’ equity values, investments in opaque
assets necessitate higher required rates of market return. In a perfect world, the market
correctly assesses the risks associated with opaque assets, resulting in an efficient allocation
of scarce resources to investments in opaque and transparent assets. However, if the
market does not sufficiently discount the risks embedded in opaque assets, banks are
rewarded with higher equity values. This reward can set off a feedback effect that
58
encourages other banks to also increase their investment in opaque assets, resulting in a
higher concentration of risk in the financial system (ex post) than market participants
realize. Second, banks investments in opaque assets create more systematic risk and reduce
idiosyncratic risk. Informational opacity causes financial markets to become less information
efficient. The resulting increase in price synchronicity raises the likelihood of systemic
market failure from revaluations triggered by changes in outside investors’ perception about
risk. Therefore, opacity matters because it reduces the effectiveness of market discipline.
In summary, the question of whether banks are relatively more opaque than non-bank
firms and what causes bank opacity largely depends on the proxies used for opacity (e.g.,
split ratings, bond spreads, bid-ask spreads, analysts’ dispersion, or price synchronicity). This
suggests that opacity may well depend on the perspective of the user of the information, be
it the equity investor, the financial analyst, the credit provider, or the credit rater. In what
follows, we provide additional evidence from the equity market to support the conjecture
that securitization, asset sales, and OBS trading activities all are significant sources of bank
opacity.
3.3. HYPOTHESES
59
Our first two hypotheses on information risk relate to HTM assets. Banks are informational
opaque because of the loans they hold. Diamond (1984, 1989, 1991) and others (Campbell
and Kracaw, 1980; Berlin and Loeys, 1988) argue that the role of banks is to screen and
monitor borrowers so that outsiders (i.e., investors, depositors, and other lenders) do not
have to. As delegated monitors, banks should therefore know far more about the credit risk
of their borrowers than outsiders (Morgan, 2002). The fact that investors bid up banks’ share
price after their loan commitments are renewed suggests that banks are better informed
about their borrowers than market participants (James, 1987). Thus, we predict:
H1: There is a positive relationship between the level of information risk and the size
of banks’ HTM assets.
Whether banks are better informed about the aggregate risk of their portfolio of loans,
however, depends on whether banks fully diversify their loan portfolio and correctly value
the various phases of troubled loans17 in their portfolio. Morgan (2002) suggests that as
banks become larger and diversify the idiosyncratic risk of their loans, outsiders only have
to agree on the aggregate risk that banks cannot shed. But if banks deliberately retain some
of the idiosyncratic risk in their loan portfolio, such as that of problematic loans, there should
17 If a non-performing loan is 90-days or more past-due and still non-accrual, then it is classified as past-due and non-accrual loan. If a past-due or non-accrual loan is not performing, the bank restructures and reports it as a restructured loan. Ultimately, when a loan default occurs, banks will write it off the balance sheet.

60
be greater difficulty in valuation. Troubled loans that are not diversified away are therefore
a source of informational opacity which is expected to increase banks’ information risk:
H2: There is a positive relationship between the level of information risk and the size
of banks’ troubled loans.
Our next hypothesis relates to banks’ AFS exposures. Since 2001, many commercial banks
have rapidly moved away from the traditional “originate and hold” model to the “originate,
repackage, and sell” model, where loans are securitized and sold. Securitization can increase
bank opacity in a number of ways. First, securitizing and selling loans is thought to be a
means of arbitraging regulatory capital requirements by moving risky loans off the balance
sheet through so-called special purpose vehicles (SPV) and conduits (Calomiris, 2009, 2010;
Calomiris and Mason, 2004).18 By transferring risky assets off their balance sheet, banks are
able (at least on paper) to maintain lower regulatory capital and as such will appear less risky
and more healthy than they actually are. Calomiris and Mason (2004) find that while
securitization and asset sales results in some transfer of risk out of the originating bank, the
risk remains in the securitizing bank as a result of implicit recourse.19 While securitization and
18 Several capital requirements for the treatment of banks’ securitized assets and debts issued by those conduits and held or guaranteed by banks were specifically designed to permit banks to allocate less capital against their risk than if they had been held on the balance sheet (Calomiris, 2008). 19 Recourse refers to guarantees promised to investors of securitized securities by allowing the transfer of losses to the bank if the performance of the underlying portfolio of receivables deteriorates. Therefore, if explicit recourse is present, the transaction is not considered a 'true sale' under FASB 140 since some risk remains with the seller and the protected asset remains on the bank balance sheet. Implicit recourse refers to the case where the bank maintains credit support beyond the contractual obligations to the securitized asset.

61
asset sales with implicit recourse provides an important means of avoiding the minimum
capital requirements for banks, the additional equity capital and earnings gained from
securitization and asset sales may exacerbate opacity in financial reporting and provide a
misleading picture about banks’ capital, performance, and underlying risks.20 Second, banks
rely on soft information21 to grant and manage loans. Since this information cannot be
credibly transmitted to the market when loans are securitized and sold, banks may lack the
incentive to screen borrowers at origination or to monitor them once the loan has been
securitized and sold (Morrison, 2005; Parlour and Plantin, 2008). The above arguments lead
to the following hypothesis:
H3: There is a positive relationship between the level of information risk and the size
of banks’ AFS exposures.
Our final hypothesis focuses on banks’ TS exposures. Offsetting increased liquidity resulting
from securitization and asset sales, banks actively trade complex OBS derivatives and
swaps.22 The major concern focuses on banks’ central position as major dealers in OTC
It is sometimes referred to as moral recourse since the originator may choose to provide support to the distressed asset although this behavior would violate the true sale conditions. 20 In July 2012, Goldman Sachs paid $550 million to settle SEC accusations that it gave incomplete information about a mortgage-linked investment sold in 2007 that caused buyers at least $1 billion in losses. 21 An example of soft information is what the borrower plans to do with the loan proceeds, and is generally sought by a loan officer taking a prospective borrower’s loan application. The use of soft information allows the lender to tailor the contract to the borrower’s risk. If a loss occurs, the lender is fairly compensated for it. Soft information reduces credit losses and increases profits for banks. 22 Lack of data may well have prevented rating agencies from assigning correct ratings to structured securities, as shown in the sub-prime crisis. Having access to all relevant information and in a timely manner is necessary for accurate ratings of structured financial products.

62
derivatives markets. As major dealers in the swap market, banks have extensive
counterparty obligations and are exposed to substantial market and counterparty credit risk
(unknown even to them). Unlike organized exchanges, OTC markets provide private
negotiations with lax regulatory disclosure and monitoring requirements and where there is
no clearinghouse to mitigate counterparty risk. Further, because derivatives are complex
financial instruments, sophisticated valuation/risk-control systems may be required to
measure and track banks’ true risk exposure. Whether banks are capable of managing such
risks is very much debatable. For these reasons, the extent of banks’ derivatives activities is
expected to be directly related to the level of information risk.
A series of spectacular derivative losses by rogue traders has highlighted the immense
risks associated with high-leverage trading by banks. Examples of banks that have suffered
huge derivative trading losses since the sub-prime crisis include Barings Bank, Daiwa Bank,
Merrill Lynch & Co., UBS, J.P. Morgan Chase, and more recently Citigroup. Trading leads to
the classic agency problem of asset substitution in two ways. First, traders can change their
position without the knowledge of management, let alone outsiders (Hentshel and Smith,
1996). Second, trading causes severe agency problems between management and creditors.
Myers and Rajan’s (1998) influential model convincingly illustrates how increased liquidity
and volatile trading positions can reduce banks debt capacity. Using a sample of 355 listed
commercial banks in 25 European countries, Chang et al. (2008) find the level of (interest
rate and foreign exchange) derivative activities is positively associated with bank risk. Net

63
positive (negative) risk exposures are driven by banks that hold derivatives for trading
(hedging), supporting the argument that derivatives can increase (reduce) bank risk if they
are held for trading (hedging) purposes.
In short, while leveraged trading exposures can provide a lucrative source of revenue
for banks, they are thought to come at the cost of increasing opacity through complex
financial arrangements and counterparty risks. These make it increasingly difficult, if not
impossible, for outsiders to accurately assess the true value of banks’ assets. Therefore,
acknowledging the difficulty in monitoring the riskiness of banks’ derivative activities, we
predict:
H4: There is a positive relationship between the level of information risk and
the size of banks’ TS exposures.
3.4. DATA AND RESEARCH METHOD
Data
Our focus is on financial institutions which are insured and supervised by Federal Deposit
Insurance Corporation (FDIC) and Office of the Comptroller of the Currency (OCC). The initial
sample consists of all commercial banks with SIC codes23 6021 and 6022 that are listed on the
three major U.S. exchanges: New York Stock Exchange (NYSE), American Stock Exchange
23 SIC code 6021 and 6022 are National Commercial Banks and State Commercial Banks, respectively.
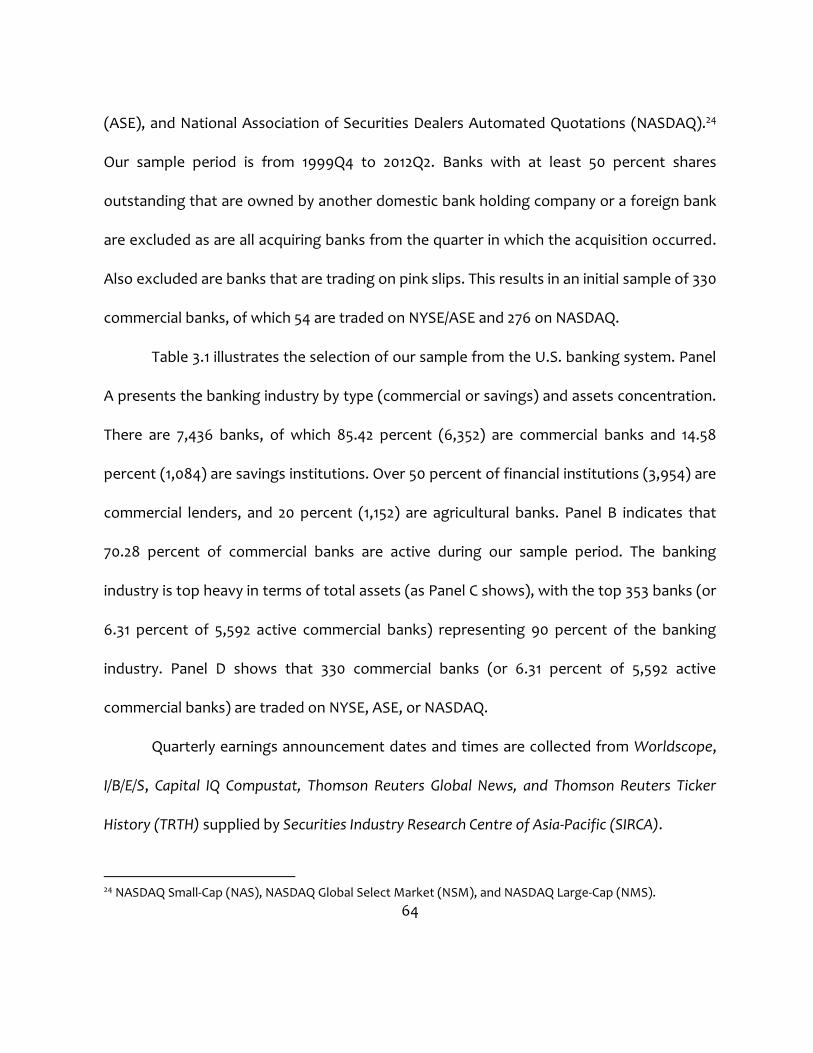
64
(ASE), and National Association of Securities Dealers Automated Quotations (NASDAQ).24
Our sample period is from 1999Q4 to 2012Q2. Banks with at least 50 percent shares
outstanding that are owned by another domestic bank holding company or a foreign bank
are excluded as are all acquiring banks from the quarter in which the acquisition occurred.
Also excluded are banks that are trading on pink slips. This results in an initial sample of 330
commercial banks, of which 54 are traded on NYSE/ASE and 276 on NASDAQ.
Table 3.1 illustrates the selection of our sample from the U.S. banking system. Panel
A presents the banking industry by type (commercial or savings) and assets concentration.
There are 7,436 banks, of which 85.42 percent (6,352) are commercial banks and 14.58
percent (1,084) are savings institutions. Over 50 percent of financial institutions (3,954) are
commercial lenders, and 20 percent (1,152) are agricultural banks. Panel B indicates that
70.28 percent of commercial banks are active during our sample period. The banking
industry is top heavy in terms of total assets (as Panel C shows), with the top 353 banks (or
6.31 percent of 5,592 active commercial banks) representing 90 percent of the banking
industry. Panel D shows that 330 commercial banks (or 6.31 percent of 5,592 active
commercial banks) are traded on NYSE, ASE, or NASDAQ.
Quarterly earnings announcement dates and times are collected from Worldscope,
I/B/E/S, Capital IQ Compustat, Thomson Reuters Global News, and Thomson Reuters Ticker
History (TRTH) supplied by Securities Industry Research Centre of Asia-Pacific (SIRCA).
24 NASDAQ Small-Cap (NAS), NASDAQ Global Select Market (NSM), and NASDAQ Large-Cap (NMS).
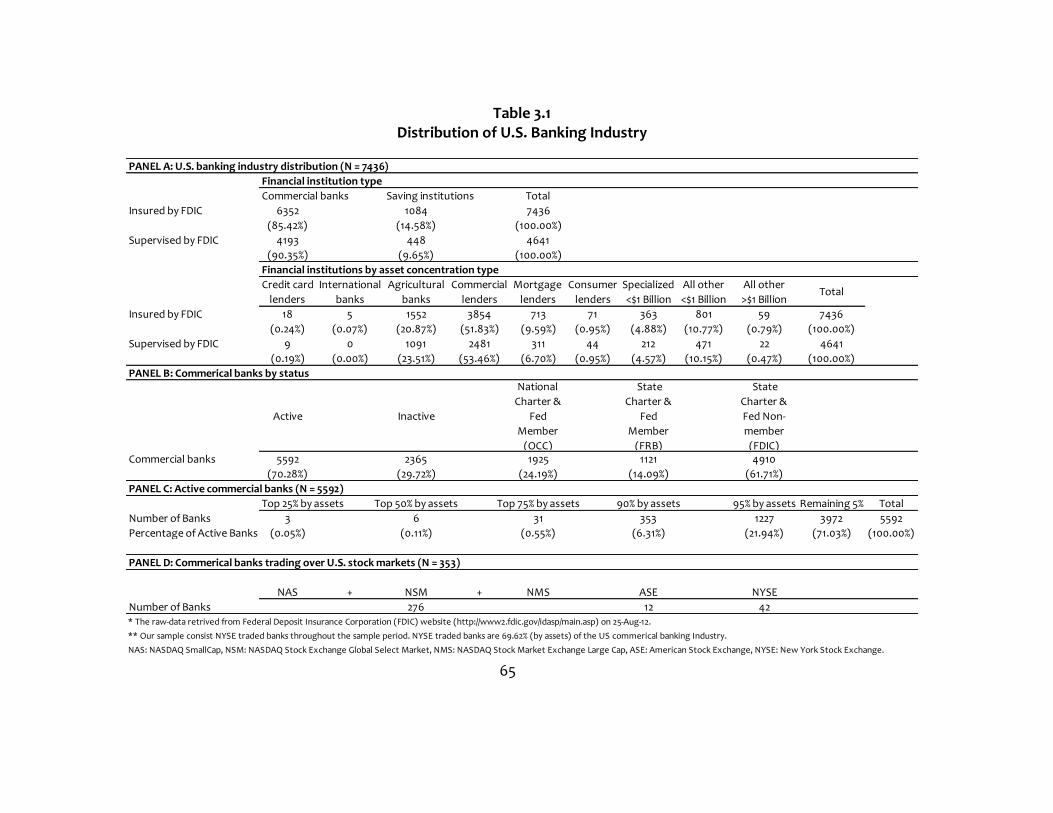
65
Table 3.1 Distribution of U.S. Banking Industry
PANEL A: U.S. banking industry distribution (N = 7436)
Financial institution type
Commercial banks Saving institutions Total
Insured by FDIC 6352 1084 7436
(85.42%) (14.58%) (100.00%)
Supervised by FDIC 4193 448 4641
(90.35%) (9.65%) (100.00%)
Financial institutions by asset concentration type
Credit card International Agricultural Commercial Mortgage Consumer Specialized All other All other
lenders banks banks lenders lenders lenders <$1 Billion <$1 Billion >$1 Billion
Insured by FDIC 18 5 1552 3854 713 71 363 801 59 7436
(0.24%) (0.07%) (20.87%) (51.83%) (9.59%) (0.95%) (4.88%) (10.77%) (0.79%) (100.00%)
Supervised by FDIC 9 0 1091 2481 311 44 212 471 22 4641
(0.19%) (0.00%) (23.51%) (53.46%) (6.70%) (0.95%) (4.57%) (10.15%) (0.47%) (100.00%)
PANEL B: Commerical banks by status
Active Inactive
National
Charter &
Fed
Member
(OCC)
State
Charter &
Fed
Member
(FRB)
State
Charter &
Fed Non-
member
(FDIC)Commercial banks 5592 2365 1925 1121 4910
(70.28%) (29.72%) (24.19%) (14.09%) (61.71%)
PANEL C: Active commercial banks (N = 5592)
Top 25% by assets Top 50% by assets Top 75% by assets 90% by assets 95% by assets Remaining 5% Total
Number of Banks 3 6 31 353 1227 3972 5592
Percentage of Active Banks (0.05%) (0.11%) (0.55%) (6.31%) (21.94%) (71.03%) (100.00%)
PANEL D: Commerical banks trading over U.S. stock markets (N = 353)
NAS + NSM + NMS ASE NYSE
Number of Banks 276 12 42* The raw-data retrived from Federal Deposit Insurance Corporation (FDIC) website (http://www2.fdic.gov/idasp/main.asp) on 25-Aug-12.
** Our sample consist NYSE traded banks throughout the sample period. NYSE traded banks are 69.62% (by assets) of the US commerical banking Industry.
NAS: NASDAQ SmallCap, NSM: NASDAQ Stock Exchange Global Select Market, NMS: NASDAQ Stock Market Exchange Large Cap, ASE: American Stock Exchange, NYSE: New York Stock Exchange.
Total
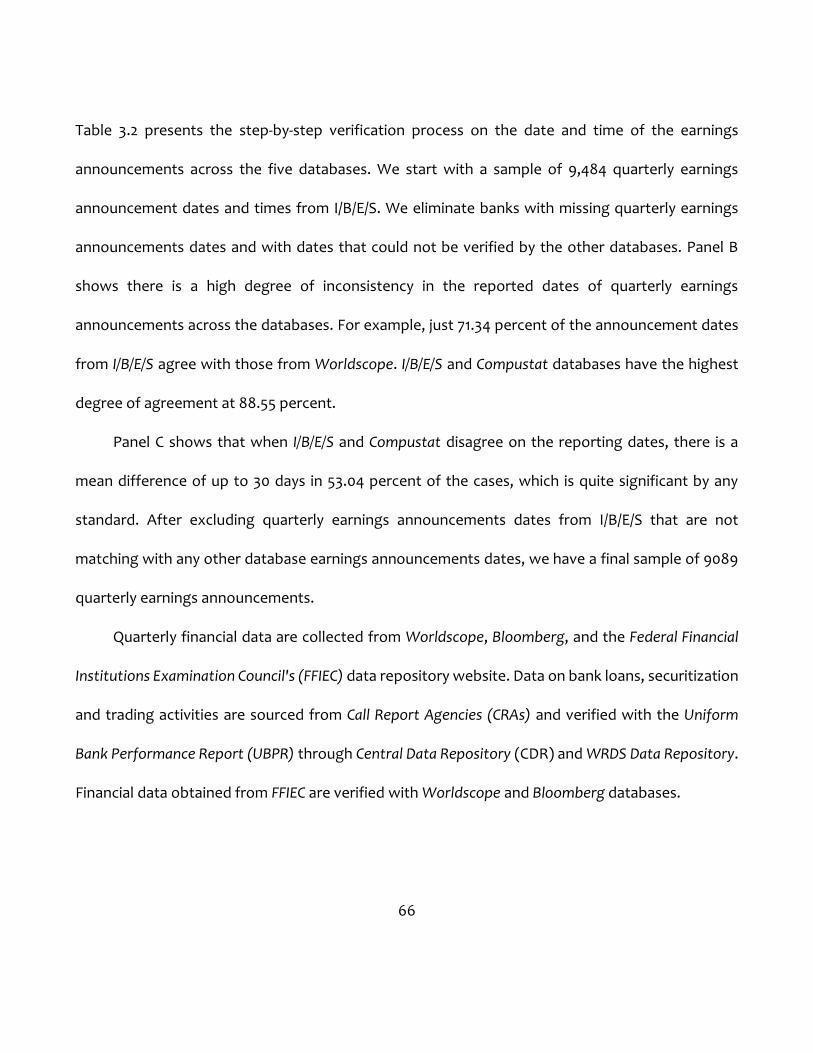
66
Table 3.2 presents the step-by-step verification process on the date and time of the earnings
announcements across the five databases. We start with a sample of 9,484 quarterly earnings
announcement dates and times from I/B/E/S. We eliminate banks with missing quarterly earnings
announcements dates and with dates that could not be verified by the other databases. Panel B
shows there is a high degree of inconsistency in the reported dates of quarterly earnings
announcements across the databases. For example, just 71.34 percent of the announcement dates
from I/B/E/S agree with those from Worldscope. I/B/E/S and Compustat databases have the highest
degree of agreement at 88.55 percent.
Panel C shows that when I/B/E/S and Compustat disagree on the reporting dates, there is a
mean difference of up to 30 days in 53.04 percent of the cases, which is quite significant by any
standard. After excluding quarterly earnings announcements dates from I/B/E/S that are not
matching with any other database earnings announcements dates, we have a final sample of 9089
quarterly earnings announcements.
Quarterly financial data are collected from Worldscope, Bloomberg, and the Federal Financial
Institutions Examination Council's (FFIEC) data repository website. Data on bank loans, securitization
and trading activities are sourced from Call Report Agencies (CRAs) and verified with the Uniform
Bank Performance Report (UBPR) through Central Data Repository (CDR) and WRDS Data Repository.
Financial data obtained from FFIEC are verified with Worldscope and Bloomberg databases.
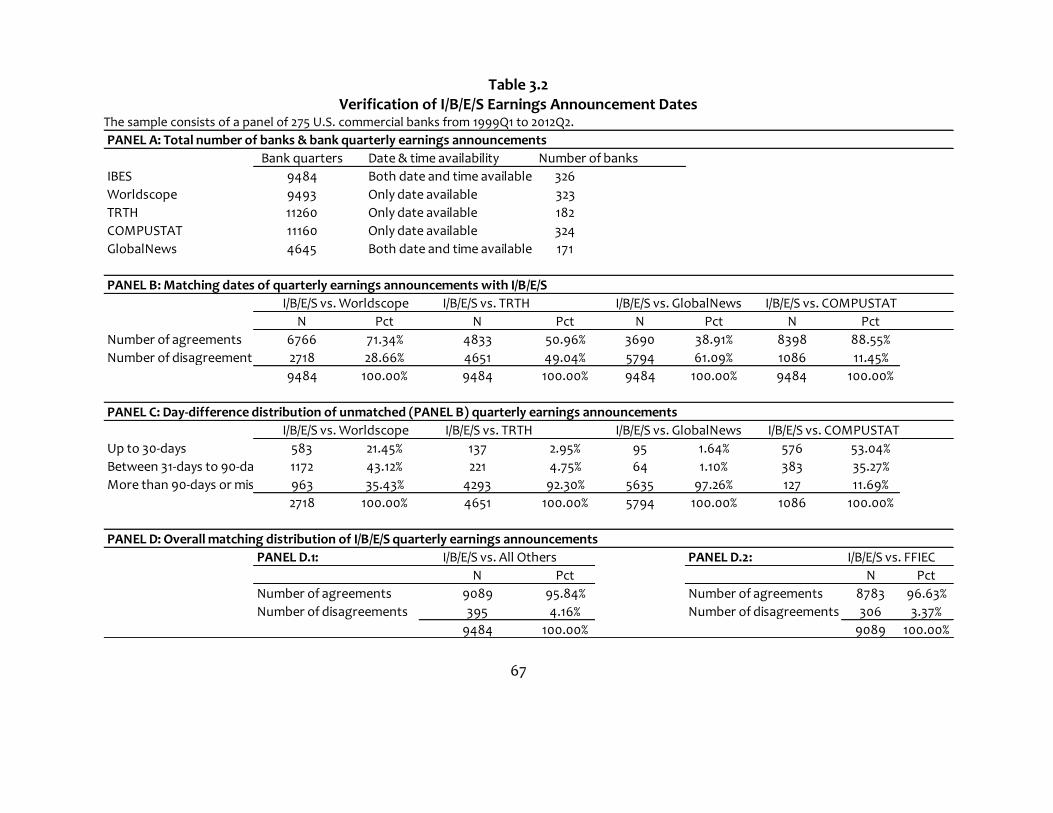
67
Table 3.2 Verification of I/B/E/S Earnings Announcement Dates
The sample consists of a panel of 275 U.S. commercial banks from 1999Q1 to 2012Q2.
PANEL A: Total number of banks & bank quarterly earnings announcements
Bank quarters Date & time availability Number of banks
IBES 9484 Both date and time available 326
Worldscope 9493 Only date available 323
TRTH 11260 Only date available 182
COMPUSTAT 11160 Only date available 324
GlobalNews 4645 Both date and time available 171
PANEL B: Matching dates of quarterly earnings announcements with I/B/E/S
I/B/E/S vs. Worldscope I/B/E/S vs. TRTH I/B/E/S vs. GlobalNews I/B/E/S vs. COMPUSTAT
N Pct N Pct N Pct N Pct
Number of agreements 6766 71.34% 4833 50.96% 3690 38.91% 8398 88.55%
Number of disagreements 2718 28.66% 4651 49.04% 5794 61.09% 1086 11.45%
9484 100.00% 9484 100.00% 9484 100.00% 9484 100.00%
PANEL C: Day-difference distribution of unmatched (PANEL B) quarterly earnings announcements
I/B/E/S vs. Worldscope I/B/E/S vs. TRTH I/B/E/S vs. GlobalNews I/B/E/S vs. COMPUSTAT
Up to 30-days 583 21.45% 137 2.95% 95 1.64% 576 53.04%
Between 31-days to 90-days 1172 43.12% 221 4.75% 64 1.10% 383 35.27%
More than 90-days or missing 963 35.43% 4293 92.30% 5635 97.26% 127 11.69%
2718 100.00% 4651 100.00% 5794 100.00% 1086 100.00%
PANEL D: Overall matching distribution of I/B/E/S quarterly earnings announcements
PANEL D.1: I/B/E/S vs. All Others PANEL D.2: I/B/E/S vs. FFIEC
N Pct N Pct
Number of agreements 9089 95.84% Number of agreements 8783 96.63%
Number of disagreements 395 4.16% Number of disagreements 306 3.37%
9484 100.00% 9089 100.00%

68
Intraday price data and bid-ask spreads are obtained from Thomson Reuters Ticker History
(TRTH). After removing bank-quarters with missing trading or financial data, we obtain a final
sample of 8,783 financial quarters (51-quarterly periods) for 275 U.S. commercial banks from
1999Q1 to 2012Q2. This final sample accounts for 87 percent of the total assets of the U.S.
commercial banking industry as at 25th August 2012.
Research Method
We use the fixed-effects panel regression model with residuals clustered at the bank level to
estimate the relationship between information risk and our test variables. The model
specification is as follows:
𝐼𝑛𝑓𝑜. 𝐴𝑠𝑦𝑚𝑚𝑖,𝑡 = 𝑐 + 𝛽1𝐻𝑇𝑀𝑖,𝑡 + 𝛽2𝐴𝐹𝑆𝑖,𝑡 + 𝛽3𝑇𝑆𝑖,𝑡 + ∑ 𝛽𝑗(𝐶𝑜𝑛𝑡𝑟𝑜𝑙𝑠𝑗)𝑖,𝑡𝑁𝑗=5 + 𝑣𝑖 + 𝜀𝑖,𝑡 (i)
We conduct our tests around quarterly earnings announcements as these corporate events
spark heightened activity of informed trading (Affleck-Graves et al., 1995). Although the
timing of earnings announcements is predictable, there is a large body of literature, tracing
back to the seminal paper by Ball and Brown (1968), which shows that earnings
announcements convey considerable information about the results of the firm’s activities. It
follows that the probability an outsider is able to accurately assess banks’ assets and liabilities
must be highest around such events. Importantly, the change in information risk has been
found to be greater during the period surrounding the earnings announcement than in a
normal period, suggesting a window of opportunity for informed traders to profit on their

69
private information (Affleck-Graves et al., 1995; Agrawal et al., 2004; Berkman and Truong,
2009). Therefore, we anticipate that the cross-sectional variation in the level of information
risk around earnings announcements is driven predominantly by informational risk about
banks assets and activities.
The dependent variable is our measure of information risk (Info.Asymm) surrounding
the earnings announcement. It is proxied by the bid-ask spread (𝐵𝐴𝑆 = 𝐴𝑠𝑘 − 𝐵𝑖𝑑), where
Bid and Ask are the average value of the 5-minute bid and ask quotes respectively from nine
trading days before to nine trading days after the event. For those cases where the earnings
announcement occurs after the close of trading, we take the next trading day to be the
earnings announcement day, consistent with Berkman and Truong (2009).
For robustness, we use an alternative proxy for information risk, analysts’ dispersion
computed as the standard deviation of analysts’ earnings forecast errors (X). The forecast
error is computed as the average of the difference between actual earnings per share (EPS)
and analysts forecasted EPS across all (n) analysts in any given quarter (we take the last
available forecasts prior to quarterly earnings announcements):
𝑋 = √∑ ((𝐸𝑃𝑆𝑓𝑜𝑟𝑒𝑐𝑎𝑠𝑡,𝑗− 𝐸𝑃𝑆𝑎𝑐𝑡𝑢𝑎𝑙,𝑖) − 𝑀𝐹𝐸)
2𝑛𝑗=1
𝑛 − 1
where
𝑀𝐹𝐸 = ∑ (𝐸𝑃𝑆𝑓𝑜𝑟𝑒𝑐𝑎𝑠𝑡,𝑗− 𝐸𝑃𝑆𝑎𝑐𝑡𝑢𝑎𝑙,𝑖)
𝑛𝑗=1
𝑛

70
The types of loans belonging to the HTM category are loans secured by the following
properties as a percentage of total assets: (i) farmland; (ii) 1-4 family residential; (iii) multi-
family (>4) residential; and (iv) commercial. We examine various phases of troubled loans.25
The first phase is non-accrual loans measured by bank non-accruals as a percentage of total
loans and leases. The next phase is past due loans, measured by the ratio of all loans that are
more than 90-days past due and non-accruals as a percentage of total loans and leases. Rather
than summing up the two phases of troubled loans, we use the FDIC Texas ratio to proxy bank
overall troubled loans. The FDIC call report defines the Texas ratio as bank non-performing
assets (excluding government sponsored non-performing loans) divided by tangible common
equity and loan loss reserves. As an early indicator of banks lending defaults, the higher this
ratio, the more precarious is banks financial situation.
The AFS category consists of securities and other financial investments that are neither
held for trading nor held to maturity or for strategic reasons, and that have a readily available
market price.26 In particular, we focus on banks’ securitization activities (Net securitization),
measured by total securitized plus assets available for sale as a percentage of total assets. Since
not all banks are involved in securitization and asset sales, we create a dummy variable D-
Securitization, which takes the value of 1 if the bank is involved in securitization and asset sales
and zero otherwise. To determine which type of securitization and asset sales contributes
25 These loans are reported on the balance sheet at amortized cost, subject to impairment tests requiring that the instrument be written down to fair value if there was a permanent decline in value. 26 AFS is reported on the balance sheet at fair value, with any gain or loss reflected in other comprehensive income (income statement/retained earnings) and accumulated other comprehensive income (balance sheet) until they are sold.

71
most to bank opacity, we categorize securitized and assets sold according to how they are
backed: (i) family residential loans; (ii) home equity lines; (iii) credit card receivables loans; (iv)
auto loans; and (v) commercial and industrial loans, all as a percentage of gross managed
assets. Finally, we examine banks activities in money-market short-term funding known as
Repos, measured by federal funds sold and securities purchased under repurchase
agreements, as a percentage of total assets.
Our final TS category reflects bank financial exposure and trading activities. Here we are
interested in the opacity drivers of banks OBS trading activities, measured by net exposure to
(i) exchange (or OTC) traded derivatives;27 (ii) interest rate derivatives; and (iii) foreign exchange
rate derivatives, all as a percentage of total assets. These activities are expected to be directly
related to the level of information risk because OTC contracts are privately negotiated with
very lax regulatory supervision requiring no disclosure or monitoring by the clearinghouse.
We also examine the marked-to-market gross notional amount of (i) equity contracts; (ii)
commodities and other contracts; (iii) interest rate contracts; and (iv) foreign exchange rate
contracts, all expressed as a percentage of total assets.28 The final set of OBS derivatives
27 Net position refers to the difference between the gross notional amount of equity and commodity (except interest rate and foreign exchange rate) derivative contracts written and that purchased. 28 According to IAS 39 Financial Instruments: Recognition and Measurement, fair value is “the amount for which an asset could be exchanged, or a liability settled, between knowledgeable, willing parties in an arm’s length transaction” (para. 9). Gross positive fair value (GPFV) is the sum of the fair values of the contract where the bank is owed money by its counterparties, without taking into account netting. This represents an initial measurement of credit risk, i.e., the maximum loss a bank incurs if all its counterparties defaulted at the same time and there is no netting of contracts, and the bank holds no counterparty collateral. Conversely, gross negative fair value (GNFV) is the sum of the fair values of contracts where the bank owes money to its counterparties without taking into account netting. This represents the maximum credit risk the bank poses to its counterparties if the bank were to default and there is no netting of contracts, and no bank collateral was held by the counterparties.
72
examined are equity, commodities and others, interest rate, foreign exchange rate swaps
written/purchased, and net OBS credit derivatives exposure, all as a percentage of total
assets.29
A number of variables that have been shown to impact on information risk in past
studies are also controlled for in the tests (Morgan, 2002; Morrison, 2005; Parlour and Plantin,
2008; Calomiris and Mason, 2004; Calomiris, 2010). The first control variable is regulatory
capital quality enforcements in the form of capital adequacy ratio (CAR), a ratio specified by
the Basel Committee (2008). Banks which maintain higher regulatory capital ratios are
thought to be safer and have a larger buffer to absorb unexpected losses. However, since
regulatory arbitrage has made the reported CAR value a less dependable measure of capital
adequacy, we use the total capital requirement, which is the most stringent CAR value,
reported to FDIC. Following Hauck and Neyer (2008), we also control for the bank overall
credit health, as proxied by the S&P credit quality rating (Credit Ratings). Banks with a lower
credit rating have a higher probability of default. We expect banks with a lower credit rating
are associated with greater information risk because of the higher probability of default due
to poor financial health and information environment. The seven qualitative credit ratings
29 While detailed information about the nature of these swap agreements are not available, the majority of them are likely to be plain vanilla swaps (an exchange of fixed for floating rates). As such, these contracts are similar to strips of forward or futures contracts. While for credit default swaps (CDS) exposures there is a separate entry under call schedule RCL form, for virtually all banks the entries are left blank in the FDIC data repository. Therefore, we cannot include these types of swaps into our analysis, despite banks’ high exposures during the GFC.

73
(AAA, AA, …, CCC) are converted to numerical values, with the highest credit rating (AAA)
being assigned a score of 7 and credit ratings at or below “CCC” a score of 1.
The information environment is expected to impact on information risk and is thus also
controlled for in the regression. The information environment is proxied by analyst following
and bank size. Larger banks (Lang and Lundholm, 1996; Johnson et al., 2001) and banks that
are followed by more analysts (O’Brien and Bhushan, 1990; Lang and Lundholm, 1996) have a
richer information environment and thus lower information risk. Analyst following is the
natural logarithm of the total number of analysts following a bank, and bank Size is the natural
logarithm of total assets.
Stock price (Price) controls for the fact that higher priced stocks tend to have higher bid-
ask spreads (Jeffrey et al., 2013). We control for stock price volatility (Sigma) which is expect
it to be positively related to information risk (Iannotta and Navone, 2009). We also include a
News dummy since investors respond to bad earnings news more aggressively and the effect
of their reaction tends to linger in the market for a longer period when compared to good
news (Lakhal, 2008). News is equal to 1, indicating bad news, if this quarter’s earnings per
share (EPS) are less than last quarter EPS, and zero otherwise. Finally, an NYSE dummy is
included to control for the relatively higher disclosure requirements on NYSE, which suggests
lower information risk for NYSE-listed banks. Quarterly time dummies are also included to
control for numerous market microstructure changes over the sample period such as GFC.
Definitions of all the variables used in the regressions are summarized in Appendix B.
74
Table 3.3 shows the descriptive statistics of the test variables. In Panel A, the average
(median) bid-ask spread around the earnings announcement is 13.08 (9.00) cents, with a
standard deviation of 11.30 cents. These numbers are much higher than those reported for
non-banking firms by Flannery et al. (2004), consistent with notion that bank stocks suffering
substantially higher information risk. Our alternative proxy for information risk, analysts’
dispersion (standard deviation of analysts’ earnings forecast errors), has an average (median)
value of 6.30 (0.60) cents per share, with a standard deviation of 11.86 cents. Panel B displays
the descriptive statistics of our control variables. The average (median) bank size is US$25.90
(US$8.66) billion, with a standard deviation of US$50.73 billion, reflecting the presence of a
few very large banks in our sample. The average (median) capital adequacy ratio (CAR) is 12.38
(11.92) percent, close to the minimum 12 percent required by Basel II, with a standard deviation
of 1.65 percent.
The CAR ranges between 10.31 percent and 17.40 percent. The average (median) S&P
credit rating score is 5 out of a maximum 7, with a standard deviation of 2. On average a bank
is followed by six financial analysts, ranging from 1 to 38 analysts. The average (median) stock
price volatility is 36.66 (33.43) percent, ranging from 18.64 to 74.83 percent.
Panel C shows that, on average, net secured loans make up 17.83 percent of total assets,
whereas average loans and leases make up 63.34 percent of total assets. Of the four
categories of secured loans, the largest is commercial loans (15.89 percent of total assets),
followed by 1-4 residential properties backed loans (5.01 percent of total assets) and >4
residential properties backed loans (1.33 percent of total assets). Loans secured by farmland

75
Table 3.3 Descriptive Statistics
The sample is based on a panel of 275 U.S. commercial banks from 1999Q1 to 2012Q2. Banks not involved in securitization or derivatives trading are not included in Panels D and E. To reduce the adverse impacts of outliers, observations outside the 99th percentile are removed. See Appendix B for definition of variables.
Mean MedianStandard
DeviationMin. Max.
Panel A: Dependent variable
Bid-Ask spread (cents) 13.08 9.00 11.30 1.00 46.00
Analysts' dispersion (cents) 6.30 0.60 11.86 0.00 60.27
Panel B: Control variables
Size ($'billions) 25.90 8.66 50.73 1.52 424.16
Sigma (%) 36.66 33.43 13.20 18.64 74.83
Price ($) 15.68 17.45 7.36 3.20 25.40
Analyst following 6.16 4.00 6.33 1.00 38.00
Credit Rating 4.99 5.00 1.60 8.00 1.00
CAR (%) 12.38 11.92 1.65 10.31 17.40
Panel C: Held to Maturity (Secured and troubled loans)
Secured by farmland ( % of total assets) 0.87 0.28 1.35 0.00 7.99
Secured by 1-4 residential properties ( % of total assets) 5.01 4.90 2.98 0.00 9.99
Secured by > 4 residential properties ( % of total assets) 1.33 0.79 1.34 0.00 4.99
Secured by commercial properties ( % of total assets) 15.89 11.17 13.24 0.01 49.99
Net secured loans ( % of total assets) 17.83 13.93 14.02 0.00 61.28
Non-accrual loans ( % of total loans and leases) 0.59 0.45 0.47 0.00 1.99
Past due loans ( % of total loans and leases) 0.18 0.10 0.26 0.00 1.99
FDIC Texas ratio (%) 8.68 6.36 7.43 0.25 29.99
Net troubled loans ( % of total loans and leases) 0.67 0.57 0.48 0.00 2.00
Panel D: Available for Sale (Securitization and asset sales)
D - Securitization 0.79 1.00 0.41 0.00 1.00
Family residential loans ( % of gross managed assets) 20.63 19.42 12.74 0.00 79.85
Home equity lines ( % of gross managed assets) 4.30 4.24 2.41 0.00 8.99
Credit card receivables loans ( % of gross managed assets) 1.08 0.22 2.37 0.00 14.78
Auto loans ( % of gross managed assets) 4.69 2.71 4.97 0.00 19.97
Commercial and industrial loans ( % of gross managed assets) 15.47 14.56 7.79 0.03 39.86
Net securitization ( % of gross managed assets) 43.73 43.45 17.26 0.01 100.00
Available for sale securities ( % of total assets) 15.49 15.48 7.06 0.01 29.98
Repos ( % of total assets) 2.46 0.98 4.14 0.00 65.14

76

77
Table 3.3 Descriptive Statistics (Continued...)
Mean MedianStandard
DeviationMin. Max.
Panel E: Trading Securities (Off-Balance Sheet Derivatives Exposure)
Exchange Traded vs. Over the Counter Traded Derivatives
ET Net derivatives (written - purchased) ( % of total assets) 0.43 0.23 0.52 0.01 1.94
Exchange traded - interest rate ( % of total assets) 7.93 3.34 10.01 0.01 49.15
Exchange traded - foreign exchange ( % of total assets) 0.52 0.12 0.95 0.01 5.02
OTC Net derivatives (written - purchased) ( % of total assets) 9.58 0.55 47.36 0.01 478.34
Over the counter - interest rate ( % of total assets) 4.03 1.22 7.07 0.01 49.29
Over the counter - foreign exchange ( % of total assets) 0.93 0.07 1.41 0.01 4.91
Hedge vs. Trading Derivatives
Hedge - Equity ( % of total assets) 0.68 0.16 1.40 0.01 6.52
Hedge - Commodity and others ( % of total assets) 0.11 0.08 0.12 0.01 0.48
Hedge - Interest rate ( % of total assets) 12.63 4.98 19.98 0.01 147.32
Hedge - Foreign exchange ( % of total assets) 2.22 0.70 3.54 0.01 24.92
Trading - Equity ( % of total assets) 4.06 0.87 5.82 0.01 24.28
Trading - Commodity and others ( % of total assets) 28.85 5.48 62.86 0.01 478.34
Trading - Interest rate ( % of total assets) 22.28 8.50 29.87 0.01 124.24
Trading - Foreign exchange ( % of total assets) 21.17 1.59 59.72 0.01 301.55
Positive Fair Value vs. Negative Fair Value Derivatives
Gross positive fair value of equity ( % of total assets) 0.06 0.01 0.11 0.01 0.62
Gross positive fair value of commodity and others ( % of total assets) 0.09 0.01 0.17 0.01 0.68
Gross positive fair value of interest rate ( % of total assets) 0.09 0.03 0.11 0.01 0.50
Gross positive fair value of foreign exchange ( % of total assets) 0.03 0.01 0.05 0.01 0.30
Gross negative fair value of equity ( % of total assets) 0.01 0.01 0.02 0.01 0.10
Gross negative fair value of commodity and others ( % of total assets) 0.01 0.01 0.01 0.01 0.05
Gross negative fair value of interest rate ( % of total assets) 0.09 0.04 0.12 0.01 0.50
Gross negative fair value of foreign exchange ( % of total assets) 0.04 0.01 0.07 0.01 0.40
Net OBS derivatives exposure ( % of total assets) 5.27 1.27 11.42 0.01 77.25
OBS Swaps
Equity swaps ( % of total assets) 3.43 0.35 5.31 0.01 23.09
Commodity and other swaps ( % of total assets) 1.46 0.70 1.89 0.01 10.00
Interest swaps ( % of total assets) 8.46 5.27 8.36 0.01 32.15
Foreign exchange swaps ( % of total assets) 22.50 2.96 42.65 0.01 199.33
Net OBS credit exposure ( % of total assets) 2.10 0.12 7.40 0.01 130.90
Net OBS swaps exposure ( % of total assets) 8.96 2.32 14.55 0.01 66.14
Panel F: Net Exposures
Net secured loans ( % of total assets) 17.83 13.93 14.02 0.00 61.28
Net troubled loans ( % of total loans and leases) 0.67 0.57 0.48 0.00 2.00
Net securitization ( % of gross managed assets) 43.73 43.45 17.26 0.01 100.00
Net OBS derivatives exposure ( % of total assets) 5.27 1.27 11.42 0.01 77.25
Net OBS swaps exposure ( % of total assets) 8.96 2.32 14.55 0.01 66.14
78
properties make up just 0.87 percent of total assets. Of the two stages of troubled loans, non-
accrual loans and past due loans make up less than 1 percent of total loans on average. The
maximum value of troubled loans is 2 percent of total loans. These statistics indicate that
banks have few troubled loans, suggesting that they vigilantly monitor the credit worthiness
of their borrowers. The average (median) value of non-performing loans as a percentage of
tangible common equity and loan loss reserves (FDIC Texas ratio) is 8.68 (6.36) percent, with
a maximum of 29.99 percent.
Descriptive statistics of bank OBS securitization activities in Panel D show that, on
average, 79% of bank-quarters haven non-zero securitized assets. Of banks that engage in
securitization, by far the largest category of loans securitized (20.63 percent of gross
managed assets) are family residential loans, followed by commercial and industrial loans
(15.47 percent of gross managed assets). Securitization of credit card loans, auto loans, and
home equity loans each makes up less than 5 percent of gross managed assets. Net
securitized loans and leases make up 43.73 percent of gross managed assets, with a standard
deviation of 17.26 percent. These values are similar to those reported by Cheng et al. (2008)
for their sample of BHCs. Repos make up an average (median) of 2.46 (0.98) percent of total
assets, with a maximum of 65.14 percent.
Panel E provides descriptive statistics of OBS derivatives activities. Banks with zero
derivative exposure are excluded.30 Reported are details on notional and fair values of (equity,
30 For year 2003, Minton et al. (2009) find that only 19 out of 345 large U.S. banks used credit derivatives.
79
commodity, foreign exchange, and interest rate)31 derivatives used for hedging and trading
purposes, net notional position in derivatives as well as whether banks use exchange- or OTC
traded derivatives. As expected, banks use of derivatives for hedging purposes mainly extends
to interest rates (12.63 percent of gross assets). In contrast, derivatives held for trading
purposes extend to commodities (28.85 percent of gross assets), interest rates (22.28 percent
of gross assets), and foreign exchange rates (21.17 percent of gross assets).32 Most of these
derivative activities take place in OTC markets, with the mean notional value of OTC-traded
derivatives outstripping that of exchange-traded derivatives more than 20-fold (9.58 percent
vs. 0.43 percent of gross assets).
Banks have a high average (median) exposure to foreign exchange rate swaps, with a
notional value of 22.50 (2.96) percent of gross assets. The maximum notional value exceeds
total assets by a factor of 2. Interest rate swaps are less popular, with an average (median)
notional value of 8.46 (5.27) percent of gross assets. Equity and commodity swaps have a
mean notional value below 5 percent of gross assets. Both the net positive and negative fair
values of derivatives are 0.09 percent of gross assets and much smaller than their notional
amount. This is primarily because derivatives involve a future exchange of payments and fair
value is the net present value of the exchange (for forwards, futures, and swaps contracts).
31 Interest rate swaps are included in interest rate derivatives. 32 Interest rate and foreign exchange trading are closely aligned as dealers often use interest rate contracts to hedge foreign exchange risk.

80
The notional amount relates to the payment obligation based on one side of the
contract (the reference amount from which contractual arrangements will be derived) but is
generally not an amount at risk. Differences between positive and negative fair values, i.e.,
net fair value, are even smaller.33 One reason for this finding is that institutions substantially
hedge the market risk of their derivative portfolio, holding both long and short positions on
the same market exposure. This is typical of banks whose income is generated mainly from
market-making activities in derivatives. A second reason is that undertaking a hedge on an
outstanding derivative position provides banks with a way of closing out a market exposure
without having to sell the instrument. Further, different derivatives have exposures to
different markets, which may move in different directions and thus create both positive and
negative market values. In sum, the descriptive statistics show that banks that are involved in
securitization and OBS derivatives activities tend to have higher exposures to these assets, on
average.
3.5. EMPIRICAL RESULTS
Table 3.4 presents the panel regression results of the relation between the bid-ask spread,
our proxy for information risk, and HTM assets. Consistent with our predictions, there is a
statistically significant positive relation between secured loans (regressions 1 to 5) and non-
performing loans (regressions 6 to 10) with the bid-ask spread. Therefore, bank loans are at
33 For a portfolio with a single counterparty and where the bank has legally enforceable bilateral netting agreement, contracts with a negative fair value may be used to offset contracts with a positive fair value.

81
the core of bank opacity, irrespective of whether the loans are performing well. All secured
loan categories are significantly positively associated with the bid-ask spread.
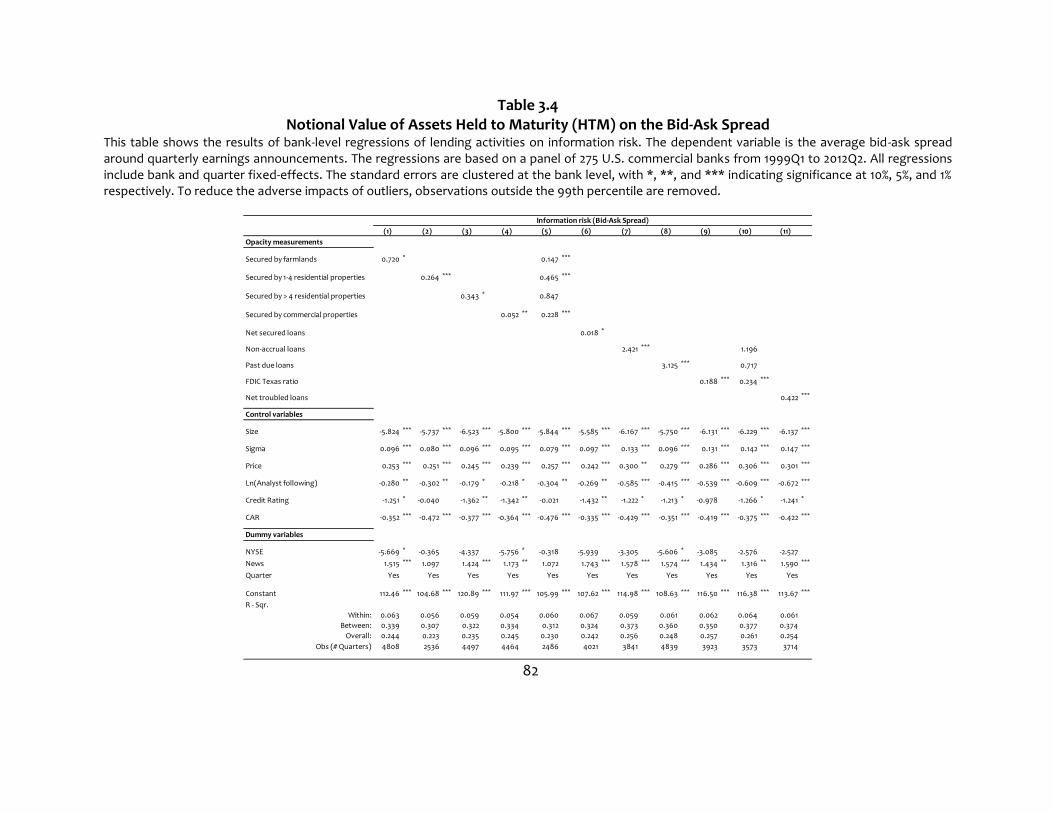
82
Table 3.4 Notional Value of Assets Held to Maturity (HTM) on the Bid-Ask Spread
This table shows the results of bank-level regressions of lending activities on information risk. The dependent variable is the average bid-ask spread around quarterly earnings announcements. The regressions are based on a panel of 275 U.S. commercial banks from 1999Q1 to 2012Q2. All regressions include bank and quarter fixed-effects. The standard errors are clustered at the bank level, with *, **, and *** indicating significance at 10%, 5%, and 1% respectively. To reduce the adverse impacts of outliers, observations outside the 99th percentile are removed.
(1) (2) (3) (4) (5) (6) (7) (8) (9) (10) (11)
Opacity measurements
Secured by farmlands 0.720 * 0.147 ***
Secured by 1-4 residential properties 0.264 *** 0.465 ***
Secured by > 4 residential properties 0.343 * 0.847
Secured by commercial properties 0.052 ** 0.228 ***
Net secured loans 0.018 *
Non-accrual loans 2.421 *** 1.196
Past due loans 3.125 *** 0.717
FDIC Texas ratio 0.188 *** 0.234 ***
Net troubled loans 0.422 ***
Control variables
Size -5.824 *** -5.737 *** -6.523 *** -5.800 *** -5.844 *** -5.585 *** -6.167 *** -5.750 *** -6.131 *** -6.229 *** -6.137 ***
Sigma 0.096 *** 0.080 *** 0.096 *** 0.095 *** 0.079 *** 0.097 *** 0.133 *** 0.096 *** 0.131 *** 0.142 *** 0.147 ***
Price 0.253 *** 0.251 *** 0.245 *** 0.239 *** 0.257 *** 0.242 *** 0.300 ** 0.279 *** 0.286 *** 0.306 *** 0.301 ***
Ln(Analyst following) -0.280 ** -0.302 ** -0.179 * -0.218 * -0.304 ** -0.269 ** -0.585 *** -0.415 *** -0.539 *** -0.609 *** -0.672 ***
Credit Rating -1.251 * -0.040 -1.362 ** -1.342 ** -0.021 -1.432 ** -1.222 * -1.213 * -0.978 -1.266 * -1.241 *
CAR -0.352 *** -0.472 *** -0.377 *** -0.364 *** -0.476 *** -0.335 *** -0.429 *** -0.351 *** -0.419 *** -0.375 *** -0.422 ***
Dummy variables
NYSE -5.669 * -0.365 -4.337 -5.756 * -0.318 -5.939 -3.305 -5.606 * -3.085 -2.576 -2.527
News 1.515 *** 1.097 1.424 *** 1.173 ** 1.072 1.743 *** 1.578 *** 1.574 *** 1.434 ** 1.316 ** 1.590 ***
Quarter Yes Yes Yes Yes Yes Yes Yes Yes Yes Yes Yes
Constant 112.46 *** 104.68 *** 120.89 *** 111.97 *** 105.99 *** 107.62 *** 114.98 *** 108.63 *** 116.50 *** 116.38 *** 113.67 ***
R - Sqr.
Within: 0.063 0.056 0.059 0.054 0.060 0.067 0.059 0.061 0.062 0.064 0.061
Between: 0.339 0.307 0.322 0.334 0.312 0.324 0.373 0.360 0.350 0.377 0.374
Overall: 0.244 0.223 0.235 0.245 0.230 0.242 0.256 0.248 0.257 0.261 0.254
Obs (# Quarters) 4808 2536 4497 4464 2486 4021 3841 4839 3923 3573 3714
Information risk (Bid-Ask Spread)
83
Our results for loans secured by farmlands are contrary to Haggard and Howe (2007) who
find, for their sample of BHCs for the period 1993-2002, that banks with a lower proportion of
agricultural (and consumer) loans are associated with higher information risk.
The relation between our control variables and the bid-ask spread is also in line with our
predictions. In particular, larger banks and banks with a higher CAR, greater analyst following,
and a higher credit rating have a smaller bid-ask spread. In contrast, return volatility, stock
price, and the (bad) news dummy are significantly positively related to bid-ask spread, as
expected. Banks that are traded on the NYSE have a lower average bid-ask spread (by 5.67
cents in regression 1), presumably due to the more stringent listing requirements there
relative to NASDAQ and AMEX.
Table 3.5 shows the results for AFS assets as a source of bank opacity. The types of
assets involved in securitization transactions are primarily bank receivables, i.e., banks
convert their illiquid assets (primarily loans) to highly liquid trading assets (e.g., residential
mortgage backed securities and CDOs) by pooling them to create investment tranches for
outsiders. We find a positive relation between net securitization dummy and the bid-ask
spread, as predicted. This indicates that banks that are involved in securitization have
significantly higher information risk (by 1.543 cents, on average). For a reduced sample of
banks that are active in securitization, we find a positive relation between net securitization
and the bid-ask spread. That is, banks with a greater exposure to securitized assets (as a
percentage of total managed assets) have higher information risk.

84
Table 3.5 Notional Value of Available for Sale (AFS) Securities on the Bid-Ask Spread
This table shows the results of bank-level regressions of bank notional value of securitization activities on information risk. The dependent variable is the average bid-ask spread around quarterly earnings announcements. The regressions are based on a panel of 275 U.S. commercial banks from 1999Q1 to 2012Q2. All regressions include bank and quarter fixed-effects. The standard errors are clustered at the bank level, with *, **, and *** indicating significance at 10%, 5%, and 1% respectively. Banks not involved in securitization are not included in their individual regressions. To reduce the adverse impacts of outliers, observations outside the 99th percentile are removed.
(1) (2) (3) (4) (5) (6) (7) (8) (9) (10)
Opacity measurements
D - Securitization 1.543 ***
Family residential loans 0.130 ** 0.030 *
Home equity lines 0.044 0.067
Credit card receivables loans -0.216 -0.234
Auto loans 0.296 *** 0.290 ***
Commercial and industrial loans -0.082 -0.060
Net securitization 0.071 *
Available for sale securities 0.243 ***
Repos -0.245 **
Control variables
Size -5.388 *** -5.174 *** -5.468 *** -5.760 *** -5.292 *** -5.443 *** -5.338 *** -5.466 *** -5.263 *** -5.157 ***
Sigma 0.091 *** 0.091 *** 0.099 *** 0.068 *** 0.096 *** 0.095 *** 0.096 *** 0.095 *** 0.088 *** 0.090 ***
Price 0.260 *** 0.291 *** 0.250 *** 0.165 ** 0.257 *** 0.257 *** 0.260 *** 0.257 *** 0.225 *** 0.229 ***
Ln(Analyst following) -0.360 *** -0.445 *** -0.368 *** -0.129 -0.309 *** -0.371 *** -0.330 *** -0.334 *** -0.332 *** -0.287 **
Credit rating -1.193 * -1.062 -1.361 ** -2.238 ** -1.032 -1.315 * -1.008 -1.103 -1.445 ** -0.686 *
CAR -0.321 *** -0.377 ** -0.394 ** -0.339 -0.312 -0.376 ** -0.289 *** -0.337 ** -0.327 ** -0.234
Dummy variables
NYSE -6.252 ** -6.745 * -5.888 * -5.088 -7.216 ** -5.669 -6.563 ** -7.099 ** -5.037 -7.204 *
News 1.575 *** 1.505 *** 1.581 *** 0.886 1.546 *** 1.742 *** 1.561 *** 1.562 *** 1.466 *** 1.140 **
Quarter Yes Yes Yes Yes Yes Yes Yes Yes Yes Yes
Constant 101.84 *** 99.21 *** 106.35 *** 114.98 *** 99.00 *** 107.73 *** 99.31 *** 101.77 *** 89.01 *** 105.05 ***
R - Sqr.
Within: 0.061 0.060 0.060 0.036 0.062 0.059 0.062 0.060 0.060 0.048
Between: 0.347 0.353 0.336 0.335 0.336 0.344 0.344 0.341 0.324 0.341
Overall: 0.247 0.248 0.244 0.286 0.249 0.244 0.249 0.248 0.236 0.241
Obs (# Quarters) 4908 4463 4661 1834 4867 4677 4908 4905 4365 3300
Information risk (Bid-Ask Spread)
85
Focusing on the five securitization categories, family residential loans and auto loans are
positive and statistically significantly related to the bid-ask spread. Family residential loans,
claimed to be a major source of mortgages defaults around the GFC (Parlour and Plantin,
2008), are the most commonly securitized asset by banks. Commercial & industrial loans
backed securitization is not significantly related to the bid-ask spread, suggesting that this is
not a major source of bank opacity.
Available for sale securities, which represent the total fair value of all available securities
for sale, is significantly positively related to the bid-ask spread. This suggests that the bank
assets “slipperiness”, i.e., the speed with which banks trade in and out of their securities on
the trading books, may well be an important driver of bank opacity. Surprisingly, we find a
negative association between Repos and the bid-ask spread. Hence, bank exposure to short-
term money-market funds decreases information risk, contrary to the popular belief that
repos play a significant role in financing opaque OBS trading activities (Brunnermeier and
Oehmke, 2013).
Table 3.6 displays the results for the association between TS and the bid-ask spread. As
expected, exchange traded derivatives contribute significantly less to bank opacity than OTC
traded derivatives. As shown in the descriptive statistics, banks hold derivatives (interest rate,
foreign exchange, commodity, and others) mostly for trading (market making) purposes. Our
results suggest that bank OBS derivatives exposure is a significant determinant of information
risk, irrespective of whether it is used for hedging or trading purposes.

86
Table 3.6 Notional Value of Trading Securities (Derivatives) on the Bid-Ask Spread
This table shows the results of bank-level regressions of notional value of derivatives activities on information risk. The dependent variable is the average bid-ask spread around quarterly earnings announcements. The regressions are based on a panel of 275 U.S. commercial banks from 1999Q1 to 2012Q2. All regressions include bank and quarter fixed-effects. The standard errors are clustered at the bank level, with *, **, and *** indicating significance at 10%, 5%, and 1% respectively. Banks not involved in derivatives trading are not included. To reduce the adverse impacts of outliers, observations outside the 99th percentile are removed.
(1) (2) (3) (4) (5) (6) (7) (8) (9) (10) (11) (12) (13) (14)
Opacity measurements
Equity derivatives 3.659 ** 0.511 **
Commodities and others derivatives 8.961 * 0.011 ***
Net derivatives (written - purchased) 0.018 0.012 ***
Interest rate derivatives 0.005 0.014 0.054 ** 0.003 ***
Foreign exchange rate derivatives 0.915 * 0.266 *** 0.187 * 0.005 *
Control variables
Size -5.554 *** -5.552 *** -5.550 *** -5.572 *** -5.560 *** -5.565 *** -5.580 *** -5.538 *** -5.399 *** -5.584 *** -5.817 *** -5.586 *** -5.843 *** -5.685 ***
Sigma 0.094 *** 0.094 *** 0.095 *** 0.095 *** 0.094 *** 0.095 *** 0.094 *** 0.094 *** 0.095 *** 0.094 *** 0.097 *** 0.094 *** 0.096 *** 0.095 ***
Price 0.258 *** 0.258 *** 0.260 *** 0.259 *** 0.258 *** 0.259 *** 0.263 *** 0.256 *** 0.276 *** 0.257 *** 0.272 *** 0.258 *** 0.268 *** 0.260 ***
Ln(Analyst following) -0.339 *** -0.339 *** -0.342 *** -0.337 *** -0.341 *** -0.339 *** -0.343 *** -0.349 *** -0.362 *** -0.344 *** -0.358 *** -0.337 *** -0.351 *** -0.340 ***
Credit rating -1.238 * -1.237 ** -1.231 * -1.235 * -1.241 * -1.239 * -1.209 * -1.247 * -1.156 * -1.243 * -1.243 * -1.235 ** -1.251 * -1.238 *
CAR -0.313 *** -0.312 *** -0.316 *** -0.319 *** -0.315 *** -0.313 *** -0.316 *** -0.311 *** -0.326 *** -0.311 *** -0.302 ** -0.319 *** -0.310 ** -0.320 **
Dummy variables
NYSE -6.142 ** -6.156 *** -6.156 ** -6.150 ** -6.122 ** -6.093 ** -6.234 ** -6.108 ** -5.371 ** -6.144 ** -7.027 ** -6.137 ** -7.165 ** -6.263 **
News 1.575 *** 1.574 *** 1.574 *** 1.578 *** 1.577 *** 1.575 *** 1.559 *** 1.588 *** 1.594 *** 1.581 *** 1.640 *** 1.581 *** 1.616 *** 1.607 ***
Quarter Yes Yes Yes Yes Yes Yes Yes Yes Yes Yes Yes Yes Yes Yes
Constant 107.00 *** 106.93 *** 107.07 *** 107.26 *** 107.14 *** 106.97 *** 107.30 *** 106.84 *** 105.24 *** 106.96 *** 109.52 *** 107.48 *** 109.73 *** 107.96 ***
R - Sqr.
Within: 0.059 0.059 0.059 0.059 0.059 0.059 0.059 0.059 0.062 0.059 0.061 0.059 0.061 0.060
Between: 0.344 0.344 0.344 0.344 0.344 0.344 0.346 0.344 0.337 0.345 0.360 0.344 0.360 0.348
Overall: 0.245 0.245 0.245 0.245 0.245 0.245 0.246 0.245 0.241 0.246 0.254 0.245 0.257 0.247
Obs (# Quarters) 4908 4908 4908 4908 4908 4908 4894 4894 4863 4908 4813 4908 4877 4876
Exchange traded Over the counter Hedge Trading
Information risk (Bid-Ask Spread)
87
Although theoretically hedging reduces risk (and therefore narrows the bid-ask spread), our
results may be explained by the fact that banks with higher exposure to derivatives for
hedging purposes are also likely to be more involved in market-making or have higher risk
exposures to the assets that are being hedged. Finally, the notional value of foreign
exchange rate derivative activity, whether traded on an exchange or OTC, is positively
associated with the bid-ask spread.
Table 3.7 presents evidence on the relationship between positive and negative fair
values of (marked-to-market) derivative exposures and the bid-ask spread. Gross negative
fair value represents the maximum loss the bank counterparties would incur if the bank were
to default, while gross positive fair value represents the maximum loss a bank would incur if
all its counterparties were to default. Both positive and negative gross fair values of equity,
commodities and others, and foreign exchange rate derivatives are positively related to the
bid-ask spread. The fair value of interest rate derivatives exposure of banks is not
significantly related to the bid-ask spread. The net OBS derivatives exposure is positively
related to the bid-ask spread, suggesting that these are a main source of banks opacity.
Finally, Table 3.8 presents the results for banks’ OBS swap activities. As shown in the
descriptive statistics, banks exposures to interest rate and foreign exchange rate swaps have
a high notional value. Consistent with this, we find interest rate and foreign exchange rate
swap exposures are significantly positively related to the bid-ask spread.
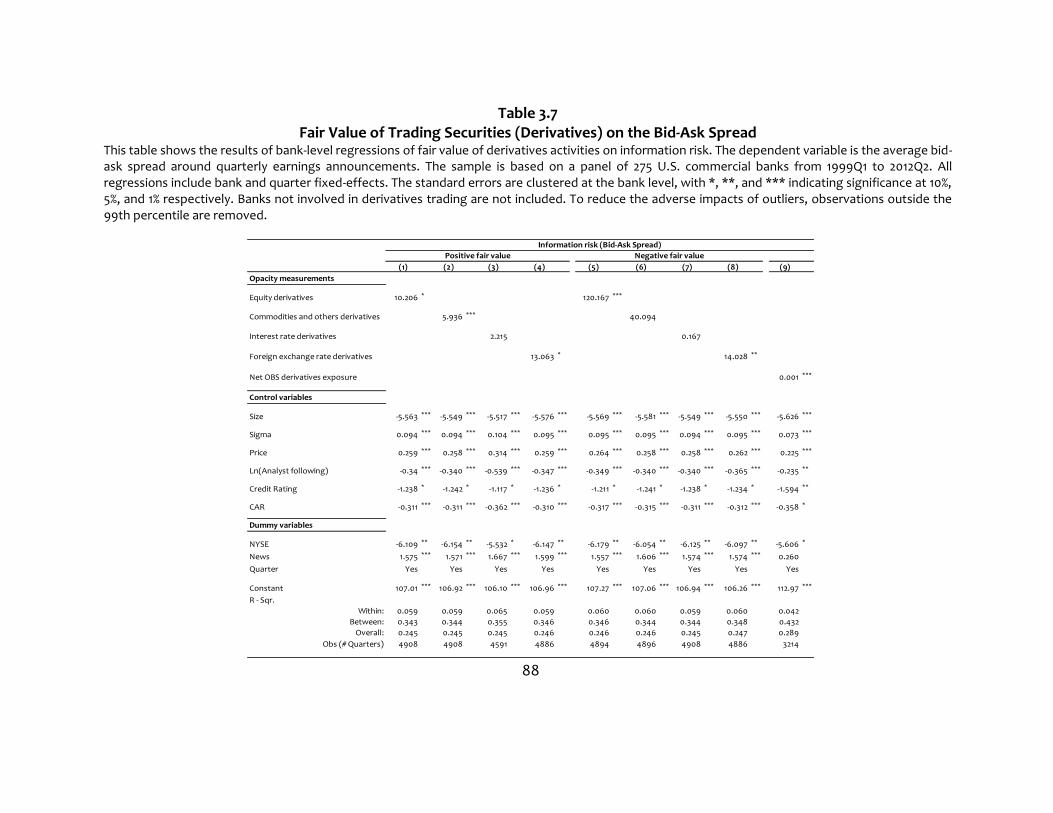
88
Table 3.7 Fair Value of Trading Securities (Derivatives) on the Bid-Ask Spread
This table shows the results of bank-level regressions of fair value of derivatives activities on information risk. The dependent variable is the average bid-ask spread around quarterly earnings announcements. The sample is based on a panel of 275 U.S. commercial banks from 1999Q1 to 2012Q2. All regressions include bank and quarter fixed-effects. The standard errors are clustered at the bank level, with *, **, and *** indicating significance at 10%, 5%, and 1% respectively. Banks not involved in derivatives trading are not included. To reduce the adverse impacts of outliers, observations outside the 99th percentile are removed.
(1) (2) (3) (4) (5) (6) (7) (8) (9)
Opacity measurements
Equity derivatives 10.206 * 120.167 ***
Commodities and others derivatives 5.936 *** 40.094
Interest rate derivatives 2.215 0.167
Foreign exchange rate derivatives 13.063 * 14.028 **
Net OBS derivatives exposure 0.001 ***
Control variables
Size -5.563 *** -5.549 *** -5.517 *** -5.576 *** -5.569 *** -5.581 *** -5.549 *** -5.550 *** -5.626 ***
Sigma 0.094 *** 0.094 *** 0.104 *** 0.095 *** 0.095 *** 0.095 *** 0.094 *** 0.095 *** 0.073 ***
Price 0.259 *** 0.258 *** 0.314 *** 0.259 *** 0.264 *** 0.258 *** 0.258 *** 0.262 *** 0.225 ***
Ln(Analyst following) -0.34 *** -0.340 *** -0.539 *** -0.347 *** -0.349 *** -0.340 *** -0.340 *** -0.365 *** -0.235 **
Credit Rating -1.238 * -1.242 * -1.117 * -1.236 * -1.211 * -1.241 * -1.238 * -1.234 * -1.594 **
CAR -0.311 *** -0.311 *** -0.362 *** -0.310 *** -0.317 *** -0.315 *** -0.311 *** -0.312 *** -0.358 *
Dummy variables
NYSE -6.109 ** -6.154 ** -5.532 * -6.147 ** -6.179 ** -6.054 ** -6.125 ** -6.097 ** -5.606 *
News 1.575 *** 1.571 *** 1.667 *** 1.599 *** 1.557 *** 1.606 *** 1.574 *** 1.574 *** 0.260
Quarter Yes Yes Yes Yes Yes Yes Yes Yes Yes
Constant 107.01 *** 106.92 *** 106.10 *** 106.96 *** 107.27 *** 107.06 *** 106.94 *** 106.26 *** 112.97 ***
R - Sqr.
Within: 0.059 0.059 0.065 0.059 0.060 0.060 0.059 0.060 0.042
Between: 0.343 0.344 0.355 0.346 0.346 0.344 0.344 0.348 0.432
Overall: 0.245 0.245 0.245 0.246 0.246 0.246 0.245 0.247 0.289
Obs (# Quarters) 4908 4908 4591 4886 4894 4896 4908 4886 3214
Positive fair value Negative fair value
Information risk (Bid-Ask Spread)
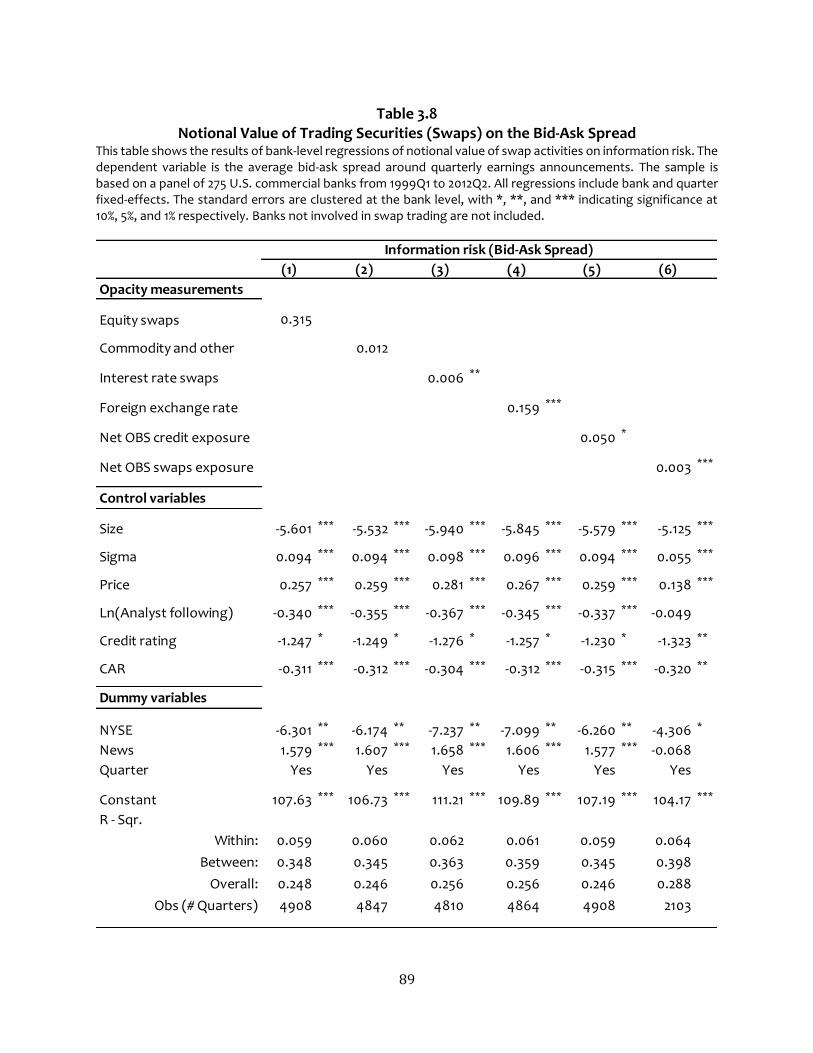
89
Table 3.8 Notional Value of Trading Securities (Swaps) on the Bid-Ask Spread
This table shows the results of bank-level regressions of notional value of swap activities on information risk. The dependent variable is the average bid-ask spread around quarterly earnings announcements. The sample is based on a panel of 275 U.S. commercial banks from 1999Q1 to 2012Q2. All regressions include bank and quarter fixed-effects. The standard errors are clustered at the bank level, with *, **, and *** indicating significance at 10%, 5%, and 1% respectively. Banks not involved in swap trading are not included.
(1) (2) (3) (4) (5) (6)
Opacity measurements
Equity swaps 0.315
Commodity and other 0.012
Interest rate swaps 0.006 **
Foreign exchange rate 0.159 ***
Net OBS credit exposure 0.050 *
Net OBS swaps exposure 0.003 ***
Control variables
Size -5.601 *** -5.532 *** -5.940 *** -5.845 *** -5.579 *** -5.125 ***
Sigma 0.094 *** 0.094 *** 0.098 *** 0.096 *** 0.094 *** 0.055 ***
Price 0.257 *** 0.259 *** 0.281 *** 0.267 *** 0.259 *** 0.138 ***
Ln(Analyst following) -0.340 *** -0.355 *** -0.367 *** -0.345 *** -0.337 *** -0.049
Credit rating -1.247 * -1.249 * -1.276 * -1.257 * -1.230 * -1.323 **
CAR -0.311 *** -0.312 *** -0.304 *** -0.312 *** -0.315 *** -0.320 **
Dummy variables
NYSE -6.301 ** -6.174 ** -7.237 ** -7.099 ** -6.260 ** -4.306 *
News 1.579 *** 1.607 *** 1.658 *** 1.606 *** 1.577 *** -0.068
Quarter Yes Yes Yes Yes Yes Yes
Constant 107.63 *** 106.73 *** 111.21 *** 109.89 *** 107.19 *** 104.17 ***
R - Sqr.
Within: 0.059 0.060 0.062 0.061 0.059 0.064
Between: 0.348 0.345 0.363 0.359 0.345 0.398
Overall: 0.248 0.246 0.256 0.256 0.246 0.288
Obs (# Quarters) 4908 4847 4810 4864 4908 2103
Information risk (Bid-Ask Spread)
90
This is in line with our earlier results on banks exposures to interest rate and foreign exchange
rate derivatives. We also find that OBS credit entrenchments are significantly positively
related to the bid-ask spread (regression 5).
Robustness
Since it is reasonable to expect our results may be driven by a few very large banks heavily
involved in securitization and OBS trading activities, we rerun the tests using two sub-groups
of banks − banks that are “too big to fail” with total assets exceeding US$100 billion and the
rest. Table 3.9 shows the results for both sub-groups of banks. Overall, our results remain
intact. Consistent with Diamond’s (1984) assertion that bank loans are inherently
informationally opaque, our robustness tests show that the lending portfolios of both the
sub-groups of banks are significantly positively related to the bid-ask spread. Banks OBS
derivatives are also significantly positively related to the bid-ask spread for both sub-groups.
The net OBS derivative exposure is particularly significant for the subsample of large banks.
Therefore, minimising exposures to net OBS derivatives is more effective in curbing
information problem in larger banks than in smaller ones.
We further test the robustness of our findings to an alternative proxy for information
risk, which is standard deviation of analysts’ forecast error. The greater this value the greater
the information risk.

91
Table 3.9 Robustness Tests for Opacity by Bank Size
This table shows the results of bank-level regressions of banks activities on information risk. The dependent variable is the average bid-ask spread around quarterly earnings announcements. The regressions are based on a panel of 275 U.S. commercial banks from 1999Q1 to 2012Q2. The columns reflect the stratification of the data into two subsamples of banks based on their size: medium to small (total assets <= $100 billion), and large (total assets >$100 billion). All regressions include bank and quarter fixed-effects. The standard errors are clustered at the bank level, with *, **, and *** indicating significance at 10%, 5%, and 1% respectively. Banks not involved in securitization or derivatives trading are not included in their individual regressions. To reduce the adverse impacts of outliers, observations outside the 99th percentile are removed.
(1) (2) (3) (4) (5) (6) (7) (8) (9) (10)
Opacity measurements
Net secured loans 0.001 * 0.006 *
Net troubled loans 0.422 ** 0.165 **
Net securitization 0.049 0.024
Net OBS derivatives exposure 0.008 * 0.065 **
Net OBS swaps exposure -0.005 0.010 ***
Control variables
Size -6.576 *** -6.133 *** -7.570 *** -6.909 *** -7.127 *** -0.382 -0.226 -0.297 -4.650 *** -2.319 ***
Sigma 0.106 *** 0.111 *** 0.053 ** 0.084 *** 0.067 *** 0.019 *** 0.012 *** 0.019 *** 0.005 0.019 **
Price 0.320 *** 0.300 *** 0.188 ** 0.281 *** 0.211 *** 0.043 *** 0.023 *** 0.041 *** -0.030 0.032 **
Ln(Analyst following) -0.472 *** -0.444 *** -0.356 -0.308 ** -0.039 -0.014 -0.069 ** -0.020 -0.066 -0.041
Credit rating -1.107 ** -1.055 -1.866 ** -1.474 * -1.249 ** 0.147 -0.202 0.118 -2.177 *** -0.568
CAR -0.326 *** -0.283 ** -0.810 ** -0.379 -0.354 ** -0.149 ** -0.125 *** -0.176 ** -0.139 0.006
Dummy variables
NYSE -6.856 ** -8.364 *** -0.339 -4.949 * -3.337 -0.361 -0.373 -0.529 4.058 *** 0.325
News 1.701 *** 1.726 *** 1.966 * 0.311 -0.031 -0.486 *** -0.311 *** -0.505 *** -0.303 -0.548 **
Quarter Yes Yes Yes Yes Yes Yes Yes Yes Yes Yes
Constant 119.59 *** 115.99 *** 125.71 *** 131.48 *** 137.49 *** 12.07 * 15.94 ** 11.74 ** 81.50 *** 43.12 ***
R - Sqr.Within: 0.068 0.070 0.051 0.049 0.081 0.172 0.232 0.157 0.329 0.192
Between: 0.373 0.367 0.311 0.465 0.434 0.208 0.117 0.239 0.499 0.353
Overall: 0.263 0.262 0.250 0.309 0.307 0.259 0.234 0.260 0.475 0.357
Obs (# Quarters) 4622 4622 964 2970 1825 286 286 286 177 172
Information risk (Bid-Ask Spread)
Banks Asset Size <= US$100 billion Banks Asset Size > US$100 billion

92
Table 3.10 shows that our results are robust to this alternative proxy of information risk.
Consistent with our earlier findings, troubled loans, securitization, OBS derivatives, and
swaps all are significantly positively related to analysts’ dispersion. The relationship between
the control variables and analysts’ dispersion is in line with our predictions. In particular,
larger banks and larger analyst following are positively related to standard deviation of
analysts’ forecast error, indicating that large banks are informationally more opaque
compared to smaller banks. In contrast, NYSE exchange dummy and the (bad) news dummy
are significantly negatively related to this measure of information risk.
Economic Value
Table 3.11 ranks the economic significance of the test variables, obtained by multiplying the
regression coefficient (β) with the standard error of the test variable (se(X)). The economic
value can be interpreted as the impact of a one standard deviation increase in the test
variable on the bid-ask spread (in cents). For the HTM category, Texas ratio, non-accrual
loans and loans secured by farmlands contribute most to opacity. A one standard increase in
each of these variables increases the bid-ask spread by 1.4, 1.1, and 1 cent respectively.
On banks’ AFS exposures, available for sale securities, and securitization of family residential
loans have the largest economic impact on bank opacity. A one standard deviation increase
in each of these exposures increases the bid-ask spread by 1.7 cents. Banks which are
involved in securitization have a 1.5 cents higher bid-ask spread compared to those not
involved.

93
Table 3.10 Robustness Tests Using Alternative Proxy of Information Risk (Analysts’ Dispersion)
This table shows the results of bank-level regressions of banks activities on information risk. The dependent variable is the standard deviation of analysts’ EPS forecast errors around quarterly earnings announcements. The regressions are based on a panel of 275 U.S. commercial banks from 1999Q1 to 2012Q2. All regressions include bank and quarter fixed-effects. The standard errors are clustered at the bank level, with *, **, and *** indicating significance at 10%, 5%, and 1% respectively. Banks not involved in securitization or derivatives trading are not included in their individual regressions. To reduce the adverse impacts of outliers, observations outside the 99th percentile are removed.
(1) (2) (3) (4) (5)
Opacity measurements
Net secured loans 1E-05
Net troubled loans 0.004 ***
Net securitization 0.001 ***
Net OBS derivatives exposure 2E-04 ***
Net OBS swaps exposure 4E-04 ***
Control variables
Size 0.024 *** 0.022 *** 0.018 *** 0.016 *** 0.025 ***
Sigma 0.000 0.000 0.000 0.000 0.000
Price 0.001 0.008 ** -0.001 0.006 0.029 ***
Ln(Analyst following) 0.049 *** 0.049 *** 0.045 *** 0.058 *** 0.058 ***
Credit rating 0.004 ** 0.004 ** 0.003 * 0.005 ** 0.006
CAR 0.001 * 0.000 0.000 0.002 0.005 **
Dummy variables
NYSE -0.023 *** -0.023 *** -0.008 -0.025 ** -0.052 ***
News -0.010 *** -0.010 *** -0.007 ** -0.010 ** -0.014 **
Quarter Yes Yes Yes Yes Yes
Constant -0.193 *** -0.203 *** -0.181 *** -0.134 -0.049
R - Sqr.
Within: 0.098 0.101 0.137 0.085 0.129
Between: 0.607 0.595 0.567 0.568 0.486
Overall: 0.248 0.252 0.266 0.212 0.204
Obs (# Quarters) 5306 5306 5306 3004 1973
Information risk
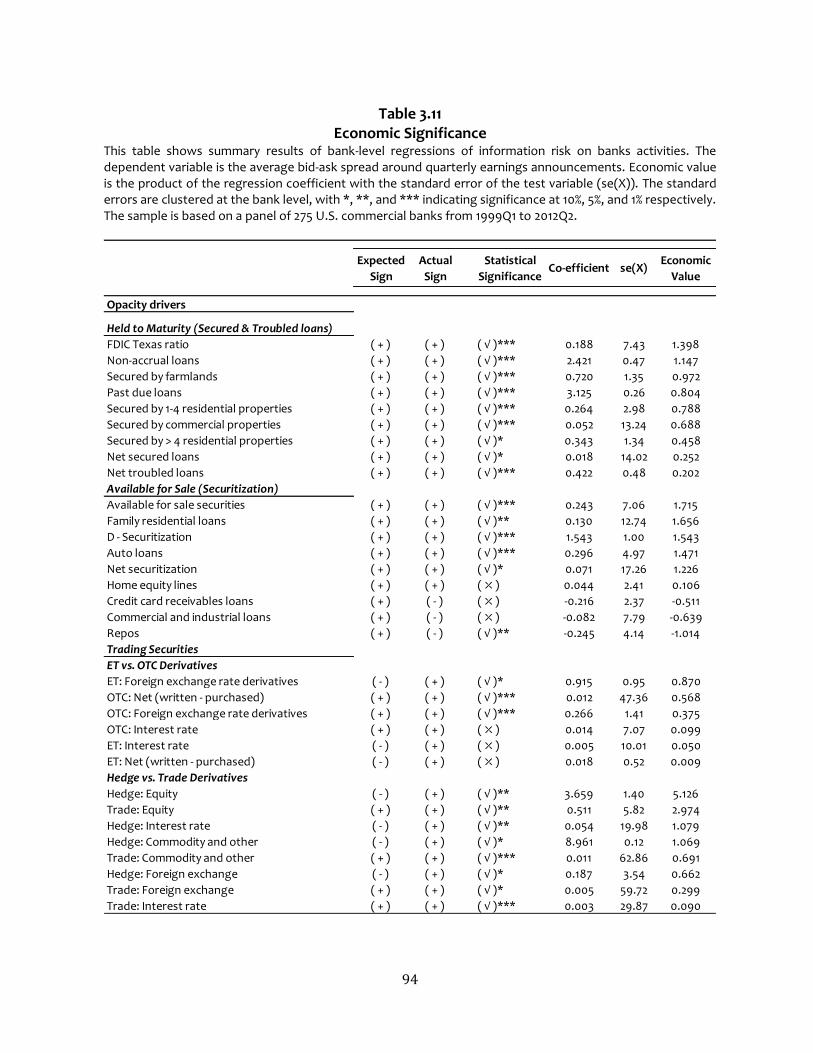
94
Table 3.11 Economic Significance
This table shows summary results of bank-level regressions of information risk on banks activities. The dependent variable is the average bid-ask spread around quarterly earnings announcements. Economic value is the product of the regression coefficient with the standard error of the test variable (se(X)). The standard errors are clustered at the bank level, with *, **, and *** indicating significance at 10%, 5%, and 1% respectively. The sample is based on a panel of 275 U.S. commercial banks from 1999Q1 to 2012Q2.
Expected
Sign
Actual
Sign
Statistical
SignificanceCo-efficient se(X)
Economic
Value
Opacity drivers
Held to Maturity (Secured & Troubled loans)
FDIC Texas ratio ( + ) ( + ) ( √ )*** 0.188 7.43 1.398
Non-accrual loans ( + ) ( + ) ( √ )*** 2.421 0.47 1.147
Secured by farmlands ( + ) ( + ) ( √ )*** 0.720 1.35 0.972
Past due loans ( + ) ( + ) ( √ )*** 3.125 0.26 0.804
Secured by 1-4 residential properties ( + ) ( + ) ( √ )*** 0.264 2.98 0.788
Secured by commercial properties ( + ) ( + ) ( √ )*** 0.052 13.24 0.688
Secured by > 4 residential properties ( + ) ( + ) ( √ )* 0.343 1.34 0.458
Net secured loans ( + ) ( + ) ( √ )* 0.018 14.02 0.252
Net troubled loans ( + ) ( + ) ( √ )*** 0.422 0.48 0.202
Available for Sale (Securitization)
Available for sale securities ( + ) ( + ) ( √ )*** 0.243 7.06 1.715
Family residential loans ( + ) ( + ) ( √ )** 0.130 12.74 1.656
D - Securitization ( + ) ( + ) ( √ )*** 1.543 1.00 1.543
Auto loans ( + ) ( + ) ( √ )*** 0.296 4.97 1.471
Net securitization ( + ) ( + ) ( √ )* 0.071 17.26 1.226
Home equity lines ( + ) ( + ) ( ⤫ ) 0.044 2.41 0.106
Credit card receivables loans ( + ) ( - ) ( ⤫ ) -0.216 2.37 -0.511
Commercial and industrial loans ( + ) ( - ) ( ⤫ ) -0.082 7.79 -0.639
Repos ( + ) ( - ) ( √ )** -0.245 4.14 -1.014
Trading Securities
ET vs. OTC Derivatives
ET: Foreign exchange rate derivatives ( - ) ( + ) ( √ )* 0.915 0.95 0.870
OTC: Net (written - purchased) ( + ) ( + ) ( √ )*** 0.012 47.36 0.568
OTC: Foreign exchange rate derivatives ( + ) ( + ) ( √ )*** 0.266 1.41 0.375
OTC: Interest rate ( + ) ( + ) ( ⤫ ) 0.014 7.07 0.099
ET: Interest rate ( - ) ( + ) ( ⤫ ) 0.005 10.01 0.050
ET: Net (written - purchased) ( - ) ( + ) ( ⤫ ) 0.018 0.52 0.009
Hedge vs. Trade Derivatives
Hedge: Equity ( - ) ( + ) ( √ )** 3.659 1.40 5.126
Trade: Equity ( + ) ( + ) ( √ )** 0.511 5.82 2.974
Hedge: Interest rate ( - ) ( + ) ( √ )** 0.054 19.98 1.079
Hedge: Commodity and other ( - ) ( + ) ( √ )* 8.961 0.12 1.069
Trade: Commodity and other ( + ) ( + ) ( √ )*** 0.011 62.86 0.691
Hedge: Foreign exchange ( - ) ( + ) ( √ )* 0.187 3.54 0.662
Trade: Foreign exchange ( + ) ( + ) ( √ )* 0.005 59.72 0.299
Trade: Interest rate ( + ) ( + ) ( √ )*** 0.003 29.87 0.090
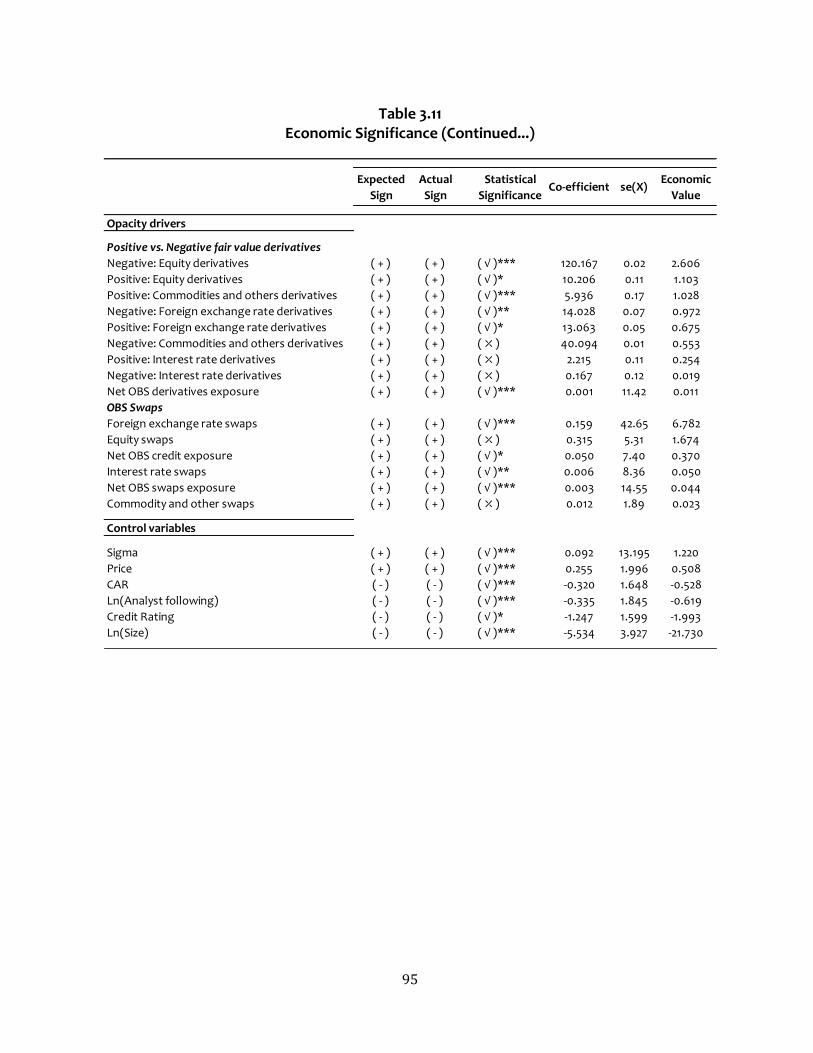
95
Table 3.11 Economic Significance (Continued...)
Expected
Sign
Actual
Sign
Statistical
SignificanceCo-efficient se(X)
Economic
Value
Opacity drivers
Positive vs. Negative fair value derivatives
Negative: Equity derivatives ( + ) ( + ) ( √ )*** 120.167 0.02 2.606
Positive: Equity derivatives ( + ) ( + ) ( √ )* 10.206 0.11 1.103
Positive: Commodities and others derivatives ( + ) ( + ) ( √ )*** 5.936 0.17 1.028
Negative: Foreign exchange rate derivatives ( + ) ( + ) ( √ )** 14.028 0.07 0.972
Positive: Foreign exchange rate derivatives ( + ) ( + ) ( √ )* 13.063 0.05 0.675
Negative: Commodities and others derivatives ( + ) ( + ) ( ⤫ ) 40.094 0.01 0.553
Positive: Interest rate derivatives ( + ) ( + ) ( ⤫ ) 2.215 0.11 0.254
Negative: Interest rate derivatives ( + ) ( + ) ( ⤫ ) 0.167 0.12 0.019
Net OBS derivatives exposure ( + ) ( + ) ( √ )*** 0.001 11.42 0.011
OBS Swaps
Foreign exchange rate swaps ( + ) ( + ) ( √ )*** 0.159 42.65 6.782
Equity swaps ( + ) ( + ) ( ⤫ ) 0.315 5.31 1.674
Net OBS credit exposure ( + ) ( + ) ( √ )* 0.050 7.40 0.370
Interest rate swaps ( + ) ( + ) ( √ )** 0.006 8.36 0.050
Net OBS swaps exposure ( + ) ( + ) ( √ )*** 0.003 14.55 0.044
Commodity and other swaps ( + ) ( + ) ( ⤫ ) 0.012 1.89 0.023
Control variables
Sigma ( + ) ( + ) ( √ )*** 0.092 13.195 1.220
Price ( + ) ( + ) ( √ )*** 0.255 1.996 0.508
CAR ( - ) ( - ) ( √ )*** -0.320 1.648 -0.528
Ln(Analyst following) ( - ) ( - ) ( √ )*** -0.335 1.845 -0.619
Credit Rating ( - ) ( - ) ( √ )* -1.247 1.599 -1.993
Ln(Size) ( - ) ( - ) ( √ )*** -5.534 3.927 -21.730
96
Finally, of banks’ TS exposures, we find that equity derivatives for hedging and trading
purposes contribute most to opacity, with a one standard deviation increase in their
exposures increasing the bid-ask spread by 5.1 and 2.9 cents respectively.
3.6. CONCLUSION
This study combines the literature on banks opacity and market microstructure to assess
which bank activities are the largest contributors to information risk. We use quarterly
earnings announcements as the event to capture information risk. Using a sample of 275 U.S.
commercial banks listed on the NASDAQ/NYSE/AMEX for 1999Q4 to 2012Q2 and the bid-ask
spread as our proxy for opacity, we find banks’ trading securities exposure (in particular
equity derivatives) contribute most to bank opacity, followed by available securities, and
securitization of family residential loans. Further, of held to maturity assets, FDIC Texas ratio
and loans secured by farmlands are the most significant contributors to bank opacity. As
expected, larger banks and those listed on the NYSE exhibit less information risk, as are
banks with a higher capital adequacy ratio, greater analysts following, and a higher credit
rating. Our findings are robust for sub-samples of small and large banks, and using analysts’
dispersion as our alternative proxy for information risk.
97
REFERENCES
Abad, D., and Yagüe, J. (2012). From PIN to VPIN: An Introduction to Order Flow Toxicity. The
Spanish Review of Financial Economics 10(2), 74-83.
Affinito, M., and Tagliaferri, E. (2010). Why Do (or Did?) Banks Securitize Their Loans?
Evidence from Italy. Journal of Financial Stability 6, 189–202.
Affleck-Graves, J., Jennings, R., and Mendenhall, R. (1995). Evidence of Informed Trading
Prior to Earnings Announcements. New York University Working Paper # FIN-94-001.
Retrieved on 16 September 2012 from http://ssrn.com/abstract=1298804
Agrawal, V., Kothare, M., Ramesh, K. S. R., and Wadhwa, P. (2004). Bid-ask Spreads,
Informed Investors, and the Firm’s Financial Condition. The Quarterly Review of
Economics and Finance 44(1), 58-76.
Ashcraft, A., and Bleakley, H. (2006). On the Market Discipline of Informationally Opaque
Firms: Evidence from Bank Borrowers in the Federal Funds Market, Federal Reserve
Bank of New York Staff Report # 257. Retrieved on 6 December from
http://www.newyorkfed.org/research/staff_ reports/sr257.html
Bagehot, W. (1971). The Only Game in Town. Financial Analysts Journal 27, 12-22.
Ball, R., and Brown, P. (1968). An Empirical Evaluation of Accounting Income Number.
Journal of Accounting Research 6(2), 159-178.
Basle Committee on Banking Supervision. (2008). Credit Risk Transfer: Developments from
2005-2007. The Joint Forum, Basel. Retrieved on 16 September 2012 from
http://www.bis.org/publ/joint18.pdf
Benston, G. J., and Kaufman, G. G. (1988). Risk and Solvency Regulation of Depository
Institutions: Past Policies and Current Options. Salomon Brothers Center Monograph
Series in Finance and Economics #1988-1.
Berkman, H., and Truong, C. (2009). Event day 0? After-hours Earnings Announcements.
Journal of Accounting Research 47(1), 71-103.
Berlin, M., and Loeys, J. G. (1988). Bond Covenants and Delegated Monitoring. Journal of
Finance, 43, 397-412.
Bischof, J., Brüggemann, U., and Daske, H. (2012). Fair Value Reclassifications of Financial
Assets during the Financial Crisis. SFB 649 Discussion Paper 2012-010. Retrieved on 21

98
September 2012 from http://sfb649.wiwi.hu-berlin.de/papers/pdf/SFB649DP2012-
010.pdf
Brunnermeier, M. K., and Oehmke, M. (2013). The Maturity Rat Race. The Journal of Finance
68, 483-521.
Calomiris, C. (2008). The Subprime Turmoil: What’s Old, What’s New, and What’s Next. 9th
Jacques Polak Annual Research Conference. Retrieved on 16 September 2012 from
http://www.imf.org/external/np/res/seminars/2008/arc/pdf/cwc.pdf
Calomiris, C. W. (2009). Banking Crises and the Rules of the Game. NBER Working Papers
15403. Retrieved on 16 September 2012 from http://www.nber.org/papers/w15403.pdf
Calomiris, C. W. (2010). Banking Crises Yesterday and Today. Financial History Review 17, 3-
12.
Calomiris, C., and Mason, J. (2004). Credit Card Securitization and Regulatory Arbitrage.
Journal of Financial Services Research 26(1), 5-27.
Campbell, T., and Kracaw, W. (1980). Information Production, Market SignalingSignalling,
and the Theory of Intermediation. Journal of Finance 35, 863-882.
Cheng, M., Dhaliwal, D., and Neamtiu, M. (2008). Banks Asset Securitization and Information
Opacity. Working paper, University of Arizona, Retrieved on 25 September 2012 from
http://www.usc.edu/schools/business/FBE/seminars/papers/ARF_5-2-
08_NEAMTIU.pdf
Comerton-forde, C., Hendershott, T., Jones, C. M., Moulton, P. C., and Seasholes, M. S.
(2010). Time Variation in Liquidity: The Role of Market-maker Inventories and
Revenues. Journal of Finance 65(1), 295–331.
Copeland, T. E., and Galai, D. (1983). Information Effects on the Bid-ask Spread. Journal of
Finance 38(5), 1457–1469.
Diamond, D. W. (1984). Financial Intermediation and Delegated Monitoring. Review of
Economic Studies 51(3), 393-414.
Diamond, D. W. (1989). Reputation Acquisition in Debt Markets. Journal of Political Economy
97, 828-862.
Diamond, D. W. (1991). Monitoring and Reputation: The Choice between Bank Loans and
Directly Placed Debt. Journal of Political Economy 99, 689-721.
99
Easley, D., Kiefer, N., O’Hara, M., and Paperman, J. (1996). Liquidity, Information, and
Infrequently Traded Stocks. Journal of Finance 51(4), 1405-1436.
Easley, D., Lopez, M., and O'Hara, M. (2010). The Microstructure of the ‘Flash Crash’: Flow
Toxicity, Liquidity Crashes and the Probability of Informed Trading. The Journal of
Portfolio Management 37(2), 118-128.
Flannery, M. J., Simon, H. K., and Nimalendran, M. (2004). Market Evidence on the
Opaqueness of Banking Firms’ Assets. Journal of Financial Economics 71(3), 419-460.
Flannery, M. J., Simon, H. K., and Nimalendran, M. (2010). The 2007–2009 Financial Crisis and
Bank Opaqueness. Working Paper 2010-27, FRB San Francisco. Retrieved on 16
September 2012 from
http://www.frbsf.org/publications/economics/papers/2010/wp10-27bk.pdf
Glosten, L. R., and Milgrom, P. R. (1985). Bid, Ask and Transaction Prices in a Specialist Market
with Heterogeneously Informed Traders. Journal of Financial Economics 14(1), 71–100.
Haggard, K. S., and Howe, J. S. (2007). Are Banks Opaque? Working paper, University of
Southern Mississippi. Retrieved on 16 September 2012 from
http://69.175.2.130/~finman/Orlando/Papers/Are_Banks_Opaque.pdf
Hauck, A., and Neyer, U. (2008). Are Rating Splits a Useful Indicator for the Opacity of an
Industry?. Heinrich-Heine-University Duesseldorf Economics Finance, and Taxation
Discussion Paper No. 3/2008. Retrieved on 16 September 2012 from
http://papers.ssrn.com/sol3/papers.cfm?abstract_id=1304146
Hentschel, L., and Smith, C. (1996). Derivatives Regulation: Implications for Central Banks.
Journal of monetary economics 40(2), 305-346.
Iannotta, G. (2006). Testing for Opaqueness in the European Banking Industry: Evidence
from Bond Credit Ratings. Journal of Financial Services Research 30(3), 287-309.
Iannotta, G., and Navone, M. A. (2009). Crashes and Bank Opaqueness. CAREFIN Research
Paper # 20/09. Retrieved on 16 September 2012 from http://ssrn.com/abstract=1600190
James, C. (1987). Some Evidence on the Uniqueness of Bank Loans. Journal of Financial
Economics 19, 217-235.
Jeffrey, S. J., Wayne, Y. L., and Timothy, J. Y. (20122013). Valuation and Systemic Risk
Consequences of Bank Opacity. Journal of Banking and Finance , 37(3), 693–
706.Forthcoming. Retrieved on 19 November 2012 from
http://www.sciencedirect.com/science/article/pii/S0378426612003391?v=s5

100
Jin, L., and Myers, S. C. (2006). R2 around the World: New Theory and New Tests. Journal of
Financial Economics 79(2), 257-292.
Johnson, M. F., Kasznik, R., and Nelson, K. K. (2001). The Impact of the Securities Litigation
Reform on the Disclosure of Forward-Looking Information by High Technology Firms.
Journal of Accounting Research 39(2), 297-327.
Jones, J. S., Lee, W. Y., and Yeager, T. J. (2012). Opaque Banks, Price Discovery, and Financial
Instability. Journal of Financial Intermediation 21(3), 383-408.
Lakhal, F. (2008). Stock Market Liquidity and Information Asymmetry around Voluntary
Earnings Disclosures: New Evidence from France. International Journal of Managerial
Finance 4(1), 60-75.
Lang, M., and Lundholm, R. (1996). Corporate Disclosure Policy and Analyst Behavior. The
Accounting Review 71, 467-492.
Lin, J. C., Sanger, G. C., and Booth, G. G. (1995). Trade Size and Components of the Bid-Ask
Spread. Review of Financial Studies 8 (4), 1153-1183.
Minton, B. A., Stulz, R., and Williamson, R. (2009). How Much Do Banks Use Credit
Derivatives to Hedge Loans?. Journal of Financial Services Research 35, 1-31.
Morgan, D. P. (2002). Rating Banks: Risk and Uncertainty in an Opaque Industry. American
Economic Review 92(4), 874-888.
Morrison, A. D. (2005). Credit Derivatives, Disintermediation and Investment Decisions.
Journal of Business 78, 621-647.
Myers, S., and Rajan, R. (1998). The Paradox of Liquidity. Quarterly Journal of Economics
113(3), 733-771.
O’Brien, P., and Bhushan, R. (1990). Analyst Following and Institutional Ownership. Journal
of Accounting Research 28, 55-76.
O’Hara, M., and Oldfield, G. S. (1986). The Microeconomics of Market Making. Journal of
Financial and Quantitative Analysis, 21(4), 361–376.
O’Neil, C. (2012). Complexity and Transparency in Finance. Mathbabe.org. Retrieved on 21
September 2012 from http://mathbabe.org/2012/01/29/2544/
Parlour, C., and Plantin, G. (2008). Loan Sales and Relationship Banking. Journal of Finance
63, 1291-1314.
101
Riedl, E. J., and Serafeim, G. (2008). Information Risk and Fair Value: An Examination of
Equity Betas and Bid-Ask Spreads. Working paper 10-008, Harvard Business School.
Roll, R. (1987). R Squared. Journal of Finance 43(3), 541-566.
Vallascas, F., and Keasey, K. (2012). Systemic Risk Potential, Opacity and Disclosure in
European Banks. Retrieved on 16 September 2012 from
http://69.175.2.130/~finman/Turin/Papers/SystemicRiskPotential.pdf
Wagner, W. (2007a), Financial Development and the Opacity of Banks. Economics Letters
97(1).
Wagner, W. (2007b). The Liquidity of Bank Assets and Banking Stability. Journal of Banking
and Finance 31, 121-139.

102
Appendix B Variables Description
Bid-Ask Spread (BAS) The difference in price between the highest price that a buyer is willing to pay for a share and the lowest price for which
a seller is willing to sell it (Boyd and Graham, 1986).
Analysts' Dispersion Analysts' dispersion is compuated as standard deviation of analysts’ earnings forecast errors. Earning forecast error is
computed as the differences of actual earnings per share (EPS) to analysts forecasted EPS across all (n) analysts in any
given quarter (we take the last available forecasts prior to quarterly earnings announcements).
Secured by farmlands Loans secured by farmlands as a percentage of total assets.
Secured by 1-4 residential
properties
Loans secured by 1-4 residential properties as a percentage of total assets.
Secured by >4 residential
properties
Loans secured by multi-family residential (>4) properties as a percentage of total assets.
Secured by commercial
properties
Loans secured by commercial loans as a percentage of total assets.
Net secured loans Sum of all loans secured by farmlands, 1-4 residential, >4 residential, and commercial properties as a percentage of
total assets.
Non-accruals loans Total non-accruals loans and lease finance receivables as a percentage of gross loans and leases.
Past due loans Total past due 90-days or more and still accruing loans and lease finance receivables as a percentage of gross loans
and leases.
FDIC Texas ratio The Texas ratio is an early warning system to identify banks potential lending problems. It is calculated by dividing the
value of the bank's non-performing assets (Non-performing loans + Real Estate Owned)*100 by the sum of its tangible
common equity capital and loan loss reserves.
Net troubled loans Sum of all non-accrual and past due loans as a percentage of gross loans and leases.
D-Securitization A dummy variable which is equals to one if bank is involved in securitization otherwise zero.
Family residential loans Family residential loans securitization as a percentage of total on balance sheet managed assets.
Home equity lines Home equity lines loans securitization as a percentage of total on balance sheet managed assets.
Credit card receivables loans Credit card receivables loans securitization as a percentage of total on balance sheet managed assets.
Auto loans Auto loans securitization as a percentage of total on balance sheet managed assets.
Commercial and industrial
loans
Commercial and industrial loans securitization as a percentage of total on balance sheet managed assets.
Net securitization Sum of family, home, credit card, auto, and commercial and industrial loans securitization as a percentage of total
managed assets.
Available for sale securities Includes the total fair value of available-for-sale securities as a percentage of total assets.
Repos Net Fed fund sold and securities purchased under repurchase agreements to total assets.
Panel A: Independent variable
Panel B: Held to Maturity (Secured and troubled loans)
Panel C: Asset for Sale (Securitization and asset sales)

103
Appendix B (Continued …)
Net derivatives (written -
purchased)
Exchange (or OTC) traded equity, commodities and others derivative contracts written minus purchased as a
percentage of total assets.
1. Gross notional amount of equity derivative contracts held for purposes other than trading (or for the purposes
held for trading) as a percentage of total assets.
2. Gross positive (or negative) fair value of equity derivative contracts as a percentage of total assets.
1. Gross notional amount of commodities and others derivative contracts held for purposes other than trading (or
for purposes held for trading) as a percentage of total assets.
2. Gross positive (or negative) fair value of commodities and others derivative contracts as a percentage of total
assets.
1. Exchange (or OTC) traded interest rate derivatives contracts written minus purchased as a percentage of total 2. Gross notional amount of interest rate derivative contracts held for purposes other than trading (or for purposes
held for trading) as a percentage of total assets.
3. Gross positive (or negative) fair value of interest derivative contracts as a percentage of total assets.
1. Exchange (or OTC) traded foreign exchange rate derivatives contracts written minus purchased as a percentage 2. Gross notional amount of foreign exchange rate derivative contracts held for purposes other than trading (or for
purposes held for trading) as a percentage of total assets.
3. Gross positive (or negative) fair value of foreign exchange rate derivative contracts as a percentage of total
assets.
Net OBS derivatives
exposure
Sum of all type equity, commodities, interest rate, foreign exchange rate and others derivatives to total assets.
Equity swaps Includes the notional principal value of all outstanding equity or equity index swaps, whether the swap is undertaken
by the reporting entity to hedge its own equity-based risk, in an intermediary capacity, or to hold in inventory as a
percentage of total assets.
Commodity and other swaps Includes the notional principal value of all other swap agreements that are not reportable as either interest rate,
foreign exchange rate, or equity derivative contracts, whether the swap is undertaken by the reporting entity to hedge
its own equity-based risk, in an intermediary capacity, or to hold in inventory as a percentage of total assets.
Interest swaps Includes the notional principal value of all outstanding interest rate and basis swaps whose predominant risk
characteristic is interest rate risk, whether the swap is undertaken by the reporting entity to hedge its own interest
rate risk, in an intermediary capacity, or to hold in inventory as a percentage of total assets.
Foreign exchange rate swaps Includes the notional principal value (stated in U.S. dollars) of all outstanding cross-currency foreign exchange rate
swaps, whether the swap is undertaken by the reporting entity to hedge its own exchange rate risk, in an intermediary
capacity, or to hold in inventory as a percentage of total assets.
Net OBS credit exposure Includes all off-balance-sheet interest rate, foreign exchange, equity derivative, and commodity and other contracts in
a single current credit exposure amount for off-balance-sheet derivative contracts covered by the risk-based capital
standards as a percentage of total assets.
Net OBS swaps exposure Sum of all type equity, commodities, interest rate, and foreign exchange rate swaps to total assets.
Panel D: Trading Securities (Off-balance sheet derivatives exposure)
Equity derivatives
Commodities and others
derivatives
Foreign exchange rate
derivatives
Interest rate derivatives
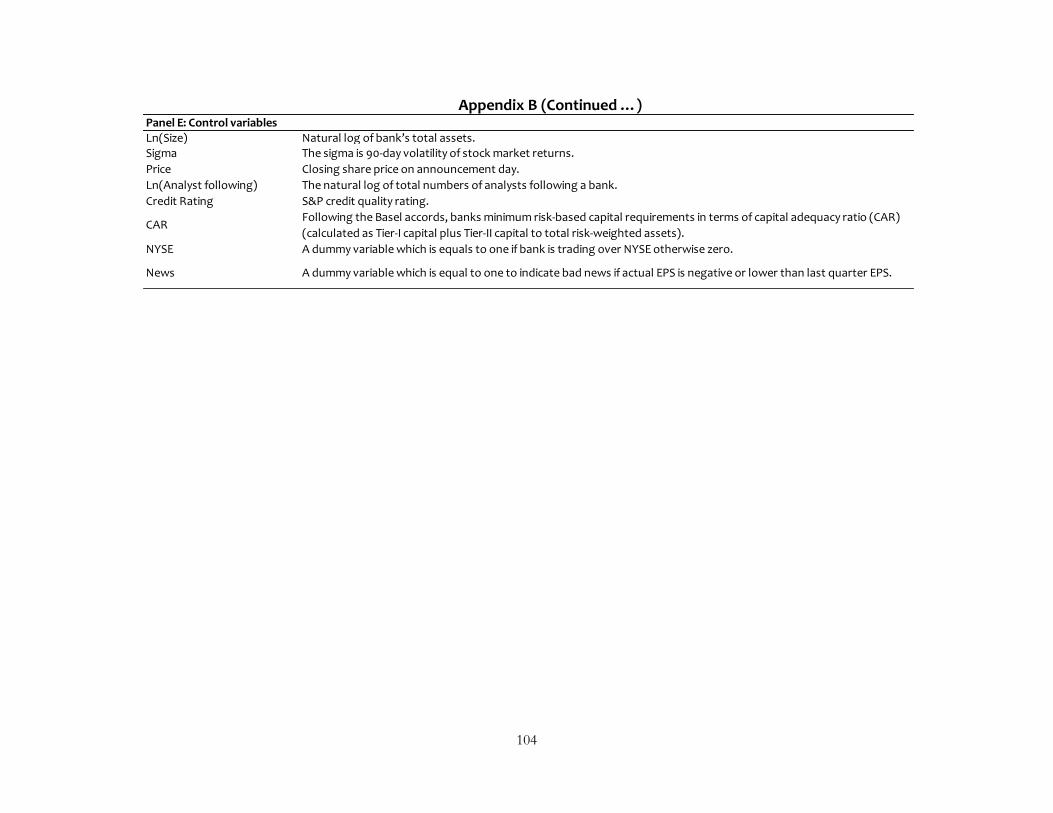
104
Appendix B (Continued …)
Ln(Size) Natural log of bank’s total assets.Sigma The sigma is 90-day volatility of stock market returns.
Price Closing share price on announcement day.
Ln(Analyst following) The natural log of total numbers of analysts following a bank.
Credit Rating S&P credit quality rating.
CARFollowing the Basel accords, banks minimum risk-based capital requirements in terms of capital adequacy ratio (CAR)
(calculated as Tier-I capital plus Tier-II capital to total risk-weighted assets).
NYSE A dummy variable which is equals to one if bank is trading over NYSE otherwise zero.
News A dummy variable which is equal to one to indicate bad news if actual EPS is negative or lower than last quarter EPS.
Panel E: Control variables
105
CHAPTER 4:
TRADING CHANNEL AND TRANSMISSION OF MONETARY POLICY SHOCKS
4.1. INTRODUCTION “One of the key lessons of the crisis has been the need to strengthen the risk coverage of the regulatory capital framework. Failure to capture major on- and off-balance sheet risks, as well as derivative related exposures, was a key destabilizing factor during the crisis”
Basel Committee on Banking Supervision, Page 3 (http://www.bis.org/publ/bcbs189_dec2010.pdf)
The dynamic interaction between banks’ traditional lending activities and their trading
activities is a novel and largely unexplored research topic. Traditional banking is relationship-
based, unscalable, long-term oriented with high implicit capital, and with inherently low risk.
In contrast, the trading model of banking is highly scalable, short-term oriented, capital
constrained, and inherently risky. In this essay, we examine the dynamic interaction between
these two types of banking activities in the presence of both exogenous and endogenous
shocks.
Our first aim is to investigate how an exogenous shock, e.g., monetary tightening, brings
about a change in banks’ traditional capital and lending activities, and trading activities. In
doing so, we aim to establish whether a trading channel exists beside the capital and lending
channels, and its role in exogenous shock transmission. Specifically, we examine whether (i)
an exogenous shock first affects banks’ traditional capital and lending activities before
transmitting to the banks’ trading activities; (ii) the reverse happens; or (iii) the shock affects

106
all banking activities simultaneously. We examine these dynamic responses conditional on
banks’ reserve level.
Early studies examine the dynamics of banks’ balance sheet adjustments in response to
exogenous shocks through the capital and lending channels as the shock transmission
medium (see Bernanke (1983), Shrieves and Dahl (1992), Hancock and Wilcox (1993), amongst
many others). These studies tend to focus on the effects of an excess or a shortfall in deposits
and capital requirements on banks lending and risk-taking profile, respectively.
The lending channel operates whenever a bank faces a shock in its deposits (mostly due
to external factors), which in turn causes the bank to adjust its lending activities in the
following quarter. For example, the assets side of banks’ balance sheet (i.e., loans) drops to
match a reduction in deposits in response to monetary tightening (Bernanke, 1983).
The capital channel, in comparison, operates whenever a bank faces a shock in its capital
or risk-taking profile; banks adjust both their deposit and lending to maintain their capital-to-
assets ratio. In support of this, Bernanke and Lown (1991) and Peek and Rosengren (1995)
show how unusually large loan losses around 1990 caused a major reduction in banks’ capital,
thus reducing their lending capacity. Regulators set strict criteria in evaluating the quality of
banks’ assets in the early 1990s by raising the minimum capital-to-asset ratios for U.S. banks,
which effectively caused banks to reduce their loan portfolio (Shrieves and Dahl, 1992;
Hancock and Wilcox, 1993). Hancock et al. (1995) show how banks raise their capital-to-asset
ratio by shrinking fund flow in their lending channel in response to capital shocks, with banks
adjusting their capital ratio much faster than they adjust their loan portfolios.

107
Boyd and Gertler (1994) observe that for much of the last two decades, there has been
a decline in banks’ on-balance sheet loan commitments, increasingly being replaced by off
balance sheet (OBS) loan commitments and letters of credit as banks tried to balance their
deposits and loans while maintaining their profitability. With reduced lending margins in the
1990s, banks also sharply increased their securities holdings in compliance with the Basel
Accord, which requires banks to hold more capital against loan commitments than against
securities (Hall, 1993). Since equity is a more costly source of capital than debt, banks prefer
to reduce their lending rather than increase their capital in the face of monetary tightening
(Gambacorta and Marques-Ibanez, 2011). Altunbas et al. (2009) show that monetary
tightening does not significantly affect the lending activity and securities holding of banks
with access to less costly funding sources, such as non-deposit borrowings from the money-
market or the interbank lending market.
With the changing business model of banks from ‘‘originate and hold’’ to ‘‘originate,
repackage, and sell’’, researchers are beginning to take an interest in how securitization, asset
sales, and OBS derivatives affect the transmission of shocks in monetary policy through banks’
balance sheet adjustments, particularly through their capital and lending channels. The
literature so far focus mainly on regulatory and economic constraints on banks’ risk taking,
and discuss shock transmission mechanisms through traditional capital and lending activities,
such as adjustments to capital, deposits, and lending positions. However, little attention has
been given to the transmission of exogenous shocks through banks’ trading activities, with

108
the analysis limited exclusively to the aggregate level (Keister and McAndrews, 2009; Mora
and Logan, 2012). Our study aims to fill this gap.
Since banks’ trading activities now play an important role in both banks’ revenue and
risk management, we propose that the “originate, repackage, and sell” business model may
have changed the way banks absorb exogenous shocks. In particular, we argue that banks
respond to an exogenous shock in two possible ways. First, banks are better able to shield
their lending and capital from monetary tightening as they have the ability to draw down cash
by selling their highly liquid securities holdings in financial markets. Second, easy access to
short-term borrowing from either the money market or interbank lending market provides
banks with easier access to non-deposit funds to sustain their lending activities.
Therefore, we propose the existence of a trading channel, alongside the capital and
lending channels, and predict that banks’ trading activities have weakened the effectiveness
of monetary policy shock transmission through the capital and lending channels. In response
to an exogenous monetary shock, banks increase or sustain their lending, securitization, and
asset sales activities so as to maintain their profitability. At the same time, banks also increase
or preserve their securities holdings and off-balance sheet derivatives trading activities in
order to maintain their regulatory capital ratio and risk-taking profile. In contrast, if banks’
trading activities have not weakened the effectiveness of monetary policy shocks, banks
should reduce their lending and increase capital strength in response to monetary policy
shocks.
109
Banks exposure to trading assets and activities may benefit banks in several ways. Take
securitization or asset sales as an example. These activities not only increase banks’ non-
interest income but also allow banks to maintain a capital buffer without increasing their cash
reserves. The availability of external non-deposit funding sources, such as from the money-
market and interbank lending market, which provide a relatively cheap source of short-term
funding, allows banks to expand their lending activities through securitization and asset sales.
Another benefit is that these trading activities reduce the maturity mismatch between
deposits and deposit-funded lending activities, and lessen the information asymmetry
between depositors and lenders, while permitting an immediate realization of non-interest
income. Surely, banks’ lending activities no longer depend solely on the availability of deposits
and reserves. Hence, banks may be able to absorb exogenous shocks through a reallocation
of assets and income sources in order to maximize profitability while maintaining their
regulatory capital ratio and risk-taking profile. In sum, we predict that a trading channel co-
exists with the capital and lending channels, and that the trading channel plays a significant
role in the transmission of exogenous shocks through balance sheet adjustments.
Our study utilizes a balanced panel dataset of 580 U.S. banks with quarterly data for the
period 2003Q1 through 2012Q4. We employ a panel vector autoregression (PVAR) framework.
In support of our first aim, we find evidence that a trading channel coexists besides the capital
and lending channels in exogenous shock transmissions. In support of our second aim, we find
exogenous shocks are absorbed more rapidly through banks’ traditional capital and lending
channels than through the trading channel. Furthermore, banks adjust their capital and
110
lending positions before their trading positions in response to an exogenous shock. This
finding leads us to conclude that contrary to our expectations, the transmission of monetary
policy shocks through the capital and lending channels is unaffected by banks’ trading
activities. This finding holds despite asset sales, securitization, and derivative trading
providing an ever-growing income source for banks.
Consistent with other studies (Altunbas et al., 2010), our results vary with the level of
reserves held by banks. Banks with smaller reserves adjust their balance sheet through the
capital and lending channels noticeably faster and by a proportionately larger amount than
banks with larger reserves. The reverse holds for balance sheet adjustments through the
trading channel, i.e., banks with higher reserves adjust their balance sheet through the trading
channel noticeably faster and by a proportionately larger amount than banks with smaller
reserves. These findings support our argument that well capitalized banks can better shield
their capital and lending positions from monetary policy shocks, and thus provide a greater
opportunity to engage in trading activities with minimum funding stress. Our results imply
that when big banks engage in trading, they use their spare capital for profitability expansion
which procyclically increases their trading and non-interest income. On the other hand, small
banks focus mainly on traditional capital and lending activities.
This final essay has three key contributions to the literature. First, we show that trading
channel coexists besides the capital and lending channels in exogenous shock transmission.
Second, of regulatory key concern that banks’ trading activities have weakened effectiveness
of monetary policy shocks on banks’ capital and lending adjustments, we provide the
111
evidence that capital and lending channels still play a central role in exogenous shock
transmission. We find no evidence that banks involvement in trading activities has changed
the transmission of exogenous shocks through capital and lending channels. However, we
show that banks prioritize their balance-sheet adjustments first through traditional capital
and lending activities and then through the trading activities. This finding is our last
contribution, i.e., we show that capital and lending channels and trading channel differ in their
response to exogenous shock transmission, thus providing an insight into their relative
importance in the transmission of exogenous shocks. From a policy perspective, our findings
suggest that trading activities have added a new dimension to banks’ balance-sheet
adjustments without changing the role of the credit and lending channels in absorbing
monetary policy shocks. In addition, we show that banks behavior in response to exogenous
and endogenous shocks varies with their reserve levels. From monetary policy prospective it
is important to understand that large and well capitalized banks respond differently than
small and less capitalized banks in response to monetary policy shocks. Specifically, during the
stress periods when financial crisis happens, like the recent GFC, small and less capitalized
banks suffer most and affect the economy severely.
The rest of this essay is organized as follows. The next section presents the sample data
and research method, followed by empirical results in Section 4.3. Section 4.4 summarizes and
concludes this study.
4.2. DATA AND RESEARCH METHOD

112
Our study covers the period between 2003Q1 and 2012Q4 (40-quarters). Our focus is on U.S.
commercial banks which are insured and supervised by Federal Deposit Insurance Corporation
(FDIC) and Office of the Comptroller of the Currency (OCC). Banks that are major34 subsidiaries
of a domestic bank holding company or a foreign bank are excluded from our sample. After
removing all acquired banks and bank-quarters with missing financial data, we obtain a final
balanced panel sample of 23,200 financial quarters for 580 U.S. banks. We collect quarterly
financial data from Federal Financial Institutions Examination Council's (FFIEC) Call Reports
and The Uniform Bank Performance Report (UBPR) through the Central Data Repository
(CDR). Data on interest rates are sourced from the Federal Reserve Board data repository
(http://www.federalreserve.gov/).
To test our research aims, we employ a Panel Vector Autoregression (PVAR) model,
similar to that used in Georgiadis (2012a, 2012b), to estimate coefficients and corresponding
impulse response functions:35
𝑌𝑖𝑡 = ∑ 𝑓𝑖,𝑙(𝑍𝑖,𝑡−𝑙−1) ∙ 𝑌𝑖,𝑡−𝑙
𝑝
𝑙=1
+ ∑ 𝛼𝑙 ∙ 𝑋𝑖,𝑡−𝑙
𝑞
𝑙=0
+ 𝜀𝑖,𝑡 𝜀𝑖𝑡 ~ 𝐷(0, ∑ ) 𝜀
(1)
with cross-sections 𝑖 = 1, 2, … , 𝑁 and time series observations 𝑡 = −𝑝 + 1, −𝑝 +
2, … , 0, 1, 2, … , 𝑇. In the tests, the endogenous variables (𝑌) and the structural conditioning
34 We define a major subsidiary as having at least 50 percent of outstanding shares owned by a domestic bank holding company or a foreign bank. 35 We are grateful to Georgiadis (2012a, 2012b) for providing the base routine package. For robustness, we also perform our tests using the PVAR model of Love and Zicchino (2006) and find similar results.
113
variables (𝑍) are used with one lag. The exogenous variables (𝑋) have a specification of up to
five lags (quarters)36, which we judge to be sufficient time to disseminate shocks through
banks’ balance sheet adjustments. Our endogenous variables consist of proxies for banks
traditional capital and lending activities, and trading activities. Both sets of test variables are
stated in terms of growth, i.e., quarterly change in banks exposure as a percentage of total
assets.
To broadly cover banks traditional capital and lending activities, we include: (i) equity
capital (Equity)37; (ii) short-term deposits (STDeposits); (iii) long-term deposits (LTDeposits);
and (iv) total loans (Loans). Equity includes perpetual preferred and common stocks, related
surplus, retained profits, capital reserves, and cumulative foreign currency translation
adjustments net of unrealized losses on marketable equity securities. Earlier studies
(Bernanke and Lown, 1991; Peek and Rosengren, 1995; Calomiris and Mason, 2001; Lown and
Morgan, 2006) find that in response to exogenous shocks, banks more aggressively maintain
their capital structure rather than adjust their holdings of loans. This finding may be due to
the direct link between banks’ capital and regulatory risk taking constraints, and the fact that
equities are traded in highly liquid markets; the latter makes it easier for banks to adjust their
trading exposures.
36 Selecting the number of lags smaller than the correct ones may distort the size of the tests, while selecting orders larger than the correct ones likely to result in a significant loss of test power. Hence, following the Burnham and Anderson (2004) this study uses Akaike Information Criterion (AIC) for optimal lags selection. 37 In real sense banks equity capital is an exogenous variable compared to endogenous variables such as deposit or loans because banks equity capital is subjected to several regulatory restrictions and, hence, its level is not completely endogenously determined by banks. However, for the simplicity and as it is more close to banks traditional activities, the equity capital (Equity) in this essay is referred as endogenous variable.

114
As funding type and duration play an important role in banks’ balance sheet
adjustments, we categorize deposits as short-term (STDeposits) and long-term (LTDeposits).
Short-term deposits with maturity of up to 90 days include checking account deposits, current
account deposits, time certificates of deposits, time deposits, and open account deposits
(excluding time certificates of deposits, deposits accumulated for payment of personal loans,
and money market deposit accounts (MMDAs)). In contrast, long-term deposits with maturity
above 90 days represent bank deposits, which include transactional account deposits, non-
transactional accounts (including MMDAs), non-transactional savings deposits, interest or
noninterest bearing deposits, and time deposits.38
Loans is total loans, including real estate loans. A number of studies, starting from
Bernanke (1983), argue that shocks to banks’ capital affect their non-capital liabilities and
loans. Empirical studies show a bank’s capital crunch can lead to a significant drop in lending,
which harms overall economic output (Bernanke, 1983; Hancock et al., 1995; Mora and Logan,
2012). Another argument for the impact of banks’ capital on lending is that the supply of credit
is co-determined with the demand for bank loans. If the economic condition is weak or if there
are negative expectations about the economy, there will be less demand for loans (Mora and
Logan, 2012).
38 Bank deposits and borrowings are the main sources of assets funding and uniquely perform an important role
in creating liquidity for lenders, borrowers, and traders. During severe funding restrictions, banks may be forced
to liquidate their investments and securities holding at a loss, and reduce lending so as to maintain their capital
ratio; otherwise they may face bankruptcy. As an important alternative source of liquidity and assets funding,
banks rely upon external funding sources such as short-term borrowings from interbank or money-market other
than deposits, and internal funding through liquidating security holding and reserves.
115
To broadly cover banks’ trading activities, we include: (i) securities trading (Security); (ii)
securitization and asset sales (ASale); and (iii) OBS derivatives (OBS). Security includes banks’
securities holding and investment in liquid assets, which comprise the fair value of available
for sale securities, structured notes, Fed funds sold and securities purchased, U.S. treasury
and agency securities, and investment in other types of government securities. ASale includes
asset securitization, asset-backed commercial papers, subordinated securities and other
enhancements, along with commercial and similar letters of credit. We argue that when there
is surplus capital (in excess of the minimum regulatory capital), banks will apply their surplus
to create saleable securities before trading them in the primary or secondary market to earn
income. These saleable securities, including assets-backed conduits, asset securitization, as
well as subordinated loans and debt, require less capital. Since most of these saleable
securities are fully or partially moved to off the balance sheet, they help banks to maintain
their regulatory capital ratios and risk-taking profile. The alternative is investing the surplus
capital in securities, such as Treasury securities or bonds. However, this is a costly alternative
due to the lower rate of return and long-term commitment. Hence, we expect a positive shock
to banks’ capital and deposits leads to an increase in banks’ lending and asset sales activity. In
contrast, we expect a decrease (or no effect) in banks securities holding to increase cash
reserves. However, when banks suffer from a capital deficit or a negative shock to their capital
or reserves, we expect to see a drop (or no effect) in their securities holding and asset sales
activities, as well as a decrease in lending so as to maintain their regulatory capital. An increase

116
in asset sales indicates that banks are funding their lending portfolio and creating asset sales
exposures through non-deposit funding.
Lastly, OBS derivatives exposure include options, futures, forwards, and swap
exposures, which comprise derivatives held for trading and other purposes, as well as
exchange- and OTC-traded derivatives. Derivatives can be any or a combination of interest
rate, foreign exchange rate, equity, commodities, and others.
Diamond (1984) develops a theory of financial intermediation, which demonstrates how
derivative contracts can serve as a third form of contracting, thus enabling banks to reduce
their loan portfolio exposure to systematic risk. The use of derivatives contracts to hedge
systematic risk enables banks to obtain further reductions in delegation costs, which in turn
allows banks to intermediate more effectively. Empirically, several studies find a downward
trend in lending activity and a concurrent increase in the use of interest-rate derivatives over
time, suggesting that derivatives usage may substitute lending activity (Brewer et al., 2000,
2001). This suggests that banks’ derivatives activities are motivated by income generation
rather than hedging. However, other studies find a direct relationship between derivatives
usage by U.S. banks and their loan portfolio growth (Purnanandam, 2004; Zhao and Moser,
2005). We argue that if the intention behind derivative exposure is for risk-sharing or hedging,
then such exposure should increase banks’ OBS derivatives exposure in response to a positive
shock in banks’ capital, deposits, and loans. However, if their intention is to generate income
from trading, then the reverse should hold. For example, if banks face capital constraints and

117
its lending portfolio is decreasing, banks will increase their OBS derivatives exposure to
maintain their income.
Our second set of variables comprises various proxies for exogenous monetary policy
shocks. We proxy a monetary policy shock by the change in the spread between the Federal
funds and 90-day Treasury bill rate (FFSpread). Bernanke and Mihov (1998) find that the Fed
implements policy changes, reserve levels, and fund availability through changes in the
federal fund rate. During stress periods, when external funding is costly, banks are
constrained to meet Fed reserve demand in the short run by reducing their (non-borrowed)
capital reserves. This in turn reduces their ability to borrow from the discount window in the
primary market as well as funding from deposits. Alternatively, banks may choose to liquidate
their investments or securities holding in the primary and/or secondary market to fulfill the
reserve demand. If banks are not able to readily substitute deposits with other sources of
funds, changes in the federal fund rate, which affect the opportunity cost of issuing deposits,
would ultimately influence the price and supply of bank loans, the level of securities holding,
asset sales, and investment decisions.
Hence, we argue that changes to the Fed interest rate are an important source of
exogenous shock to banks’ reserves, lending, and short term borrowings. A fall in Fed interest
rates is expected to increase surplus reserves held at the central bank and the availability of
funds in banks’ Federal Reserve account to lend to other banks in need of funds. If banks have
access to this cheaper funding source, they will utilize it to expand their lending and asset

118
sales activities. Thus, a negative (positive) shock in the Fed interest rate is expected to
increase (decrease) lending and asset sales activities of banks in subsequent quarters.
Following Hancock et al. (1995) and Park et al. (2013), we proxy an interbank originated
shock by the spread between the certificate of deposits (CD) and 90-day Treasury bill rate
(CDSpread). The wholesale lending market originated shock is proxied by the spread between
non-financial commercial paper (NFCP) and 90-day Treasury bills rate (NFCPSpread). We justify
the use of these proxies as sources of exogenous shocks for the following reasons. Bank
liquidation is a primary concern to depositors. The CD spread is thus a good proxy for a bank-
originated shock and the heightened intensity of a systematic bank run as it captures the
reluctance of depositors to leave their money with banks. The CD spread is the equilibrium
price at which funds are offered to banks and it reflects the degree of creditworthiness of the
banking sector. An unexpected increase in the CD spread increases the probability of a run on
deposits and thus the risk of bank insolvency. To meet liquidity demands, we expect to see a
reduction in loan issues, securities holding, and asset sales which are possibly sold at fire sale
prices.
We proxy wholesale lending market interest rate by the NFCP rate since changes in the
NFCP spread reflect changes in the availability of funds, market liquidity, and corporate
default risk (Park et al., 2013). This is consistent with the drying-up of the commercial paper
market, a common observation during the banking crisis. An increase in NFCP indicates
funding or borrowing shortage and an increased likelihood of corporate default. Hence, a
contraction in the NFCP spread is expected to lead to a drop in loans, securities holding, and

119
asset sales activities. However, a drop in bank income due to lending and asset sales
contraction may lead banks to increase OBS derivatives activities in order to maintain their
profitability.
The structural conditioning variable (Z) is the quarterly level of total reserves expressed
as a percentage of total assets (Reserve), a widely used measure of bank liquidity and risk-
taking profile (Keister and McAndrews, 2009).39 Since banks’ financial structure and
operational mechanisms differ significantly across banks with different levels of reserves, the
response pattern of test variables to exogenous and endogenous shocks should also differ
cross-sectionally and over the time (Mora and Logan, 2012). Hence, capturing and showing
the shock-response sensitivity due to differences in the level of reserves may significantly
affect the effectiveness of policy implications drawn from our PVAR model.
Descriptive statistics are reported in Table 4.1. Panel A shows the funding model of
banks is strongly oriented towards short-term borrowings as a funding alternative, with long-
and short-term liabilities making up 96 and 85 percent respectively of total assets. Loans are
at 67 percent of total assets, with equity capital at 11 percent. Of the trading activities, OBS
derivatives make up 69 percent of total assets, followed by securities holding at 49 percent
and asset sales at 44 percent. The statistics for both loans and asset sales show that on
average banks write 22 percent (roughly the difference between total loans and asset sales)
of loans with no intention for collateralized selling or securitization.
39 For robustness we used banks risk-weighted assets as an alternative of banks’ reserve level. Our findings are consistent with risk-weighted assets as an alternative structural conditioning variable in PVAR.

120
TABLE 4.1 Descriptive Statistics (2003Q1 to 2012Q4)
MeanStandard
DeviationMin. Max.
Mean %
of AssetsMean
Standard
DeviationSkewness
Panel A: Endogenous growth variables
Total assets (Assets) 388 1118 21 22604 - 1.33 4.46 13.87
Total equity capital (Equity) 42 124 2 1926 11% 1.57 5.78 14.31
Total short-term deposits (STDeposits) 329 962 16 18404 85% 1.49 13.89 2.94
Total long-term deposits (LTDeposits) 374 751 29 20344 96% 1.15 5.10 10.27
Total loans (Loans) 259 764 9 13164 67% 1.13 4.62 12.68
Total security (Security) 192 560 1 15636 49% 2.30 15.98 3.92
Total assets selling (ASale) 173 1299 0 33606 44% 18.66 331.64 79.80
Total OBS derivatives exposure (OBS) 268 793 13 14874 69% 3.98 69.46 122.95
Panel B: Structural conditioning variables
Total reserves (Reserves) 85 247 2 5137 22% 24.22 10.34 0.51
Panel C: Exogenous shock variables
Federal funds interest rate 1.79 1.81 0.07 5.26 - 0.20 0.34 2.09
Non-financial commercial papers interest rate 1.82 1.78 0.14 5.29 - 0.18 0.73 -4.19
Certificates of deposits interest rate 3.15 1.85 1.11 6.82 - 0.52 0.56 2.02
90-days Treasury-bills interest rate 1.64 1.70 0.01 5.08 - - - -
Rates in percentage (%)
Absolute figures (million US$)
Absolute figures (million US$)
Quarterly change as a percentage of total assets (%)
As a percentage of total assets (%)
Spread with Treasury-bills rate (%)
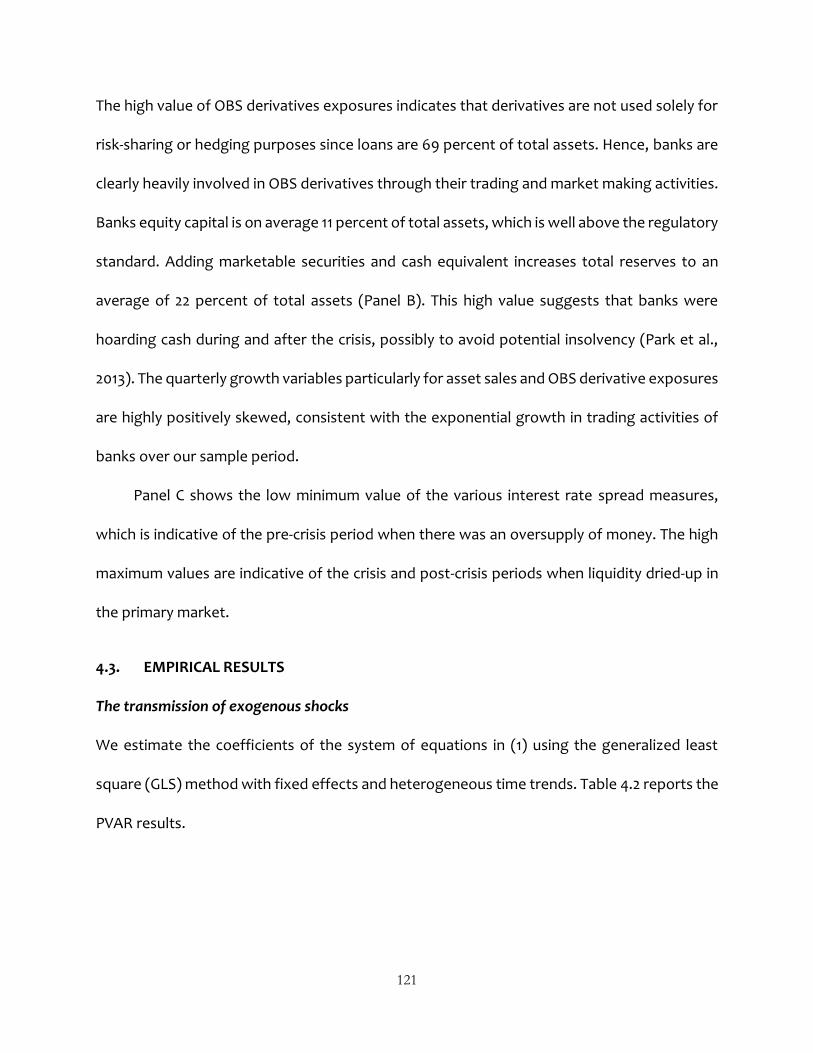
121
The high value of OBS derivatives exposures indicates that derivatives are not used solely for
risk-sharing or hedging purposes since loans are 69 percent of total assets. Hence, banks are
clearly heavily involved in OBS derivatives through their trading and market making activities.
Banks equity capital is on average 11 percent of total assets, which is well above the regulatory
standard. Adding marketable securities and cash equivalent increases total reserves to an
average of 22 percent of total assets (Panel B). This high value suggests that banks were
hoarding cash during and after the crisis, possibly to avoid potential insolvency (Park et al.,
2013). The quarterly growth variables particularly for asset sales and OBS derivative exposures
are highly positively skewed, consistent with the exponential growth in trading activities of
banks over our sample period.
Panel C shows the low minimum value of the various interest rate spread measures,
which is indicative of the pre-crisis period when there was an oversupply of money. The high
maximum values are indicative of the crisis and post-crisis periods when liquidity dried-up in
the primary market.
4.3. EMPIRICAL RESULTS
The transmission of exogenous shocks
We estimate the coefficients of the system of equations in (1) using the generalized least
square (GLS) method with fixed effects and heterogeneous time trends. Table 4.2 reports the
PVAR results.
122
TABLE 4.2 PVAR Results for Exogenous Shocks
This table reports PVAR regression coefficients with t-statistics in square brackets. The exogenous variables with a 1-standard deviation shock are: (i) bank-originated shock proxy by certificates of deposit rate spread (CDSpread); (ii) market-originated shock proxy by non-financial commercial paper spread (NFCPSpread); and (iii) monetary-originated shock proxy by federal fund rate spread (FFSpread). Analysis is based on balanced panel data with 23,200 observations for 580 banks during 2003Q1-2012Q4. The PVAR models are estimated by GLS method with fixed effects and heterogeneous time trends. ***, **, * indicates significance at 1%, 5%, and 10% level respectively.
Endogenous growth variables
CDSpread(t-1) -0.25 *** 0.01 * 2.7E-04 -1.9E-06 ** -0.46 *** -1.5E-03 *** 8.9E-06
[-2.77] [1.74] [1.18] [-1.98] [-10.88] [-2.29] [0.09]
NFCPSpread(t-1) -0.10 ** 0.01 9.6E-05 ** -6.6E-07 *** -0.06 ** -5.6E-03 * 7.4E-05 **
[-2.42] [0.08] [2.06] [-2.30] [-2.18] [-1.72] [2.25]
FFSpread(t-1) -0.03 ** 0.01 *** -1.3E-04 -8.0E-07 *** -0.01 * -1.5E-03 ** 2.6E-05 **
[-2.03] [3.26] [-1.22] [-2.96] [-1.91] [-2.11] [2.03]
∆Equity(t) ∆STDeposits(t) ∆LTDeposits(t)
Exo
gen
ou
s va
riab
les
Capital or Lending channel (growth) Trading channel (growth)
∆Loans(t) ∆Security(t) ∆ASale(t) ∆OBS(t)

123
Consistent with earlier findings (Bernanke and Lown, 1991; Hancock and Wilcox, 1993-
95; Hancock et al., 1995), the result show that lagged positive exogenous shocks in the
interest rate spread bear a negative and statistically significant relationship with growth in
banks’ equity and loans. Deposits generally have a positive relationship with lagged shocks in
interest rate spread, although the statistical significance is mixed. The coefficient on
∆STDeposits is positive and significant for lagged CDSpread and FFSpread. Since short-term
interbank borrowing is an important funding source for banks, the results affirm that changes
in interbank lending rates bring about a significant change in short-term funding level. That is,
an increase in FFSpread encourages banks to borrow from other sources, such as money-
market, rather than tapping into interbank borrowings.40 In contrast, the coefficient on
∆LTDeposits is positive and significant for lagged NFCPSpread.
This indicates that when there is a rise in money-market interest rates, banks tend to
substitute their short-term interbank borrowings by increasing term deposits and/or long-
term borrowings such as subordinated debts and bonds. The PVAR results are consistent with
previous literature (Aysun and Hepp, 2011; and reference there in) and can be interpreted in
terms of the capital and lending channels theories. That is, to match a reduction in deposits
following monetary tightening, the assets side of banks’ balance sheet drops through, for
example, a reduction in loan issues, securities holdings, and reserves. Since lending is mostly
funded by short-term money-market and interbank borrowings, rather than through deposits,
our results show a similar response to contractions in the money market and interbank
40 In general, commercial paper interest rates are lower than banks interest rates (http://www.federalreserve.gov/releases/h15/data.htm).

124
borrowings, when there is an increase in interest rates. As expected, an increase in interest
rates results in a drop in banks’ asset side (loans and equity capital) in the following quarter.
In short, the unavailability of non-deposit funding source to support banks’ assets leads to a
reduction in asset funding, which in turn reduces banks’ lending activity so as to maintain their
capital-to-asset ratio (Bernanke and Lown, 1991; Hancock and Wilcox, 1993-95; and Hancock
et al., 1995). Hence, banks’ non-deposit funding sources have added to the capital and lending
channels and play an important role in exogenous shock transmission.
In support of our arguments, we find that the trading channel coexists with the capital
and lending channels in exogenous shock transmission. Table 4.2 shows that when banks
asset funding is restricted due to an increase in the cost of borrowing, in order to maintain
their capital and risk-taking profile, banks have no choice but to liquidate their securities
holdings (∆Security) and freeze originate-to-distribute (OTD)/originate-to-hold (OTH) type
asset sales activities (∆ASale). In contrast, there is an increase in growth in OBS trading (∆OBS)
activities, possibly to maintain banks’ income and risk-taking profile. These results hold for all
three types of exogenous shocks. The recent banking crisis is an example of a sharp rise in
short-term borrowing costs when the asset sales market frenzied with banks running fire
sales on their securities holding to avoid insolvency and a bank run. The increase in OBS
trading activities when bank income sources were squeezed implies that their heavy
involvement in OBS derivatives is motivated by income rather than hedging. This is obvious
because if the increased OBS derivatives exposure is for risk management, it requires assets
or risk exposures that need to be hedged with derivatives.

125
Since banks have already reduced lending, asset sales and securitization, an increase in
OBS activities clearly indicates that banks are not increasing their derivatives exposures for
hedging purposes. In fact, income from other activities is squeezed so banks use derivatives
for trading to maintain profitability.
Figures 4.1 and 4.2 show the impulse response of the dynamic adjustment of banks’
balance sheet items through traditional capital and lending activities, and trading activities,
respectively, to a one-standard deviation shock in interest rate spread. Among the three
exogenous shocks, the monetary policy transmission through federal interest rate changes
turns out to be the most effective in terms of affecting the banks’ balance sheet adjustments.
For example, Figure 4.1 (column 1) shows Equity adjustments is most responsive to a shock in
FFSpread, followed by a shock to NFCPSpread and CDSpread; a one-standard deviation shock
in FFSpread brings about a 0.04 unit decrease in the growth of Equity in the following quarter.
These findings are consistent with the observation that banks’ short-term borrowings rely
primarily on federal funds, followed by money-market funds and interbank lending. Figure 4.1
(column 4) shows similar results hold for banks’ lending adjustments.
Figure 4.1 (row 1, column 2) shows the impulse response of banks’ short-term deposits
(∆STDeposits) to shocks in interbank lending rates (CDSpread). Banks with lower reserves
tend to increase short-term borrowings more than banks with higher reserves in the quarters
following a shock in CDSpread. Figure 4.1 (row 2, column 2) shows similar findings hold for
shocks in money-market lending rates.

126
Figure 4.1: Impulse responses of growth in banks’ capital, deposits, and lending to a one-standard deviation shock in CD spread, NFCP spread and FF spread
127
Overall, these findings suggest that after a rise in the cost of interbank and money-market
funds, banks with lower reserves anticipate scarcity of funding and liquidity in the near future.
They thus respond by hoarding more reserves through increased short-term borrowings from
money-market and interbank lending market. We find the opposite holds for banks with
higher reserves, who are nearly unaffected by changes in short-term funding availability. The
recent financial crisis provides some evidence for this. Specifically, when the financial
meltdown started in 2008, the rise in the cost of borrowing and the fall in market liquidity led
weak banks to hoard more reserves in order to survive the turmoil. In contrast, strong banks
used the opportunity to earn more profit from fire sales of other banks and by providing costly
lending to banks in need of funds (Park et al., 2013).
Consistent with earlier research, we find that an exogenous shock to interest rate
spread depletes banks’ equity and slows their lending growth, while increasing their deposit
taking and non-deposit borrowing. These results hold independent of banks’ capital reserve
levels. We find an important difference across banks in their borrowing choices: banks with
smaller reserves react more quickly in accessing short-term funding sources, while banks with
larger reserves prefer long-term funding sources, including term-deposits and bonds (Figure
4.1, columns 2 and 3). These results generally hold irrespective of the origin of the exogenous
shock.
Consistent with earlier findings (Hancock et al., 1995; Gambacorta and Mistrulli, 2004;
and Gambacorta, 2005), we find significant cross-sectional differences in the response of
banks with different levels of reserves to exogenous shocks. For example, in response to
monetary policy shocks, banks with small reserves adjust their balance sheet through the
128
capital and lending channels noticeably faster and proportionately by a larger amount than
banks with larger reserves (Figure 4.1). These findings support our argument that well-
capitalized banks can better shield their capital and lending positions from monetary policy
shocks due to their easier access to non-deposit funding. The impulse response graphs in
Figure 4.2 also show that banks with larger reserves adjust their balance sheet through the
trading channel noticeably faster and proportionately by a larger amount than banks with less
reserve. This supports our argument that banks that are well-capitalized and have higher
reserve holdings have greater opportunity to engage in trading activities with minimum
funding stress. The finding provides evidence for Boot and Ratnovski’s (2012) assertion that
when big banks engage in trading, they use their spare capital for profitability expansion
which is procyclical to their trading and non-interest income. Small banks focus almost entirely
on the traditional capital and lending activities and are more affected by monetary policy.
Figure 4.2 shows that the dynamics of banks’ securities holding in response to
exogenous shocks vary with the level of reserves. In particular, banks with larger reserves
liquidate their securities holding to a greater extent in response to exogenous shocks. The
opposite is observed for banks with smaller reserves, which increase their securities holding
in response to exogenous shocks. Banks’ securities holdings are the most responsive to
monetary policy shocks, and the least responsive to market-originated shocks. This result is
consistent with the arguments of Park et al. (2013) that non-deposit funding sources play a
prominent role in banks’ asset funding and liquidity.
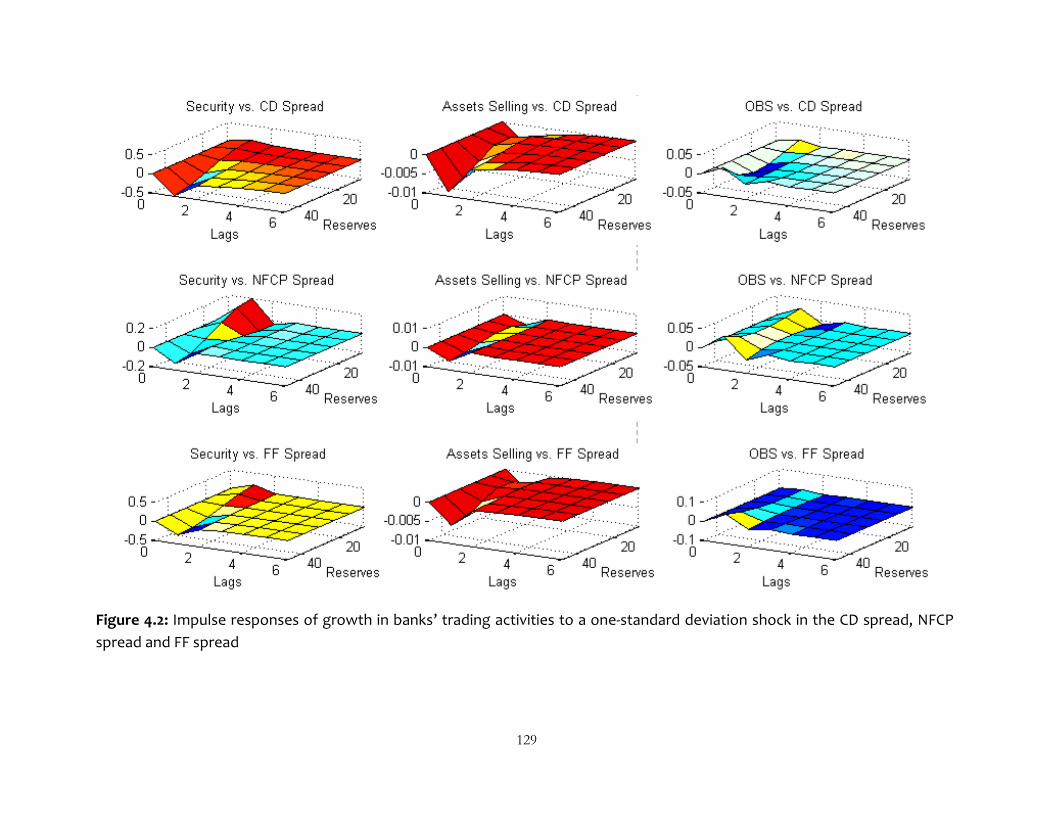
129
Figure 4.2: Impulse responses of growth in banks’ trading activities to a one-standard deviation shock in the CD spread, NFCP
spread and FF spread

130
The impulse response functions also show a decrease in banks’ involvement in OTD/OTH
and asset sales activities, and an increase in their involvement in OBS activities in response to
exogenous shocks. Hence, when funding is restricted, banks’ income decreases due to a fall
in OTD/OTH and asset sales activities. To maintain income, banks increase their OBS trading
activities.
The transmission of endogenous shocks
Table 4.3 shows the results for the balance sheet adjustments in response to endogenous
shocks. In response to shocks in capital (Equity), growth in banks’ securities holdings
(∆Security) and OBS derivative (∆OBS) activities slows down, but growth in asset sales
(∆ASale) and OTD/OTH activities accelerates in the next quarter. These results indicate that a
decrease in banks’ securities holdings (∆Security) makes more funding available which can
potentially be used to supplement lending to facilitate asset sales (∆ASale) in the following
quarter.
We find similar results in response to a shock in banks’ lending activity. That is, a positive
shock to the lending portfolio increases banks’ asset sales (∆ASale) activity. However, it
decreases securities (∆Security) holding and OBS derivative (∆OBS) activities in the following
quarter. These findings suggest that when their lending portfolios grow, banks get more
involved in asset sales and securitization. The result also indicates that banks utilize internally
generated funds by liquidating their securities holdings to increase their asset sales and
securitization exposure. In addition, to maintain their risk-taking profile, banks decrease OBS
derivatives exposure in the following quarter.
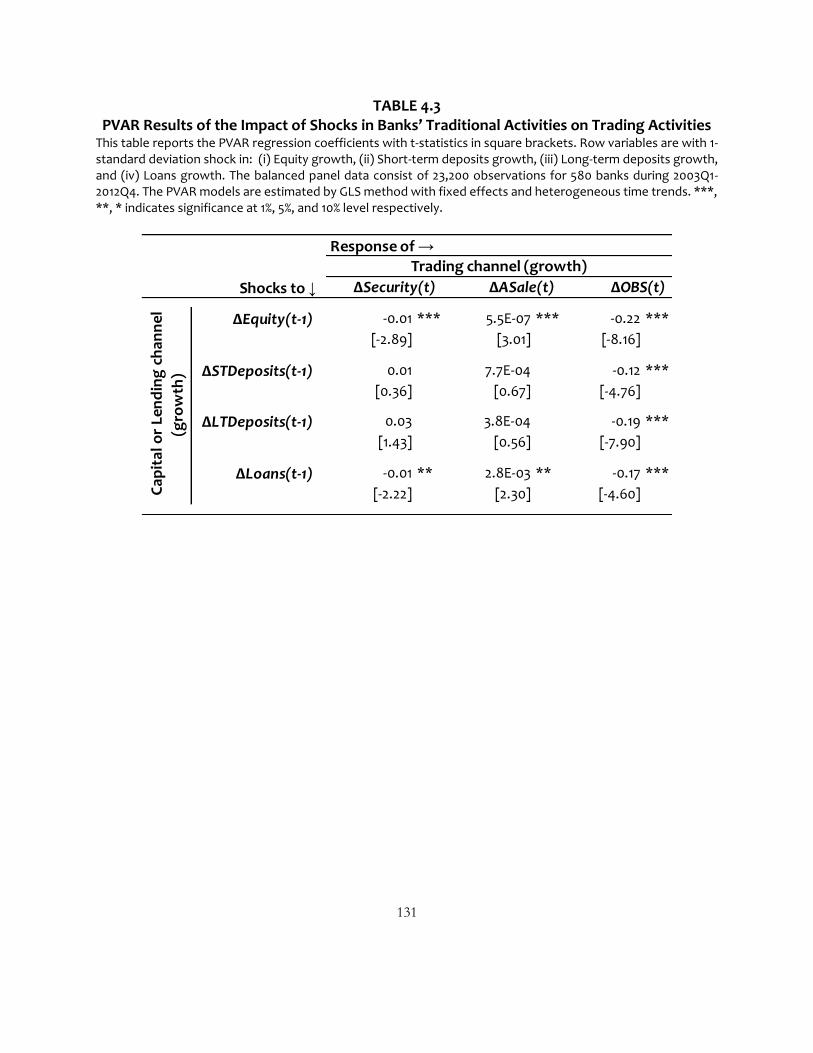
131
TABLE 4.3 PVAR Results of the Impact of Shocks in Banks’ Traditional Activities on Trading Activities
This table reports the PVAR regression coefficients with t-statistics in square brackets. Row variables are with 1-standard deviation shock in: (i) Equity growth, (ii) Short-term deposits growth, (iii) Long-term deposits growth, and (iv) Loans growth. The balanced panel data consist of 23,200 observations for 580 banks during 2003Q1-2012Q4. The PVAR models are estimated by GLS method with fixed effects and heterogeneous time trends. ***, **, * indicates significance at 1%, 5%, and 10% level respectively.
Response of →
∆Equity(t-1) -0.01 *** 5.5E-07 *** -0.22 ***
[-2.89] [3.01] [-8.16]
∆STDeposits(t-1) 0.01 7.7E-04 -0.12 ***
[0.36] [0.67] [-4.76]
∆LTDeposits(t-1) 0.03 3.8E-04 -0.19 ***
[1.43] [0.56] [-7.90]
∆Loans(t-1) -0.01 ** 2.8E-03 ** -0.17 ***
[-2.22] [2.30] [-4.60]
Shocks to ↓
Trading channel (growth)
∆Security(t) ∆ASale(t) ∆OBS(t)
Cap
ital
or
Len
din
g c
han
nel
(gro
wth
)
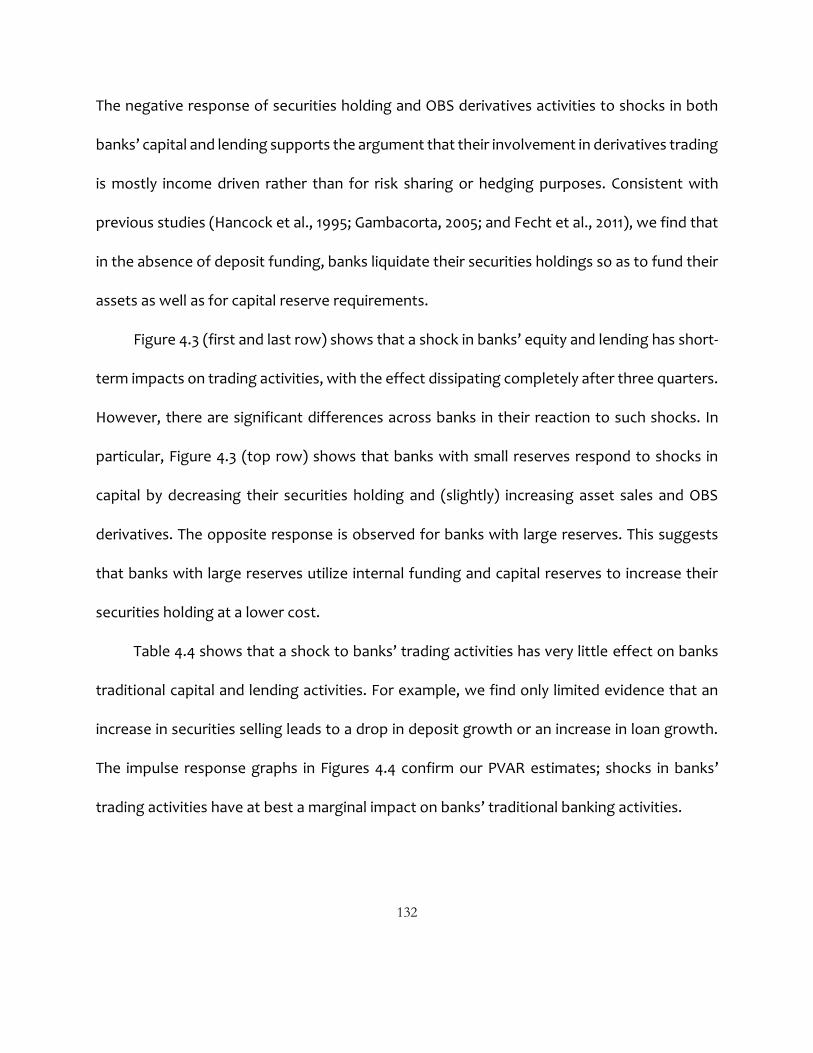
132
The negative response of securities holding and OBS derivatives activities to shocks in both
banks’ capital and lending supports the argument that their involvement in derivatives trading
is mostly income driven rather than for risk sharing or hedging purposes. Consistent with
previous studies (Hancock et al., 1995; Gambacorta, 2005; and Fecht et al., 2011), we find that
in the absence of deposit funding, banks liquidate their securities holdings so as to fund their
assets as well as for capital reserve requirements.
Figure 4.3 (first and last row) shows that a shock in banks’ equity and lending has short-
term impacts on trading activities, with the effect dissipating completely after three quarters.
However, there are significant differences across banks in their reaction to such shocks. In
particular, Figure 4.3 (top row) shows that banks with small reserves respond to shocks in
capital by decreasing their securities holding and (slightly) increasing asset sales and OBS
derivatives. The opposite response is observed for banks with large reserves. This suggests
that banks with large reserves utilize internal funding and capital reserves to increase their
securities holding at a lower cost.
Table 4.4 shows that a shock to banks’ trading activities has very little effect on banks
traditional capital and lending activities. For example, we find only limited evidence that an
increase in securities selling leads to a drop in deposit growth or an increase in loan growth.
The impulse response graphs in Figures 4.4 confirm our PVAR estimates; shocks in banks’
trading activities have at best a marginal impact on banks’ traditional banking activities.

133
Figure 4.3: Impulse response of growth in banks’ trading activities to a one-standard deviation shock in the growth of banks’
capital, deposits, and lending

134
TABLE 4.4 PVAR Results of Shocks in Banks’ Trading Activities on Traditional Activities
This table reports thePVAR regression coefficients with t-statistics in square brackets. Growth in the trading channel is measured by a 1-standard deviation shock in: (i) Securities growth, (ii) Asset sales growth, and (iii) OBS growth. Data for PVAR is balanced panel data with 23,200 observations for 580 banks during 2003Q1-2012Q4. The PVAR models are estimated by GLS method with fixed effects and heterogeneous time trends. ***, **, * indicates significance at 1%, 5%, and 10% level respectively.
Response of →
∆Security(t-1) 1.38 0.21 * -4.5E-03 * 3.0E-05 **
[1.30] [1.66] [-1.94] [2.27]
∆ASale(t-1) 0.00 0.04 -2.0E-02 3.3E-04
[0.35] [0.31] [-1.45] [1.30]
∆OBS(t-1) 0.22 -0.03 -5.0E-04 2.9E-06
[0.53] [-0.53] [-0.54] [0.56]
Shocks to ↓
Capital or Lending channel (growth)
∆Equity(t) ∆STDeposits(t) ∆LTDeposits(t) ∆Loans(t)
Trad
ing
ch
ann
el
(gro
wth
)
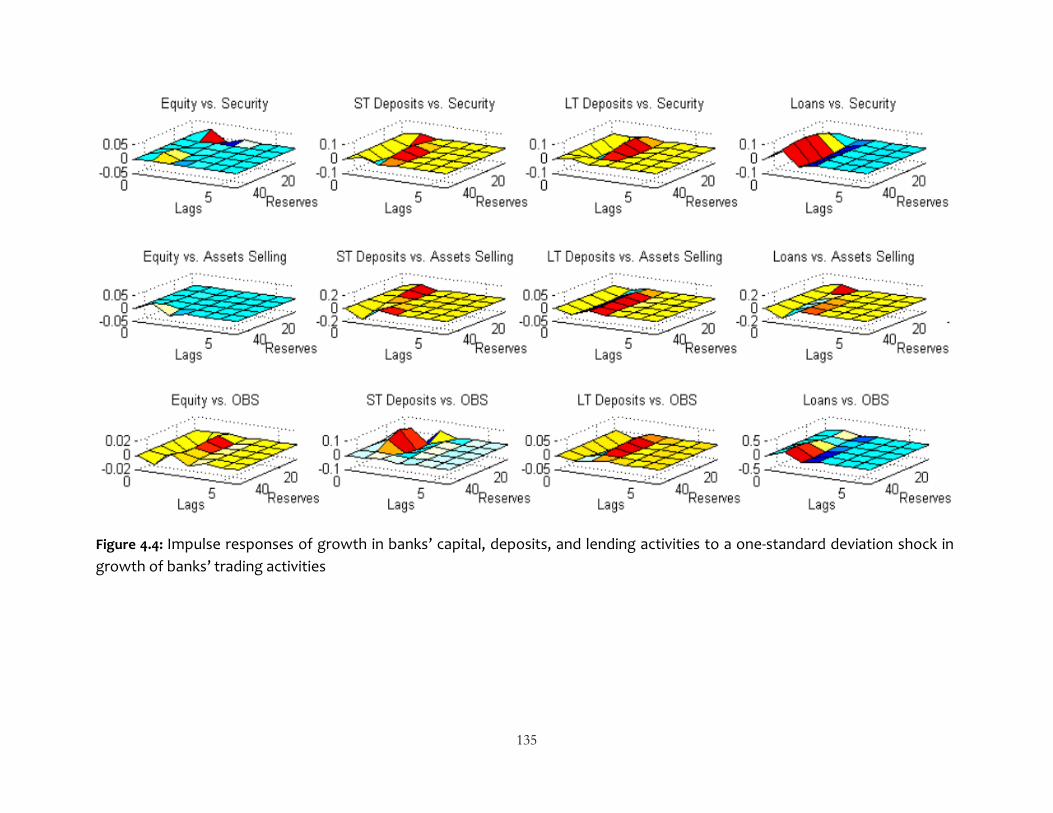
135
Figure 4.4: Impulse responses of growth in banks’ capital, deposits, and lending activities to a one-standard deviation shock in
growth of banks’ trading activities

136
4.4. CONCLUSION
Using a large balanced panel dataset of 580 U.S. banks of quarterly data for the period 2003Q1
to 2012Q4, we examine how banks manage their trading assets when they experience
exogenous shocks, such as monetary tightening. In particular, we examine the interaction
between banks’ traditional capital and lending activities, and trading activities. Using a PVAR
framework, our results can be interpreted in terms of the capital and lending channels
theories, which predicts that the assets side of a bank’s balance sheet drops (e.g., a reduction
in loan issues) to match a reduction in deposits following a monetary tightening. In particular,
we show that the unavailability of non-deposit borrowings leads to a reduction in assets
funding. In order to maintain their capital-to-asset ratio, this in turn reduces their lending
activity. The findings affirm that non-deposit funding sources have added to the dynamics of
the capital and lending channels and play an important role in exogenous shock transmission
through balance sheet adjustments.
Significantly, we establish that a trading channel coexists besides the capital and
lending channels in exogenous shock transmission. When banks’ asset funding is restricted
due to an increase in the borrowing cost, banks reduce their lending; liquidate their securities
holdings, and freeze asset sales and securitization in order to maintain their capital and risk-
taking profile. In contrast, when banks’ income sources are squeezed due to reduced lending,
asset sales, and securitization, the observed increase in OBS trading activities in the next
quarter is found to be motivated by income rather than hedging.
We find the response of banks’ traditional capital and lending activities to exogenous
shocks vary significantly across their reserve levels. Banks with larger reserves adjust their
137
balance sheet noticeably faster and by a proportionately larger amount through the capital
and lending channels than banks with lower reserves. This finding supports our argument
that well-capitalized banks with higher reserve holdings have greater opportunity to be
involved in trading activities with minimum funding stress. Further, in response to exogenous
shocks, banks with lower reserves tend to increase short-term borrowings more than banks
with higher reserves in the following quarters to fund their assets. This suggests that after a
rise in non-deposit borrowing costs, banks with lower reserves anticipate scarcity of funding
and liquidity in the near future and thus keep more reserves through borrowing from money-
market or interbank lending market. In contrast, as was observed during the GFC, banks with
larger reserves take advantage of other banks’ fire sales and earn more income by providing
costly lending to banks in need.
In contrast to Altunbas et al. (2010), we find no evidence that banks’ involvement in
trading activities has significantly changed the transmission of exogenous shocks through
the capital and lending channels. The findings on endogenous shock transmission show that
banks prioritize their balance sheet adjustments first through traditional activities and then
through trading activities. From a policy perspective, trading activities have added a new
dimension to banks balance sheet adjustments without changing the role of the credit and
lending channel in absorbing monetary policy shocks.
The simple approach taken in this essay could be used to further explore cross-sectional
differences in the dynamic response of banks’ balance sheet adjustments to exogenous and
endogenous shocks to various shadow banking activities.

138
REFERENCES
Affinito, M., and Tagliaferri, E. (2010). Why Do (or Did?) Banks Securitize Their Loans? Evidence
from Italy. Journal of Financial Stability 6, 189–202.
Altunbas, Y., Gambacorta, L., and Marques-Ibanez, D. (2009). Securitization and the Bank
Lending Channel. European Economic Review 53, 996–1009.
Altunbas, Y., Gambacorta, L., and Marques-Ibanez, D. (2010). Bank Risk and Monetary Policy.
Journal of Financial Stability 6, 121–129.
Aysun, U., and Hepp, R. (2011). Securitization and the Balance Sheet Channel of Monetary
Transmission. Journal of Banking and Finance 35, 2111–2122.
Bernanke, B. S. (1983). Non-Monetary Effects of the Financial Crisis in the Propagation of the
Great Depression. The American Economic Review 73(3), 257-276.
Bernanke, B. S., and Lown, C. S. (1991). The Credit Crunch. Brookings Papers on Economic
Activity 2, 205 -248.
Bernanke, B. S., and Mihov, L. (1998). Measuring Monetary Policy. The Quarterly Journal of
Economics 113(3), 869-902.
Boot, A.W.A., and Ratnovski, L. (2012). Banking and Trading. IMF Working Paper. Retrieved on
19 November 2013 from: www.imf.org/external/pubs/ft/wp/2012/wp12238.pdf.
Boyd, J. H., and Gertler, M. (1994). Are Banks Dead? or Are the Reports Greatly Exaggerated?.
Retrieved on 25 February 2013 from: http://www.nber.org/papers/w5045.pdf.
Brewer, E., Minton, B. A., and Moser, J. T. (2000). Interest-rate Derivatives and Bank Lending.
Journal of Banking and Finance 24 (3), 353-379.
Brewer, E., William, E. J., and Moser, J. T. (2001). The Value of Using Interest Rate Derivatives
to Manage Risk at U.S. Banking Organizations. Economic Perspectives, Federal Reserve
Bank of Chicago 3Q, 49-66.
Brunnermeier, M. K., and Oehmke, M. (2013), The Maturity Rat Race. The Journal of Finance
68, 483-521.
Burnham, K. P., and Anderson, D. R. (2004). Multimodel Inference: Understanding AIC and BIC
in Model Selection. Sociological Methods and Research 33, 261–304.
139
Calomiris, C. W., and Mason, J. R. (2001). Causes of U.S. Bank Distress during the Depression.
Proceedings, Federal Reserve Bank of Chicago, 530-554.
Diamond, D. W. (1984). Financial Intermediation and Delegated Monitoring. Review of
Economic Studies 51, 393–414.
Fecht, F., Nyborg, K. G., and Rocholl, J. (2011). The Price of Liquidity: The Effects of Market
Conditions and Bank Characteristics. Journal of Financial Economics 102, 344–362.
Gambacorta, L. (2005). Inside the Bank Lending Channel. European Economic Review 49,
1737–1759.
Gambacorta, L., and Marques-Ibanez, D. (2011). The Bank Lending Channel: Lessons from the
Crisis. Working paper. Retrieved on 30 January 2013 from:
http://www.bis.org/publ/work345.pdf.
Gambacorta, L., and Mistrulli, P. E. (2004). Does Bank Capital Affect Lending Behavior? Journal
of Financial Intermediation 13, 436–457.
Georgiadis, G. (2012a). The Panel Conditionally Homogenous Vector Autoregressive Model.
Retrieved on 30 January 2013 from: http://mpra.ub.uni-muenchen.de/37755/.
Georgiadis, G. (2012b). Towards an Explanation of Cross-Country Asymmetries in Monetary
Transmission. Discussion Papers 07/2012, Deutsche Bundesbank, Research Centre.
Golodniuk, I. (2006). Evidence on the Bank-Lending Channel in Ukraine. Research in
International Business and Finance 20, 180–199.
Gortona, G., and Metricka, A. (2012). Securitized Banking and the Run on Repo. Journal of
Financial Economics 104 (3), 425-451.
Hall, B. J. (1993), How Has the Basel Accord Affected Bank Portfolios? Journal of the Japanese
and International Economies 7(4), 408-440.
Hancock, D., and Wilcox, J. A. (1993). Was There a ‘Capital Crunch’ in Banking? The Effects on
Real Estate Lending of Business Conditions and Capital Shortfalls. Journal of Housing
Economics 13 (1), 75–105.
Hancock, D., and Wilcox, J. A. (1994a), Bank Capital and the Credit Crunch: The Roles of Risk-
Weighted and Unweighted Capital Regulations. Journal of the American Real Estate and
Urban Economics Association 22(1), 59-94.
140
Hancock, D., and Wilcox, J. A. (1994b). Bank Capital, Loan Delinquencies, and Real Estate
Lending. Journal of Housing Economics 3, 121–146.
Hancock, D., and Wilcox. J. A. (1995). Bank Balance Sheet Shocks: Are There Dynamic Effects
on Bank Capital and Lending? Journal of Banking and Finance 19, 661-677.
Hancock, D., Laing, A. J., and Wilcox, J. A. (1995). Bank Capital Shocks: Dynamic Effects on
Securities, Loans, and Capital. Journal of Banking and Finance 19(4), 661-677.
Keister, T., and McAndrews, J. (2009). Why Are Banks Holding So Many Excess Reserves?
Federal Reserve Bank of New York Staff Report no. 380. Retrieved on 10 January 2013
from: www.newyorkfed.org/research/staff_reports/sr380.pdf.
Love, I., and Zicchino, L. (2006). Financial Development and Dynamic Investment Behavior:
Evidence from Panel VAR. The Quarterly Review of Economics and Finance 46, 190–210.
Lown, C., and Morgan, D. P. (2006). The Credit Cycle and the Business Cycle: New Findings
Using the Loan Officer Opinion Survey. Journal of Money, Credit and Banking 38(6),
1575-1597.
Mora, N., and Logan, A. (2012). Shocks to Bank Capital: Evidence from UK Banks at Home and
Away. Applied Economics 44(9), 1103–1119.
Park, P., How, J., and Verhoeven, P. (2013). The Diminishing Role of Banks in the U.S. Money
Markets: Evidence from the GFC. Working paper Queensland University of Technology.
Peek, J., and Rosengren, E. (1995). The Capital Crunch: Neither a Borrower nor a Lender.
Journal of Money, Credit and Banking 27(3), 625-638.
Purnanandam, A. (2004). Interest Rate Risk Management at Commercial Banks. Working
paper, University of Michigan Business School.
Shrieves, R. E., and Dahl, D. (1992). The Relationship between Risk and Capital in Commercial
Banks. Journal of Banking and Finance 16, 439–457.
Zhao, F., and Moser, J. (2005). Bank Lending and Interest-rate Derivatives. Retrieved on 15
January 2013:
http://www1.american.edu/academic.depts/ksb/finance_realestate/rhauswald/seminar/
BankLending.pdf
141
CHAPTER 5:
SUMMARY AND CONCLUSION
This chapter draws together the results from three essays that form the core of this thesis,
and provides further discussions and policy implications. Following the debate on the role of
banks’ trading activities in exacerbating the recent sub-prime crisis, the first essay addressed
the motives behind banks extensive involvement in trading. Using logit, OLS, and multinomial
logistic framework for a large unbalanced panel dataset of 1523 U.S. commercial banks during
2003Q4 to 2013Q2, we found that banks’ propensity to engage in trading activities increases
with insolvency risk and non-interest income, but decreases with regulatory capital ratio. We
also showed that the propensity of banks to engage in trading increases with the size of the
lending portfolio and bank size. In contrast, management efficiency and deposits have an
inverse relation with the propensity of banks to engage in trading. For banks involved in
trading, our OLS models showed that an increase in credit and liquidity risk decreases banks’
trading exposure in the following quarter. In contrast, an increase in non-interest income and
regulatory capital ratio encourages banks to engage in trading activities in the following
quarter. These results indicate that banks consider their risk-taking profile when increasingly
their exposure to trading. Comparing banks that are extensively involved in trading with those
that are only marginally, we found that liquidity risk decreases while non-interest income
increases the likelihood of banks to extensively engage in trading. Our multinomial logistic
regression model also showed that the trading activity that is of greatest concern to

142
regulators – OBS derivatives – is insensitive to regulatory capital constraint. Overall, our
findings affirm that banks are extensively involved in OBS derivatives activities as
intermediaries to facilitate risk management to other agents in financial system as end users.
Further, we established that non-interest income is one of the key motives behind trading.
Our results settles Gruber and Warner’s (1977) assertion that the cost of bankruptcy and the
cost of implementing risk management are relatively higher for small or less capitalized banks
as they benefit the most from risk hedging through trading as end users. Our finding also
support Allen and Santomero’s (1996) assertion that extensively trading banks involve in
trading as intermediaries because they have advantages over individuals to create and
facilitate financial instruments for agents risk management or trading needs on a day to day
basis.
The second essay examined the role of banks’ trading activities in enhancing information
opacity, a major concern of market participants. Using a sample of 275 U.S. commercial banks
listed on the NASDAQ/NYSE/AMEX from 1999Q4 to 2012Q2, we showed that all three major
categories of financial assets of banks, i.e. assets held to maturity, available for sale securities,
and trading securities, contribute to bank opacity. Of banks’ assets for sale exposures,
available for sale securities and securitization of family residential loans have the largest
economic impact on bank opacity, with a one standard deviation increase in each of these
exposures increasing the bid-ask spread by 1.7 cents. Banks which are involved in
securitization have a 1.5 cents higher bid-ask spread compared to those not involved. Of
banks’ trading securities exposures, we found that equity derivatives for hedging and trading
143
purposes contribute most to opacity, with a one standard deviation increase in exposures
increasing the bid-ask spread by 5.1 and 2.9 cents respectively. Finally, for the assets held to
maturity category, we found that Texas ratio, non-accrual loans, and loans secured by
farmlands contribute most to opacity, with a one standard increase in each of these variables
increasing the bid-ask spread by 1.4, 1.1, and 1.0 cent respectively. Overall, our findings suggest
that the concerns surrounding the measurement and reporting of banks’ financial assets and
trading activities, in particular securitization and OBS exposures are warranted, significantly
adding to bank opacity.
With the changing business model of banks from ‘‘originate and hold’’ to ‘‘originate,
repackage, and sell’’, the final essay examined how trading activities affects the transmission
of shocks in monetary policy on banks’ balance sheet adjustments (capital and lending
channels). In particular, we examined the interaction between banks’ traditional capital and
lending activities and trading activities, in the presence of exogenous shocks. Using a panel
VAR framework on a balanced panel dataset of 580 U.S. banks quarterly data for the period
2003Q1 to 2012Q4, we found that a trading channel coexists besides the capital and lending
channels in exogenous shock transmission. We also showed that exogenous shocks are
absorbed more rapidly through banks’ traditional capital and lending channels than through
banks’ trading channel. From a policy perspective, these findings lead us to conclude that
trading activities have added a new dimension to banks’ balance sheet adjustments. However,
of regulatory key concern, we found that trading has not affected the role of the capital and
lending channels in absorbing monetary policy shocks. This is despite asset sales,

144
securitization, and OBS derivatives trading providing an ever-growing income source for
banks, independent of their size and capital strength. More specifically, we showed that when
banks’ asset funding is restricted due to an increase in borrowing cost, banks reduce their
lending, liquidate their securities holdings, and freeze asset sales and securitization so as to
maintain their capital and risk-taking profile. In contrast, when banks’ income is squeezed due
to reduced lending, securitization, and asset sales, banks increase their OBS derivatives
trading activities.


