
TO STUDY THE EFFECT OF STRAIN
RATE ON TENSILE PROPERTIES AND
HIGH CYCLE FATIGUE BEHAVIOUR
OF IF STEEL
THIS THESIS IS SUBMITTED IN THE PARTIAL FULLFILMENT OF THE
REQUIREMNT FOR THE DEGREE OF BACHELOR OF TECHNOLOGY
IN
METALLURGICAL AND MATERIALS ENGINEERING
BY
DILLIP KUMAR NAYAK
(Roll No. 109MM0482)
&
RAJESH KUMAR PALAI
(Roll No. 109MM0483)
Under the guidance of
Dr. B. B. VERMA
Dr. H. N. BAR
NATIONAL INSTITUTE OF TECHNOLOGY, ROURKELA
2013

I | P a g e
NATIONAL INSTITUTE OF TECHNOLOGY ROURKELA
CERTIFICATE
This is to certify that the thesis entitled “TO STUDY THE EFFECT OF STRAIN
RATE ON TENSILE PROPERTIES AND HIGH CYCLE FATIGUE BEHAVIOUR OF
INTERSTITIAL FREE STEEL ” submitted by Dilip Kumar Nayak(109mm0482) and
Rajesh Kumar Palai(109mm0483) in partial fulfilment of the requirements for the
award of Bachelor of Technology Degree in Metallurgical and Materials Engineering at
National Institute of Technology, Rourkela is an original work carried out by them under
my supervision and guidance.
The matter embodied in the thesis has not been submitted to any other University/ Institute for
the award of any degree.
Date: 8th
May, 2013
Dr. B.B.Verma Dr. H N Bar
Dept. of Metallurgical and Materials Engineering Scientist,
National Institute of Technology National Metallurgical Laboratory
Rourkela – 769008 Jamshedpur - 831007

II | P a g e
ACKNOWLEDGEMENT
First and foremost, we would like to thank to our supervisor of this project Dr. B.B.Verma,
Department of Metallurgical and Materials Engineering, NIT Rourkela, for his valuable
guidance, constant encouragement and kind help at all stages for the execution of this
dissertation work.
We express our sincere gratitude to Dr. B. C. Ray, Head of the Department, Metallurgical and
Materials Engineering, NIT Rourkela for giving us an opportunity to work on this project and
allowing us access to valuable facilities in the department.
We would like to convey our heartfelt gratitude to Dr. H.N. Bar, National Metallurgical
Laboratory, Jamshedpur to whom we are indebted for their relentless support by allowing us
to conduct most of the experiments at their facility during our project work.
.
We would also like to thank Mr. Abhishek Chaturvedi,M.Tech. Metallurgical and Materials
Engineering, NIT Rourkela for his help and support through the course of our project work.
Date: 8th
May, 2013 Dillip kumar Nayak(109mm0482)
Rajesh kumar Palai(109mm0483)
Dept. of Metallurgical and Materials Engineering
National Institute of Technology, Rourkela
Rourkela-769008

III | P a g e
ABSTRACT
Interstitial Free steels find their applications in various industries including automobile.
Their extensive use in industries are due to their excellent formability, weldability and
toughness. These materials are usually exposed to various strain rates during service. In the
present investigation an attempt has been made to study the effect of strain rate. And it has
been found that as the strain rate of loading increases the strength of the material increases
but the ductility decreases.
Though enough information are available on the effect of low cycle fatigue on this type of
material, however in many cases they are also exposed to high cycle loading condition.
Therefore an attempt has been made to study the effect of high cycle fatigue with σmax close
to the yield strength of the material. And a relation has been established between the stress
ratio and the number of cycles to failure

IV | P a g e
CONTENTS
List of Tables V
List of Figures VI
1. Introduction 1
1.1. Steel 2
1.2. Interstitial free steel(ifs) 3
1.3. Fatigue 5
1.4. High Cycle Fatigue 8
1.5. Strain rate 8
1.6. Tensile properties 10
2. Literature Review 11
3. Experimental Procedure 16
3.1. Fabrication of Specimen 17
3.2. Material Characterization 17
3.3. Tensile Testing 18
3.4. Fatigue Testing of As-received Specimens 19
4. Results and Discussion 21
4.1. Tensile Test Results 22
4.2. Fatigue Testing 22
4.3. Effect of strain rate on tensile loading 25
4.4. Fractography and Analysis of Fractographs 27
5. Conclusion 30
6. References 32

V | P a g e
List of Tables
Table 3.1 Chemical composition of the selected IF steel 17
Table 4.1 Tensile Test Results 22
Table 4.2 Fatigue testing results at 0.9ys 22
Table 4.3 Fatigue Test Results at 0.95ys 23

VI | P a g e
List of Figures
Figure 1.1 Fe-C phage diagram 2
Figure 1.2 S-N curve 6
Figure 1.3 Alternating stress cycle 7
Figure 1.4 Stress strain curve 10
Figure 3.1 microstructure of if steel 18
Figure 3.2 tensile sample 19
Figure 3.3 fractured specimen under fatigue 20
Figure 4.1 graph between R Vs N 24
Figure 4.2 comparison between strees amp Vs N 24
Figure 4.3 A plot of stressVs displacement at strain rate 10-4
25
Figure 4.4 Aplot of stressVs displacement at strain rate 10-2
26
Figure 4.5 fracture surface of fatigue specimen at R 0.05 27
Figure 4.6 fracture surface of fatigue sample at R 0.1 27
Figure 4.7 fracture surface of tensile sample at strain rate 10-4
28
Figure 4.8 fracture surface of tensile sample at strain rate 10-2
28

VII | P a g e

1 | P a g e
Chapter 1
2 | P a g e
1. Introduction
1.1. Steel
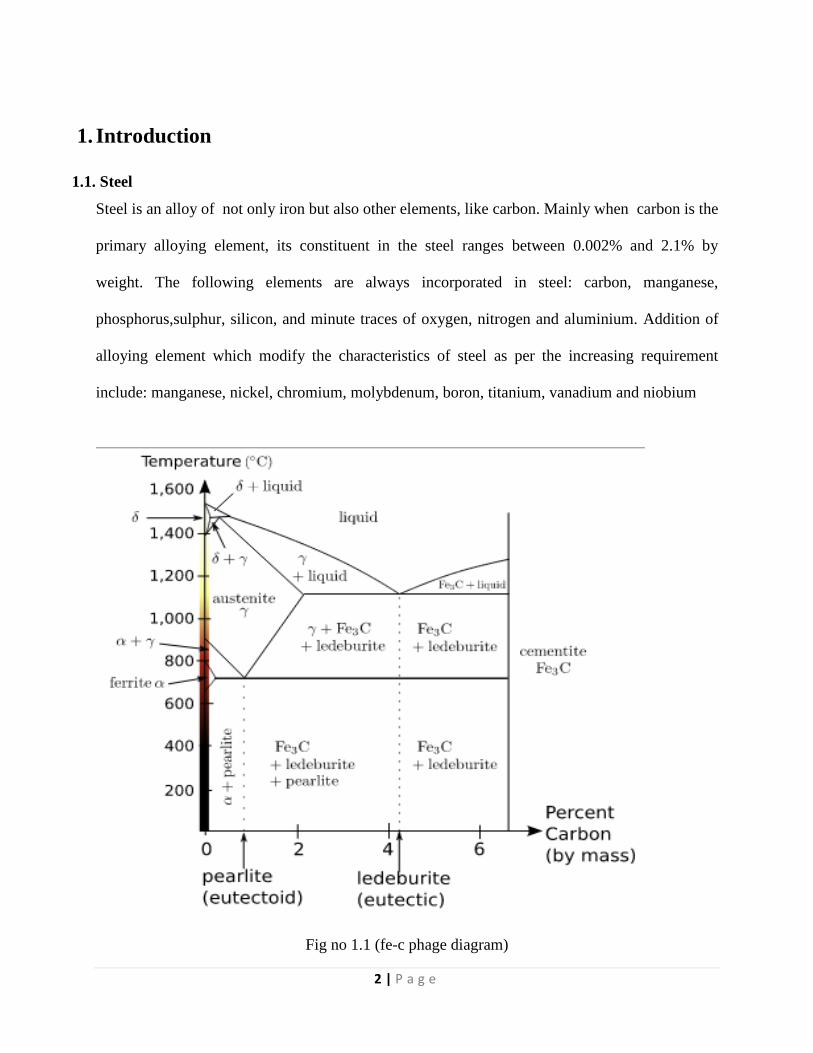
Steel is an alloy of not only iron but also other elements, like carbon. Mainly when carbon is the
primary alloying element, its constituent in the steel ranges between 0.002% and 2.1% by
weight. The following elements are always incorporated in steel: carbon, manganese,
phosphorus,sulphur, silicon, and minute traces of oxygen, nitrogen and aluminium. Addition of
alloying element which modify the characteristics of steel as per the increasing requirement
include: manganese, nickel, chromium, molybdenum, boron, titanium, vanadium and niobium
Fig no 1.1 (fe-c phage diagram)

3 | P a g e
Additional materials are often added to the iron/carbon mixture to produce steel with properties
meeting the increasing demands of day to day market. Nickel and manganese in steel strengthens
tensile strength and the austenite form of the iron-carbon solution become more stable,
chromium increases hardness and fusion temperature, and vanadium also increases hardness
while reducing the effects of metal fatigue.
To inhibit corrosion, at least 11% chromium is added to steel so that a hard oxide forms on the
metal surface; this is known as stainless steel. Tungsten mainly interferes with the formation of
cementite, allowing preferentially formation of martensite at slower quench rates, leading in
production of high speed steel. In addition to it, nitrogen, sulfur and phosphorus make steel more
brittle, so these commonly found elements are a must to be removed from the ore during
processing.
The density of steel depending on the alloying constituents usually ranges between 7,750 and
8,050 kg/m3 (484 and 503 lb/cu ft), or 7.75 and 8.05 g/cm3 (4.48 and 4.65 oz/cu in).
1.2.Interstitial free steel(ifs)
Steel manufactured with very low amounts of interstitial elements (primarily carbon and
nitrogen) with small amounts of titanium or niobium added to tie up the remaining interstitial
atoms. When free interstitial elements are not present, these steels which are very ductile and
soft, will not bake harden or age, and will never form strain (Luder’s) lines during forming due
to the absence of YPE (yield point elongation)
Interstitial-free (IF) steels constitute one of the major groups of bcc steels used in the automotive
industry for forming thin gauge sheet body panels
Sheet metal is a critical material for vehicle design, due to its design versatility and
manufacturability. Low carbon sheet steel has long been the workhorse material in consumer

4 | P a g e
industries because it can be stamped into inexpensive, complex components at very high
production rates. There has been a continuing trend towards development of materials with
improved formability, which led to development of deep drawing quality (DDQ) and extra deep
drawing quality (EDDQ) steel sheets and several nonferrous alloys. In recent decades, the
development of interstitial free (IF) steel satisfies the stringent demand of automobile
manufactures due to their excellent formability . These interstitial free steel sheets are replacing
other materials for very critical forming applications. Interstitial-free steels are produced by the
addition of titanium and/or niobium to an extra low carbon grade to precipitate interstitial carbon
and nitrogen atoms[17] .
Use of galvanised steel increased because of its high corrosion resistance. Galvanizing is the
process in which a zinc layer that is metallurgicaly bonded to the iron or steel's surface. Primarily
being used for corrosion protection, zinc coating is also applied to sheets for others reasons,
including solderability, temperature resistance, lubrication and paint ability. The hot dip
galvanizing is the most widely used galvanizing process, which involves immersing very clean
steel sheet, as a continuous ribbon, into a zinc molten bath at temperature 450–460 °C.
The composition of if steel sheet is C ∼ 0.0035, Mn ∼ 0.079, S ∼ 0.0089, P ∼ 0.0109, Si ∼
0.006, Al ∼ 0.0359, Ti ∼ 0.067, N ∼ 0.003[17].
In recent years the amount of research on IF steels has increased, primarily focussed at studies of
precipitation and segregation behaviour related to cold work embrittlement (CWE) during deep
drawing . Relatively few studies have focused on fatigue performance and most of those have
considered issues other than crack paths and the occurrence of IG cracking during fatigue.
Daniélou et al. explicitly considered the mechanisms of cyclic plasticity at several different
plastic deformation amplitudes and strain rates. In their steel, initiation of fatigue cracks was
observed to be both intergranular and transgranular at ambient temperature (293 K) but the

5 | P a g e
intergranular region was reportedly confined to cracks <50 μm in length. Islam and Tomota
reported the occurrence of extensive IG faceting on the fatigue fracture surfaces but ascribed this
to environmentally-induced hydrogen embrittlement and to grain boundary segregation of
phosphorous. Most studies have considered only a fairly confined range of IF steels and
experimental conditions.
1.3.Fatigue
Repeated cycling of the load causes metal fatigue. Due to fluctuating stresses and strains on the
material it is a progressive localized damage. The cracks get initiated and propagate in regions
where the strain is most severe.
Considering metals and alloys, when macroscopic or microscopic discontinuities are generally
not present, it commences with dislocation movements, finally forming persistent slip bands that
nucleate short cracks.
The fatigue procedure generally consists of three stages [14]:
Firstly crack initiation
Continuous crack growth across the part
Commending with sudden fracture of the remaining cross section
6 | P a g e
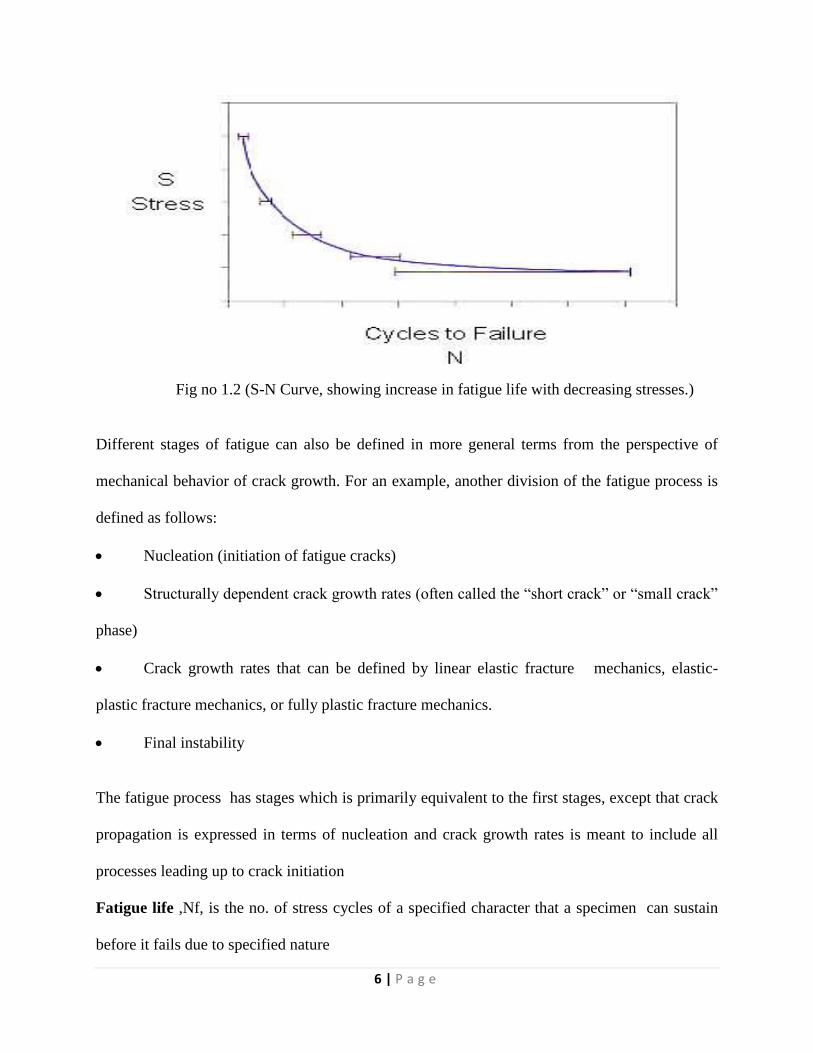
Fig no 1.2 (S-N Curve, showing increase in fatigue life with decreasing stresses.)
Different stages of fatigue can also be defined in more general terms from the perspective of
mechanical behavior of crack growth. For an example, another division of the fatigue process is
defined as follows:
Nucleation (initiation of fatigue cracks)
Structurally dependent crack growth rates (often called the “short crack” or “small crack”
phase)
Crack growth rates that can be defined by linear elastic fracture mechanics, elastic-
plastic fracture mechanics, or fully plastic fracture mechanics.
Final instability
The fatigue process has stages which is primarily equivalent to the first stages, except that crack
propagation is expressed in terms of nucleation and crack growth rates is meant to include all
processes leading up to crack initiation
Fatigue life ,Nf, is the no. of stress cycles of a specified character that a specimen can sustain
before it fails due to specified nature

7 | P a g e
One way to predict fatigue life of materials is the Uniform Material Law (UML). UML was
primarily developed to predict the fatigue life of aluminum and titanium alloys by the end of
20th century and further was also used to find the fatigue life of high-strength steels and cast
iron. Also for some materials, there is a theoretical value for stress called a fatigue limit
amplitude below the level of which the material will not fail for any no. of cycles. It is also
endurance limit, or fatigue strength as per wish.
Stress Ratio is the ratio of the minimum to the maximum stress (Smin/Smax).
If the stresses are fully reversed, then R = -1.
If the stresses are partially reversed, R = a negative number less than 1.
If the stress fluctuates between a maximum stress and no load, R = zero.
If the stress fluctuates between two tensile stresses, R = a positive number less than1.
Variations in the stress ratios do significantly affect fatigue life. A substantial effect on fatigue
failure is due to presence of mean stress. On addition of a tensile mean stress to the alternating
stresses, failure of a component will occur at lower alternating stress than it generally does
under a fully reversed stress.

8 | P a g e
fig no 1.3
Fatigue failure is of two type
i. High cycle fatigue
ii. Low cycle fatigue
1.4.High cycle fatigue
When the fatigue occurs above 103 cycles (usually 10
4 or more), it is usually called High-cycle
fatigue. The material is applied lower loads, usually less than 2/3 of the yield stress. The
deformation is elastic deformation.
In high-cycle fatigue, materials performance is generally characterized by an S-N curve, also
known as a Wohler curve . This is a graph of the magnitude of a cyclic stress (S) against the
logarithmic scale of cycles to failure (N).
The progression of the S-N curve depends on many factors such as corrosion, temperature, and
the presence of notches. The Goodman-Line is a method to estimate the influence of the mean
stress on the fatigue strength [20].

9 | P a g e
As coupons sampled from a homogeneous frame will manifest variation in their number of
cycles to failure, the S-N curve should more properly be an S-N-P curve capturing the
probability of failure after a given number of cycles of a certain stress. Probability distributions,
common in data analysis and in design against fatigue include the extreme value distribution,
lognormal distribution, Birnbaum–Saunders distribution, Weibull distribution.
1.5. Strain rate
Strain is the amount of deformation that occurs when an object is placed under stress. Strain rate
is calculated as the change in strain over the change in time. All materials generally undergo
some change in their dimensions when exposed to stress. This deformation caused by stress can
be fully reversible or permanent, depending on the stress applied.
Elastic strain starts when a material under stress returns to its original dimensions once the stress
is removed. Plastic strain appears as the object has been exposed to very high levels of stress and
will no longer return to its original shape after the stress is removed. The instantaneous reversal
of elastic strain in many materials, means it occurs in insufficient duration of time. The
deformation which is fully elastic, but occurs over time, is described in terms of the strain rate.
For different materials strain rate varies widely, and often changes at different temperatures and
applied pressures. Steel is such a material that returns to its original state immediately after
applied stress is removed. Conversely, according to geology, stresses are applied over millions of
years and the rate of strain in rock is typically very low. Thus a material whose rate of strain
changes a large amount at different temperatures and pressures has high strain rate sensitivity
[22].
10 | P a g e
This rate is also dependent on the applied force or stress . In many plastics, if a gradual stretching
force is applied the material will elongate a large amount before it breaks. As the molecules in
the plastic have enough time to reorient themselves and move past each other, causing the
stretching to occur. Thus an impact or sudden force when applied to a plastic, will break it
immediately like a brittle material. The very same plastic material will react very differently due
to different rates of strain caused by the way the stress is applied.
Strain rate is measured in the laboratory using special test equipment that applies very precise
cyclic loads to a sample, while measuring the deformation and recovery that occurs after the
stress is removed for that specific load applied. As the strain rate of a material influences its
behavior, it becomes thus mandatory to understand its sensitivity to the type of load, amount of
stress, and temperature. Reflecting on the strain rate of a material will ensure that it meets the
performance specifications as required for the application.
1.6.Tensile properties[16]
Tensile properties portray how the material will react to forces applied in tension.The test is a
basic mechanical test in which a prepared specimen is loaded very carefully while measuring the
applied cyclic load and the elongation of the specimendue to the load applied. The test is used to
measure modulus of elasticity, elongation,elastic limit proportional limit,tensile strength,
reduction in area, yield point, yield strength and other tensile properties . Load versus elongation
is the result from tensile test which is then surveyed into a stress versus strain curve. The load-
elongation curve will bear the same shape as the engineering stress-strain curve since both the
engineering stress and the engineering strain are obtained by dividing the load and elongation by
constant values (specimen geometry information),. The stress-strain curve generally portrays the

11 | P a g e
relation of the applied stress to the resulting strain. An engineering stress-strain curve is shown
below. It is depicted that the stress-strain curve increases continuously up to fracture if the true
stress, depending on the actual cross-sectional area of the specimen, used.
Fig no 1.4 (stress stain curve)

12 | P a g e
Chapter 2

13 | P a g e
Q. Y. Wang [1] made an attempt to characterize the high cycle fatigue behavior of high-strength
spring steel wire by means of an ultrasonic fatigue test and analytical techniques. The fatigue
strength of the steel wires between 106 and 109 cycles was determined at a load ratio R = −1. The
experimental results show that fatigue rupture can occur beyond 107 cycles. For Cr–V spring
wire, the stress–life (S–N ) curve becomes horizontal at a maximum stress of 800 MPa after 106
cycles, but the S–N curve of the Cr–Si steel continues to drop at a high number of cycles (>106
cycles) and does not exhibit a fatigue limit, which is more correctly described by a fatigue
strength at a given number of cycles. Experimental and analytical techniques were developed to
better understand and predict high-cycle fatigue life in terms of crack initiation and propagation.
The results show that the portion of fatigue life attributed to crack initiation is more than 90% in
the high-cycle regime for the steels studied in this investigation.
M.D. Chapetti [2] studied the fatigue crack propagation from the surface and from internal
inclusions is analyzed and modeled in high strength steels that show both types of crack
initiation. Fatigue crack propagation lives of a crack initiated from the surface and from internal
inclusions are estimated and analyzed. The high cycle fatigue life for a given crack range is
estimated by: (a) defining material resistance to crack propagation as a function of crack length,
and (b) assuming that the difference between the applied driving force and material resistance for
crack propagation defines the effective driving force applied to the crack. If the crack growth rate
as a function of this effective driving force is known for a given material, the high cycle fatigue
life for a given crack length range can be estimated. The present model estimates reasonably well
the fatigue life associated with crack initiated from the surface. On the other hand, the fatigue life
of crack initiated from internal inclusions has an associated initiation life defined by a hydrogen

14 | P a g e
assisted fatigue mechanism that represents a great part of the total fatigue life. In this case, the
fatigue crack propagation life predicted by the model is a small part of the total fatigue life.
C.Michael Hudson [3] studied the effect of stress ratio on the fatigue behavior of 7075-T6
aluminum-alloy sheet. Axial-load fatigue-crack-propagation tests were conducted on 12 in. (305
mm) wide sheet specimens made of 7075-T6 aluminum alloy. These tests were made at stress
ratios R (ratio of the minimum stress to the maximum stress) ranging from −1.0 to 0.8 and at
maximum stress levels ranging from 5 to 50 ksi (34–340 MN/m2) to study the effects of stress
ratio on fatigue-crack growth. The fatigue-crack-propagation data were analyzed using Paris'
stress-intensity analysis. The data from tests at negative R values fell into a relatively narrow
scatterband along with the results from the R = 0 tests on a plot of rate against stress intensity
range. Apparently, the compression portion of the loading cycle did not significantly affect crack
growth in these tests. The data from tests at different positive stress ratios fell into discrete bands
on these plots. These bands varied systematically with R, that is, the higher the stress ratio at a
given value of ΔK, the higher the rate of fatigue-crack growth. This spread in rates was small at
the lower stress-intensity range, but became progressively larger as the stress-intensity range was
increased.
M.T. Milan [4] made an attempt to calculate the strain life of interstitial free this sheet. In the
present work, the monotonic and low cycle fatigue properties of a thin sheet produced from
interstitial free steel containing titanium additions were investigated. A special grip alignment
fixture permitted the fatigue tests be conducted under deformation control and completely

15 | P a g e
reversed cyclic strain. The material presented different fatigue behavior for the transverse and
longitudinal directions, related to the rolling direction. A comparison between the monotonic and
cyclic stress-strain curves in the transverse direction showed that the material exhibits cyclic
hardening at all tested strain amplitudes. The strain-life relationship was obtained for the
transverse direction; buckling of longitudinal specimens made it impossible to obtain such a
relationship.
SHRABANI MAJUMDAR [5] studied the micromechanism of fatigue damage in an
interstitial-free (IF) steel sheet using fully reversed stress amplitudes (σ/2). The stress-life (S-N)
curve of the steel sheet has been generated, together with a series of interrupted fatigue tests at
each of the chosen σ /2, to study the progress of fatigue damage in terms of the initiation,
growth, and coalescence of the fatigue cracks on the surfaces of the sheet specimens using
scanning electron microscopy. The steel sheet possesses a higher endurance limit (0.98 times its
yield strength (YS)), as compared to conventional low-carbon steel sheets. This is attributed to
(1) the occurrence of nonpropagating micro cracks initiating primarily at the inclusions below
the endurance limit and (2) a significant delay in the spread of plastic deformation, until σ/2 is
close to YS.
R.D. Noebe [6] Tensile testing of cast and extruded binary NiAl was performed from 300 to 900
K at strain rates of 1.4 × 10⁻⁴ to 1.4 × 10⁻¹ × s−1. The brittle-to-ductile transition temperature
(BDTT) was dependent on strain rate, with a three order of magnitude increase in strain rate
resulting in approximately a 200 K increase in transition temperature. Regardless of strain rate, at
temperatures just above the BDTT the fracture strength increased significantly and the fracture

16 | P a g e
morphology changed from mostly intergranular to predominantly transgranular. It was also
determined that the mechanism responsible for the brittle-to-ductile transition in NiAl had an
apparent activation energy of approximately 118 kJ/mol. These results support the argument that
the mechanism for the brittle-to-ductile transition in NiAl is associated with the onset of a
thermally activated deformation process. This process is probably dislocation climb controlled
by short circuit diffusion.
17 | P a g e
Chapter 3

18 | P a g e
3. Experimental procedures
3.1 Specimen fabrication
A cold-rolled and batch-annealed Ti-stabilized IF steel sheet of 1.4-mm thickness was
collected. Tensile and fatigue test specimens (dimensions are shown in the figure) were
fabricated from the thin sheet with an EDM wire cut machine. Longitudinal specimens
were cut along the rolling direction of the sheet. A square shaped specimen was machined
for microstructural observations.
3.2 Material characterization
The chemical composition and the microstructure of the specimen are given in the
Table 3.1 and Fig.3.2.
Table no 3.1 Chemical composition of the selected IF steel (in wt %)
C 0.0034
Mn 0.078
S 0.009
P 0.012
Si 0.006
Al 0.0358
N2 0.003
Ti 0.065
Fe Balance

19 | P a g e
Fig 3.1 (microstructure of IF steel)
3.3 Tensile Testing
Initially tensile testing of the sample (dimension are given in fig .x) was carried out using
universal testing machine. A gauge length of 8mm was selected and tensile loading is
done with a crosshead velocity of 8*10-3 mm per sec. Average yield strength value was
calculated using the yield strength values of two of the same samples. Then a total of 6
specimens were subjected to tensile testing under different strain rate 10-4
, 10-3
, 10-2
mm
per second respectively to observe the effect of strain rate on tensile properties and the
changes in tensile properties were analyzed using origin pro 8 software.

20 | P a g e
Fig no 3.2(tensile specimen )
3.4 Fatigue Testing Of As Received Specimens
A test matrix was prepared in accordance with the average yield strength value. High
cycle fatigue test was carried out for sixteen samples at different stress ratios and
different stress values. The maximum stress was set at 0.9 times the yield strength
(average yield strength value was obtained from the tensile testing) of the material
initially. A total of 8 specimens were tested at max. stress value of 0.9Y.S then the
maximum stress value was raised to 0.95Y.S to observe the change in fatigue behavior of
the test specimen. A cyclic load of tension-tension type with a maximum stress of 0.9 Y.S
was applied to the specimen using a sinusoidal waveform of frequency 50 Hz. A total of
sixteen specimens were subjected to high cycle fatigue test at different stress ratios (0.05,
0.1, 0,2, 0.3) respectively.
1.4
(All the specimen dimensions are given in mm)

21 | P a g e
Fig. 3.3 (fractured specimen under fatigue)
22 | P a g e
Chapter 3

23 | P a g e
4. Results and Discussion
4.1 Tensile Test Results
Table no 4.1
F
From the above table yield strength was found to be 295 Mpa.
4.2 Fatigue Testing
The high cycle fatigue testing data of 8 specimens at different stress ratios are given below.
Table no 4.2.
(fatigue testing data obtained when the σ max value was set at 0.9YS i.e 265.5
MPa and frequency of cyclic load was set at 40 Hz )
Sample NO Avg. thickness
(mm)
Avg. width
(mm)
Gauge length
(mm)
Yield strength
(Mpa)
1 1.37 4.19 8 287
2 1.38 4.18 8 303
Sample No Stress
ratio σmax
MPa
σmin Stress amp
(MPa)
No of
cycles to
failure
Remark
1 0.05 265.5 13.28 126.11 487122 Failed
2 0.05 265.5 13.28 126.11 521570 Failed
3 0.1 265.5 26.5 119.5 3430690 Failed
4 0.1 265.5 26.5 119.5 3333552 Failed
5 0.2 265.5 53.22 105.89 18194004 Didn’t
fail
6 0.2 265.5 53.22 105.89 9380238 Failed
7 0.3 265.5 79.85 92.81 12482679 Didn’t
fail
8 0.3 265.5 79.85 92.81 13061655 Didn’t
fail

24 | P a g e
Table no 4.3
(fatigue testing data obtained when the σ max value was set at 0.95YS i.e 280.25
MPa and frequency of cyclic load was set at 40 Hz )
Graphs between the stress ratio vs. the no of cycles to failure and stress amplitude vs. no of
cycles to failure were plotted. The results are given in the fig.4.1 and fig.4.2 below.
Sample No Stress ratio σmax
(MPa)
σmin
(MPa)
Stress amp
(MPa)
No of
cycles to
failure
Remark
1 0.05 280.25 14.01 133.12 287231 Failed
2 0.05 280.25 14.01 133.12 434928 Failed
3 0.1 280.25 28.02 126 662805 Failed
4 0.1 280.25 28.02 126 683429 Failed
5 0.2 280.25 56.04 112.5 7404810 Failed
6 0.2 280.25 56.04 112.5 8194573 Failed
7 0.3 280.25 84.07 98 10378375 Didn’t
fail
8 0.3 280.25 84.07 98 10867594 Didn’t
fail

25 | P a g e
The no of cycles to failure increased with increasing stress ration and decreased with decreasing
stress amplitude value.
Fig no 4.1
Fig no 4.2

26 | P a g e
4.3 Effect Of Strain Rate On Tensile Loading
A total of six samples were loaded in a tensile manner with different strain rates like 10-4
, 10-3
,
10-2
mm/sec. An increment in the UTS value was observed as the strain rate kept on increasing.
But the area under the stress strain curve decreased with increasing strain rate and the severity of
fracture of the specimens increased. The plot of the stress strain plot for two different strain rates
are given below in fig no 4.3 and fig no 4.4.
Fig no 4.3
(A plot between the stress and displacement when strain rate was 10-4
mm/sec)
Position of the upper jaw
Str
ess

27 | P a g e
Fig no 4.4
(A plot of stress vs. displacement at strain rate, 10-2
)
The tensile strength of the specimen increased with increasing strain rate because the rate of
generation of dislocations exceeds the rate of diffusion of dislocations through grain boundaries.
Hence the dislocation pile up increases so does the strength.
Position of the upper jaw
Str
ess

28 | P a g e
4.4 Fractography and Analysis of Factographs
Fig. no 4.5
Fig. no 4.6
The fig. no 4.5 & fig no 4.6 represent the SEM fractograph of the specimens which fractured
under high cycle fatigue (tension – tension type) with maximum stress being set at 0.95 YS.

29 | P a g e
Although fatigue crack initiates from the surface, in this case there has not been any evidence of
crack propagation from the surface. There are striation marks inside the body.
Fig no 4.7
Fig no 4.8
Fig no 4.7 & fig no 4.8 represent the SEM fractographs of the specimen which fractured under
tensile loading with strain rates 10-4
and 10-2
mm/sec respectively.

30 | P a g e
Fig no 4.7, which represents the fractured surface of the specimen which fractured under tension
with a strain rate 10-4
mm/sec, has a higher density of dimples. And the dimples are deeper. But
the specimen which has been loaded with a strain rate 10-2
mm/sec has got shallow dimples and
even the density of the dimples is low as well.

31 | P a g e
Chapter 5

32 | P a g e
5. Conclusion
1. The fatigue life of the specimen increases as the stress ratio increases.
2. The no of cycles to fatigue failure decreases as the stress amplitude increases.
3. The σmax value has also some effect on the fatigue property. The no of cycles to failure
decreased as the σmax value is increased from 0.9YS to 0.95 YS.
4. When strain rate of tensile loading is increased the UTS value increased but the total
elongation of the specimen before fracture reduced and the fracture occurred in a severe
manner.
5. Ductility of the specimen decreased as the strain rate of tensile loading is increased.

33 | P a g e
Chapter 6

34 | P a g e
6.Reference
[1]. Q. Y. Wang International Journal of Fatigue, Volume 28, Issue 11, November 2006, Pages
1572-1576.
[2]. M.D. Chapetti Fatigue crack propagation behaviour in ultra-fine grained low carbon steel
International Journal of Fatigue, Volume 27, Issue 3, March 2005, Pages 235-243
[3]. C.Michael Hudson Engineering Fracture Mechanics, Volume 1, Issue 3, April 1969, Pages
429-446
[4].M.T.Milan, Fatigue and monotonic properties of an interstitial free steel
sheet(FMPIF)Department of Materials, Aeronautic and Automotive Engineering, EESC-
University, 6 August 2000
[5]. Shrabani Majumdar, Mechanism of fatigue failure in interstitial-free and interstitial-free
high-strength steel sheet, 2010
[6]. R.D. Noebe The effects of interstitial content, heat treatment, and prestrain on the tensile
properties of NiAl Original Research Article Materials Science and Engineering: A, Volumes
192–193, Part 1, 15 February 1995, Pages 179-185
[7]. SHRABANI MAJUMDAR, Bilinear Coffin–Manson Relationship in Thin Sheets of
Interstitial-Free Steel, The Minerals, Metals & Materials Society and ASM International 2012
[8]. American Iron and Steel Institute: Automotive Design Manual, Revision 6.1, American Iron
and Steel Institute & Auto/Steel Partnership, Pittsburgh, PA, 2002.
[9]. R.M. Chlistovsky, P.J. Heffernan, D.L. DuQuesnay, International Journal of Fatigue, Vol.
29, 2007, p. 1941–1949
[10]. K. van der Walde, B.M. Hillberry, International Journal of Fatigue, Vol. 29, 2007, p.
1269–1281

35 | P a g e
[11]. Baumel A, Seeger T. Materials data for cyclic loading, Supplement 1. Elsevier
Science Publishers; 1990
[12]. M.T. Milan, D. Spinelli, and W.W. Filho Bose: Int. J. Fatigue,2001, vol. 23, pp. 129–33.
[13]. Shanley F. R. (1957) Strength of Materials. McGraw-Hill.
[14]. S. Majumdar, D. Bhattacharjee, K.K. Ray, Mat. Sci.Tech. 26 (2010) 493
[15] L.C. Rolim Lopes, J. Charlier, Mat. Sci. Engg. A 169(1993) 67.
[16]. A.H. Mohammadi Fracture toughness evaluation of 3Cr-1Mo steel from Vickers
indentation and tensile test data Original Research Article Procedia Engineering, Volume 10,
2011, Pages 228-235
[17] D.A. Jones and S. R. Daniel, in: IF Steels 2000 Proceedings,USA, Iron & Steel Society,
2000, pp. 55–68
[18] H. Mayer,Very high cycle fatigue properties of bainitic high carbon–chromium steel under
variable amplitude conditions Original Research Article International Journal of Fatigue,
Volume 31, Issues 8–9, August–September 2009, Pages 1300-1308
[19] H.W. Ho¨ppel, M. Kautz, C. Xu, M. Murashkin, T.G.Langdon, R.Z. Valiev, H. Mughrabi,
Int. J. Fatigue 28(2006) 1001.
[20] Ong J. H. Int. (1993) J. of Fatigue, 15, 1, pp. 13-19.
[21] Murakami Y, Kodama S, Konuma S. Quantitative evaluation of effects of nonmetallic
inclusions on fatigue strength of high strength steel. Trans Jpn Soc Mech Eng
1988;A54(500):688–96
[22] Chengzhi Qi,Strain-rate effects on the strength and fragmentation size of rocks Original
Research Article International Journal of Impact Engineering, Volume 36, Issue 12, December
2009, Pages 1355-1364


