In: Tinnitus ISBN: 978-1-63117-556-5
Editors: F. Signorelli and F. Turjman © 2014 Nova Science Publishers, Inc.
Chapter 2
Tools for Tinnitus Measurement: Development and Validity of
Questionnaires to Assess
Handicap and Treatment Effects
Kathryn Fackrell1, Deborah A. Hall
1, Johanna Barry
2
and Derek J. Hoare1
1NIHR Nottingham Hearing Biomedical Research Unit,
Nottingham, UK 2MRC Institute of Hearing Research, Nottingham, UK
Abstract
Tinnitus is a chronic condition that affects about 15% of the
population and up to one in three older adults. For some it is a mild
annoyance, for others it can be extremely distressing and can significantly
deteriorate quality of life. Perceptual characteristics are a poor indicator
of clinical need. Clinicians and researchers alike rely on self-report or
questionnaires to quantify the severity of an individual‘s tinnitus and to
gauge the changes in tinnitus severity or tinnitus-related handicap over
time or after clinical intervention. This book chapter evaluates the
psychometric properties of five tinnitus questionnaires; Tinnitus
Handicap Questionnaire, Tinnitus Reaction Questionnaire, Tinnitus
Questionnaire, Tinnitus Handicap Inventory, and Tinnitus Functional
No part of this digital document may be reproduced, stored in a retrieval system or transmitted commercially in any form or by any means. The publisher has taken reasonable care in the preparation of this digital document, but makes no expressed or implied warranty of any kind and assumes no responsibility for any errors or omissions. No liability is assumed for incidental or consequential damages in connection with or arising out of information contained herein. This digital document is sold with the clear understanding that the publisher is not engaged in rendering legal, medical or any other professional services.

Kathryn Fackrell, Deborah A. Hall, Johanna Barry et al. 14
Index. We critically appraise the development process, validation, and
responsiveness. We consider the true utility of each questionnaire to
measure the short and long term consequences of tinnitus.
Introduction
Evidence-based assessment and treatment of tinnitus is important (e.g.,
Department of Health, 2009). However, tinnitus is notoriously difficult to
measure objectively because it is an experiential phenomenon and can
significantly differ between individuals. Objective measures include matching
the pitch and loudness of tinnitus to an external sound. However, there is only
a weak relationship between the psychoacoustic properties of sound (i.e., pitch
or loudness) and its functional impact on the individual. Across those
individuals with similar psychoacoustic attributes, there can be significant
variability in self-reported handicap or the domains of impairment that are
attributed to their tinnitus. It is not possible to determine or predict tinnitus
distress based on the tinnitus pitch and loudness (Zeman et al., 2011;
Andersson et al., 2005; Jakes et al., 1985). Perceptual characteristics therefore
are not a good indicator of clinical need.
Tinnitus is multidimensional. Different symptom domains include
emotional distress, problems with sleep, concentration or quality of life (QoL).
Comorbidities in psychological well-being, such as stress, generalised anxiety
and depression, and cognitive impairments profoundly impact on daily
functioning (Stevens et al., 2007; Newman et al., 2011; Robinson et al., 2003).
The degree to which tinnitus distress is perceived by patients can depend on
the impact that tinnitus has on these factors or vice versa. For some it is a mild
annoyance, for others it can be extremely distressing and significantly
deteriorates quality of life.
Self-report measures, especially questionnaires, are the primary way to
quantify the severity of an individual‘s tinnitus and to assess the changes in
tinnitus severity or tinnitus-related handicap over time or after clinical
intervention (Meikle et al., 2007). Although, it is not compulsory to include a
standard questionnaire in clinical practice (Hesser, 2000), most clinicians in
NHS audiology departments in England do use questionnaires to assess
tinnitus severity (67% out of 138 respondents; Hoare et al., 2012). The
Department of Health (DH) guidelines recommend the use of validated
tinnitus questionnaires; namely the Tinnitus Handicap Inventory (THI)
(Newman et al., 1996) and Tinnitus Questionnaire (TQ) (Hallam, 1996; 2008)
Tools for Tinnitus Measurement 15
for identifying tinnitus severity at intake assessment (Department of Health,
2009). Validated questionnaires can offer clinicians and researchers alike a
systematic approach to quantifying tinnitus severity by distinguishing
individuals who are bothered by their tinnitus from those who are not. This is a
vital prerequisite for triaging patients effectively into the most appropriate
interventions such as intensive management or education and advice.
Questionnaires are also used for standardising selection criterion in research.
For example, they identify people with similar degrees of tinnitus severity
allowing the research to focus on a specific subtype.
Question items addressing different symptom domains can be categorised
into subscales. Through analysing the responses in each subscale, clinicians
can identify where the tinnitus distress lies and the specific domains of
concern, so targeting the interventions. Tinnitus questionnaires can also be
used as pre- and post-treatment outcome measures, therefore providing
evidence of the changes that can occur in tinnitus severity. This is extremely
important since there has been a move towards evidence-based commissioning
within NHS services where healthcare professionals need to demonstrate to
third-party payers the efficacy of management (NHS White Paper, 2010).
Therefore there is a need to focus on evidence-based cost effective outcome
measures that will improve patient experiences and the efficacy of
interventions (NHS White Paper, 2010).
Evaluating and Validating a Questionnaire
Quality criterion for developing well validated questionnaires addresses
four broad topics: reliability, validity, responsiveness and interpretation
(Terwee et al., 2007). These are briefly summarised below.
Reliability
1. Internal consistency. The tinnitus questionnaire may assess different
dimensions (subscales) and all the items in a subscale measure the
same construct of tinnitus handicap.
2. Reproducibility – reliability. People with tinnitus can be distinguished
from each other, despite measurement errors (relative measurement
error)
3. Reproducibility – agreement. The tinnitus questionnaire score for
individuals tested on multiple occasions over a short time period (1-2
weeks) are close to each other (absolute measurement error).
Kathryn Fackrell, Deborah A. Hall, Johanna Barry et al. 16
Validity
4. Content validity. The items in the tinnitus questionnaire are a correct
and comprehensive reflection of the tinnitus handicap that the
questionnaire is intended to measure.
5. Structural validity. The scores of the tinnitus questionnaire adequately
reflect the construct of tinnitus handicap (i.e., the subscales explain at
least 50% of the variance).
6. Construct validity. The scores demonstrate expected correlations
between similar measures and expected differences between unrelated
measures and these hypotheses should be defined a priori.
Responsiveness
7. Responsiveness. The tinnitus questionnaire is able to detect clinically
important change over time.
8. Floor and ceiling effects. Few respondents achieve the lowest or
highest possible score so that the tinnitus questionnaire does not
compromise responsiveness, nor content validity and reliability.
Interpretation
9. Interpretability. It is possible to assign qualitative meanings to the
quantitative scores, preferably with an indication of what change
represents a minimal clinically important change for the patient group.
The remainder of this section considers and describes the techniques
underlying each of the main quality criteria. It is recommended that the
techniques are conducted from development to validation in the order
presented below (Bland and Altman, 2002; Streiner & Norman, 2008). Table 1
provides a summary and definition of the different evaluation and validation
techniques introduced in this review, and is intended to be used as a reference.
Step One: Ensuring the Questionnaire Content
As a useful general guide, developers should assess content validity to
ensure that they (1) properly define what is being measured, (2) confirm that
all aspects of the questionnaire (item choice, response options, and structure)
are reviewed and judged by a panel of experts, (3) clearly report the
development process, (4) ensure that any refinements to questionnaires
Tools for Tinnitus Measurement 17
undergo further evaluations, and (5) empirically validate the factorial structure
(Fitzpatrick, 1983; Haynes et al., 1995; Streiner and Norman, 2008).
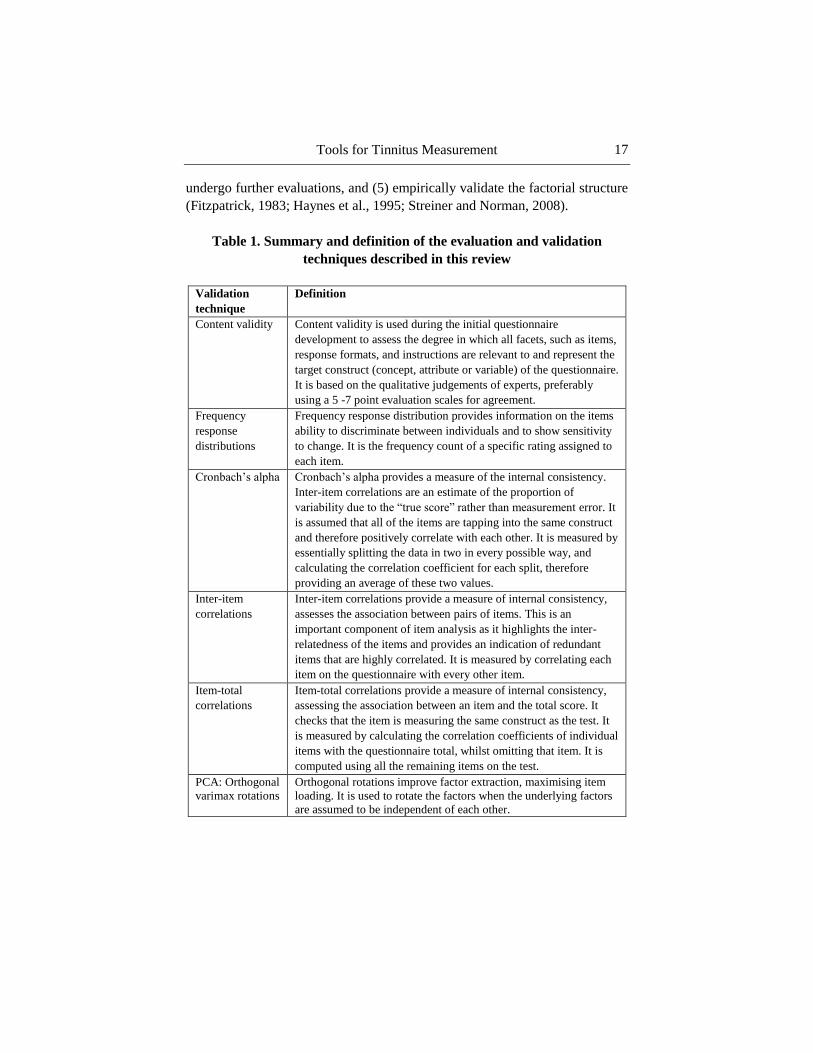
Table 1. Summary and definition of the evaluation and validation
techniques described in this review
Validation
technique
Definition
Content validity Content validity is used during the initial questionnaire
development to assess the degree in which all facets, such as items,
response formats, and instructions are relevant to and represent the
target construct (concept, attribute or variable) of the questionnaire.
It is based on the qualitative judgements of experts, preferably
using a 5 -7 point evaluation scales for agreement.
Frequency
response
distributions
Frequency response distribution provides information on the items
ability to discriminate between individuals and to show sensitivity
to change. It is the frequency count of a specific rating assigned to
each item.
Cronbach‘s alpha Cronbach‘s alpha provides a measure of the internal consistency.
Inter-item correlations are an estimate of the proportion of
variability due to the ―true score‖ rather than measurement error. It
is assumed that all of the items are tapping into the same construct
and therefore positively correlate with each other. It is measured by
essentially splitting the data in two in every possible way, and
calculating the correlation coefficient for each split, therefore
providing an average of these two values.
Inter-item
correlations
Inter-item correlations provide a measure of internal consistency,
assesses the association between pairs of items. This is an
important component of item analysis as it highlights the inter-
relatedness of the items and provides an indication of redundant
items that are highly correlated. It is measured by correlating each
item on the questionnaire with every other item.
Item-total
correlations
Item-total correlations provide a measure of internal consistency,
assessing the association between an item and the total score. It
checks that the item is measuring the same construct as the test. It
is measured by calculating the correlation coefficients of individual
items with the questionnaire total, whilst omitting that item. It is
computed using all the remaining items on the test.
PCA: Orthogonal
varimax rotations
Orthogonal rotations improve factor extraction, maximising item
loading. It is used to rotate the factors when the underlying factors
are assumed to be independent of each other.

Kathryn Fackrell, Deborah A. Hall, Johanna Barry et al. 18
Table 1. (Continued)
Validation
technique
Definition
PCA: Oblique
rotations
Oblique rotations improve factor extraction, maximising item loading.
This is a linear rotation that assumes that underlying factors are related
or correlated with each other.
Construct
validity
Questionnaires designed to tap into health behaviour constructs should
be based on underlying theories and therefore should measure aspects
that are consistent with this theory and construct. Construct validity
assesses the extent to which a questionnaire actually measures the
target construct it purports to measure. This type of validity consists of
two components; convergent and discriminant validity.
Convergent
validity
A component of construct validity. Convergent validity measures the
extent to which the construct of a new questionnaire corresponds with
other questionnaire constructs that are theoretically similar. It is
measured by calculating the correlations coefficients between the
questionnaires, and assessing the strength of the association.
Discriminant
validity
A measure of construct validity. Assesses the extent to which the
underlying construct of the new questionnaire can differentiate
between constructs that are theoretically independent. It is measured
by calculating the correlations coefficients between the questionnaires,
and assessing the strength of the association.
Test-retest
reliability
Assesses the consistency and stability of the questionnaire over time.
Test-retest reliability determines the extent to which the scores
maintained standing from test to retest. It is measured by calculating
the correlations coefficients of two set scores either for a single item,
subscale or total scale from the two different administrations points in
time.
Minimal
clinically
important
change
The clinical significance of a treatment requires knowledge about the
minimal change in total scores of the specific questionnaire used. The
minimal clinically important change score refers to the smallest
change in total scores between baseline and final assessment that can
be considered clinically relevant and be attributed to treatment
benefits. This score is considered important for the design of clinical
trials, the interpretation of the scores for the clinical significance of a
treatment and its ability to meet standards of efficacy.
Global
question
Usually a single question that is used to measure one aspect of the
health behaviour, such as symptom severity, using a 5-point or 7-point
response scale. Global questions are anchor-based techniques that
provide a way to assess the corresponding changes in questionnaire
total scores.
The order of the information corresponds to each step in evaluating and validation
section. PCA: Principal Component Analysis.
Tools for Tinnitus Measurement 19
Step Two: Validating the Questionnaire Structure
Validation provides a theoretical basis for the questionnaire construct (i.e.,
the concept, attribute or variable that is the target of measurement), Principal
Component Analysis (PCA) is a popular technique for identifying the
underlying domains of a questionnaire (Field, 2009). Essentially PCA
identifies sets of correlated variables (Factors) within the questionnaire items.
The factorial structure is informed by the inter-item relationships, computed
from the inter-item correlations (factor loadings) between each variable in the
analysis (Floyd, 1995). Factor interpretations are improved by rotating the
data. These rotations can either be oblique or orthogonal in form. They are
designed to maximise item loading on the extracted factor whilst reducing the
loading on the other factors. A ‗good‘ tinnitus questionnaire would be
expected to cover all the important domains of tinnitus handicap (e.g.,
Kennedy et al., 2004). In other words, it would have a multifactor structure.
The internal structure (―internal consistency‖) is analysed using
Cronbach‘s alpha, inter-item and item-total correlations, to assess the
consistency of the item content so ensuring that all the items in a questionnaire
are measuring the same underlying construct (Clark and Watson, 1995;
Cortina, 1993; Table 1). For instance, a Cronbach‘s alpha score α > 0.7
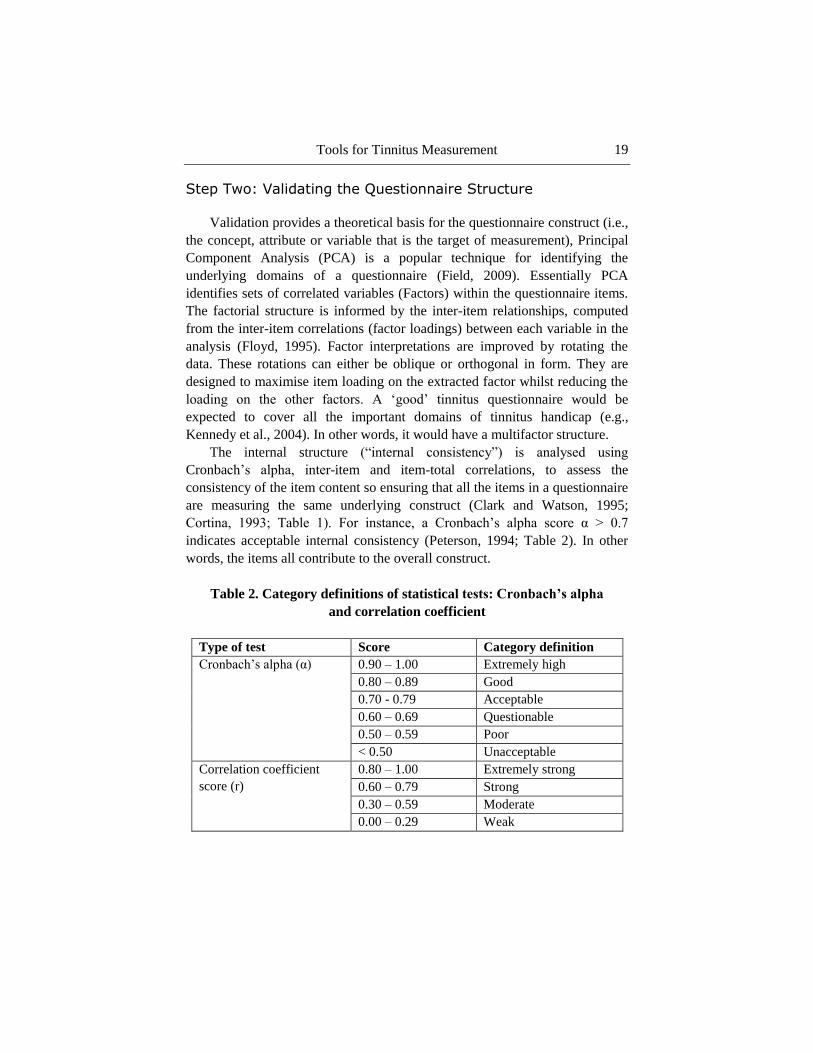
indicates acceptable internal consistency (Peterson, 1994; Table 2). In other
words, the items all contribute to the overall construct.
Table 2. Category definitions of statistical tests: Cronbach’s alpha
and correlation coefficient
Type of test Score Category definition
Cronbach‘s alpha (α) 0.90 – 1.00 Extremely high
0.80 – 0.89 Good
0.70 - 0.79 Acceptable
0.60 – 0.69 Questionable
0.50 – 0.59 Poor
< 0.50 Unacceptable
Correlation coefficient
score (r)
0.80 – 1.00 Extremely strong
0.60 – 0.79 Strong
0.30 – 0.59 Moderate
0.00 – 0.29 Weak
Kathryn Fackrell, Deborah A. Hall, Johanna Barry et al. 20
Step Three: Validating the Questionnaire Construct
To ascertain relevant and useful interpretations that ‗truly‘ reflect the
individual‘s perceived ability, the questionnaire should reliably measure the
target construct health behaviour (Newman and Sandridge, 2004). A
questionnaire should be assessed for the extent to which it actually measures
the target construct it purports to measure (―construct validity‖). Any new
questionnaire should be compared, using correlation coefficients, to existing
questionnaires that measuring constructs that are theoretically similar
(―convergent validity‖) or constructs that are independent (―discriminant
validity‖). For example, a new tinnitus questionnaire would be expected to
show relatively high correlations (i.e., high convergence) with other tinnitus
questionnaires, and relatively low correlations (i.e., high discriminance) with
generalised depression, anxiety and hearing handicap questionnaires because
these represent theoretically distinct constructs (see Table 2).
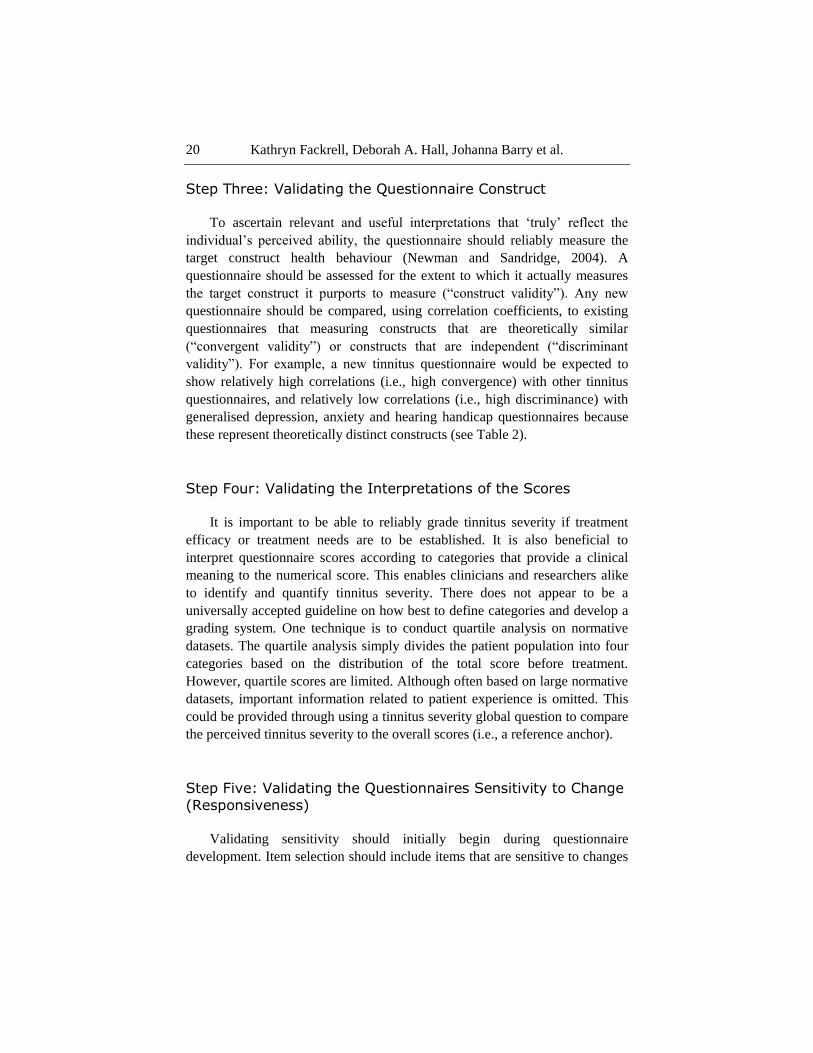
Step Four: Validating the Interpretations of the Scores
It is important to be able to reliably grade tinnitus severity if treatment
efficacy or treatment needs are to be established. It is also beneficial to
interpret questionnaire scores according to categories that provide a clinical
meaning to the numerical score. This enables clinicians and researchers alike
to identify and quantify tinnitus severity. There does not appear to be a
universally accepted guideline on how best to define categories and develop a
grading system. One technique is to conduct quartile analysis on normative
datasets. The quartile analysis simply divides the patient population into four
categories based on the distribution of the total score before treatment.
However, quartile scores are limited. Although often based on large normative
datasets, important information related to patient experience is omitted. This
could be provided through using a tinnitus severity global question to compare
the perceived tinnitus severity to the overall scores (i.e., a reference anchor).
Step Five: Validating the Questionnaires Sensitivity to Change
(Responsiveness)
Validating sensitivity should initially begin during questionnaire
development. Item selection should include items that are sensitive to changes
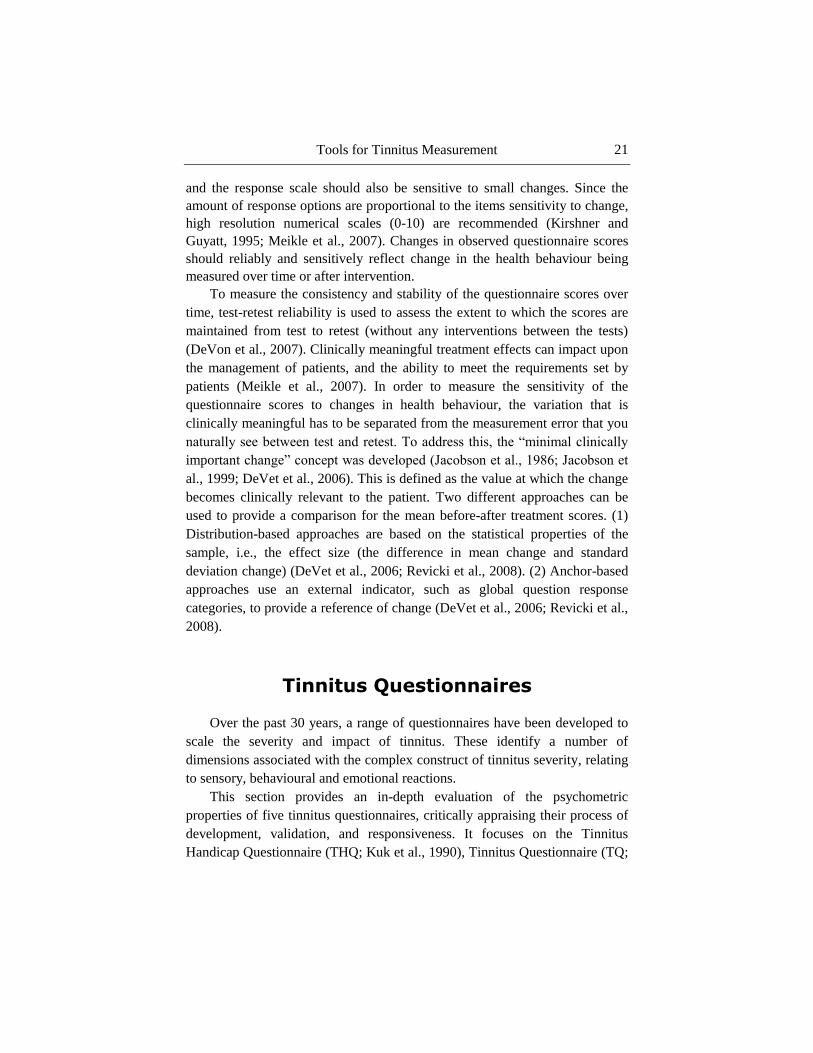
Tools for Tinnitus Measurement 21
and the response scale should also be sensitive to small changes. Since the
amount of response options are proportional to the items sensitivity to change,
high resolution numerical scales (0-10) are recommended (Kirshner and
Guyatt, 1995; Meikle et al., 2007). Changes in observed questionnaire scores
should reliably and sensitively reflect change in the health behaviour being
measured over time or after intervention.
To measure the consistency and stability of the questionnaire scores over
time, test-retest reliability is used to assess the extent to which the scores are
maintained from test to retest (without any interventions between the tests)
(DeVon et al., 2007). Clinically meaningful treatment effects can impact upon
the management of patients, and the ability to meet the requirements set by
patients (Meikle et al., 2007). In order to measure the sensitivity of the
questionnaire scores to changes in health behaviour, the variation that is
clinically meaningful has to be separated from the measurement error that you
naturally see between test and retest. To address this, the ―minimal clinically
important change‖ concept was developed (Jacobson et al., 1986; Jacobson et
al., 1999; DeVet et al., 2006). This is defined as the value at which the change
becomes clinically relevant to the patient. Two different approaches can be
used to provide a comparison for the mean before-after treatment scores. (1)
Distribution-based approaches are based on the statistical properties of the
sample, i.e., the effect size (the difference in mean change and standard
deviation change) (DeVet et al., 2006; Revicki et al., 2008). (2) Anchor-based
approaches use an external indicator, such as global question response
categories, to provide a reference of change (DeVet et al., 2006; Revicki et al.,
2008).
Tinnitus Questionnaires
Over the past 30 years, a range of questionnaires have been developed to
scale the severity and impact of tinnitus. These identify a number of
dimensions associated with the complex construct of tinnitus severity, relating
to sensory, behavioural and emotional reactions.
This section provides an in-depth evaluation of the psychometric
properties of five tinnitus questionnaires, critically appraising their process of
development, validation, and responsiveness. It focuses on the Tinnitus
Handicap Questionnaire (THQ; Kuk et al., 1990), Tinnitus Questionnaire (TQ;

Kathryn Fackrell, Deborah A. Hall, Johanna Barry et al. 22
Hallam et al., 1988; Hiller and Goebel, 1992), Tinnitus Reaction Questionnaire
(TRQ; Wilson et al., 1991), Tinnitus Handicap Inventory (THI; Newman et al.,
1996) which appear in practice recommendations by the UK Department of
Health and the international Tinnitus Research Initiative, and finally one of the
most recent questionnaires to be developed; the Tinnitus Functional Index
(TFI; Meikle et al., 2012).
In this section, the five questionnaires are presented in the order in which
they were developed. The five questionnaires are evaluated following the
validation steps above. Each questionnaire section starts with sections on
initial questionnaire development (validation step one), whether the
questionnaire covers all important tinnitus domains (validation step two), the
two components of construct validity (validation step three), the ability of the
questionnaire to grade tinnitus severity (validation step four) and the ability of
the questionnaire to be responsive to treatment (validation step five).
Tinnitus Questionnaire (TQ)
From the best available information, it appears that the Tinnitus
Questionnaire (TQ) was developed from the Tinnitus Effects Questionnaire
(TEQ) (Hallam et al., 1988). However, the literature is unclear; there is no
explicit description of the connection between these two questionnaires (see
Henry and Wilson, 1998; Kennedy et al., 2004). Therefore, it is assumed that
the TQ development started with Hallam et al. in 1988. Evidence from
literature on the TEQ (i.e., Henry and Wilson, 1998) where the description of
the questionnaire structure and scoring matches that of the TQ will be
reviewed.
The TQ was developed by researchers at Royal National Throat Nose and
Ear Hospital, London (Table 3; Hallam et al., 1988). Primarily designed to
measure tinnitus severity, it is also used to evaluate change and to examine the
relationship of different facets of complaint and other psychological variables
to tinnitus (Hallam, 2008). For each item, individuals indicate the level of
agreement using one of three response options; not true (0), partly true (1) and
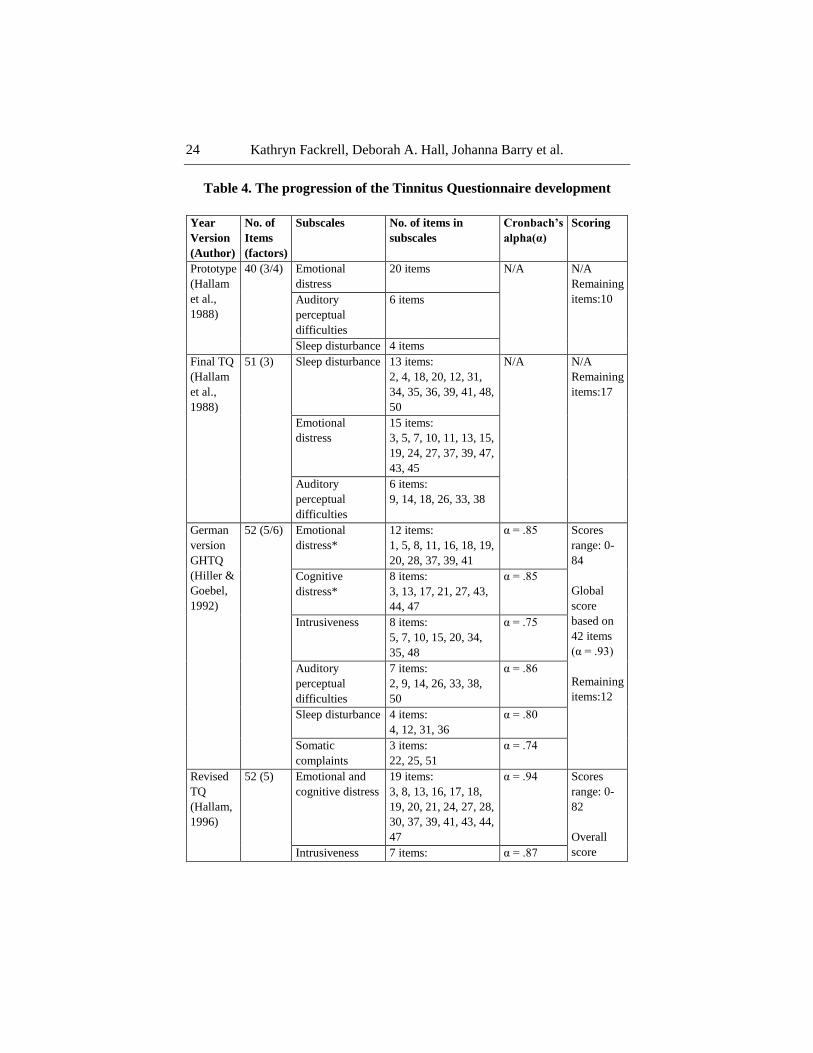
true (2). The total score is rescaled from the weighted sum of the items used in
each subscale (41 items) so that the global score ranges from 0 –82, with
higher scores indicating increased tinnitus distress (Table 4).

Tools for Tinnitus Measurement 23
Table 3. Characteristics and psychometric properties
of the five widely-used tinnitus questionnaires
Questionnaire
(Author,
year)
Response
options
No of items
Subscales
Reported aims
of measure
Psychometric
properties
No. of
participants
Tinnitus
Questionnaire
(TQ) (Hallam
et al., 1988;
Hallam, 1996,
2008)
3 levels:
True, partly
true, not true
52 items
5 subscales:
Emotional and
cognitive distress,
Intrusiveness,
Auditory Perceptual
difficulties, Sleep
disturbance, Somatic
complaints
Measures
psychological
aspects of
tinnitus
complaints and
distress
Cronbach‘s
Alpha
α = 0.91
106
Test-retest
reliability:
r = 0.94b
60
Tinnitus
Handicap
Questionnaire
(THQ) (Kuk
et al., 1990)
100 levels:
100 =
strongly
agree,
0 = strongly
disagree
27 items
3 subscales:
Physical, emotional &
social effects of
tinnitus, Hearing and
communication
ability, Individual‘s
perception of tinnitus
Measure of
patients‘
perceived
degree of
handicap due to
tinnitus
Cronbach‘s
Alpha
α = 0.94
275
Test-retest
reliability:
r = 0.89a
32
Tinnitus
Reaction
Questionnaire
(TRQ)
(Wilson et al.,
1991)
5 levels:
Not at all to
almost all the
time
26 items
No clear subscales
Measure
psychological
distress
associated with
tinnitus
Cronbach‘s
Alpha:
α = 0.96
156
Test-retest
reliability:
r = 0.88
43
Tinnitus
Handicap
Inventory
(THI)
(Newman
et al., 1996)
3 levels:
Yes
Sometimes
No
25 items
3 subscales:
Functional, Emotional,
Catastrophic
Measures the
level of
perceived
tinnitus
severity
Cronbach‘s
Alpha
α = 0.93
66
Test-retest
reliability:
r = 0.92c
29
Tinnitus
Functional
Index (TFI)
(Meikle et al.,
2012)
11 levels:
0 – 10
Descriptive
anchors vary
between
items
25 items
8 subscales:
Intrusiveness, Sense
of control, Sleep,
Cognition, Hearing,
Relaxation,
Emotional distress,
Quality of life
Developed to
measure both
tinnitus
severity and
treatment-
related changes
Cronbach‘s
Alpha
α = 0.97d
336
Test-retest
reliability:
r = 0.78d
27
a data from Newman et al., 1995.
b data from Hiller et al., 1994.
c data from Newman et al., 1998.
d 25-item prototype 2 data.
Kathryn Fackrell, Deborah A. Hall, Johanna Barry et al. 24
Table 4. The progression of the Tinnitus Questionnaire development
Year
Version
(Author)
No. of
Items
(factors)
Subscales No. of items in
subscales
Cronbach’s
alpha(α)
Scoring
Prototype
(Hallam
et al.,
1988)
40 (3/4) Emotional
distress
20 items N/A N/A
Remaining
items:10 Auditory
perceptual
difficulties
6 items
Sleep disturbance 4 items
Final TQ
(Hallam
et al.,
1988)
51 (3) Sleep disturbance 13 items:
2, 4, 18, 20, 12, 31,
34, 35, 36, 39, 41, 48,
50
N/A N/A
Remaining
items:17
Emotional
distress
15 items:
3, 5, 7, 10, 11, 13, 15,
19, 24, 27, 37, 39, 47,
43, 45
Auditory
perceptual
difficulties
6 items:
9, 14, 18, 26, 33, 38
German
version
GHTQ
(Hiller &
Goebel,
1992)
52 (5/6) Emotional
distress*
12 items:
1, 5, 8, 11, 16, 18, 19,
20, 28, 37, 39, 41
α = .85 Scores
range: 0-
84
Global
score
based on
42 items
(α = .93)
Remaining
items:12
Cognitive
distress*
8 items:
3, 13, 17, 21, 27, 43,
44, 47
α = .85
Intrusiveness 8 items:
5, 7, 10, 15, 20, 34,
35, 48
α = .75
Auditory
perceptual
difficulties
7 items:
2, 9, 14, 26, 33, 38,
50
α = .86
Sleep disturbance 4 items:
4, 12, 31, 36
α = .80
Somatic
complaints
3 items:
22, 25, 51
α = .74
Revised
TQ
(Hallam,
1996)
52 (5) Emotional and
cognitive distress
19 items:
3, 8, 13, 16, 17, 18,
19, 20, 21, 24, 27, 28,
30, 37, 39, 41, 43, 44,
47
α = .94 Scores
range: 0-
82
Overall
score Intrusiveness 7 items: α = .87
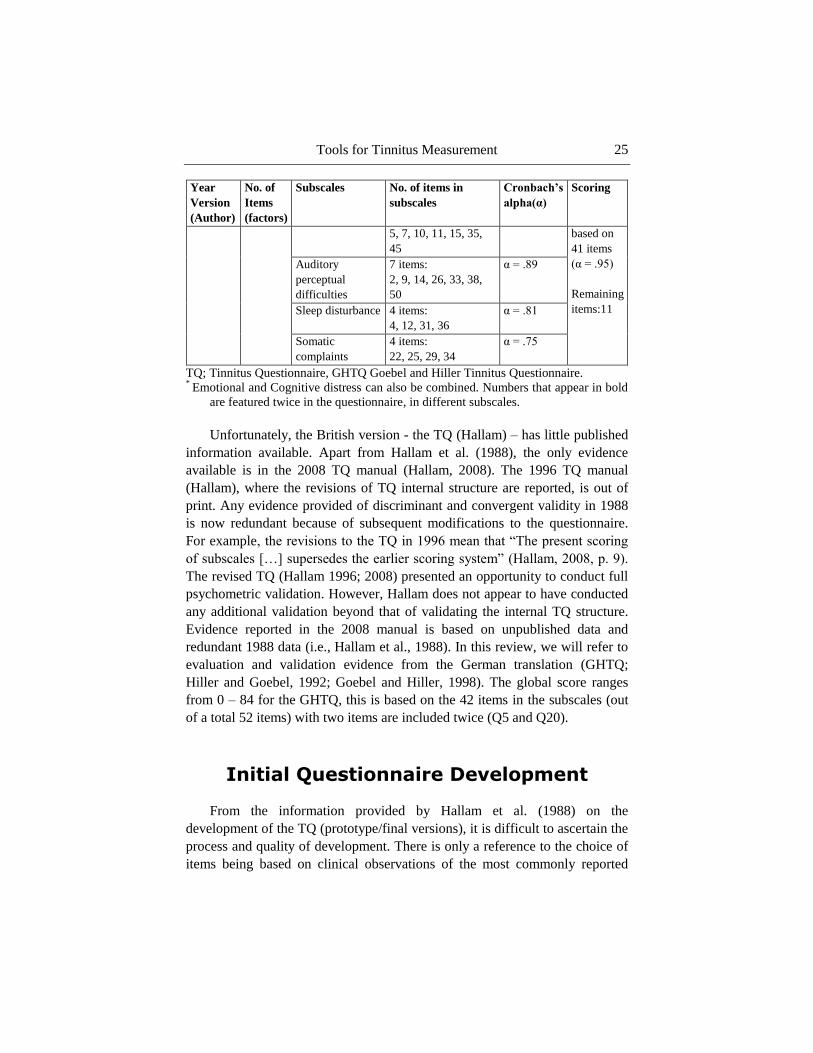
Tools for Tinnitus Measurement 25
Year
Version
(Author)
No. of
Items
(factors)
Subscales No. of items in
subscales
Cronbach’s
alpha(α)
Scoring
5, 7, 10, 11, 15, 35,
45
based on
41 items
(α = .95)
Remaining
items:11
Auditory
perceptual
difficulties
7 items:
2, 9, 14, 26, 33, 38,
50
α = .89
Sleep disturbance 4 items:
4, 12, 31, 36
α = .81
Somatic
complaints
4 items:
22, 25, 29, 34
α = .75
TQ; Tinnitus Questionnaire, GHTQ Goebel and Hiller Tinnitus Questionnaire. *
Emotional and Cognitive distress can also be combined. Numbers that appear in bold
are featured twice in the questionnaire, in different subscales.
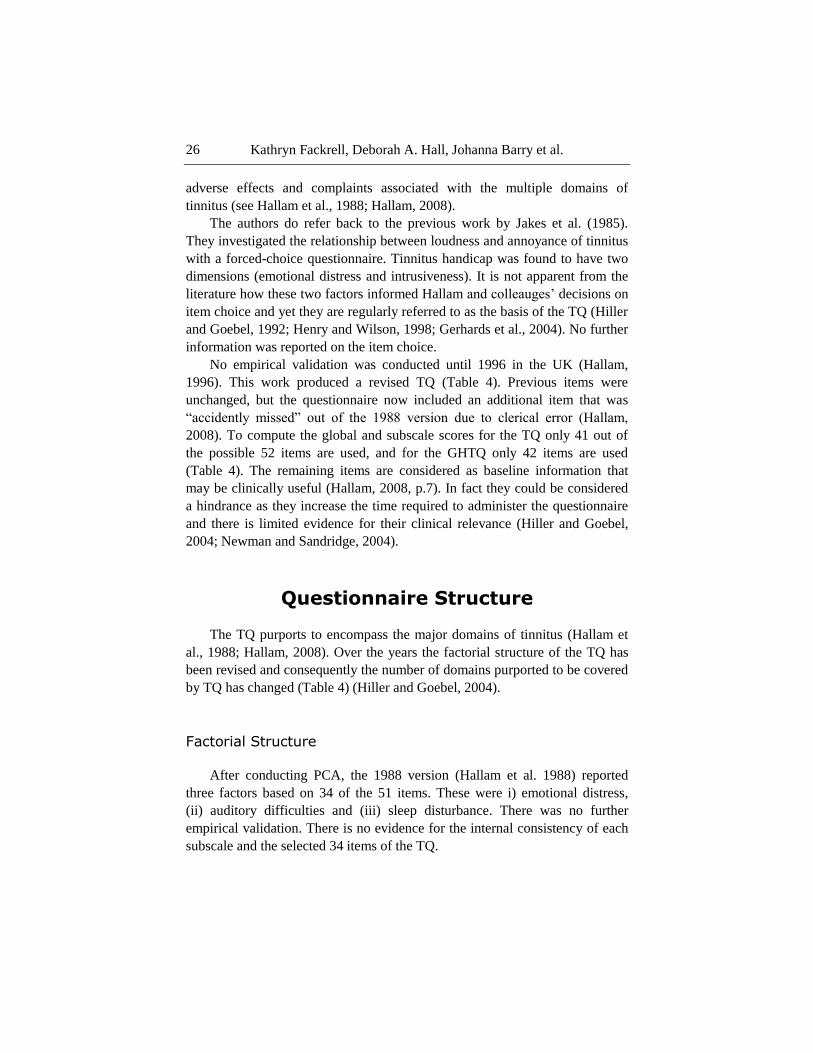
Unfortunately, the British version - the TQ (Hallam) – has little published
information available. Apart from Hallam et al. (1988), the only evidence
available is in the 2008 TQ manual (Hallam, 2008). The 1996 TQ manual
(Hallam), where the revisions of TQ internal structure are reported, is out of
print. Any evidence provided of discriminant and convergent validity in 1988
is now redundant because of subsequent modifications to the questionnaire.
For example, the revisions to the TQ in 1996 mean that ―The present scoring
of subscales […] supersedes the earlier scoring system‖ (Hallam, 2008, p. 9).
The revised TQ (Hallam 1996; 2008) presented an opportunity to conduct full
psychometric validation. However, Hallam does not appear to have conducted
any additional validation beyond that of validating the internal TQ structure.
Evidence reported in the 2008 manual is based on unpublished data and
redundant 1988 data (i.e., Hallam et al., 1988). In this review, we will refer to
evaluation and validation evidence from the German translation (GHTQ;
Hiller and Goebel, 1992; Goebel and Hiller, 1998). The global score ranges
from 0 – 84 for the GHTQ, this is based on the 42 items in the subscales (out
of a total 52 items) with two items are included twice (Q5 and Q20).
Initial Questionnaire Development
From the information provided by Hallam et al. (1988) on the
development of the TQ (prototype/final versions), it is difficult to ascertain the
process and quality of development. There is only a reference to the choice of
items being based on clinical observations of the most commonly reported
Kathryn Fackrell, Deborah A. Hall, Johanna Barry et al. 26
adverse effects and complaints associated with the multiple domains of
tinnitus (see Hallam et al., 1988; Hallam, 2008).
The authors do refer back to the previous work by Jakes et al. (1985).
They investigated the relationship between loudness and annoyance of tinnitus
with a forced-choice questionnaire. Tinnitus handicap was found to have two
dimensions (emotional distress and intrusiveness). It is not apparent from the
literature how these two factors informed Hallam and colleauges‘ decisions on
item choice and yet they are regularly referred to as the basis of the TQ (Hiller
and Goebel, 1992; Henry and Wilson, 1998; Gerhards et al., 2004). No further
information was reported on the item choice.
No empirical validation was conducted until 1996 in the UK (Hallam,
1996). This work produced a revised TQ (Table 4). Previous items were
unchanged, but the questionnaire now included an additional item that was
―accidently missed‖ out of the 1988 version due to clerical error (Hallam,
2008). To compute the global and subscale scores for the TQ only 41 out of
the possible 52 items are used, and for the GHTQ only 42 items are used
(Table 4). The remaining items are considered as baseline information that
may be clinically useful (Hallam, 2008, p.7). In fact they could be considered
a hindrance as they increase the time required to administer the questionnaire
and there is limited evidence for their clinical relevance (Hiller and Goebel,
2004; Newman and Sandridge, 2004).
Questionnaire Structure
The TQ purports to encompass the major domains of tinnitus (Hallam et
al., 1988; Hallam, 2008). Over the years the factorial structure of the TQ has
been revised and consequently the number of domains purported to be covered
by TQ has changed (Table 4) (Hiller and Goebel, 2004).
Factorial Structure
After conducting PCA, the 1988 version (Hallam et al. 1988) reported
three factors based on 34 of the 51 items. These were i) emotional distress,
(ii) auditory difficulties and (iii) sleep disturbance. There was no further
empirical validation. There is no evidence for the internal consistency of each
subscale and the selected 34 items of the TQ.
Tools for Tinnitus Measurement 27
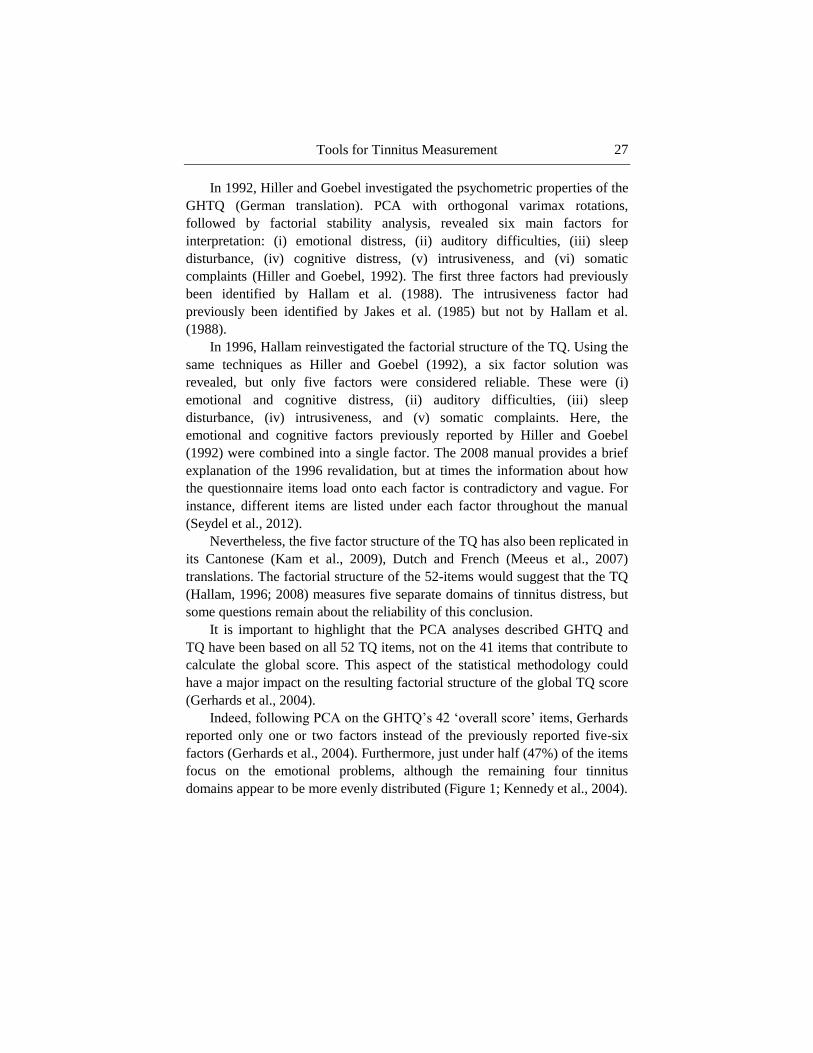
In 1992, Hiller and Goebel investigated the psychometric properties of the
GHTQ (German translation). PCA with orthogonal varimax rotations,
followed by factorial stability analysis, revealed six main factors for
interpretation: (i) emotional distress, (ii) auditory difficulties, (iii) sleep
disturbance, (iv) cognitive distress, (v) intrusiveness, and (vi) somatic
complaints (Hiller and Goebel, 1992). The first three factors had previously
been identified by Hallam et al. (1988). The intrusiveness factor had
previously been identified by Jakes et al. (1985) but not by Hallam et al.
(1988).
In 1996, Hallam reinvestigated the factorial structure of the TQ. Using the
same techniques as Hiller and Goebel (1992), a six factor solution was
revealed, but only five factors were considered reliable. These were (i)
emotional and cognitive distress, (ii) auditory difficulties, (iii) sleep
disturbance, (iv) intrusiveness, and (v) somatic complaints. Here, the
emotional and cognitive factors previously reported by Hiller and Goebel
(1992) were combined into a single factor. The 2008 manual provides a brief
explanation of the 1996 revalidation, but at times the information about how
the questionnaire items load onto each factor is contradictory and vague. For
instance, different items are listed under each factor throughout the manual
(Seydel et al., 2012).
Nevertheless, the five factor structure of the TQ has also been replicated in
its Cantonese (Kam et al., 2009), Dutch and French (Meeus et al., 2007)
translations. The factorial structure of the 52-items would suggest that the TQ
(Hallam, 1996; 2008) measures five separate domains of tinnitus distress, but
some questions remain about the reliability of this conclusion.
It is important to highlight that the PCA analyses described GHTQ and
TQ have been based on all 52 TQ items, not on the 41 items that contribute to
calculate the global score. This aspect of the statistical methodology could
have a major impact on the resulting factorial structure of the global TQ score
(Gerhards et al., 2004).
Indeed, following PCA on the GHTQ‘s 42 ‗overall score‘ items, Gerhards
reported only one or two factors instead of the previously reported five-six
factors (Gerhards et al., 2004). Furthermore, just under half (47%) of the items
focus on the emotional problems, although the remaining four tinnitus
domains appear to be more evenly distributed (Figure 1; Kennedy et al., 2004).

Kathryn Fackrell, Deborah A. Hall, Johanna Barry et al. 28
Figure 1. Questionnaires assessed on six domains with a different number of items
focussed on each domain: The Tinnitus Handicap Questionnaire (THQ), Tinnitus
Questionnaire (TQ), Tinnitus Reaction Questionnaire (TRQ), and Tinnitus Handicap
Inventory (THI). Adapted from Kennedy et al. (2004).
Internal Consistency
The 2008 manual reported the internal consistency (Cronbach‘s alpha) of
the TQ. Alpha estimates were extremely high for the total score and sleep
disturbance, good for emotional distress, auditory difficulties and
intrusiveness, and acceptable for somatic complaints (Table 4). These high
scores would suggest there is little variance between the individual items
(Cronbach, 1951).

Tools for Tinnitus Measurement 29
Questionnaire Construct
Construct Validity: Convergent Validity
The TQ measures constructs that are comparable to other tinnitus-related
questionnaires. High convergent validity for TQ and TEQ has been shown by
the strong correlations with the THQ, (r = 0.75), the TRQ (r = 0.74) (Henry
and Wilson, 1998; Robinson et al., 2003), and the THI total (r = 0.89) and
subscale scores (r = 0.79 to r = 0.86) (Baguley et al., 2000; Robinson et al.,
2003). The TQ also showed strong correlations with the Tinnitus Cognitions
Questionnaire (TCQ) negative subscale (r = 0.65) (Wilson and Henry, 1998).
Construct Validity: Discriminant Validity
The TQ demonstrates moderate to high discriminant validity indicating
that it does measure constructs that are distinct from more generalised
symptoms. The TQ shows moderately correlations with the Beck‘s Depression
Inventory (BDI; Beck et al., 1997) (r = 0.55) (Henry and Wilson, 1998;
Robinson et al., 2003), the Hamilton Rating Scale for Depression (Hamilton,
1960) (r = 0.48), the Modified Somatic Perception Questionnaire scores
(Main, 1983) (r = 0.46) and the Quality of Well-Being scale scores (Kaplan et
al., 1996) (r = -0.37; Robinson et al., 2003). It has weak to moderate
correlations with the Hopkins Symptom Checklist (SCL-90-R; Derogatis,
1977) (r = 0.26 to r = 0.39) (Hiller et al., 1994; Hiller and Goebel, 2004) and
weak correlations with the Private Self-Consciousness Scale scores (Fenigstein
et al., 1975) (r = 0.21; Robinson et al., 2003).
Interpretation of the Scores
Hallam (2008) suggests that quantifying tinnitus distress should be left to
the clinicians‘ discretion. Nevertheless, a grading system has been developed
for the GHTQ (Goebel and Hiller, 1998) which provides clinical meaning to
the scores. Gerhards et al. (2004) conducted quartile analysis on the data
collected from 683 tinnitus patients in Germany and confirmed the same range
of scores in the four categories. These data are summarised in Table 5.
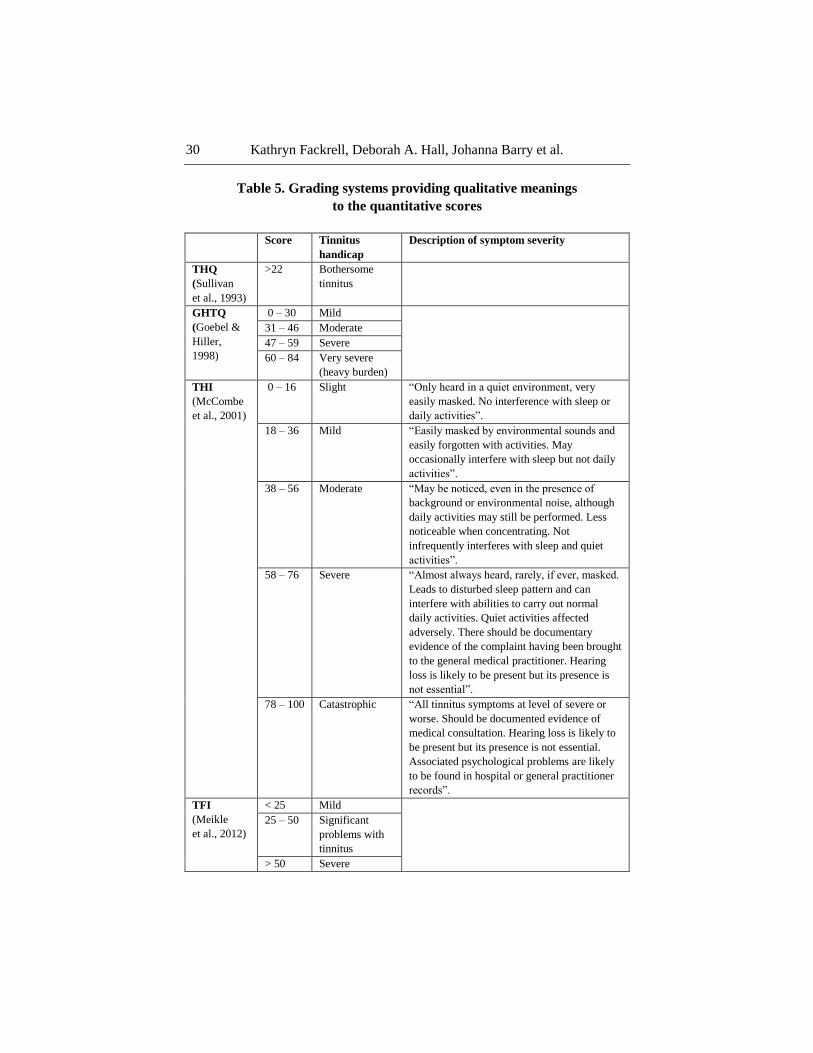
Kathryn Fackrell, Deborah A. Hall, Johanna Barry et al. 30
Table 5. Grading systems providing qualitative meanings
to the quantitative scores
Score Tinnitus
handicap
Description of symptom severity
THQ
(Sullivan
et al., 1993)
>22 Bothersome
tinnitus
GHTQ
(Goebel &
Hiller,
1998)
0 – 30 Mild
31 – 46 Moderate
47 – 59 Severe
60 – 84 Very severe
(heavy burden)
THI
(McCombe
et al., 2001)
0 – 16 Slight ―Only heard in a quiet environment, very
easily masked. No interference with sleep or
daily activities‖.
18 – 36 Mild ―Easily masked by environmental sounds and
easily forgotten with activities. May
occasionally interfere with sleep but not daily
activities‖.
38 – 56 Moderate ―May be noticed, even in the presence of
background or environmental noise, although
daily activities may still be performed. Less
noticeable when concentrating. Not
infrequently interferes with sleep and quiet
activities‖.
58 – 76 Severe ―Almost always heard, rarely, if ever, masked.
Leads to disturbed sleep pattern and can
interfere with abilities to carry out normal
daily activities. Quiet activities affected
adversely. There should be documentary
evidence of the complaint having been brought
to the general medical practitioner. Hearing
loss is likely to be present but its presence is
not essential‖.
78 – 100 Catastrophic ―All tinnitus symptoms at level of severe or
worse. Should be documented evidence of
medical consultation. Hearing loss is likely to
be present but its presence is not essential.
Associated psychological problems are likely
to be found in hospital or general practitioner
records‖.
TFI
(Meikle
et al., 2012)
< 25 Mild
25 – 50 Significant
problems with
tinnitus
> 50 Severe
Tools for Tinnitus Measurement 31
Sensitivity to Change
Hallam (2008) claimed that the ―Chief application of the TQ is in the
evaluation and auditing of psychological interventions for tinnitus‖ (p.7). The
evidence for this claim appears somewhat limited because the TQ items were
not selected to be specifically responsive to treatment-related changes. It
consequently lacks the required resolution to detect small changes in scores
(Meikle et al., 2008). In all versions of the TQ (Hallam et al., 1988; Hallam,
1996; 2008), no data has been provided to determine a clinically significant
change score following intervention (Newman and Sandridge, 2004).
Therefore, clinicians and researchers alike would be advised not to rely on the
TQ for auditing purposes or to determine minimal significant change.
Goebel et al. (2006) have categorised treatment effects using the TQ. They
concluded 6-14 point change in TQ scores was indicative of improvement, i.e.,
the patient was ―responding‖ to the treatment. They also classified a change of
≥15 points as a ―winning response‖, i.e., the patient was showing a large
improvement. However, an alternative minimal clinically important change
score for the GHTQ has been proposed by Adamchic et al. (2012). Using data
from both the Randomized Evaluation of Sound Evoked Treatment of Tinnitus
(RESET) trial study (N = 63) and Tinnitus Research Initiative (TRI) database
(N = 694), Adamchic et al. (2012) analysed 757 patient responses on the
GHTQ at baseline, clinical assessment and end of treatment. There was an
average of 44 days between baseline and clinical assessment. Adamchic et al.
(2012) used a combination of anchor-based and distribution-based techniques,
such as Clinical Global Impression Improvement (CGI-I) rating, Receiver
Operating Characteristic (ROC) curves and Standard Error Measurement
(SEM) to produce the minimal clinically important change score for
improvement. The CGI-I is an overall rating that uses up to seven response
options to quantify treatment-related change in health behaviour, i.e., patients
make a judgement on the total improvement of their tinnitus after treatment
(Table 6a, 6b). For the analysis, the patient groups were formed according to
the CGI scores. The seven CGI-I categories in the TRI database and the five
CGI-I categories in the RESET database were combined into five groups;
much better, minimally better, no change, minimally worse, much worse. The
authors examined the predicted minimal clinically important change scores for
each technique and choose the most representative score. The SEM scores
estimated the lowest change score of -4.7 but the ROC curve predictions of a
change score of -5 was considered most representative. This recommendation
differs from that of Goebel et al. (2006). It‘s derivation from a larger dataset
Kathryn Fackrell, Deborah A. Hall, Johanna Barry et al. 32
and using a combination of distribution-based and anchor-based methods,
potentially offers a more precise estimate of meaningful change.
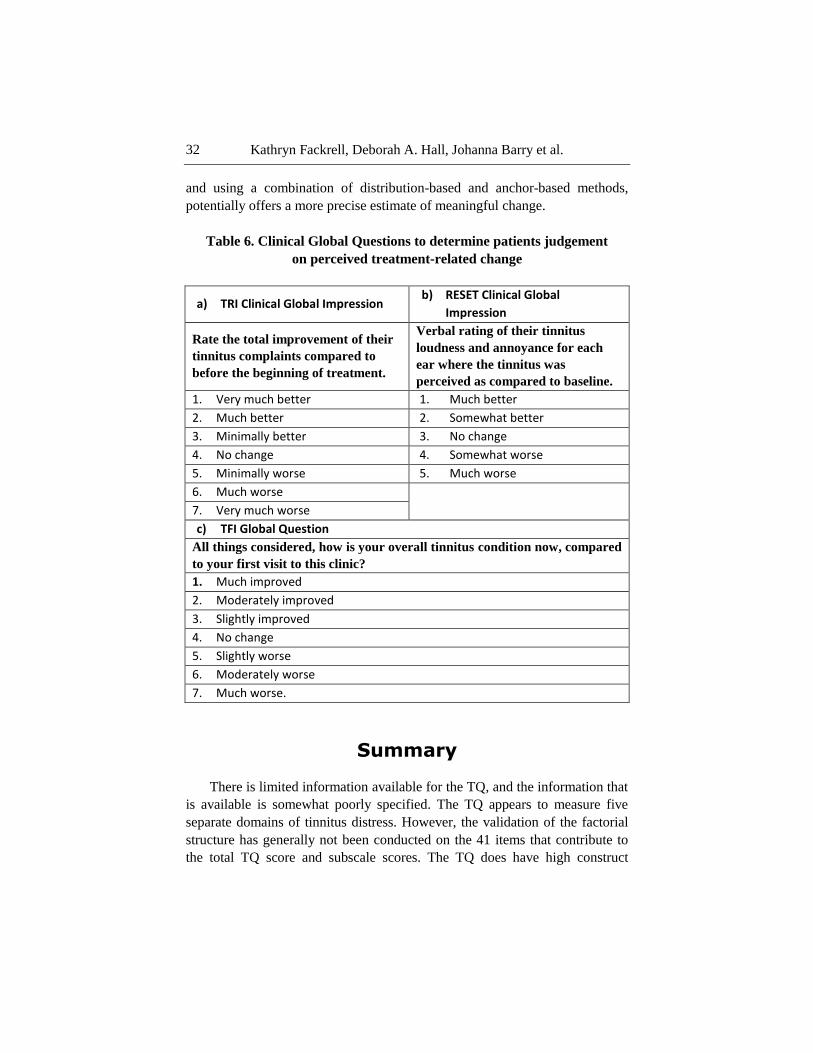
Table 6. Clinical Global Questions to determine patients judgement
on perceived treatment-related change
a) TRI Clinical Global Impression b) RESET Clinical Global
Impression
Rate the total improvement of their
tinnitus complaints compared to
before the beginning of treatment.
Verbal rating of their tinnitus
loudness and annoyance for each
ear where the tinnitus was
perceived as compared to baseline.
1. Very much better 1. Much better
2. Much better 2. Somewhat better
3. Minimally better 3. No change
4. No change 4. Somewhat worse
5. Minimally worse 5. Much worse
6. Much worse
7. Very much worse
c) TFI Global Question
All things considered, how is your overall tinnitus condition now, compared
to your first visit to this clinic?
1. Much improved
2. Moderately improved
3. Slightly improved
4. No change
5. Slightly worse
6. Moderately worse
7. Much worse.
Summary
There is limited information available for the TQ, and the information that
is available is somewhat poorly specified. The TQ appears to measure five
separate domains of tinnitus distress. However, the validation of the factorial
structure has generally not been conducted on the 41 items that contribute to
the total TQ score and subscale scores. The TQ does have high construct
Tools for Tinnitus Measurement 33
validity and would appear to measure tinnitus severity, although patient
experience was potentially overlooked during the development of the grading
system. Recently there have been attempts to overcome the lack of evidence
for minimal clinically important change scores, with some success.
Tinnitus Handicap Questionnaire (THQ)
The 27-item THQ was developed to comprehensively measure a patient‘s
tinnitus handicap and to be sensitive to the changes in handicap over time
(Kuk et al., 1990). It is claimed to measure three broad domains of tinnitus
handicap: (i) the impact of tinnitus on social, emotional and physical aspects,
(ii) hearing ability and unease, and (iii) the individuals‘ perception of their
tinnitus (Table 3). For each item on the THQ, the individual is asked to
indicate how much he/she disagrees or agrees with the statement with a
number between 0 (strong disagree) and 100 (strongly agree). The total score
is rescaled from the weighted sum of all the items in each subscale so that the
global score ranges from 0 – 100, with a higher score indicating greater
handicap.
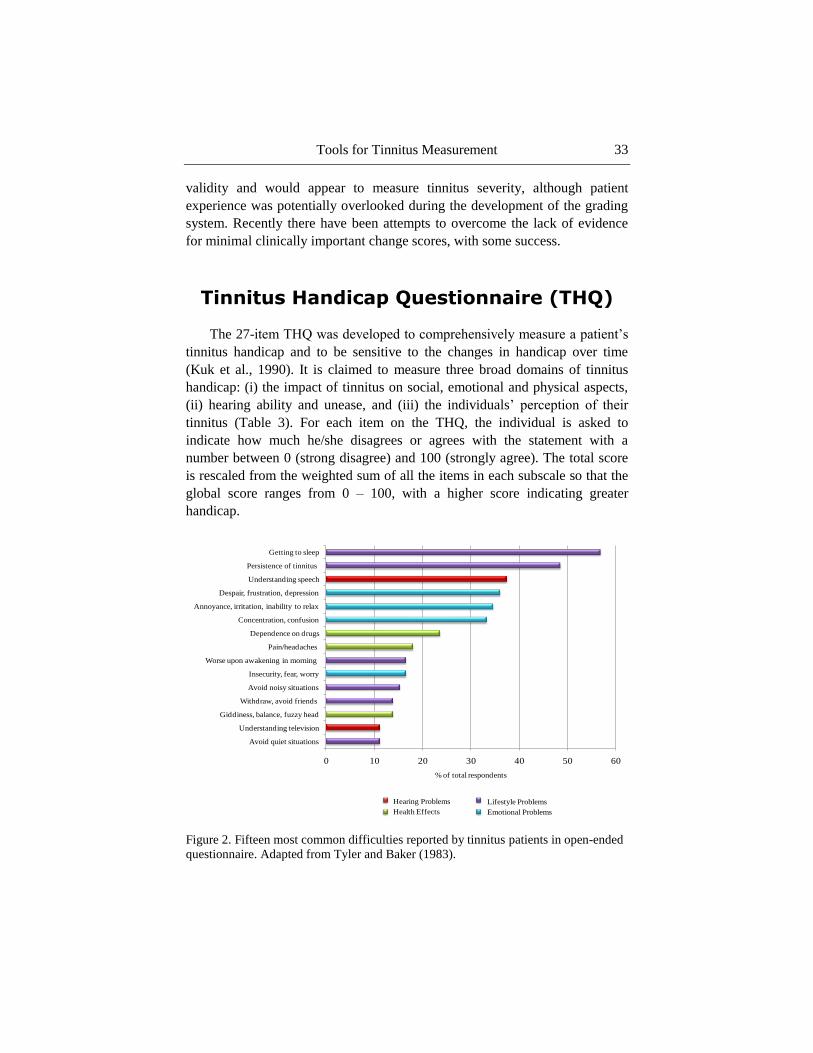
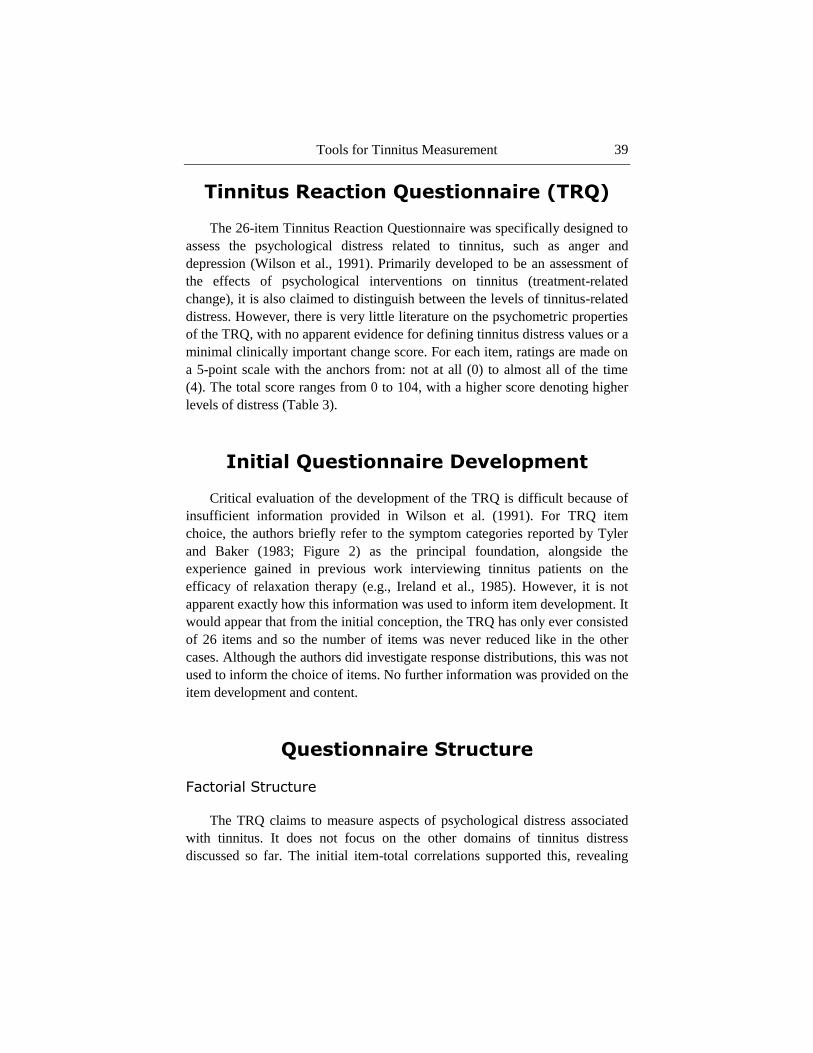
Figure 2. Fifteen most common difficulties reported by tinnitus patients in open-ended
questionnaire. Adapted from Tyler and Baker (1983).
0 10 20 30 40 50 60
Avoid quiet situations
Understanding television
Giddiness, balance, fuzzy head
Withdraw, avoid friends
Avoid noisy situations
Insecurity, fear, worry
Worse upon awakening in morning
Pain/headaches
Dependence on drugs
Concentration, confusion
Annoyance, irritation, inability to relax
Despair, frustration, depression
Understanding speech
Persistence of tinnitus
Getting to sleep
% of total respondents
Hearing Problems
Health Effects
Lifestyle Problems
Emotional Problems
Kathryn Fackrell, Deborah A. Hall, Johanna Barry et al. 34
Initial Questionnaire Development
At the first step in the development, the authors obtained the 87 items
directly from Tyler and Baker (1983; Figure 2) which were ―arbitrarily‖
grouped into four domains that reflect tinnitus handicap (i.e., hearing, lifestyle,
health, and emotion).
The authors briefly refer an additional domain on ―others‘ reaction to
tinnitus‖, but it is unclear how this additional domain was derived. Kuk et al.
(1990) systematically reduced the initial 87 items to the final 27-item
questionnaire, by sampling items that were sensitive to perceived tinnitus
handicap. They did this by examining (i) response frequency distributions, (ii)
inter-item correlations, and (iii) item-total correlations.
i. Items were eliminated based on their ability to differentiate between
individual responses, i.e., the sensitivity of item. Items were assumed
to be insensitive, if they were scored with either a 0 or 100 on the
response options over 50% of the time. However, the authors do not
clearly explain why they chose this criterion and it was applied
inconsistently at this development stage. For example, the developers
retained items with 50% ―0‖ ratings because they ―meet other criteria‖
(not specified).
ii. Highly correlated items were examined. The specific criterion value
for high inter-item correlations was not reported, although an example
of r > 0.60 was given as an example of redundant items. Multiple
items that reflected the same situation, for example listening in quiet,
were considered redundant. The most representative item of them was
kept, whilst the rest of the redundant items were eliminated.
iii. Items were eliminated based on their ―low‖ item-total correlations in
order to maximise internal consistency. However, the specific cut-off
value for a low item-total correlation was not reported. The authors
considered the response frequency distributions (sensitivity) before
eliminating the item based on the internal consistency scores. Two
items were kept despite their low item-total scores.
Tools for Tinnitus Measurement 35
Questionnaire Structure
Factorial Structure
Having conducted PCA and oblique rotations on the THQ, three factors
were clearly identified (Kuk et al., 1990). Factor 1 represents social, emotional
and physical functioning (15 items). Factor 2 represents hearing ability and
unease (8 items), and factor 3 represents individual perception of tinnitus (4
items). Factors 1 and 2 were moderately correlated (r = 0.49), but both were
only very weakly correlated (r = 0.10, r = 1.16 respectively) with factor 3.
Items on factor 3 also resulted in extremely low item-total correlation scores
(r = 0.15) suggesting that it is potentially measuring separate variables to
factors 1 and 2. Finally, the majority of items loaded onto factor 1 with some
overlap of items onto factor 2 indicating that the THQ is particularly sensitive
to the social, emotional and physical functioning aspects of tinnitus distress.
This is consistent with Kennedy et al.‘s (2004) critical review. Kennedy
designated the items according to the six categories highlighted by Tyler and
Baker‘s open questionnaire study (1983) and found that the THQ places little
emphasis on issues to do with sleep deprivation, cognitive disturbance or
impact on health and well-being (Kennedy et al., 2004; Figure 1).
Internal Consistency
The THQ demonstrated extremely high Cronbach‘s alpha for both the
THQ total (α = 0.94) and for factor 1 (α = 0.94). These high alpha values could
reflect the low uniqueness of the items content (Cortina, 1993). Some items
could essentially be asking the same question in a different guise and therefore
reflecting unnecessary duplication of content (Streiner, 2003). This provides
additional evidence of a factorial structure that mainly focuses on a limited
number of tinnitus domains. Factor 2 had a good Cronbach‘s alpha (α = 0.88)
(Kuk et al., 1990). Factor 3 however, achieved unacceptable Cronbach‘s alpha
(α = 0.47). Kuk et al. (1990) attributed this unacceptable score to the small
number of items in the subscale and the low inter-item correlation.
Alternatively, factor 3 might measure unrelated items that are not reflecting
the overall concept of ―Individual perception of tinnitus‖. If this were true then
it would not be contributing any additional value to the overall concept of
tinnitus handicap (Cortina, 1993; Tavakol and Dennick, 2011).
Kathryn Fackrell, Deborah A. Hall, Johanna Barry et al. 36
Questionnaire Construct
Construct Validity: Convergent Validity
During the THQ development, the THQ displayed moderate correlations
with average hearing thresholds (r = 0.52) and perceived tinnitus loudness (r =
0.57) (Kuk et al., 1990). Since then, the THQ has also been found to have
strong correlations with the TQ (r = 0.75), the TRQ scores (r = 0.74) (Henry
and Wilson, 1998) and the THI scores (r = 0.76; Robinson et al., 2003).
Overall, the THQ demonstrates high convergent validity and therefore
successfully measures aspects of tinnitus distress similar to other tinnitus
questionnaires.
Construct Validity: Discriminant Validity
Low to moderate discriminant validity has been observed for the THQ.
The THQ indicates moderate discriminant validity, displaying weak
correlations with the Modified Somatic Perception Questionnaire scores
(r = 0.37) the Private Self-Consciousness Scale (r = 0.11; Robinson et al.,
2003), and moderate correlations with the life satisfaction scales (Lohmann,
1980) (r = 0.54), the physical health status subscale (r = 0.54), the general
health subscale (Duke-UNC Health profile; Parkerson et al., 1981) (r = 0.54;
Kuk et al., 1990) and the Quality of Well-Being scale (r = 0.48; Robinson et
al., 2003).
Nevertheless contradictory evidence indicates rather low discriminant
validity. For example, the THQ has been shown to highly correlate with the
Zung Self-Rating depression scale (Zung, 1965) (r = 0.63; Kuk et al., 1990)
and the BDI (r = 0.62; Robinson et al., 2003). Robinson et al. (2003) also
reported that the THQ moderately correlated with the Hamilton Rating Scale
for Depression (r = 0.57).
Overall, the evidence suggests that the THQ has low to moderate
discriminant validity and that it may be susceptible to generalised emotional
distress, rather than distress that is specific to the condition of tinnitus.
Tools for Tinnitus Measurement 37
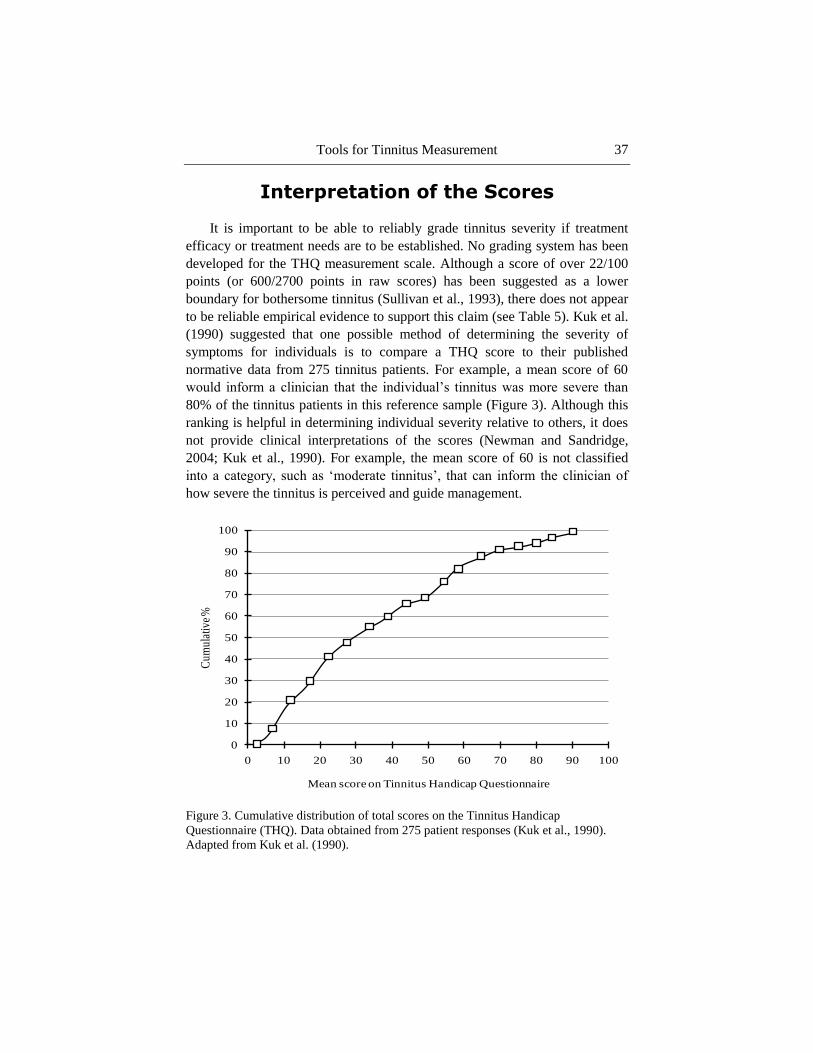
Interpretation of the Scores
It is important to be able to reliably grade tinnitus severity if treatment
efficacy or treatment needs are to be established. No grading system has been
developed for the THQ measurement scale. Although a score of over 22/100
points (or 600/2700 points in raw scores) has been suggested as a lower
boundary for bothersome tinnitus (Sullivan et al., 1993), there does not appear
to be reliable empirical evidence to support this claim (see Table 5). Kuk et al.
(1990) suggested that one possible method of determining the severity of
symptoms for individuals is to compare a THQ score to their published
normative data from 275 tinnitus patients. For example, a mean score of 60
would inform a clinician that the individual‘s tinnitus was more severe than
80% of the tinnitus patients in this reference sample (Figure 3). Although this
ranking is helpful in determining individual severity relative to others, it does
not provide clinical interpretations of the scores (Newman and Sandridge,
2004; Kuk et al., 1990). For example, the mean score of 60 is not classified
into a category, such as ‗moderate tinnitus‘, that can inform the clinician of
how severe the tinnitus is perceived and guide management.
Figure 3. Cumulative distribution of total scores on the Tinnitus Handicap
Questionnaire (THQ). Data obtained from 275 patient responses (Kuk et al., 1990).
Adapted from Kuk et al. (1990).
0
10
20
30
40
50
60
70
80
90
100
0 10 20 30 40 50 60 70 80 90 100
Cum
ulat
ive
%
Mean score on Tinnitus Handicap Questionnaire

Kathryn Fackrell, Deborah A. Hall, Johanna Barry et al. 38
Sensitivity to Change
The THQ was primarily developed to effectively evaluate treatment-
related change, with less emphasis placed on its ability to discriminate
between diagnostic categories (Kuk et al., 1990). The THQ has high resolution
response options (0 -100), allowing for small changes in the scores to be
detected. High test-retest reliability has been observed, with strong
correlations between administrations for the total THQ scores (r = 0.89), factor
1 scores (r = 0.89) and factor 2 scores (r = 0.90) (Newman et al., 1995).
Therefore, the global THQ score, and scores for factors 1 and 2 are stable
across time. Changes can therefore probably be attributed to treatment-related
effects. In contrast, factor 3 only showed moderate correlations (r = 0.50),
suggesting that any changes shown over time could in fact be due to SEM
rather than treatment-related effects.
Despite being specifically designed to maximise treatment responsiveness,
Kuk et al. (1990) report no information on a minimal clinically important
change score. The evidence for a minimal change score is dependent on the
test-retest reliability data (Newman et al., 1995). From calculating the 95%
confidence intervals (variance around the scores between administrations) with
the SEM, Newman et al. (1995) conclude that a mean global THQ score would
have to change by 21 points for the change to be considered clinically
significant. However, this value maybe slightly compromised by lack of
consistency and reproducibility shown by factor 3.
Summary
In conclusion, the development process of the THQ was informative and
in general clearly reported, but there was a lack of clarity over the criterion
scores for eliminating items. The THQ appears to cover some aspects of
tinnitus distress but the emotional aspects seems to be the main contributor to
global score. The usefulness and reliability of the three subscales is
questionable. Factor 3 does not appear to add any further value to the
questionnaire and is deemed to have a heterogeneous construct. Nevertheless,
the THQ does show high convergent validity with other tinnitus
questionnaires. There is no grading system to provide clinical meaning to the
scores and a clinically meaningful change score has been suggested but it may
be compromised by the limitations of factor 3.
Tools for Tinnitus Measurement 39
Tinnitus Reaction Questionnaire (TRQ)
The 26-item Tinnitus Reaction Questionnaire was specifically designed to
assess the psychological distress related to tinnitus, such as anger and
depression (Wilson et al., 1991). Primarily developed to be an assessment of
the effects of psychological interventions on tinnitus (treatment-related
change), it is also claimed to distinguish between the levels of tinnitus-related
distress. However, there is very little literature on the psychometric properties
of the TRQ, with no apparent evidence for defining tinnitus distress values or a
minimal clinically important change score. For each item, ratings are made on
a 5-point scale with the anchors from: not at all (0) to almost all of the time
(4). The total score ranges from 0 to 104, with a higher score denoting higher
levels of distress (Table 3).
Initial Questionnaire Development
Critical evaluation of the development of the TRQ is difficult because of
insufficient information provided in Wilson et al. (1991). For TRQ item
choice, the authors briefly refer to the symptom categories reported by Tyler
and Baker (1983; Figure 2) as the principal foundation, alongside the
experience gained in previous work interviewing tinnitus patients on the
efficacy of relaxation therapy (e.g., Ireland et al., 1985). However, it is not
apparent exactly how this information was used to inform item development. It
would appear that from the initial conception, the TRQ has only ever consisted
of 26 items and so the number of items was never reduced like in the other
cases. Although the authors did investigate response distributions, this was not
used to inform the choice of items. No further information was provided on the
item development and content.
Questionnaire Structure
Factorial Structure
The TRQ claims to measure aspects of psychological distress associated
with tinnitus. It does not focus on the other domains of tinnitus distress
discussed so far. The initial item-total correlations supported this, revealing
Kathryn Fackrell, Deborah A. Hall, Johanna Barry et al. 40
high correlations between the items (ranged from r = 0.44 to 0.81) with the
majority scoring r > 0.70, indicating that the TRQ measures a narrow range of
tinnitus characteristics. PCA and orthogonal rotation revealed four factors
related to psychological distress; (i) general distress (15 items), (ii)
interference (9 items), (iii) severity (8 items), and (iv) avoidance (3 items)
(Wilson et al., 1991). The analysis revealed that the majority of items loaded
on more than one factor. For example, the majority of the items on the
―interference‖ factor also load onto the ―severity‖ factor. This indicates that
the four factor solution is not representing distinctive subscales and that there
is little value in looking at the factors individually.
Wilson et al. (1991) did also describe a two factor solution, where the
majority of items loaded on factor 1, with six items loading on factor 2
(avoidance). The authors do not define factor 1. Again, there is evidence of
cross loading, with the six items from factor 2 also loading on factor 1.
However, Wilson et al. (1991) do not elaborate on the criterion value for factor
loading and no loading scores were reported. Overall the evidence suggests a
unidimensional structure to the TRQ. This interpretation is consistent with
Kennedy et al.‘s (2004) analysis of the individual items in the TRQ which
found that >75% of items addressed the psychological and emotional effects
(see Figure 1).
Wilson et al. (1991) recommend that the separate scores from the two
factor solution, not the four factor solution, might be used to explain individual
differences in tinnitus distress. Although this recommendation was made, it
would appear not to have been followed by subsequent researchers. For
example, the TRQ is often interpreted as having four valid subscales derived
from the four factor solution (see Kennedy et al., 2004; Newman and
Sandridge, 2004; Holgers et al., 2003).
Internal Consistency
The TRQ has also been shown to have excellent internal consistency for
all 26 items in different populations (α = 0.96) suggesting that all the items are
measuring overlapping aspects of psychological distress (Wilson et al., 1991).
Tools for Tinnitus Measurement 41
Questionnaire Construct
Construct Validity: Convergent Validity
Although there is limited evidence for convergent validity, we conclude
that the TRQ appears to have high convergent validity. Robinson et al. (2003)
reported that the TRQ highly correlates with the THQ (r = 0.78), the TQ (r =
0.82) and the THI (r = 0.88).
Construct Validity: Discriminant Validity
There is a large body of evidence which, taken overall, indicates that the
TRQ has low discriminant validity and hence is sensitive to generalised
emotional distress. Wilson et al. (1991) tested the TRQ in three different
populations and found that in all three samples the TRQ strongly correlated
with anxiety scales: Taylor Manifest anxiety scale (Bendig, 1956; r = 0.66)
and Spielberger state-trait anxiety inventory (Spielberger et al., 1970; r =
0.58/60 to r = 0.71/74). Furthermore, that there were extremely strong
correlations between the TRQ and the BDI (r = 0.63/87) (Wilson et al., 1991).
Strong correlations have also been replicated by Robinson et al. (2003) and
Andersson et al. (2003). Robinson et al. (2003) reported that the TRQ strongly
correlated with BDI (r = 0.66) and moderately correlated with the Hamilton
Rating Scale for Depression (r = 0.52). Andersson et al. (2003) reported strong
correlations with the Hospital Anxiety and Depression scales (r = 0.69 for
depression and r = 0.72 for anxiety). Robinson et al. (2003) observed that the
TRQ weakly correlates with the Private Self-Consciousness Scale (r = 0.20)
and moderately correlates with the Quality of Well-Being scale (r = -0.39) and
the Modified Somatic Perception Questionnaire (r = 0.53).
Interpretation of the Scores
The TRQ was developed to distinguish levels of tinnitus-related distress.
Evidence for the TRQ as a measure of tinnitus severity is limited. Although,
Wilson et al. (1991) claim that the TRQ is a useful screening questionnaire
that can distinguish tinnitus sufferers, no grading system for categorising
tinnitus severity has been explicitly developed.
Kathryn Fackrell, Deborah A. Hall, Johanna Barry et al. 42
Sensitivity to Change
Despite claims to effectively evaluate the effects of psychological
interventions on tinnitus, Wilson et al. (1991) do not provide any evidence for
this psychometric property. For example, no research has been conducted to
find a minimal clinically important change score. Nevertheless the TRQ is
consistently used as evidence for the efficacy of interventions.
Wilson et al. (1991) did provide evidence of a high test-retest reliability (r
= 0.88) (over a retest period of 3 days to 3 weeks), suggesting that the TRQ is
stable across time. However, without a minimal clinically important change
score, the interpretation of any change in TRQ scores pre- and post-treatment
is difficult. For example, there is no way of knowing whether a change in
score of 2 points or 5 points is needed for the change to be considered
meaningful.
Summary
In conclusion, the information available on the development and structure
of the TRQ is unclear. The factorial structure and internal consistency seem to
point towards a unidimensional structure focusing on the emotional impact of
tinnitus, and the low discriminant validity indicates that this is generalised to
the same psychological domains as depression and anxiety. Clinical
interpretations of the TRQ scores are limited by the fact that no grading
system was developed for quantifying tinnitus severity and no minimal
clinically important change score has been recommended.
Tinnitus Handicap Inventory (THI)
The 25-item Tinnitus Handicap Inventory is reported to be a brief
diagnostic and screening tool that measures the impact of tinnitus on everyday
function (Newman et al., 1996). The THI consists of three response options;
yes (4 points), sometimes (2 points) and no (0 points). The total score is
rescaled from the weighted sum of all the items so that the global score ranges
from 0 – 100, with a higher score denoting increased levels of tinnitus distress
(Table 3). The THI was originally designed as a companion to the Hearing
Handicap Inventory for Elderly (HHIE, Ventry and Weinstein, 1982) and the

Tools for Tinnitus Measurement 43
Dizziness Handicap Inventory (DHI, Jacobson and Newman, 1990) to
complete a set of tools to quantify perceived handicap in a variety of hearing
related diseases, such as Ménière‘s disease (Newman and Sandridge, 2004).
Initial Questionnaire Development
Again, limited information makes it difficult to ascertain the exact process
behind the questionnaire development (Newman et al., 1996). Clinical
expertise certainly played a role. For example, Newman stated: ―The alpha-
THI consisted of 45-items derived empirically from case histories of patients
with tinnitus‖ (Newman et al., 1996, p. 144). Although, the authors infer that a
combination of content and face validity were used to source and develop the
items, the information provided is unclear. Some items were adapted from the
HHIE and the DHI, and also from Tyler and Baker (1983; see Fig 2). The THI
has adopted the identical response options and scoring as the DHI and HHIE.
No further information was provided on the item development and content.
The 45 items were reduced to 25 items (final version) using response
frequency distributions, item-total correlations, and content validity. Items
were eliminated if high endorsement rates for one response option were found,
or if item-total correlations were r ≤ 0.50. Newman et al. (1996) believed these
items were insensitive, discriminated little between subjects, and did not
represent the scale concept. There is little clarity on who conducted the content
validity, which items were removed and how the criteria were decided for the
frequency distribution elimination score (i.e., 85% patients selecting same
response) and for the item-total correlation scores (r ≤ 0.50).
Questionnaire Structure
Factorial Structure
Following the examination of the item content, a three-domain model for
the THI was proposed (Newman et al., 1996) to cover limitations in (i)
functioning (12 items: mental, social and physical), (ii) emotional response to
tinnitus (8 items), and (iii) the desperation associated with tinnitus (5 items:
catastrophic). However, the domain content (subscales) were solely based on

Kathryn Fackrell, Deborah A. Hall, Johanna Barry et al. 44
content validity and the questionnaire structure was not subjected to empirical
validation at the time.
In 2003, Baguley and Andersson investigated the theoretical factorial
structure and three domains originally proposed by Newman et al. (1996). The
THI scores were predefined into the three factor solution and subjected to
PCA. Initial item-total correlations were rather high (r = 0.60) for a scale
which assumes to be measuring a broad construct. This result suggests that the
THI is tapping only into narrow characteristics (Clark and Watson, 1995). In
contrast to the structure previously proposed, oblique rotation revealed that the
majority of items loaded onto the one factor reflecting functioning (19 items).
Factor 2 (emotional) and factor 3 (catastrophic) each consisted of 5 items,
some of which also loaded onto factor 1. The high overlap between factors
suggests that they are not distinctive from each other and are in fact measuring
the same latent variables (Zachariae et al., 2000). This unidimensional
structure is further evident in the THI Danish (Zachariae et al., 2000) and
Italian translations (Monzani et al., 2008), and in Kennedy et al.‘s (2004)
analysis of tinnitus questionnaires where the THI was shown to favour
psychological/emotional distress (68%; Figure 1). Therefore, despite
Newman‘s initial claim of a three-factor structure, the THI appears to be rather
unidimensional.
Internal Consistency
During the initial development process, the only analysis conducted was
Cronbach‘s alpha (Newman et al., 1996). This measure alone does not provide
a sufficient measure of the internal structure and its reliability. Validation of
the factorial structure is required too (Streiner, 2003; Cortina, 1993). Excellent
Cronbach‘s alpha scores were reported for the THI 25-items (α = 0.93)
suggesting that all the items measure the same underlying construct. High
scores such as this indicate redundancy of items and could be indicative of the
unidimensional structure, although internal consistency is not sufficient
evidence for homogeneity (Green et al., 1977; Schmitt, 1996). Both the
functional and emotional subscales showed high internal consistency (α = 0.86
and α = 0.87 respectively). The internal consistency for the catastrophic
subscale was questionable (α = 0.68), potentially due to the small number of
items in this scale. Coefficient alpha values are vulnerable to the number of
test items (Schmitt, 1996). Recent evidence suggests that the questionable
Cronbach‘s alpha score for catastrophic subscale is more likely to indicate a

Tools for Tinnitus Measurement 45
heterogeneous construct with poor inter-relatedness between the items
(Tavakol and Dennick, 2011).
Questionnaire Construct
Construct Validity: Convergent Validity
Overall, the THI has high convergent validity demonstrating that it
measures a construct that is comparable to other tinnitus questionnaires. The
THI shows strong correlations with the THQ (r = 0.78), the symptom rating
scales (r = 0.67 - 0.72) (Newman et al., 1996), the TQ (Spearman‘s r = 0.89)
(Baguley et al., 2000) and the TRQ (r = 0.89) (Robinson et al., 2003).
Construct Validity: Discriminant Validity
Overall, the THI measures a construct that is independent of generalised
emotional distress. Moderate discriminant validity for the THI has been
observed by the moderate correlations with the BDI (r = 0.32 - 0.58), the
Hamilton Rating Scale for Depression (r = 0.49) and the Quality of Well-
Being scale (r = -0.37) (Newman et al., 1996; Robinson et al., 2003). Weak to
moderate correlation with the Modified Somatic Perception Questionnaire
scores (r = 0.24 - 0.38) and the Private Self-Consciousness Scale (r = 0.23)
(Robinson et al., 2003).
Interpretation of the Scores
The THI was developed to grade tinnitus severity at intake assessment.
Developed by Newman et al. (1998) using the quartiles analysis on test-retest
reliability data, the grading system originally defined four categories (Table 5).
These categories were further developed by a UK working group (McCombe
et al., 2001). The authors recommended adopting a five category grading
system as a way to diagnose and screen tinnitus severity in clinical practice
(Table 5). This recommendation is based on the expert opinions and
knowledge. For example, ―[…] take the known epidemiological and clinical
data and with our own clinical, medico-legal and research experience to
Kathryn Fackrell, Deborah A. Hall, Johanna Barry et al. 46
produce a severity scale‖ (McCombe et al., 2001, p.26). No further evidence
has been reported for the development of these categories other than a
reference that the scores were based on Newman et al.‘s 1998 analysis. In turn,
no empirical evidence has been provided on the validity of the definitions.
This prompts questions about the reliability of these categories to provide
clinicians with valid meanings behind the scores.
Sensitivity to Change
The THI was not developed for use as an outcome measurement tool and
does not explicitly maximise the responsiveness to treatment-related effects
(Meikle et al., 2007). Nevertheless, it is used internationally as an outcome
measure for testing the effectiveness of therapeutic interventions and for
clinical research. Newman et al. (1998) conducted test-retest reliability to
assess stability over short time intervals. The THI showed high test-retest
reliability (r = 0.92) suggesting that a mean score would unlikely deviate more
than 7.0 points (based on SEM) between tests (Newman et al., 1998).
The variance around these scores (test and retest) produced the 95%
confidence intervals. From examining the 95% confidence interval and the
SEM, Newman et al. (1998) concluded that a reduction of ≥20 points is
required for the change to be classified as clinically meaningful (Newman et
al., 1998). However, this reduction is dependent on the intake assessment
score being >20 points, therefore potentially failing to observe the small
changes that occur in patients with slight or mild tinnitus distress (Table 5).
In 2011, Zeman et al. investigated the minimal clinically important change
required to show a noticeable improvement in the THI scores. They used an
anchor-based technique; CGI-I rating with seven response options (Table 6a).
Again, patient groups were formed according to the CGI-I scores (four groups:
much better, minimally better, no change, worse). The effect size (Cohen d)
separating the minimally better and no change groups (d = 0.5) was used
alongside the estimated standard deviation of the before-after difference (SD =
14) to calculate the minimum significant change for improvement (∆THI =
0.7). Therefore, patients perceived a THI score reduction of 7 points as a
meaningful improvement. This offers a more sensitive measure of
responsiveness in the THI compared to the previous scores suggested by
Newman et al. (1998), as it takes into account patient experience.

Tools for Tinnitus Measurement 47
Despite these attempts to produce a criterion for a significant change
score, the THI will always receive criticism for its inherent lack of sensitivity
in the three response options.
Summary
In conclusion, the THI may not be as robust as first proposed. There is
little clarity provided on the item development and it has a unidimensional
structure which emphasises the emotional aspects of tinnitus distress. A
grading system for quantifying tinnitus severity has been developed for the
THI and does provide useful clinical interpretation. Finally, there have been
attempts to provide a minimal clinically important change score.
Figure 4. Example of the response options format on the Tinnitus Functional Index.
Adapted from Meikle et al. (2012).
Tinnitus Functional Index (TFI)
The 25-item TFI was a large international collaboration of 21 investigators
(including 17 expert judges). It was specifically developed to be (i)
discriminative to provide measures of tinnitus distress, (ii) evaluative to
provide a responsive measure of treatment-related changes, and (iii)
comprehensive to cover multiple domains of tinnitus severity. For each item,
individuals are asked to rate their judgement on a scale of 0 -10. Each item
scale has descriptive anchors at either end that vary depending on the item
content (Figure 4). The total score is rescaled from the weighted sum of the
Over the PAST WEEK…….
What percentage of your time awake were you consciously AWARE OF your tinnitus?
Never aware Always aware0% 10% 20% 30% 40% 50% 60% 70% 80% 90% 100%
How STRONG or LOUD was your tinnitus?
Not at all strong or loud Extremely strong or loud0% 10% 20% 30% 40% 50% 60% 70% 80% 90% 100%
What percentage of your time awake were you ANNOYED by your tinnitus?
None of the time All of the time0% 10% 20% 30% 40% 50% 60% 70% 80% 90% 100%
Kathryn Fackrell, Deborah A. Hall, Johanna Barry et al. 48
items in each subscale so that the global score ranges from 0 to 100, with a
higher score denoting higher levels of distress (Table 3).
Initial Questionnaire Development
The report of the development is extremely detailed. Meikle et al. (2012)
reports the development of the TFI through prototype 1 and 2 to the final 25-
item questionnaire. Initially, 175 items were sourced from nine widely used
tinnitus questionnaires excluding ambiguous items (i.e., referring to multiple
subtopics) and overly negative items. The 175 items were assigned to 13
different domains of tinnitus handicap, on the consensus of all judges.
Duplicate items were reduced to one. Judges completed a three-point
responsiveness rating scale which also provided the basis for item selection.
Prototypes 1 and 2 were administered on four occasions at five or four sites
respectively. Both prototypes were completed by over 300 participants (the
first occasion). However it should be noted that there was a high dropout rate
after this first administration. The majority of the participants were recruited
from Veterans‘ Affairs (VA) hospitals. This is potentially problematic because
VA patients are not representative of the wider clinical population. The
majority of VA patients tend to be male and to experience severe tinnitus with
co-morbidities.
Forty-three items were used to create prototype 1 with a 0 – 10 response
scale. Thirteen items were removed after examination of response frequency
distributions, effect size and exploratory factor analysis. Eight items were
removed because the effect size for individuals whose tinnitus was unchanged
or worse (based on global question) was unacceptably large (i.e., 0.89) and
therefore considered unresponsive to perceived change. A variety of the
factorial structure techniques were used on prototype 1 data to inform item
choice and questionnaire structure. PCA followed by Principal Axis Factoring
and oblique rotations revealed eight factors (8 of the proposed 13 domains
were identified). A predefined ‗somatic‘ domain was removed due to low
factor loading for two items, one of which also showed floor effects (below the
desired lower limit of 2.0). The remaining three items were removed due to
low factor loadings or initial mean score. The criterion for low scores was not
reported. Thirty items remained after this analysis to create prototype 2.
Although the same examinations were conducted on prototype 2, none of these
findings appear to contribute to the decision to remove the final five items.
Tools for Tinnitus Measurement 49
This decision was based on ―careful examination‖ of the items (content
validity). The final version was a 25-item TFI with eight subscales (Table 3).
Questionnaire Structure
During the development of the TFI, reliability and validity testing (i.e.,
factor analysis, effect size and convergent/discriminant validity) were
conducted on prototypes 1 and 2. The final 25-item TFI has not yet been
subjected to a formal statistical validation. So far, evidence for its validation
comes from a re-analysis of the relevant subset of data collected using the 30-
item prototype 2. In this section, all the evidence provided is based on this re-
analysis.
Factorial Structure
The TFI covers eight different domains of tinnitus distress. The 30-item
prototype was subjected to PCA followed by Principal Axis Factoring, with
orthogonal and oblique rotations informing both model‘s factor extraction. The
eight factor solution revealed in prototype 1 was also clearly revealed for the
30-item prototype 2, despite the reduction in items.
To validate the factorial structure, the 25-item prototype 2 data was again
subjected to Principal Axis Factoring, with oblique rotations. The same eight
factors were clearly identified; (i) cognition (3 items), (ii) auditory (3 items),
(iii) intrusiveness (3 items), (iv) sleep (3 items), (v) relaxation (3 items), (vi)
QoL (4 items), (vii) emotional (3 items), and (viii) sense of control (3 items).
Only one item (TFI Q21) is shown to load on more than one factor (i.e.,
Cognitive and Quality of Life). The remaining 24 items load onto a single
factor, demonstrated by the high loading values.
Internal Consistency
The 25-item prototype 2 was shown to have an excellent Cronbach‘s alpha
score for all 25 items (α = 0.97) and for the eight subscales (range from α =
0.82 - 0.97). This score suggests that all the items in the questionnaire are
measuring a similar construct. The reliable factorial structure indicates that the

Kathryn Fackrell, Deborah A. Hall, Johanna Barry et al. 50
items are measuring different aspects of tinnitus distress, rather than the
presence of redundant items.
Questionnaire Construct
Construct Validity: Convergent Validity
There is limited evidence for convergent validity for the TFI. Presently,
there is only the evidence from the 25-item prototype 2 data. Meikle et al.
(2012) reported extremely strong correlations between the 25-item prototype 2
and the THI (r = 0.86), i.e., high convergent validity. Further evidence is
needed.
Construct Validity: Discriminant Validity
Again, there is limited evidence. The 25-item prototype 2 moderately
correlates with the BDI-primary care (r = 0.56), demonstrating moderate
discriminant validity with an independent measure of emotional distress.
Interpretation of the Scores
Meikle et al. (2012) did propose a grading system based on preliminary
data analysis using the 25-item prototype 2 data (Table 5). Throughout
development, the five categories (not a problem to a very big problem) from
the global severity question (i.e., how much of a problem is your tinnitus?)
have been compared to the mean scores from prototype 1 and 2. A strong
association between these scores has been shown throughout (p < 0.001).
Following these comparisons, the mean 25-item prototype 2 scores were
categorised based on the individual responses to the global severity question.
The response distributions of the total scores in these categories were
examined to produce the grading system (Table 5).
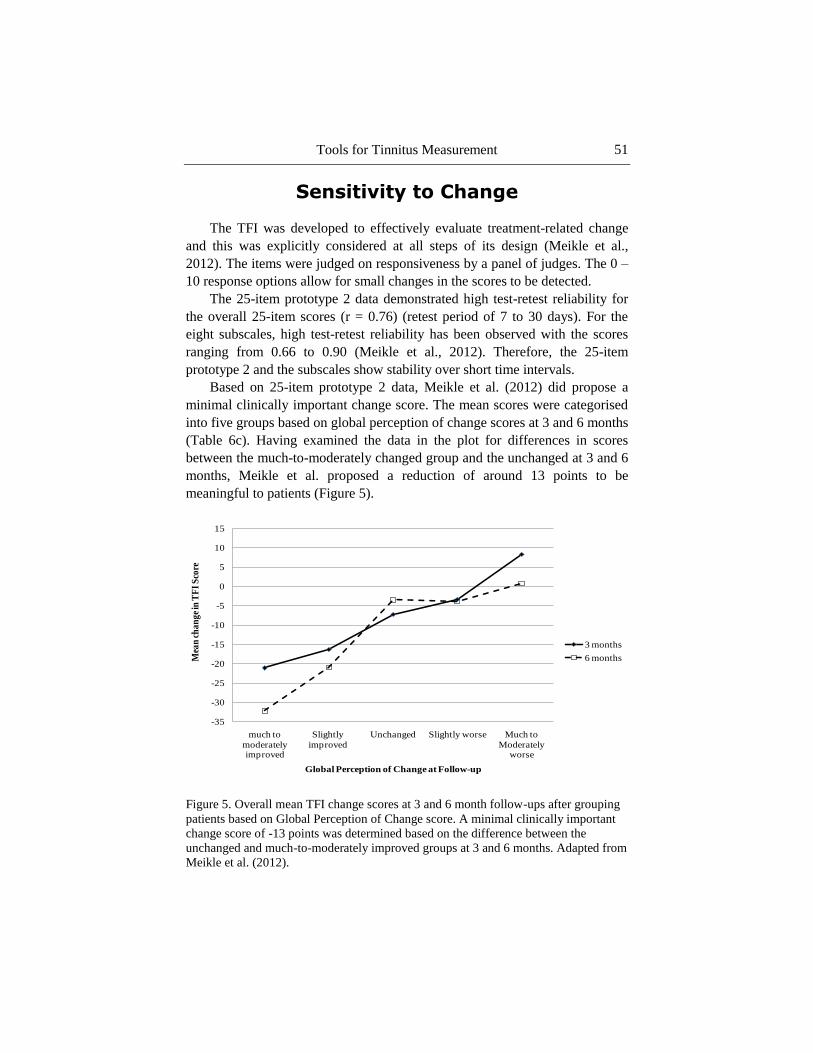
Tools for Tinnitus Measurement 51
Sensitivity to Change
The TFI was developed to effectively evaluate treatment-related change
and this was explicitly considered at all steps of its design (Meikle et al.,
2012). The items were judged on responsiveness by a panel of judges. The 0 –
10 response options allow for small changes in the scores to be detected.
The 25-item prototype 2 data demonstrated high test-retest reliability for
the overall 25-item scores (r = 0.76) (retest period of 7 to 30 days). For the
eight subscales, high test-retest reliability has been observed with the scores
ranging from 0.66 to 0.90 (Meikle et al., 2012). Therefore, the 25-item
prototype 2 and the subscales show stability over short time intervals.
Based on 25-item prototype 2 data, Meikle et al. (2012) did propose a
minimal clinically important change score. The mean scores were categorised
into five groups based on global perception of change scores at 3 and 6 months
(Table 6c). Having examined the data in the plot for differences in scores
between the much-to-moderately changed group and the unchanged at 3 and 6
months, Meikle et al. proposed a reduction of around 13 points to be
meaningful to patients (Figure 5).
Figure 5. Overall mean TFI change scores at 3 and 6 month follow-ups after grouping
patients based on Global Perception of Change score. A minimal clinically important
change score of -13 points was determined based on the difference between the
unchanged and much-to-moderately improved groups at 3 and 6 months. Adapted from
Meikle et al. (2012).
-35
-30
-25
-20
-15
-10
-5
0
5
10
15
much to
moderately improved
Slightly
improved
Unchanged Slightly worse Much to
Moderately worse
Mea
n c
ha
ng
e in
TF
I S
core
Global Perception of Change at Follow-up
3 months
6 months

Kathryn Fackrell, Deborah A. Hall, Johanna Barry et al. 52
Summary
The development process of the TFI is clearly described and the authors
provide clear, in-depth information on all of the steps that were followed. The
supplemental published information provides useful evidence from the
different prototypes. So far the evidence would suggest that the TFI covers
eight different domains of tinnitus distress, is comparable to at least one other
tinnitus questionnaire and is measuring more than just generalised emotional
distress. The authors have provided both a grading system and a minimal
clinically important change score, therefore providing clinical interpretations
to the TFI scores. However, this evidence is all based on preliminary data
analysis with a rather limited sample of participants. Despite the rigorous
validation conducted during the development of the TFI, the final TFI has not
been subjected to formal validation.
Conclusion
Our review seeks to promote quality assurance in validation research
concerning tinnitus questionnaires. Although beyond the scope of this book
chapter, we recommend that the ‗gold standard‘ would be to carry out a
systematic review of the literature before selecting any given tinnitus
questionnaire for a service audit or clinical trial. This would provide a
comprehensive and critical overview of the existing questionnaires available.
In addition to the measurement properties, selection might also give
consideration to the suitability of the tinnitus questionnaire for the study
population, the potential burden of completing the tinnitus questionnaire (e.g.,
length, question difficulty, emotional impact of certain questions), and the
practical aspects (e.g., copyright costs, complexity of scoring method). We
make the assumption that the questionnaire validation is conducted on a
sample of people with tinnitus that is representative of the population in which
the instrument is to be used.
Explicit quality criteria for studies on the development and evaluation of
tinnitus questionnaires help to legitimise recommendations about what is the
‗best‘ questionnaire for tinnitus handicap. A wide range of resources are
available to help the researcher develop questionnaire instruments and
evaluate existing tools. We draw the reader‘s attention to one useful web
resource that provides practical guidance on how to select, translate and
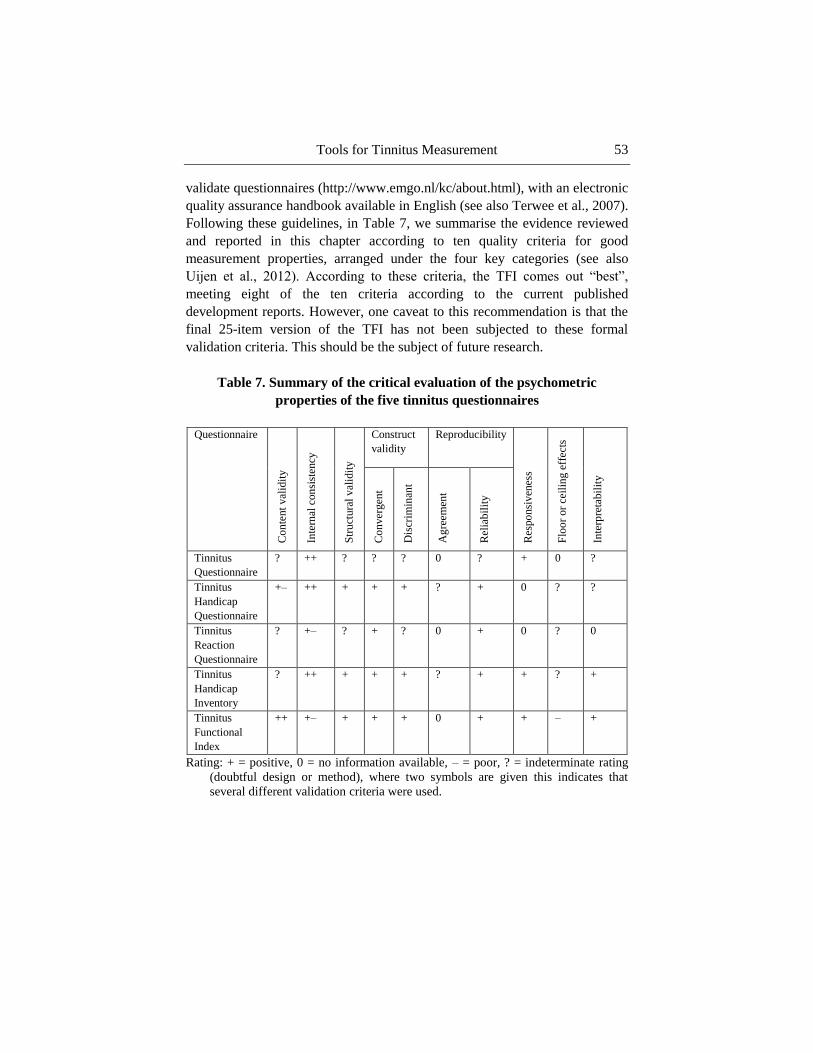
Tools for Tinnitus Measurement 53
validate questionnaires (http://www.emgo.nl/kc/about.html), with an electronic
quality assurance handbook available in English (see also Terwee et al., 2007).
Following these guidelines, in Table 7, we summarise the evidence reviewed
and reported in this chapter according to ten quality criteria for good
measurement properties, arranged under the four key categories (see also
Uijen et al., 2012). According to these criteria, the TFI comes out ―best‖,
meeting eight of the ten criteria according to the current published
development reports. However, one caveat to this recommendation is that the
final 25-item version of the TFI has not been subjected to these formal
validation criteria. This should be the subject of future research.
Table 7. Summary of the critical evaluation of the psychometric
properties of the five tinnitus questionnaires
Questionnaire
Co
nte
nt
val
idit
y
Inte
rnal
con
sist
ency
Str
uct
ura
l v
alid
ity
Construct
validity
Reproducibility
Res
po
nsi
ven
ess
Flo
or
or
ceil
ing e
ffec
ts
Inte
rpre
tabil
ity
Co
nver
gen
t
Dis
crim
inan
t
Ag
reem
ent
Rel
iab
ilit
y
Tinnitus
Questionnaire
? ++ ? ? ? 0 ? + 0 ?
Tinnitus
Handicap
Questionnaire
+– ++ + + + ? + 0 ? ?
Tinnitus
Reaction
Questionnaire
? +– ? + ? 0 + 0 ? 0
Tinnitus
Handicap
Inventory
? ++ + + + ? + + ? +
Tinnitus
Functional
Index
++ +– + + + 0 + + – +
Rating: + = positive, 0 = no information available, – = poor, ? = indeterminate rating
(doubtful design or method), where two symbols are given this indicates that
several different validation criteria were used.
Kathryn Fackrell, Deborah A. Hall, Johanna Barry et al. 54
References
Adamchic, I., Tass, P. A., Langguth, B., Hauptmann, C., Koller, M.,
Schecklmann, M., Zeman, F., and Landgrebe, M. (2012). Linking the
Tinnitus Questionnaire and the subjective Clinical Global Impression:
Which differences are clinically important? Health and Quality of Life
Outcomes, 10 (1),79
Andersson, G., Baguley, D.M., McKenna, L., and McFerran, D. (2005).
Tinnitus: A multidisciplinary approach. London: Whurr Publishers Ltd.
Andersson, G., Kaldo-Sandström, V., Ström, L., & Strömgren, T. (2003).
Internet administration of the Hospital Anxiety and Depression Scale in a
sample of tinnitus patients. Journal of psychosomatic research, 55(3),
259-262.
Baguley, D.M., and Andersson, G. (2003). Factor Analysis of the Tinnitus
Handicap Inventory. American Journal of Audiology, 12, 31-34.
Baguley, D.M., Humphriss, R.L., and Hodson, C.A. (2000). Convergent
validity of the tinnitus handicap inventory and the tinnitus questionnaire.
The journal of Laryngology and Otology, 114, 840-843.
Beck, A.T., Steer, R.A., Ball, R., Ciervo, C.A., and Kabat, M. (1997) Use of
the Beck Anxiety and Depression Inventories for primary care with
medical outpatients. Assessment, 4, 211–219.
Bendig, A. W. (1956). The development of a short form of the Manifest
Anxiety Scale. Journal of Consulting Psychology, 20, 384.
Clark, L. A., and Watson, D. (1995). Constructing Validity: Basic Issues in
Objective Scale Development. Psychological Assessment, 7(2), 309-319.
Cortina, J. M. (1993). What is Coefficient Alpha? An Examination of Theory
and Applications. Journal of Applied Psychology, 78(1), 98-104.
Cronbach, L. J. (1951). Coefficient Alpha and the Internal Structure of Tests.
Psychometrika, 16(3), 297-334.
De Vet, H.C., Terwee, C.B., Ostelo, R.W., Beckerman, H. Knol, D.L., and
Bouter, L.M. (2006). Minimal changes in health status questionnaires:
distinction between minimally detectable change and minimally important
change. Health and Quality of Life Outcome, 4: 54
Department of Health (2009). Provision of Services for Adults with Tinnitus. A
Good Practice Guide. London: Central Office of Information.
Devon, H.A., Block, M.E., Moyle-Wright, P., Ernst, D.M., Hayden, S.J.,
Lazzara, D.J., Savoy, S.M., and Kostas-Polston, E. (2007). A
Psychometric Toolbox for Testing Validity and Reliabilty. Journal of
Nursing Scholarship, 39(2), 155-164.
Tools for Tinnitus Measurement 55
Fenigstein, A., Scheier, M.F., and Buss, A.H. (1975). Public and private self-
consciousness: Assessment and theory. Journal of Consulting and Clinical
Psychology, 43, 522-527.
Field, A. (2009) Discovering Statistics using SPSS (3rd
Ed). London: Sage
Publications Ltd.
FItzpatrick, A.R. (1983). The Meaning of Content Validity. Applied
Psychological Measurement, 7(1), 3-13.
Floyd, F. J. and Widaman, K. F. (1995). Factor Analysis in the Development
and Refinement of Clinical Assessment Instruments. Psychological
Assessment, 7(3), 286-299.
Gerhards, F., Brehmer, D., and Etzkorn, M. (2004). Dimensionalität des
Tinnitus-Fragebogens. Verhaltenstherapie, 14, 265-271.
Goebel, G. and Hiller, W. (1998) Tinnitus-Fragebogen (TF). Ein Instrument
zur Erfassung von Belastung und Schweregrad bei Tinnitus.
Handanweisung. Göttingen: Hogrefe
Goebel, G., Kahl, M., Arnold, W., and Fichter, M. (2006). 15-year prospective
follow-up study of behavioural therapy in a large sample of inpatients
with chronic tinnitus. Acta Oto-Laryngologica, 126, 70-79.
Green, S.B., Lissitz, R.W., and Mulaik, S.A. (1977). Limitations of coefficient
alpha as an index of test unidimensionality. Educational and
Psychological Measurement, 37, 827—838.
Hallam, R.S. (1996). Manual of the Tinnitus Questionnaire (TQ). London: The
Psychological Corporation.
Hallam, R.S. (2008). TQ Manual of the tinnitus questionnaire: Revised and
updated. London: Polpresa Press.
Hallam, R.S., Jakes, S.C., & Hinchcliffe, R. (1988). Cognitive variables in
tinnitus annoyance. British Journal of Clinical Psychology, 27, 213-222.
Hamilton, M. (1960). A rating scale for depression. Journal of Neurology,
Neurosurgery, and Psychiatry, 23, 52-62.
Haynes, S.N., Richard, D.C.S., and Kubany, E.S. (1995). Content Validity in
Psychological Assessment: A Functional Approach to Concepts and
Methods. Psychological Assessment, 7(3), 238-274.
Henry, J.L., & Wilson, P.H. (1998). The Psychometric Properties of Two
Measures of Tinnitus Complaints and Handicap. International Tinnitus
Journal, 4(2); 114-121.
Hesser, H. (2000). Methodological considerations in treatment evaluations of
tinnitus distress: A call for guidelines. Journal of Psychosomatic
Research, 69, 305-307.
Kathryn Fackrell, Deborah A. Hall, Johanna Barry et al. 56
Hiller, W., & Goebel, G. (1992) A psychometric study of complaints in
chronic tinnitus. Journal of Psychosomatic Research, 36(4), 337-348.
Hiller, W., and Goebel, G. (2004). Rapid assessment of tinnitus-related
psychological distress using the mini-TQ. International Journal of
Audiology. 43; 600-604
Hiller, W., Goebel, G., and Rief, W. (1994) Reliability of self-rated tinnitus
distress and association with psychological symptom pattern. British
Journal of Clinical Research, 33, 231-239.
Hoare, D.J., Gander, P.E., Collins, L., Smith, S., and Hall, D.A. (2012)
Management of tinnitus in English NHS audiology departments: an
evaluation of current practice. Journal of Evaluation in Clinical Practice,
18, 326-334.
Holgers, K. M., Barrenas, M. L., Svedlund, J., and Zoger, S. (2003). Clinical
Evaluation of Tinnitus: A Review. Audiological Medicine, 2, 101-106.
Ireland, C. E., Wilson, P. H., Tonkin, J. P., and Platt-Hepworth, S. (1985). An
evaluation of relaxation training in the treatment of tinnitus. Behaviour
Research and Therapy, 23, 423-430.
Jacobson, G.P. and Newman, C.W. (1990). The development of the Dizziness
Handicap Inventory. Archives of Otolaryngology - Head and Neck
Surgery, 116, 424-427.
Jacobson, N. S., Follette, W. C., and Revenstorf, D.(1986) Toward a Standard
Definition of Clinically Significant Change. Behavior therapy, 17(3), 308-
311.
Jacobson, N. S., Roberts, L. J., Berns, S. B., and McGlinchey, J. B. (1999).
Methods for Defining and Determining the Clinical Significance of
Treatment Effects: Description, Application, and Alternatives. Journal of
Counselling and Clinical Psychology, 67(3), 300-307.
Jakes, S. C., Hallam, R. S., Chambers, C and Hinchcliffe, R. (1985). A factor
analytical Study of Tinnitus Complaint Behaviour. Audiology, 24; 195-
206.
Kam, A.C., Cheung, A.P., Chan, P.Y., Leung, E.K., Wong, T.K., Tong, M.C.,
and Van Hasselt, A. (2009). Psychometric properties of a Chinese
(Cantonese) version of the Tinnitus Questionnaire. International Journal
of Audiology, 48(8), 568-575.
Kaplan, R.M., Ganiats, T.G., and Seiber, W.J. (1996). The Quality of Well
Being Scale, Self-Administered (QWBS-SA). San Diego: University of
California-San Diego.
Kennedy, V., Wilson, C., and Stephens, D. (2004). Quality of Life and
Tinnitus. Audiological Medicine, 2; 29-40.

Tools for Tinnitus Measurement 57
Kirshner, B., and Guyatt, G. (1995). A methodological framework for
assessing health indices. Journal of Chronic Disorder, 38, 27-86.
Kuk, F. K., Tyler, R. S., Russell, D., and Jordan, H. (1990). The Psychometric
Properties of a Tinnitus Handicap Questionnaire. Ear and Hearing, 11(6),
434-445.
Lohmann, N. (1980). A factor analysis of life satisfaction, adjustment and
morale measures with elderly adults. The International Journal of Aging
and Human Development, 11(1), 35-43.
Main, C.J. (1983) The Modified Somatic Perception Questionnaire (MSPQ).
Journal of Psychosomatic Research, 27, 503-514.
McCombe, A., Baguley, D., Coles, R., McKenna, L., McKinney, C., and
Windle-Taylor, P. (2001). Guidelines for the grading of tinnitus severity:
the results of a working group commissioned by the British Association of
Otolaryngologists, Head and Neck Surgeons, 1999. Clinical
Otolaryngology, 26, 388-393.
Meeus, O., Blaivie, C., and Van De Heyning, P. (2007). Validation of the
Dutch and the French version of the Tinnitus Questionnaire. Royal
Belgian Society for Ear, Nose, Throat, Head and Neck surgery (B-ENT),
3(7); 11-17.
Meikle, M. B., Henry, J. A., Griest, S. E., Stewart, B. J., Abrams, H. B.,
McArdle, R., Myers, P. J., Newman, C. W…and Vernon, J. A. (2012) The
Tinnitus Functional Index: Development of a New Clinical Measure for
Chronic, Intrusive Tinnitus. Ear and Hearing, 33(2), 153-176.
Meikle, M. B., Stewart, B. J., Griest, S. E., and Henry, J. A. (2008). Tinnitus
Outcomes Assessment. Trends in Amplification¸ 12(3), 223-235.
Meikle, M.B., Stewart, B.J., Griest, S.E., Martin, W.H., Henry, J.A., Abrams,
H.B., McArdle, R., Newman, C.W., and Sandridge, S.A. (2007).
Assessment of tinnitus: Measurement of treatment outcomes. Progress in
Brain Research, 166, 511-521.
Monzani, D., Genovese, E., Marrara, A., Gherpelli, C., Pingani, L. Forghieri,
M., Rigatelli, M., Guadagnin, T., and Arslan, E. (2008). Validity of the
Italian adaptation of the Tinnitus Handicap Inventory; focus on quality of
life and psychological distress in tinnitus-sufferers. Acta
Otorhinolaryngologica Italica, 28, 126-134.
Newman, C. W., Wharton, J. A., and Jacobson, G. P. (1995). Retest stability
of the tinnitus handicap questionnaire. The Annals of Otology, Rhinology
and Laryngology, 104(9/1); 718-723.
Kathryn Fackrell, Deborah A. Hall, Johanna Barry et al. 58
Newman, C.W., and Sandridge, S.A. (2004). Tinnitus Questionnaires. In:
SNOW Jr, J.B. Tinnitus: Theory and Management. Ontario: BC Decker
Inc, pp. 237-254.
Newman, C.W., Jacobson, G.P., and Spitzer, J.B. (1996). Development of the
Tinnitus Handicap Inventory. Archives of Otolaryngology - Head and
Neck Surgery, 122, 143–8.
Newman, C.W., Sandridge, S.A., and Jacobson, G.P. (1998). Psychometric
adequacy of the Tinnitus Handicap Inventory (THI) for evaluating
treatment outcome. Journal of the American Academy of Audiology, 9,
153–60.
Newman, C.W., Sandridge, S.A., Bea, S.M., Cherian, K., Cherian, N., Kahn,
K.M., and Kaltenbach, J. (2011). Tinnitus: Patients do not have to ‗just
live with it‘. Cleveland Clinic Journal of Medicine, 78(5), 312-319.
NHS White Paper (2010). Department of Health, Equity and excellence:
Liberating the NHS, London, TSO, 2010. Available at:
http://www.dh.gov.uk/en/Publicationsandstatistics/Publications/Publicatio
nsPolicyAndGuidance/DH_117353
Parkerson Jr, G. R., Gehlbach, S. H., Wagner, E. H., James, S. A., Clapp, N.
E., and Muhlbaier, L. H. (1981). The Duke-UNC Health Profile: an adult
health status instrument for primary care. Medical care, 806-828.
Peterson, R.A. (1994). A Meta-analysis of Cronbach‘s Coefficient Alpha.
Journal of Consumer Research, 21, 381-391.
Revicki, D, Hays, R.D., Cella, D., AND Sloan, J. (2008). Recommended
methods for determining responsiveness and minimally important
differences for patient-reported outcomes. Journal of Clinical
Epidemiology, 61, 102-109.
Robinson, S.K., McQuaid, J.R., Viirre, E.S., Betzig, L.L., Miller, D.L., Bailey,
K.A., Harris, J.P., and Perry, W. (2003). Relationship of Tinnitus
Questionnaires to Depressive Symptoms, Quality of Well-Being, and
Internal Focus. The International Tinnitus Journal, 9(2), 97-103.
Schmitt, N. (1996) Uses and Abuses of Coefficient Alpha. Psychological
Assessment, 8(4), 350-353.
Seydel, C., Zirke, N., Haupt, H., Szczepek, A., Olze, H., and Mazurek, B.
(2012) Psychometric instruments for the diagnosis of tinnitus. HNO-
Praxis, 60; 732-742.
Tools for Tinnitus Measurement 59
Spielberger, C. D., Gorsuch, R. L., & Lushene, R. E. (1970). STAI manual.
Palo Alto, CA: Consulting Psychologists Press.
Stevens, C., Walker, G., Boyer, M., and Gallagher, M. (2007) Severe tinnitus
and its effect on selective and divided attention. International Journal of
Audiology, 46, 208-216.
Streiner, D.L. (2003) Starting at the Beginning: An Introduction to Coefficient
Alpha and Internal Consistency. Journal of Personality Assessment, 80(1),
99–103.
Streiner, D.L. and Norman, G.R. (2008) Health measurement scales: a
practical guide to their development and use. (4th Ed) New York: Oxford
University Press.
Sullivan, M., Katon, W, Russo, J., Dobie, R., and Sakai, C. (1993) A
randomized trial of nortriptyline for severe chronic tinnitus. Effects on
depression, disability, and tinnitus symptoms. Archives of Internal
Medicine, 11, 2251–2259
Tavakol, M. and Dennick, R. (2011) Making sense of Cronbach‘s alpha.
International Journal of Medical Education, 2, 53-55
Terwee, C. B., Bot, S. D.M., de Boer, M. R., van der Windt, D. A.W.M., Knol,
D. L., Dekker, J., Bouter, L. M., and de Vet, H. C.W. (2007). Quality
criteria were proposed for measurement properties of health status
questionnaires. Journal of Clinical Epidemiology, 60, 34-42.
Tyler, R.S., and Baker, L.J. (1983) Difficulties experienced by tinnitus
sufferers. Journal of Speech and Hearing Disorders, 48, 150–4.
Uijen, A. A., Heinst, C. W., Schellevis, F. G., van den Bosch, W. J., van de
Laar, F. A., Terwee, C. B., and Schers, H. J. (2012) Measurement
Properties of Questionnaires Measuring Continuity of Care: A Systematic
Review. PLoS ONE 7(7): e42256. doi:10.1371/journal.pone.0042256
Ventry, I.M., and Weinstein, B.E. (1982) The Hearing Handicap Inventory for
the Elderly: a new tool. Ear and Hearing, 3, 128–34.
Wilson, P. H., and Henry, J. L. (1998). Tinnitus Cognitions Questionnaire:
development and psychometric properties of a measure of dysfunctional
cognitions associated with tinnitus. The international tinnitus journal,
4(1), 23.
Kathryn Fackrell, Deborah A. Hall, Johanna Barry et al. 60
Wilson, P.H., Henry, J., Bowen, M., and Haralambous, G. (1991) Tinnitus
Reaction Questionnaire: Psychometric Properties of a Measure of Distress
Associated with Tinnitus. Journal of Speech and Hearing Research, 34,
197-201.
Zachariae, R., Mirz, F., Johansen, L.V., Anderson, S.E., Bjerring, P., and
Pedersen, C.B. (2000) Reliability and validity of a Danish adaptation of
the Tinnitus Handicap Inventory. Scandinavian Audiology, 29, 37–43.
Zeman, F., Koller, M., Figueiredo, R., Aazevedo, A., Rates, M., Coelho, C.,
Kleinjung, T., De Ridder, D., Langguth, B., and Landgrebe, M. (2011)
Tinnitus handicap inventory for evaluating treatment effects: which
changes are clinically relevant? Otolaryngology-Head and Neck Surgery,
145, 282–287.
Zung, W. (1965) A self-rating depression scale. Archives of General
Psychiatry, 12, 63-70.


