GHRowell 1
Topic: Sampling Distributions of Sample Means Activity: Penny Ages
Prerequisites: Understanding of mean, standard deviation, and shape of a distribution. Previous exposure to different types of distributions is preferred. Previous exposure to simulation would be helpful but is not required. Students are expected to use an Internet applet, Minitab and MS Word. Materials: The pennyyears.mtw worksheet. For each group, pretend paper pennies cut from the stencil provided at the end of this lesson and put into a small paper bag. Access to the Internet and Minitab or Excel. Goals and Objectives: • To understand the concept of the sampling distribution of the sample mean by using simulation. • To use simulation from a variety of original distributions to discover the Central Limit Theorem.
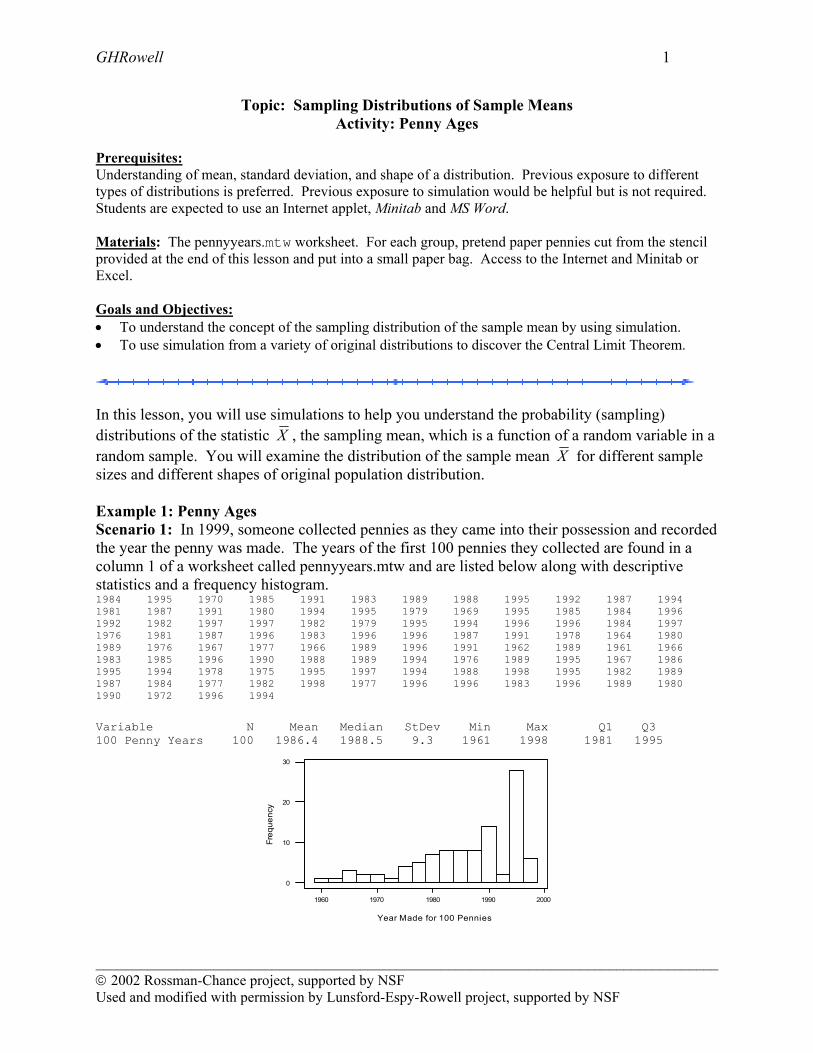
In this lesson, you will use simulations to help you understand the probability (sampling) distributions of the statistic X , the sampling mean, which is a function of a random variable in a random sample. You will examine the distribution of the sample mean X for different sample sizes and different shapes of original population distribution. Example 1: Penny Ages Scenario 1: In 1999, someone collected pennies as they came into their possession and recorded the year the penny was made. The years of the first 100 pennies they collected are found in a column 1 of a worksheet called pennyyears.mtw and are listed below along with descriptive statistics and a frequency histogram. 1984 1995 1970 1985 1991 1983 1989 1988 1995 1992 1987 1994 1981 1987 1991 1980 1994 1995 1979 1969 1995 1985 1984 1996 1992 1982 1997 1997 1982 1979 1995 1994 1996 1996 1984 1997 1976 1981 1987 1996 1983 1996 1996 1987 1991 1978 1964 1980 1989 1976 1967 1977 1966 1989 1996 1991 1962 1989 1961 1966 1983 1985 1996 1990 1988 1989 1994 1976 1989 1995 1967 1986 1995 1994 1978 1975 1995 1997 1994 1988 1998 1995 1982 1989 1987 1984 1977 1982 1998 1977 1996 1996 1983 1996 1989 1980 1990 1972 1996 1994
Variable N Mean Median StDev Min Max Q1 Q3 100 Penny Years 100 1986.4 1988.5 9.3 1961 1998 1981 1995
1960 1970 1980 1990 2000
0
10
20
30
Freq
uenc
y
Year Made for 100 Pennies
_____________________________________________________________________________________ 2002 Rossman-Chance project, supported by NSF Used and modified with permission by Lunsford-Espy-Rowell project, supported by NSF

GHRowell 2
(a) Comment on the shape of the distribution of penny years. (b) Using the descriptive statistics provided, record the mean and standard deviation of these 100
penny years. mean µ = standard deviation σ =
(c) Each group has a bag with 100 pretend paper pennies which have the exact same years of the
100 pennies collected. The bag of pennies represents your population. Draw a sample of size n=2 from this population of 100 pennies by drawing the first pretend penny writing its year down in the blank below and then putting the penny back in the bag and drawing a second time recording the year in the second blank. This is called sampling with replacement. Find the average of this sample of size 2 and put that value in the corresponding blank.
_______ ________ _________ draw 1 draw 2 sample mean X
(d) Record the results from the previous problem in the table below as sample number 1.
Repeat the procedure 9 more times. Record all 10 samples of size 2 and their sample means in the table below.
Sample Number
Year Draw 1
Year Draw 2
Sample Mean for samples of size n=2
1 2 3 4 5 6 7 8 9 10
(e) Find the mean and standard deviation of the 10 sample means shown in the table above. mean of sample means = __________, standard deviation of sample means = _______ (f) Combine your results with the rest of the class by drawing a dot plot on the board of the
sample means or by entering your 10 sample means into Minitab or a graphing calculator to generate the mean, standard deviation and a histogram. Comment on the shape and record these values:
shape:
mean of sample means = __________, standard deviation of sample means = _______
_____________________________________________________________________________________ 2002 Rossman-Chance project, supported by NSF Used and modified with permission by Lunsford-Espy-Rowell project, supported by NSF

GHRowell 3
(g) We started out with a very small sample size (n=2). Next we want to examine what happens to the distribution of the sample means as we increase the sample size. To do this draw 10 samples of size n=5 from this population of 100 pennies. Remember to replace each penny back in the bag before drawing another one. Record the data for your samples in the table below and find the average of each sample of size 5 and put that value in the corresponding column.
Sample Number
Year Draw 1
Year Draw 2
Year Draw 3
Year Draw 4
Year Draw 5
Sample Mean for samples of size n=5
1 2 3 4 5 6 7 8 9 10
(h) Find the mean and standard deviation of the 10 sample means shown in the table above. mean of sample means = __________, standard deviation of sample means = _______ (i) Combine your results with the rest of the class by drawing a dot plot on the board of the
sample means or by entering your 10 sample means into Minitab or a graphing calculator to generate the mean, standard deviation and a histogram. Comment on the shape of the distribution and record these values:
shape:
mean of sample means = __________, standard deviation of sample means = _______ (j) Using complete sentences, write a brief paragraph that explains any conclusions that you can
draw about the sampling distribution of the sample mean. State how confident you are about these conclusions and what you think you might need to do to feel more confident about such conclusions.
_____________________________________________________________________________________ 2002 Rossman-Chance project, supported by NSF Used and modified with permission by Lunsford-Espy-Rowell project, supported by NSF

GHRowell 4
We would like to repeat this simulation more times, so we will use an applet on the Internet developed by Dr. B. Chance at Cal Poly, San Luis Obispo. This Internet applet is similar to the 100 penny years simulation we did in class, but using the computer allows us to use an initially larger population and to repeat the simulation more times. So we now use Scenario 2. Scenario 2: In 1999, the person who collected the 100 pennies continued the collection process until 1000 pennies were collected. The list of the years corresponding to these 1000 pennies is found in the Minitab file pennyyears.mtw. A frequency histogram of these 1000 penny years appears below along with the basic descriptive statistics:
1940 1950 1960 1970 1980 1990 2000
0
20
40
60
80
100
120
140
penny years
Freq
uenc
y
Variable N Mean Median StDev SE Mean penny years 1000 1986.7 1988.0 9.6 0.3 Variable Minimum Maximum Q1 Q3 penny years 1940.0 1999.0 1980.0 1995.0
(k) Comment on the shape of the distribution of penny years for the population of 1000 pennies. (l) Using the descriptive statistics provided, record the mean and standard deviation of these
1000 penny years. mean µ = standard deviation σ =
(m) Go to the Internet site _______________________________________
Select the Penny Ages applet. It may take a minute for all the components to load. Compare the histogram shown above for the 1000 penny years to the one on the applet. Also compare the mean and standard deviation for the population of 1000 penny years. Do you believe the Penny Ages applet represents the same 1000 pennies that were described above? Why or why not?
_____________________________________________________________________________________ 2002 Rossman-Chance project, supported by NSF Used and modified with permission by Lunsford-Espy-Rowell project, supported by NSF

GHRowell 5
(n) Use the Internet applet to select 10 samples of size n=2. Mark the box that shows the animation. Identify the mean and standard deviation of the sample means and comment on the shape of the distribution of the sample means.
mean of sample means = __________, standard deviation of sample means = _______
shape:
(o) Use the Internet applet to select 100 samples of size n=2. Identify the mean and standard
deviation of the sample means and comment on the shape of the distribution of the sample means.
mean of sample means = __________, standard deviation of sample means = _______
shape: (p) Now, we are going to increase the number of samples to 1000 samples of size n=2. Be sure
to turn off the animation by removing the check from the box. Identify the mean and standard deviation of the sample means and comment on the shape of the distribution of the sample means.
mean of sample means = __________, standard deviation of sample means = _______
shape:
(q) Now, we are going to increase the size of each sample. Take 1000 samples of size n=5. Be
sure the animation is turned off. Identify the mean and standard deviation of the sample means and comment on the shape of the distribution of the sample means.
mean of sample means = __________, standard deviation of sample means = _______
shape: (r) This time take 1000 samples of size n=10. Identify the mean and standard deviation of the
sample means and comment on the shape of the distribution of the sample means.
mean of sample means = __________, standard deviation of sample means = _______ shape:
_____________________________________________________________________________________ 2002 Rossman-Chance project, supported by NSF Used and modified with permission by Lunsford-Espy-Rowell project, supported by NSF

GHRowell 6
(s) Use complete sentences to describe what you discovered about the sampling distribution using the Internet applet.
Next we will see how to use MS Excel to run the same simulation. Open file pennyyears.xls. Column B contains the years of the same 1000 pennies. Column C and D are where you will put the samples that Excel draws for you for samples of size n=2. Column E is where the average will be calculated. Column G is used to create the histogram. Columns I – M are for samples of size n=5 and Column L is for the corresponding average. At the bottom of the spreadsheet (rows 1002 and 1003) the mean and standard deviation of each column are calculated. (t) Take 1000 samples of size n=2 each from the population of 1000 penny years. To do this we
will sample 1000 items with replacement from the original data in Cells B2 – B1001 and put them in Cells C2 – C1001. Then repeat the procedure to put the years for the second draw in Cells D2-D1001
From the main menu select Tools>Data Analysis From the dialog box select Sampling For Input Range enter B2:B1001 Mark Random Number of Samples: 1000 Mark Output Range and enter C2:C1001
Click OK
Repeating the procedure for the second draw: From the main menu select Tools>Data Analysis From the dialog box select Sampling For Input Range enter B2:B1001 Mark Random Number of Samples: 1000 Mark Output Range and enter D2:D1001
Click OK
Examine Column E2 and see if it is calculating the average of draw 1 and draw 2 for each of the 1000 samples of size 2. Scroll down to the bottom to see the mean of the samples means in column E. Compare these to the answers you found for the same sample size and number of 1000 repetitions of samples of size 2. Record your values and observations below. mean of sample means = __________, standard deviation of sample means = _______
_____________________________________________________________________________________ 2002 Rossman-Chance project, supported by NSF Used and modified with permission by Lunsford-Espy-Rowell project, supported by NSF
GHRowell 7
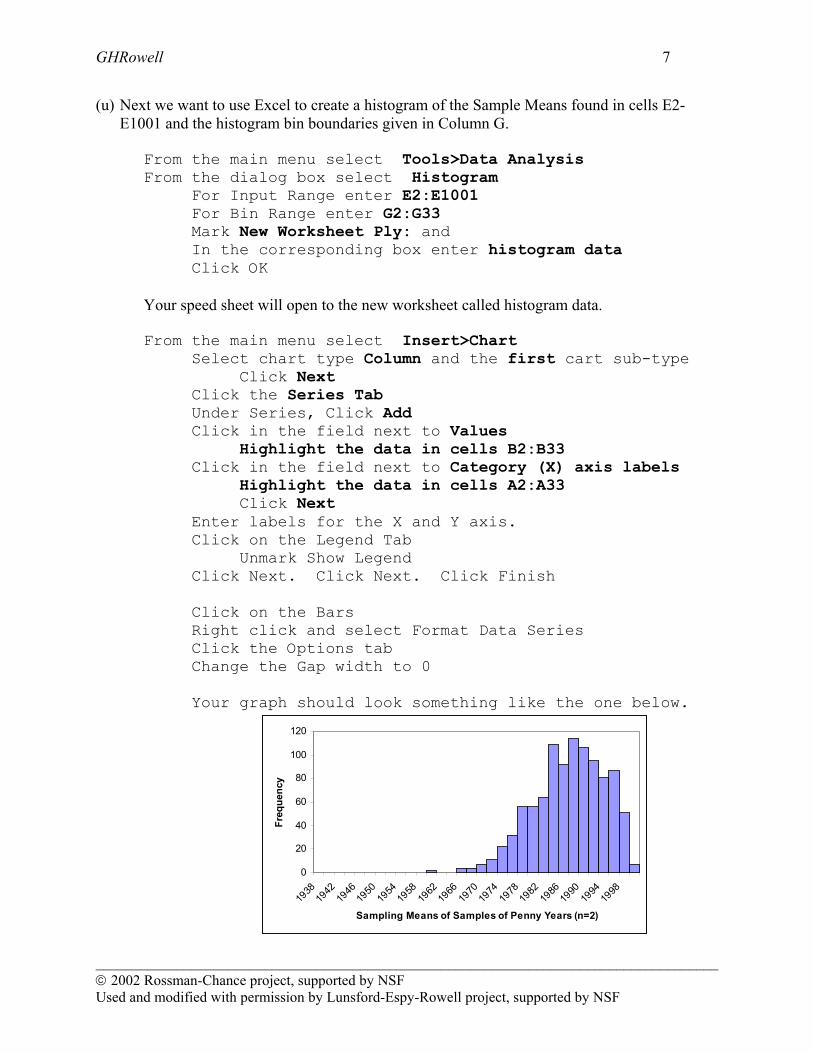
(u) Next we want to use Excel to create a histogram of the Sample Means found in cells E2-E1001 and the histogram bin boundaries given in Column G.
From the main menu select Tools>Data Analysis From the dialog box select Histogram For Input Range enter E2:E1001 For Bin Range enter G2:G33 Mark New Worksheet Ply: and
In the corresponding box enter histogram data Click OK
Your speed sheet will open to the new worksheet called histogram data.
From the main menu select Insert>Chart
Select chart type Column and the first cart sub-type Click Next
Click the Series Tab Under Series, Click Add
Click in the field next to Values Highlight the data in cells B2:B33
Click in the field next to Category (X) axis labels Highlight the data in cells A2:A33
Click Next Enter labels for the X and Y axis. Click on the Legend Tab Unmark Show Legend Click Next. Click Next. Click Finish Click on the Bars Right click and select Format Data Series Click the Options tab Change the Gap width to 0 Your graph should look something like the one below.
0
20
40
60
80
100
120
1938
1942
1946
1950
1954
1958
1962
1966
1970
1974
1978
1982
1986
1990
1994
1998
Sampling Means of Samples of Penny Years (n=2)
Freq
uenc
y
_____________________________________________________________________________________ 2002 Rossman-Chance project, supported by NSF Used and modified with permission by Lunsford-Espy-Rowell project, supported by NSF
GHRowell 8
(v) Describe the shape of the distribution of the sample means for 1000 samples of size n=2. (w) Use Excel to generate 1000 samples of size n=5 of the penny ages. Identify the mean and
standard deviation of the sample means and comment on the shape of the distribution of the sample means.
mean of sample means = __________, standard deviation of sample means = _______
shape: (x) The results for Excel and the Penny Ages applet should be similar though we would not
expect them to be exactly identical since we were drawing samples at random. Comment on the comparison of your results for sample mean distributions of size n=2 and n=5.
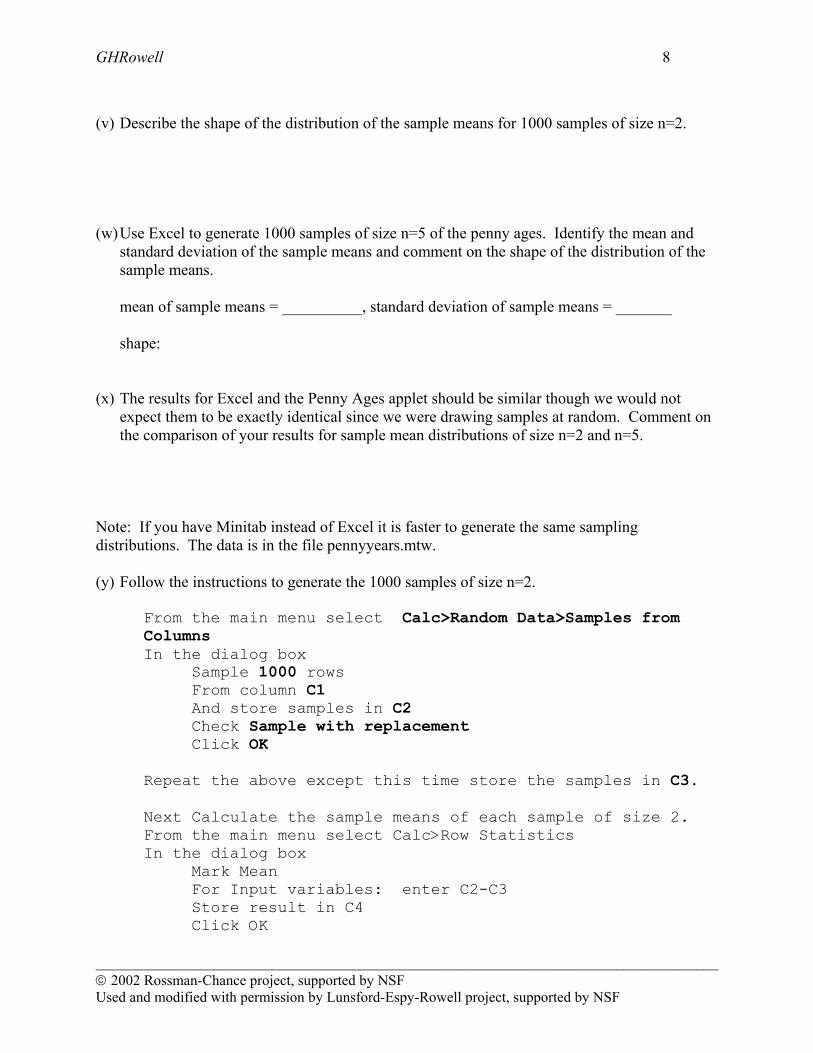
Note: If you have Minitab instead of Excel it is faster to generate the same sampling distributions. The data is in the file pennyyears.mtw. (y) Follow the instructions to generate the 1000 samples of size n=2.
From the main menu select Calc>Random Data>Samples from Columns In the dialog box Sample 1000 rows
From column C1 And store samples in C2 Check Sample with replacement Click OK Repeat the above except this time store the samples in C3. Next Calculate the sample means of each sample of size 2. From the main menu select Calc>Row Statistics In the dialog box Mark Mean For Input variables: enter C2-C3 Store result in C4 Click OK
_____________________________________________________________________________________ 2002 Rossman-Chance project, supported by NSF Used and modified with permission by Lunsford-Espy-Rowell project, supported by NSF
GHRowell 9
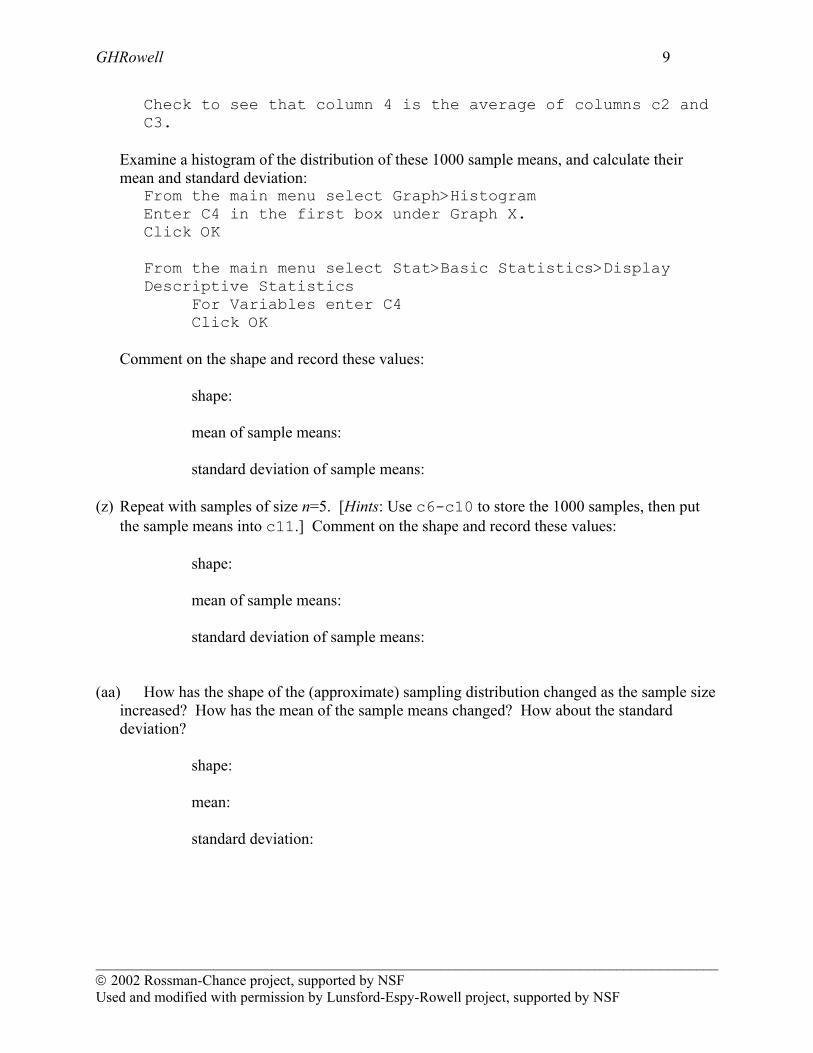
Check to see that column 4 is the average of columns c2 and C3.
Examine a histogram of the distribution of these 1000 sample means, and calculate their mean and standard deviation:
From the main menu select Graph>Histogram Enter C4 in the first box under Graph X. Click OK From the main menu select Stat>Basic Statistics>Display Descriptive Statistics For Variables enter C4 Click OK
Comment on the shape and record these values: shape:
mean of sample means: standard deviation of sample means:
(z) Repeat with samples of size n=5. [Hints: Use c6-c10 to store the 1000 samples, then put
the sample means into c11.] Comment on the shape and record these values: shape:
mean of sample means: standard deviation of sample means:
(aa) How has the shape of the (approximate) sampling distribution changed as the sample size
increased? How has the mean of the sample means changed? How about the standard deviation?
shape:
mean: standard deviation:
_____________________________________________________________________________________ 2002 Rossman-Chance project, supported by NSF Used and modified with permission by Lunsford-Espy-Rowell project, supported by NSF
GHRowell 10
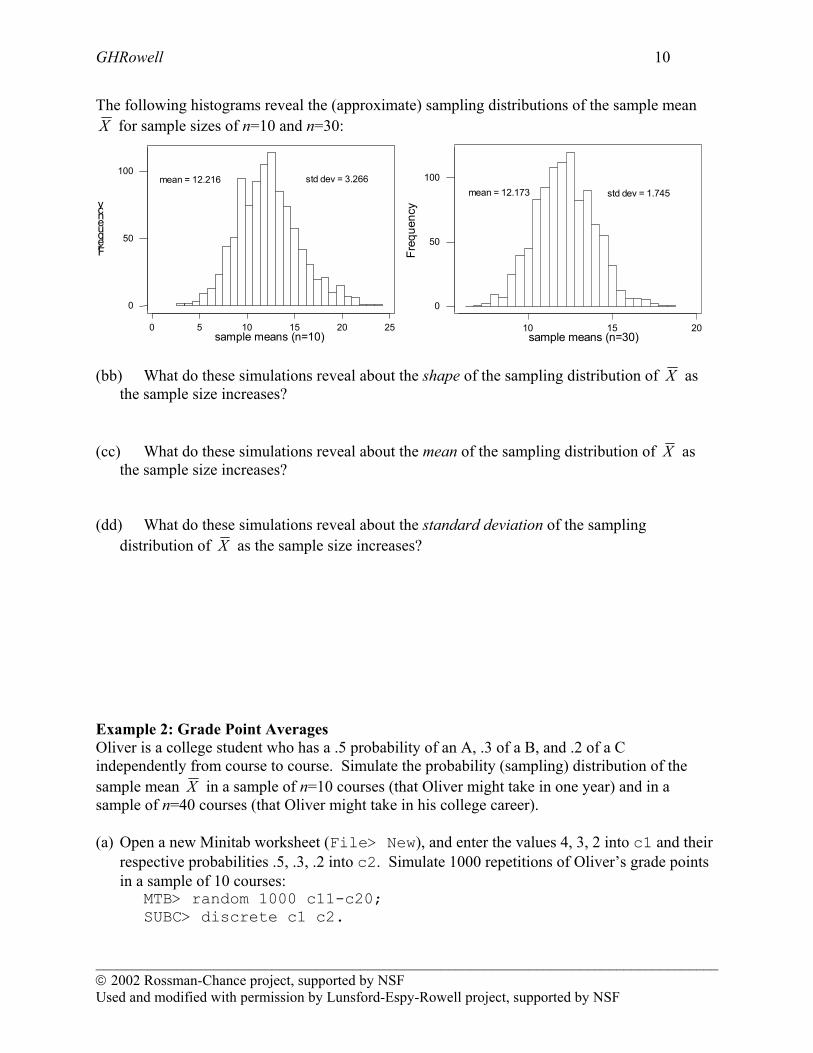
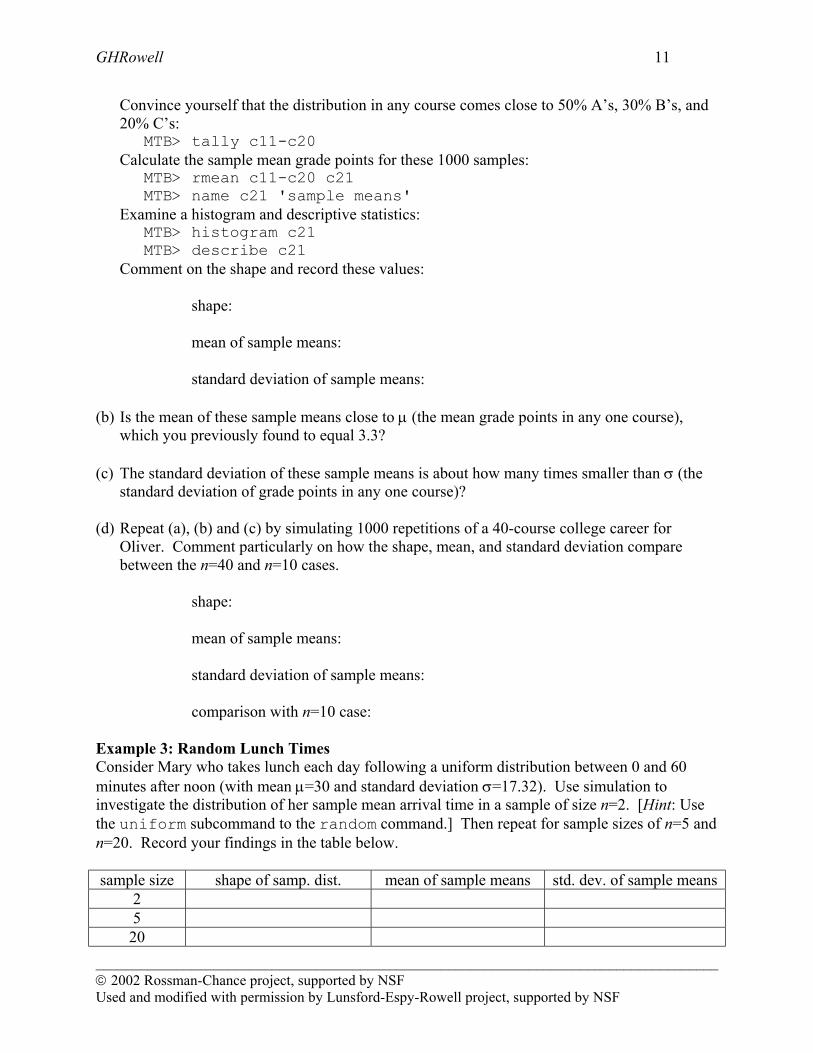
The following histograms reveal the (approximate) sampling distributions of the sample mean X for sample sizes of n=10 and n=30:
2520151050
100
50
0
sample means (n=10)
Frequency
mean = 12.216 std dev = 3.266
201510
100
50
0
sample means (n=30)
Freq
uenc
y
mean = 12.173 std dev = 1.745
(bb) What do these simulations reveal about the shape of the sampling distribution of X as
the sample size increases? (cc) What do these simulations reveal about the mean of the sampling distribution of X as
the sample size increases? (dd) What do these simulations reveal about the standard deviation of the sampling
distribution of X as the sample size increases? Example 2: Grade Point Averages Oliver is a college student who has a .5 probability of an A, .3 of a B, and .2 of a C independently from course to course. Simulate the probability (sampling) distribution of the sample mean X in a sample of n=10 courses (that Oliver might take in one year) and in a sample of n=40 courses (that Oliver might take in his college career). (a) Open a new Minitab worksheet (File> New), and enter the values 4, 3, 2 into c1 and their
respective probabilities .5, .3, .2 into c2. Simulate 1000 repetitions of Oliver’s grade points in a sample of 10 courses:
MTB> random 1000 c11-c20; SUBC> discrete c1 c2.
_____________________________________________________________________________________ 2002 Rossman-Chance project, supported by NSF Used and modified with permission by Lunsford-Espy-Rowell project, supported by NSF
GHRowell 11
Convince yourself that the distribution in any course comes close to 50% A’s, 30% B’s, and 20% C’s:
MTB> tally c11-c20 Calculate the sample mean grade points for these 1000 samples:
MTB> rmean c11-c20 c21 MTB> name c21 'sample means'
Examine a histogram and descriptive statistics: MTB> histogram c21 MTB> describe c21
Comment on the shape and record these values: shape:
mean of sample means: standard deviation of sample means:
(b) Is the mean of these sample means close to µ (the mean grade points in any one course),
which you previously found to equal 3.3? (c) The standard deviation of these sample means is about how many times smaller than σ (the
standard deviation of grade points in any one course)? (d) Repeat (a), (b) and (c) by simulating 1000 repetitions of a 40-course college career for
Oliver. Comment particularly on how the shape, mean, and standard deviation compare between the n=40 and n=10 cases.
shape:
mean of sample means: standard deviation of sample means:
comparison with n=10 case: Example 3: Random Lunch Times Consider Mary who takes lunch each day following a uniform distribution between 0 and 60 minutes after noon (with mean µ=30 and standard deviation σ=17.32). Use simulation to investigate the distribution of her sample mean arrival time in a sample of size n=2. [Hint: Use the uniform subcommand to the random command.] Then repeat for sample sizes of n=5 and n=20. Record your findings in the table below. sample size shape of samp. dist. mean of sample means std. dev. of sample means
2 5 20
_____________________________________________________________________________________ 2002 Rossman-Chance project, supported by NSF Used and modified with permission by Lunsford-Espy-Rowell project, supported by NSF

GHRowell 12
Example 4: Birth Weights The birthweights of babies born in the U.S. follow a normal distribution with mean 3250 ounces and standard deviation 550 ounces. Use simulation (normal subcommand to random command) to investigate the distribution of sample mean birthweights in a sample of size n=2. Then repeat for sample sizes of n=5 and n=20. Record your findings in the table below. sample size shape of samp. dist. mean of sample means std. dev. of sample means
2 5 20
Your simulation analyses should convince you that the following results (known as the Central Limit Theorem) about the sampling distribution of a sample mean X are reasonable: • The mean of the sampling distribution of X equals the population mean µ, regardless of the
sample size or the population distribution. • The standard deviation of the sampling distribution of X equals the population standard
deviation σ divided by the square root of the sample size, regardless of the population distribution.
• The shape of the sampling distribution of X is approximately normal for large sample sizes, regardless of the population distribution, and it is normal for any sample size when the population distribution is normal.
_____________________________________________________________________________________ 2002 Rossman-Chance project, supported by NSF Used and modified with permission by Lunsford-Espy-Rowell project, supported by NSF

GHRowell 13
_____________________________________________________________________________________ 2002 Rossman-Chance project, supported by NSF Used and modified with permission by Lunsford-Espy-Rowell project, supported by NSF
Pretend Paper Pennies
For each group in your class, copy this pattern onto stiff paper, cut out the 100 pretend pennies, and put the 100 pennies in a small paper bag. Each group will use these pennies for a simulation. Hint: If you have a chopping block, it will go very quickly. Just do not mix up the sheets for each group. Each group must have the 100 pennies that appear on this page in their bag. 1984 1995 1970 1985 1991 1983 1989 1988 1995 1992
1987 1994 1981 1987 1991 1980 19994 1995 1979 1969
1995 1985 1984 1996 1992 1982 1997 1997 1982 1979
1995 1994 1996 1996 1984 1997 1996 1981 1987 1996
1983 1996 1996 1987 1991 1978 1964 1980 1989 1976
1967 1977 1966 1989 1996 1991 1962 1989 1961 1966
1983 1985 1996 1990 1988 1989 1994 1976 1989 1995
1967 1986 1995 1994 1978 1975 1995 1997 1994 1988
1998 1995 1982 1989 1987 1984 1977 1982 1998 1977
1996 1996 1983 1996 1989 1980 1990 1972 1996 1994


