TRACING CHEMICAL PLUMES IN TURBULENT WATERS
Jiri Janata, Hiroshi Ishida, Timo KikasSchool of Chemistry and Biochemistry
Georgia Institute of TechnologyAtlanta, GA 30332-0400, USA
ACKNOWLEDGMENTS:
GEORGIA INST. OF TECHNOLOGY: D. WEBSTERTOKYO INST. OF TECHNOLOGY: T. MORIIZUMI
FUNDING (1998-2000): DARPA: Project Number: N00014-98-1-077
How to make the best use of signals from sensor array?
Outline
• Where is the information in the plume?
• Data acquisition
• Correlation analysis
- theory- bandwidth- experiments
• Conclusions
Outline
• Where is the information in the plume?
• Data acquisition
• Correlation analysis
- theory- bandwidth- experiments
• Conclusions
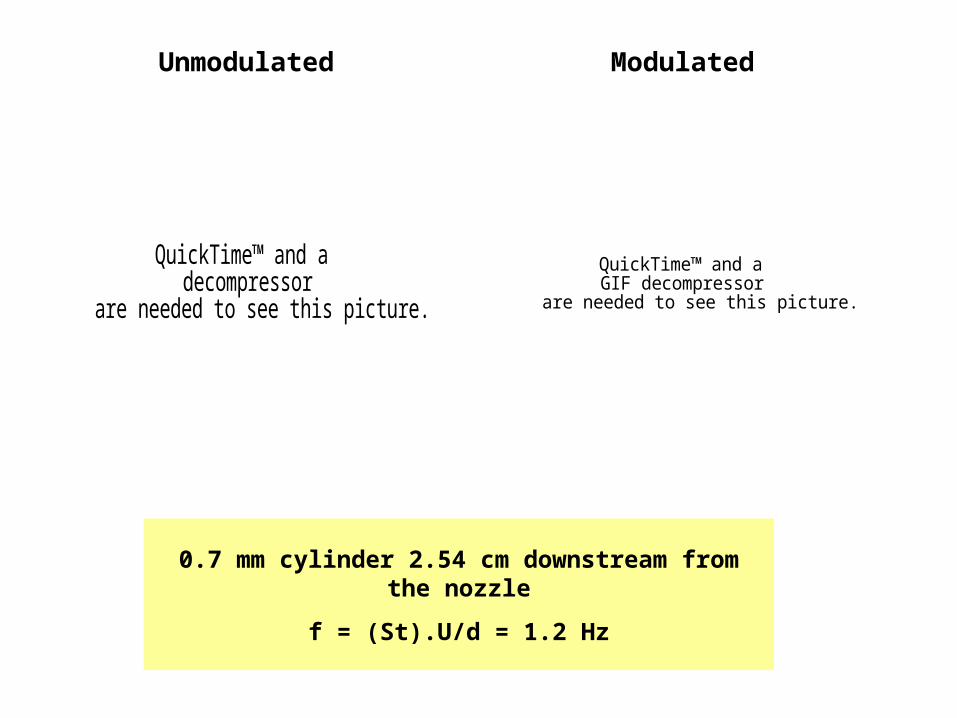
0.7 mm cylinder 2.54 cm downstream from the nozzle
f = (St).U/d = 1.2 Hz
Unmodulated Modulated
QuickTime™ and a decompressor
are needed to see this picture.
QuickTime™ and aGIF decompressor
are needed to see this picture.
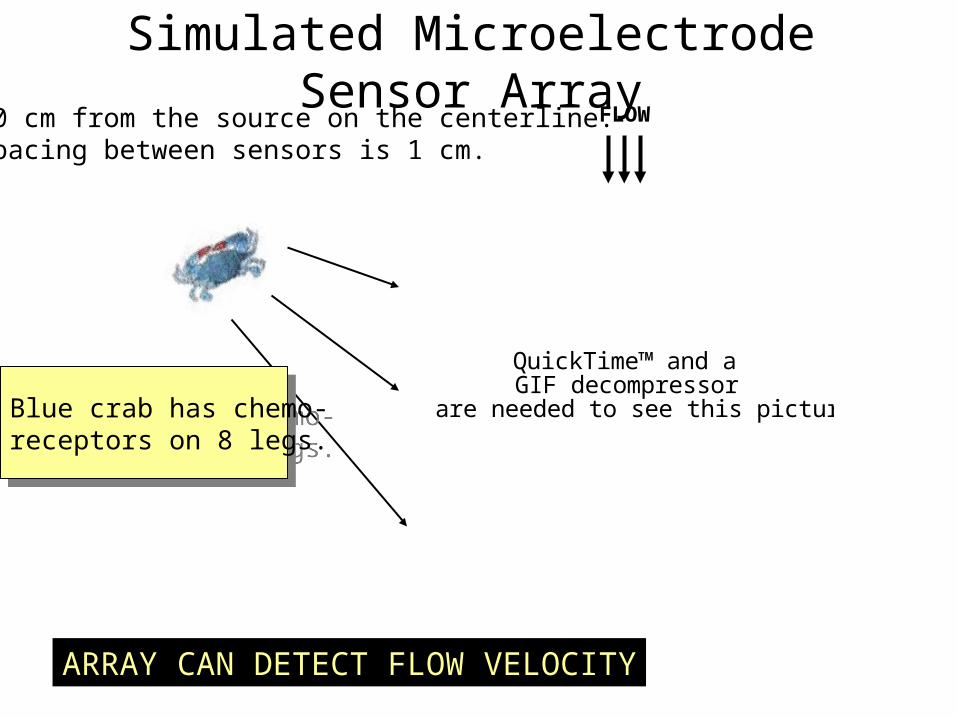
Simulated Microelectrode Sensor Array
QuickTime™ and aGIF decompressor
are needed to see this picture.
50 cm from the source on the centerline.Spacing between sensors is 1 cm.
Blue crab has chemo-receptors on 8 legs.
Blue crab has chemo-receptors on 8 legs.
ARRAY CAN DETECT FLOW VELOCITY
FLOW

WHERE IS THE OTHER INFORMATION?
TIME-VARYING SIGNAL HAS TWO PARTS, THE MEAN VALUE AND THE FLUCTUATING PART
S (t) = S + s (t)
HYPOTHESIS: THE INFORMATION IS IN THE FLUCTUATING PART OF THE SIGNAL
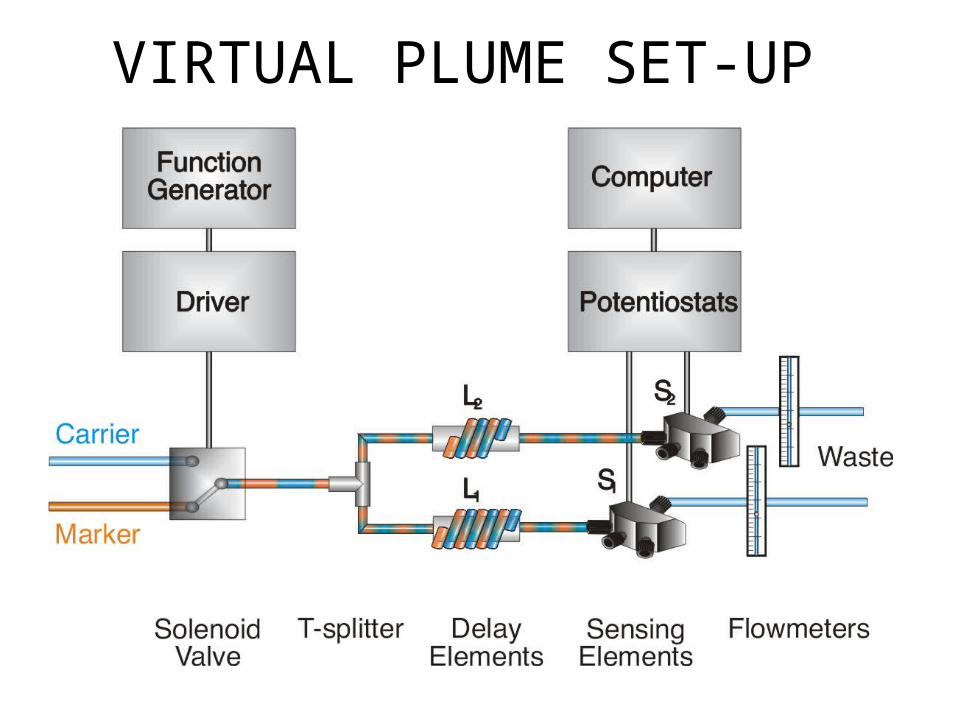
VIRTUAL PLUME SET-UP

CORRELATION ANALYSIS
-3
-2
-1
0
0 200 400 600 800 1000Time [sec]
Current [n
A]
-3
-2
-1
0
0 200 400 600 800 1000Time [sec]
Current [n
A]
0
2
4
6
0 2 4 6 8 10
0
2
4
6
0 2 4 6 8 10
0
0.03
0.06
0.09
0.12
0.15
0 2 4 6 8 100
0.2
0.4
0.6
0.8
1
0 2 4 6 8 10
Time series of channel 1 Time series of channel 2
Auto-power spectrumdensity of channel 1
Coherencespectrum
Cross-power spectrumdensity of channels1 and 2
Auto-power spectrumdensity of channel 2
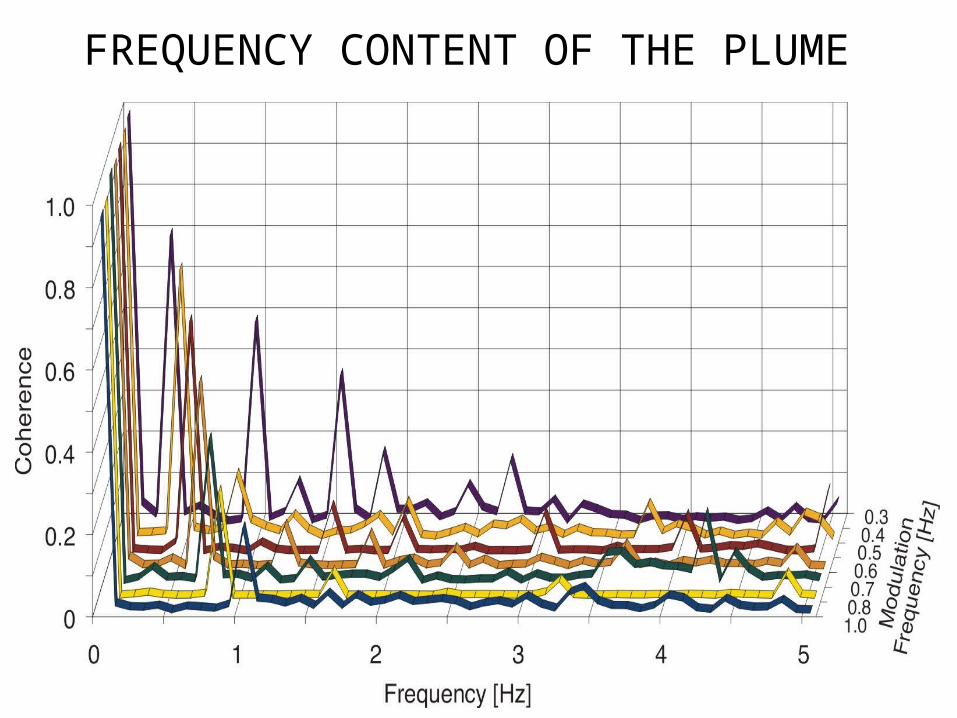
FREQUENCY CONTENT OF THE PLUME

FLUIDIC BANDWITH
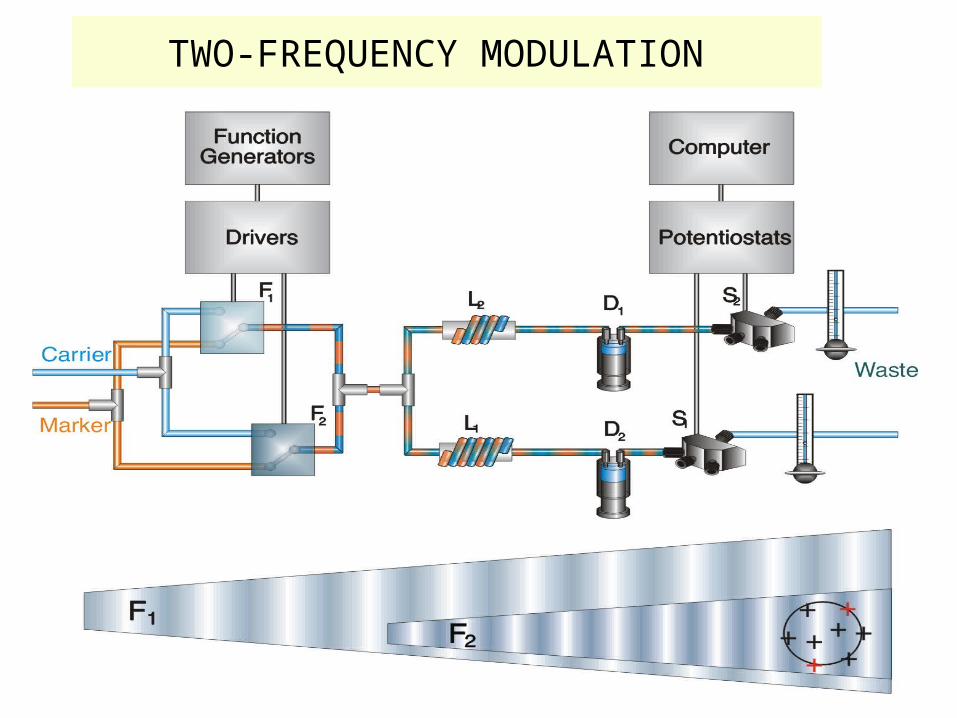
TWO-FREQUENCY MODULATION

COHERENCE PEAK ASSIGNMENTS
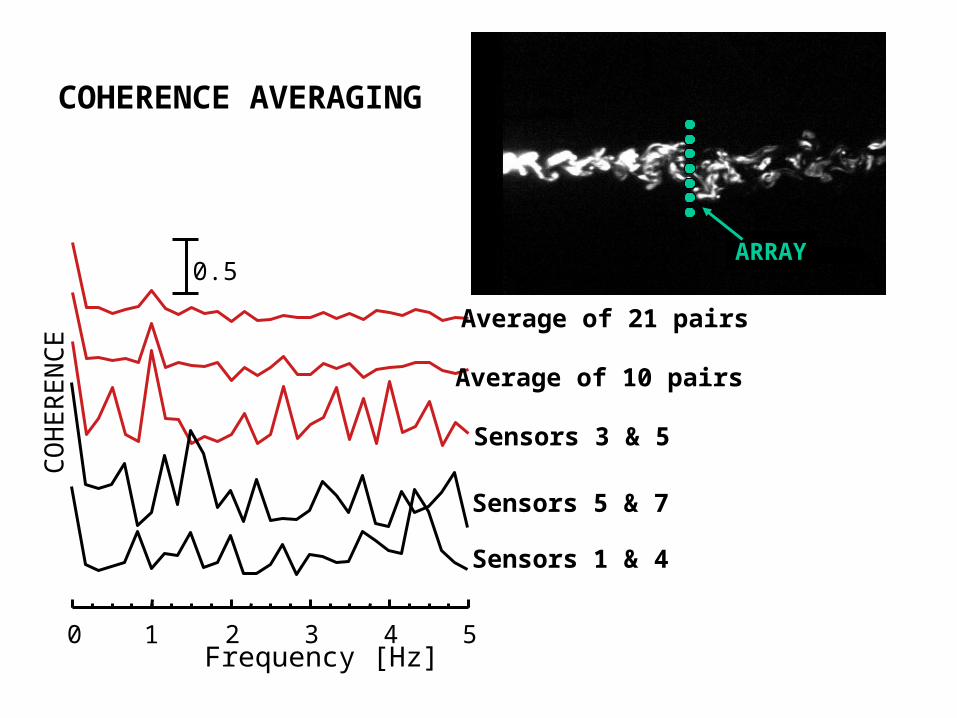
Sensors 3 & 5
0 2 3 4 5Frequency [Hz]
0.5
Sensors 5 & 7
Sensors 1 & 4
Average of 21 pairs
Average of 10 pairs
1
CO
HE
RE
NC
E
0.5 cm
COHERENCE AVERAGING
ARRAY

Do they use the frequency mode of information acquisition?Do they use the frequency mode of information acquisition?
QuickTime™ and a decompressor
are needed to see this picture.
AQUATIC ANIMALS---

Conclusions
• Information about source location appears to be frequency encoded in 0 ~ 5Hz bandwidth
• Coherence was found to be sensitive to:
- Orientation of the sensor array,
- Spacing between the sensors.
- Edge of the plume.
- Distance from the source
• Coherence in frequency-modulated plume shows peak at the modulation frequency given by the size and shape of the source
• Coherence is not sensitive to flow or dilution,
• Encoding in multiple frequencies is possible
• Blue crabs are very smart!
Electroanalysis , 12 (2000) 974 “Virtual Plume”
Biol. Bull., 200, (2001) 222 "Plume-tracking robots: a newapplication of chemical sensors,"
Anal. Chem., 73 (2001) 3662 “Chemical Plume Tracking, Part I:Chemical Information Encoding”
Anal. Chem., 73 (2001) 3669 “Chemical Plume Tracking, Part II:Frequency Modulation”
Environmental Fluid Mechanics “ A Multidisciplinary Study ofSpatial and Temporal Scales Containing Information in TurbulentChemical Plume Tracking”
Anal. Chem., 2002 “Chemical Plume Trackin g, Part III: Ascorbic Acid– a Viable Biological Marker”


