
Transcriptomic Analysis Reveals Calcium Regulation ofSpecific Promoter Motifs in Arabidopsis W
HelenJ.Whalley,a,1 AlexanderW.Sargeant,b JohnF.C. Steele,b TimLacoere,bRebeccaLamb,bNigel J. Saunders,c,2
Heather Knight,b and Marc R. Knightb,3
a Department of Plant Sciences, University of Oxford, Oxford OX1 3RB, United Kingdomb Plant Stress Lab, Durham Centre for Crop Improvement Technology, School of Biological and Biomedical Sciences, Durham
University, Durham DH1 3LE, United Kingdomc Sir William Dunn School of Pathology, University of Oxford, Oxford OX1 3RE, United Kingdom
Increases in intracellular calcium concentration ([Ca2+]c) mediate plant responses to stress by regulating the expression of
genes encoding proteins that confer tolerance. Several plant stress genes have previously been shown to be calcium-
regulated, and in one case, a specific promoter motif Abscisic Acid Responsive–Element (ABRE) has been found to be
regulated by calcium. A comprehensive survey of the Arabidopsis thaliana transcriptome for calcium-regulated promoter
motifs was performed bymeasuring the expression of genes in Arabidopsis seedlings responding to three calcium elevations of
different characteristics, using full genome microarray analysis. This work revealed a total of 269 genes upregulated by [Ca2+]cin Arabidopsis. Bioinformatic analysis strongly indicated that at least four promoter motifs were [Ca2+]c-regulated in planta. We
confirmed this finding by expressing in plants chimeric gene constructs controlled exclusively by these cis-elements and by
testing the necessity and sufficiency of calcium for their expression. Our data reveal that the C-Repeat/Drought-Responsive
Element, Site II, and CAM box (along with the previously identified ABRE) promoter motifs are calcium-regulated. The
identification of these promoter elements targeted by the second messenger intracellular calcium has implications for plant
signaling in response to a variety of stimuli, including cold, drought, and biotic stress.
INTRODUCTION
Research over the past 35 years has shown calcium to be as
important in plant cell signaling as it is in animal systems
(DeFalco et al., 2010; Dodd et al., 2010; Kudla et al., 2010). Its
role as a second messenger in plants has been well established
in responses to many abiotic and biotic stresses (Galon et al.,
2010a),; in response to hormones, for example, ABA (Kim et al.,
2010); and during development, for example, in the growth of
pollen tubes (Myers et al., 2009; Yan et al., 2009; Zhou et al.,
2009) and root hair cells (Bibikova et al., 1997; Very and Davies,
2000).Whereas animals respond to external stresses largely with
behavioral changes, the major plant response to stress is af-
fected through changes in gene expression, leading to reconfi-
guration of the proteome and resulting in improved stress
tolerance. For this reason, most research into the role of calcium
in plant stress responses has focused on the role calciumplays in
regulating gene expression. Several stress signaling pathways
use calcium as a second messenger. The expression of specific
stress-responsive genes has been demonstrated to be calcium-
regulated, for example, in response to cold (Knight et al., 1996;
Knight et al., 1997; Tahtiharju et al., 1997; Galon et al., 2010a).
The protein intermediates brokering calcium signals to regulate
gene expression have also, in some cases, been identified, for
example calmodulins (CaMs) (Takahashi et al., 2011), CaM-like
proteins (Chiasson et al., 2005; Magnan et al., 2008; Xu et al.,
2011), calcium-dependent protein kinases (CPKs) (Boudsocq
et al., 2010; Coca and Segundo, 2010), CIPK/CBLs (Albrecht
et al., 2003; Weinl and Kudla, 2009), and even transcription
factors, such as CaM-binding transcription activators (CAMTAs)
(Galon et al., 2008; Doherty et al., 2009; Du et al., 2009; Galon
et al., 2010b).
As a result of the interest in studying responses to particular
physiological stimuli, previous work on the calcium regulation of
gene expression has focused largely on selected single or small
numbers of genes per study. Such experiments do not allow
prediction of the global effects of calcium on plant gene expres-
sion or reveal the extent to which it may play a role. In one
exception, we have shown that a specific promoter motif, the
abscisic acid responsive-element (ABRE) is calcium-regulated in
Arabidopsis thaliana (Kaplan et al., 2006). This cis-element was
so named because of its prevalence in genes responding to
ABA-induced signaling pathways (Giuliano et al., 1988; Marcotte
et al., 1989), and it contains the core ACGTG, which is known as
the “G-box.” This G-box has been described at length as a cis-
acting promoter element involved in many diverse responses,
1Current address: Paterson Institute for Cancer Research, The Univer-sity of Manchester, Manchester M20 4BX, United Kingdom.2Current address: Systems Biology Laboratory, Centre for Systems andSynthetic Biology, Brunel University, Uxbridge, Middlesex UB8 3PH,United Kingdom.3 Address correspondence to [email protected] author responsible for distribution of materials integral to thefindings presented in this article in accordance with the policy describedin the Instructions for Authors (www.plantcell.org) is: Marc R. Knight([email protected]).WOnline version contains Web-only data.www.plantcell.org/cgi/doi/10.1105/tpc.111.090480
The Plant Cell, Vol. 23: 4079–4095, November 2011, www.plantcell.org ã 2011 American Society of Plant Biologists. All rights reserved.

including light, anaerobiosis, p-coumaric acid, ethylene, and
methyl jasmonate (Menkens et al., 1995). The fact that the ABRE is
calcium-regulated has implications for hundreds (if not thousands)
of genes in all plant genomes. Calcium regulation of the ABRE
motif was determined through transcriptomic and bioinformatic
approaches followed by empirical confirmation (Kaplan et al.,
2006). The power of this type of approach is that the data
obtained allows a broader perspective and greater predictive
power regarding calcium regulation of gene expression. How-
ever, it is clear from the diversity of genes that are known to be
calcium-regulated that the ABRE cannot be the only calcium-
regulated promoter motif. Our previous study (Kaplan et al.,
2006) may have failed to identify other calcium-regulated motifs
for many reasons. One major reason is that the study used
microarray chips of only 9216 expressed sequences tag repre-
senting only;6120 separate genes (Zik and Irish, 2003),;23%
of the genes in Arabidopsis. Another reason is that, in these
experiments, the cellular concentration of calciumwas artificially
elevated (in the absence of external stress) by one specific
treatment only. Different stresses and agonists are known to
cause transient elevations in intracellular calcium with defined
magnitude and duration; these different calcium profiles have
been termed “calcium signatures.” Some evidence suggests
that specific signatures activate particular transcriptional re-
sponses (Dolmetsch et al., 1997; McAinsh et al., 1997; Dolmetsch
et al., 1998; McAinsh and Pittman, 2009). It is therefore possible
that the particular calcium signature we used may have favored
activation of the ABRE over other promoter motifs. Thus, we
hypothesize that the relatively shallow transcriptomic data pool
and/or the limited characteristics of the calciumelevation applied
limited the potential to identify more than one calcium-regulated
promoter element. Therefore, to identify further promoter motifs
and perform a more comprehensive study, we combined tran-
scriptomic experiments using full genome chips (29,110 oligo-
nucleotides representing 26,173 protein-coding genes), along
with dendrimer technology to improve data depth, and combined
this with the application of three calcium elevations of different
characteristics. This approach revealed three more calcium-
responsive promoter motifs, which we have confirmed as being
calcium-regulated by empirical testing in planta. The implica-
tions of our findings, which broaden the picture on regulation of
gene expression by this global ion in plants, are reviewed in the
discussion.
RESULTS
Controlled Electrical Stimulations Elicit Specific Types of
[Ca2+]c Elevation
To interrogate the Arabidopsis genome to elucidate the full
potential of intracellular calcium elevations to regulate gene
expression, our first goal was to devise a system capable of
producing calcium elevations of different characteristics (mag-
nitude, duration, and multiple elevations) in Arabidopsis. Use of
chemical agonists, such as ionophores, mastoparan, CaM an-
tagonists, andDMSO, can lead to increases in [Ca2+]c (Takahashi
et al., 1998; Sangwan et al., 2002; Kaplan et al., 2006). However,
the characteristics of these elevations cannot easily be con-
trolled beyond altering the concentration of the agonist. Wewere
aware of reports that the action potential produced by applica-
tion of voltage is accompanied by an increase in intracellular
calcium [Ca2+]c in Chara spp (Williamson and Ashley, 1982) and
that similar action potentials produced by voltage in higher plants
can stimulate gene expression (Wildon et al., 1992; Herde et al.,
1995). We therefore tested the hypothesis that application of
voltage to Arabidopsiswould cause an increase in [Ca2+]c, which
we could subsequently use to study calcium-regulated gene
expression. We were successful in stimulating [Ca2+]c increases
in seedlings expressing the calcium sensor aequorin (Knight
et al., 1991; Knight and Knight, 1995) using voltage application
(Figure 1). Moreover, we were able to control the characteristics
of the [Ca2+]c elevation using software to control the intensity and
temporal dynamics of the voltage applied (see Methods). Using
this system, it was possible to produce a single, transient
elevation in [Ca2+]c (Figure 1A), a series of transient elevations
in [Ca2+]c (Figure 1B), or to continually elevate [Ca2+]c for a
prolonged period (Figure 1C).
Imposed [Ca2+]c Elevations Are Capable of Inducing
Significant Changes in Gene Expression in Arabidopsis
We set out to measure global gene expression changes in
response to the three different types of [Ca2+]c elevation shown in
Figure 1 (black lines). Each treatment was performed on two
independent occasions, and seedlings were harvested for gene
expression analysis 1 h after the end of each treatment, along
with a matched unstimulated control (gray lines in Figure 1). For
each treatment, microarray analysis was performed by compar-
ing the treated sample with the untreated control in two dye-
balanced biological replicates. For these experiments, we used
microarray slides printed with the Operon Arabidopsis Genome
Oligo Set Version 3 (Dr. DavidGalbraith, University of Arizona). As
in the study by Okamoto et al. (2009), we chose to perform the
microarray experiments using the Genisphere 3DNA Array 900
indirect cDNA labeling kit, because the indirect labeling method
has many advantages over conventional microarrays, which use
direct incorporation (Stears et al., 2000). For analysis, the raw
data for each array was input into the onlinemicroarray database
software BioArray Software Environment (BASE) (Saal et al.,
2002). We used bespoke plug-ins developed by the Computa-
tional Biology Research Group (CBRG) in Oxford to perform
many preanalytical steps on the raw data, including a cross-
channel correction on each individual microarray spot and a
global normalization procedure (see Methods). Because each
treatment type was performed only in duplicate, we decided to
use a statistical test based on Bayesian statistics, which has
been shown to identify expression changes for experiments with
low numbers of replicates more reliably than approaches based
on a Student’s t test or fold change (Long et al., 2001). This
statistical approach is incorporated into the Cyber-T test (Baldi
and Long, 2001; Long et al., 2001), which was integrated into the
BASEprogramby theCBRG.Because validation experiments on
the indirect labeling method for Arabidopsis have revealed a fold
ratio resolution of 1.3- to 1.4-fold (based on a range of two times
the SD), we chose to use a 1.5-fold ratio to the control as the
4080 The Plant Cell

threshold to define a gene expression change. Table 1 shows the
number of genes that were changed by more than 1.5-fold from
the control with a Cyber-T P-value of <0.05 for each of the
treatments (see Supplemental Data Set 1 online for the full gene
lists).
The treatment with the greatest effect on gene expression was
the oscillating [Ca2+]c elevation, by which 256 genes were
upregulated, and 97 genes were downregulated. By contrast,
the prolonged [Ca2+]c elevation led to the upregulation of only 10
genes and the downregulation of only 17 genes, despite the total
area of [Ca2+]c for this treatment being very similar to that of the
oscillating treatment (Figure 1). Comparison of the upregulated
gene lists from the single transient and oscillating [Ca2+]c treat-
ments revealed a large degree of overlap (47 of the 104 genes
upregulated by the single transient elevation were also upregu-
lated by the oscillating [Ca2+]c treatment). Because we were
interested in identifying all regulatory elements affected by
[Ca2+]c changes, we combined the transient and oscillation
experiments in BASE to produce higher-confidence [Ca2+]c-
regulated gene lists. We set the parameters to identify genes that
were changed in at least two of the four experiments, so that
genes that were absent in one replicate would now also be
identified. This gave a list of 363 genes changed—of which 269
were upregulated, and 94 were downregulated (Table 1). This
gene list can also be found in Supplemental Data Set 1 online.
To assess whether the genes upregulated by our [Ca2+]ctreatments overlap with responses to real biological stimuli, we
performed functional classification analysis on our combined up-
and downregulated gene lists, using the Bio-Array Resource
Classification Superviewer (see Methods). The frequency (nor-
malized to the frequency expected when considering all Arabi-
dopsis genes) andP-value for the “Biological Process” (aswell as
the “Molecular Function and Cellular Component”) classifica-
tions can be found in Supplemental Data Set 2 online. For the
“Biological Process” classification, no significant (P < 0.05)
frequencies were observed in the group of downregulated
genes. However, the 269 upregulated genes gave a highly
significant enrichment for genes involved in “response to stress”
(3.71-fold, P = 3.63 3 10218) and “response to abiotic or biotic
stimulus” (3.46-fold, P = 6.06 3 10214). To investigate this in
more detail, we compared our upregulated gene list with publicly
available AtGenExpress data for abiotic and biotic stress exper-
iments. For this analysis, we used the Bio-Array Resource
Expression browser, which returned all AtGenExpress experi-
ments for which the genes in our list displayed an average fold
change of twofold or greater. For the abiotic stresses, the twofold
threshold was exceeded for microarray experiments performed
at various time points after cold, drought, heat, osmotic, UV-B
light, and wounding stresses (see Supplemental Table 1 online).
Our upregulated genes also returned greater than twofold
changes for some biotic experiments, including response to
Botrytis cinerea infection (see Supplemental Table 2 online).
Known cis-Element Sequences Are Overrepresented in the
Promoters of [Ca2+]c-Stimulated Genes
To identify potential calcium-activated DNA regulatory sites, we
entered the 500-bp upstream regions of the genes from our
amalgamated up- and downregulated gene lists into the Regu-
latory Sequence Analysis Tool (RSAT; http://rsat.ulb.ac.be/rsat).
RSAT searches for overrepresented motifs using predefined
oligonucleotide frequencies for Arabidopsis and a user-defined
oligonucleotide length (van Helden et al., 1998; van Helden,
2003). No significantly overrepresented short sequences were
found in the group of downregulated genes. However, several
motifs were significantly overrepresented in promoter regions of
the upregulated gene list (Table 2). It can be seen upon close
inspection of these sequences that many of the overrepresented
motifs are represented several times, because themotifs overlap
Figure 1. Calcium Elevations with Different Characteristics Used for
Gene Expression Analysis.
Arabidopsis seedlings expressing cytosolic aequorin were reconstituted
overnight in coelenterazine. Between 8 to 10 aequorin-expressing seed-
lings and four wild-type seedlings were floated in standard media in an
electrostimulation cuvette for 2 h before treatment. Graphs show the
average [Ca2+]c response of the seedlings for unstimulated control (gray
lines) and for seedlings stimulated by voltage (black lines) to produce a
single transient [Ca2+]c elevation (A), a series of repeated transients in
[Ca2+]c (B), or a prolonged [Ca2+]c elevation (C).
(A) to (C) A representative [Ca2+]c trace (one of two replicates) is shown
(five aequorin-expressing seedlings were frozen to calibrate the results).
The average total [Ca2+]cyt (6SD) mobilized for each treatment (minus the
area of the control treatment) was (A) 18.056 1.42 mM, (B) 40.46 6 3.04
mM, and (C) 39.66 6 0.22 mM. See Methods for details of applied
electrical stimulus.
Calcium Regulation of Gene Expression 4081
partially with other hexamers (see codes in “Seq” column of
Table 2). Indeed, the RSAT program automatically aligns hexa-
mers that contain overlapping sequences to produce a consen-
sus sequence for each potential regulatory site. Two such
alignments (see Supplemental Figure 1 online) seemed to con-
tain two separate core sequences that, because of their similar-
ity, had been aligned together.We therefore separated these into
two sets of sequences and aligned these manually (Figures 2A
and 2B). The first of these sequences, ACACGTG, contains the
core sequence of the G-box or ABA-responsive element
(ACGTG), which has been described on many occasions as a
cis-acting promoter element involved in responses to many
stimuli, for example light, anaerobiosis, p-coumaric acid, absci-
sic acid, ethylene, and methyl jasmonate (Menkens et al., 1995).
This cis-element is activated by the ABRE-binding Factor (ABF)
family of bZIP transcription factors (Choi et al., 2000). The second
sequence, ACGCGT, is similar to the ABRE but instead has the
core sequence CGCG, which is the binding site for CAMTAs
(Bouche et al., 2002); we will refer to this site as the “CAM box.”
The two other alignments from RSAT (Figures 2C and 2D) also
revealed sequences that we identified as previously described
cis-regulatory elements. The sequence ACCGACAT (Figure 2C)
matches the core sequence (CCGAC) of the C repeat (CRT) or
drought response element (DRE), a cis-acting element that
regulates the expression of genes responding to drought, low
temperature, or high salt (Yamaguchi-Shinozaki and Shinozaki,
Table 1. Numbers of Genes Significantly Changed by the Three Characteristically Distinct [Ca2+]c Elevations
Experiment (Total No. of Slides in BASE Experiment) Upregulated Downregulated Total
Transient (2) 104 30 134
Oscillations (2) 256 97 353
Prolonged (2) 10 17 27
Oscillations and transient combined (4) 269 94 363
The software package BASE was used to analyze gene expression changes in the indicated experiments. The number of genes for each experiment
that were >1.5-fold altered from the control and had a Cyber-T P-value of <0.05 are shown. For the single experiments (Transient, Oscillations,
Prolonged), genes were required to be present in both of the two replicates to be considered significant. For the “Oscillations and transient combined”
category, both replicates of these two experiments were combined into one experiment (to give four slides in total), and genes were required to be
present in any two of the four experiments.
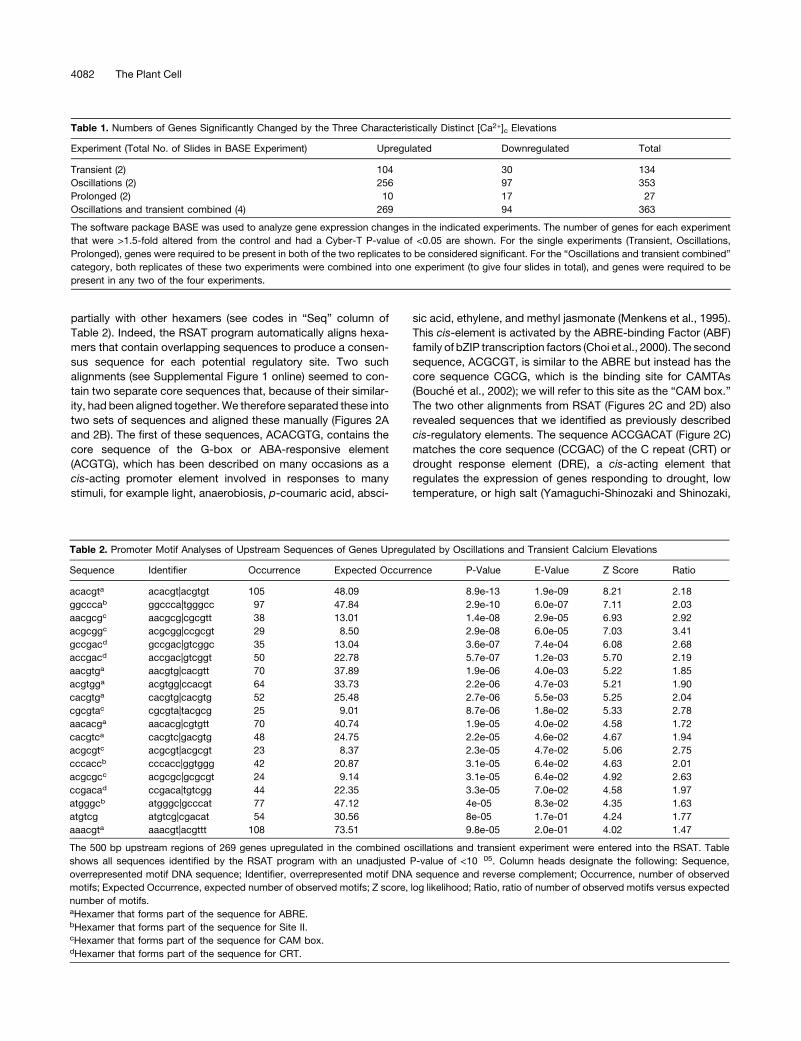
Table 2. Promoter Motif Analyses of Upstream Sequences of Genes Upregulated by Oscillations and Transient Calcium Elevations
Sequence Identifier Occurrence Expected Occurrence P-Value E-Value Z Score Ratio
acacgta acacgt|acgtgt 105 48.09 8.9e-13 1.9e-09 8.21 2.18
ggcccab ggccca|tgggcc 97 47.84 2.9e-10 6.0e-07 7.11 2.03
aacgcgc aacgcg|cgcgtt 38 13.01 1.4e-08 2.9e-05 6.93 2.92
acgcggc acgcgg|ccgcgt 29 8.50 2.9e-08 6.0e-05 7.03 3.41
gccgacd gccgac|gtcggc 35 13.04 3.6e-07 7.4e-04 6.08 2.68
accgacd accgac|gtcggt 50 22.78 5.7e-07 1.2e-03 5.70 2.19
aacgtga aacgtg|cacgtt 70 37.89 1.9e-06 4.0e-03 5.22 1.85
acgtgga acgtgg|ccacgt 64 33.73 2.2e-06 4.7e-03 5.21 1.90
cacgtga cacgtg|cacgtg 52 25.48 2.7e-06 5.5e-03 5.25 2.04
cgcgtac cgcgta|tacgcg 25 9.01 8.7e-06 1.8e-02 5.33 2.78
aacacga aacacg|cgtgtt 70 40.74 1.9e-05 4.0e-02 4.58 1.72
cacgtca cacgtc|gacgtg 48 24.75 2.2e-05 4.6e-02 4.67 1.94
acgcgtc acgcgt|acgcgt 23 8.37 2.3e-05 4.7e-02 5.06 2.75
cccaccb cccacc|ggtggg 42 20.87 3.1e-05 6.4e-02 4.63 2.01
acgcgcc acgcgc|gcgcgt 24 9.14 3.1e-05 6.4e-02 4.92 2.63
ccgacad ccgaca|tgtcgg 44 22.35 3.3e-05 7.0e-02 4.58 1.97
atgggcb atgggc|gcccat 77 47.12 4e-05 8.3e-02 4.35 1.63
atgtcg atgtcg|cgacat 54 30.56 8e-05 1.7e-01 4.24 1.77
aaacgta aaacgt|acgttt 108 73.51 9.8e-05 2.0e-01 4.02 1.47
The 500 bp upstream regions of 269 genes upregulated in the combined oscillations and transient experiment were entered into the RSAT. Table
shows all sequences identified by the RSAT program with an unadjusted P-value of <10�05. Column heads designate the following: Sequence,
overrepresented motif DNA sequence; Identifier, overrepresented motif DNA sequence and reverse complement; Occurrence, number of observed
motifs; Expected Occurrence, expected number of observed motifs; Z score, log likelihood; Ratio, ratio of number of observed motifs versus expected
number of motifs.aHexamer that forms part of the sequence for ABRE.bHexamer that forms part of the sequence for Site II.cHexamer that forms part of the sequence for CAM box.dHexamer that forms part of the sequence for CRT.
4082 The Plant Cell
1994). Two families of proteins that bind to the CRT in promoters
of genes responding to these stresses are C repeat binding
factors (CBFs; also known as DRE binding factor 1s [DREB1s])
and DREB2s (Jaglo-Ottosen et al., 1998; Liu et al., 1998). The
sequence AGGCCCAT (Figure 2D) contains the core of a se-
quence originally described as one of three cis-acting elements
in the promoter of the proliferating cell nuclear antigen (PNCA)
gene, originally in rice (Oryza sativa), which was thus designated
Site IIa (Kosugi et al., 1995). Rice proteins identified as binding to
this motif include bHLH transcription factors PCF1 and PCF2
(Kosugi and Ohashi, 1997). In Arabidopsis, the same Site II
sequenceGGCCCAand slight variations are bound by a family of
transcription factors known as the TCP family, which share
sequence similarity with rice PCF1/PCF2 (reviewed in Martın-
Trillo and Cubas, 2010). The Arabidopsis TCP proteins, and their
binding motif, have been described on many occasions as
regulatory elements involved in regulating genes required for
cell cycle control, growth, and development (Tremousaygue
et al., 2003; Li et al., 2005; Welchen and Gonzalez, 2005, 2006;
Herve et al., 2009; Pruneda-Paz et al., 2009). To our knowledge,
there have been no previous reports of the involvement of
calcium signaling upstreamof this cis-element or its transcription
factors.
To help confirm these short sequences as bona fide cis-
elements in our gene list, we mapped the positions of the central
hexamer of each of the four alignments in the 500-bp upstream
regions of our 269 upregulated genes. All four hexamers become
enriched toward the start of transcription (see Supplemental
Figure 2 online), as would be expected of functional cis-
elements. We also analyzed association between the four
different motifs by identifying genes (within the 269 upregu-
lated) that contained the core hexamer of one or more of the
motifs in their 500-bp upstream regions and calculating the
proportion of association of each motif with the other three
(see Supplemental Figure 3 online). Most (79%) gene pro-
moters contained only one of the motifs, but associations
were also found between all of the motifs, with CRT being
associated with other motifs (specifically the ABRE and Site II)
to a higher proportional extent than the others. We used the
same gene lists that we used for the association analysis, as
well as tools from the Bio-Array Resource, to investigate the
biological function of the genes containing each of the motifs
in their promoters. The Classification Superviewer revealed
that the gene groups for all four motifs were significantly
enriched for genes involved in “response to abiotic or biotic
stimulus” and/or “response to stress” (see Supplemental Data
Set 3 online). We subsequently compared these gene lists with
AtGenExpress data for abiotic and biotic stress experiments
using the Expression browser. This revealed that gene lists for
each of the individual motifs displayed a greater than twofold
change in AtGenExpress experiments following a range of
abiotic stresses (see Supplemental Data Set 4 online). The
highest fold change for the ABRE-, CRT-, and CAM box–
containing genes was cold stress (52.33-fold, 45.66-fold, and
11.68-fold, respectively). The Site II–containing genes also
showed up to an 8.98-fold upregulation in the cold experi-
ments, but the highest fold change for this gene set was heat
stress (20.91-fold). All of the gene lists, except that of the CAM
box (which was the smallest gene list, with only 20 genes) also
returned greater than twofold changes in response to biotic
stimuli (see Supplemental Data Set 4 online).
Because the motifs identified have all been previously de-
scribed in the literature, and because their transcriptional binding
proteins have been identified, we also searched our list of 269
upregulated genes for all known members of these families of
transcription factors (CBFs, CAMTAs, TCPs, and ABFs). Only
one of these genes, At3g02150, which encodes TCP13, was
upregulated (Cyber-T p-value, 0.0057; median fold ratio, 1.78).
In Vivo Validation of Calcium-Responsive cis-Elements
BothABRE andCAMbox conformwith the (A/C)ACG(T/C)G(T/G/
C) consensus sequence identified previously as potentially being
calcium-regulated (Kaplan et al. 2006). However, only the ABRE
(not the CAM box) was subsequently shown using reporter
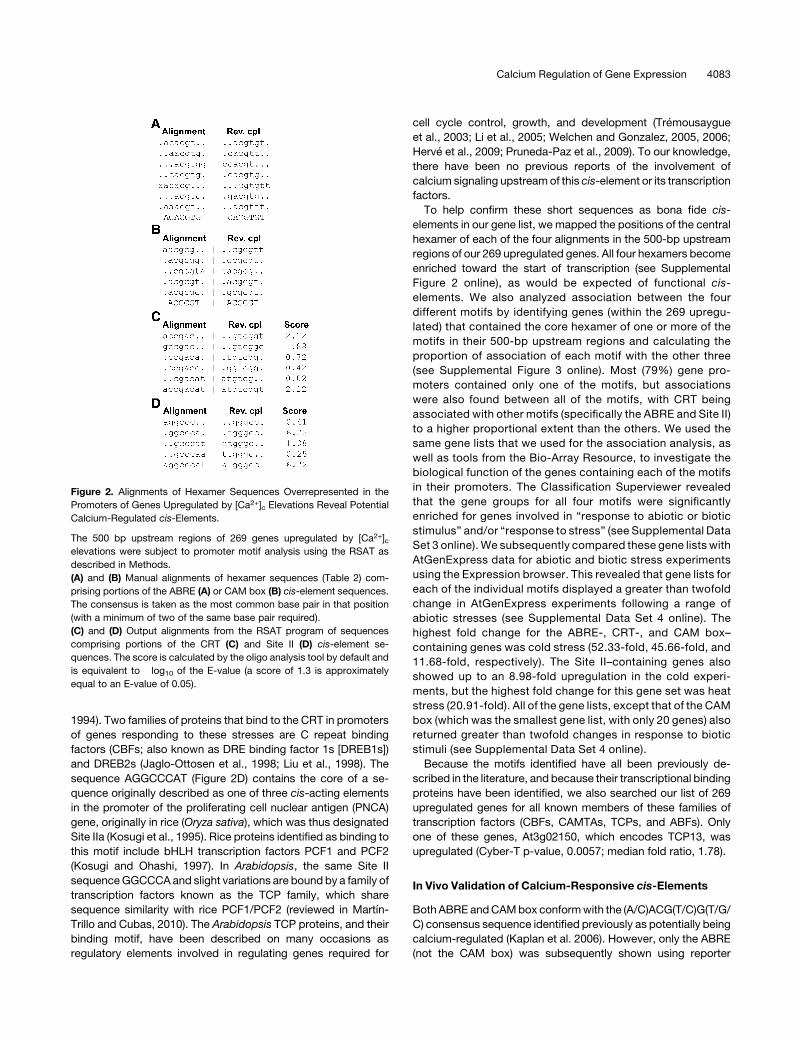
Figure 2. Alignments of Hexamer Sequences Overrepresented in the
Promoters of Genes Upregulated by [Ca2+]c Elevations Reveal Potential
Calcium-Regulated cis-Elements.
The 500 bp upstream regions of 269 genes upregulated by [Ca2+]celevations were subject to promoter motif analysis using the RSAT as
described in Methods.
(A) and (B) Manual alignments of hexamer sequences (Table 2) com-
prising portions of the ABRE (A) or CAM box (B) cis-element sequences.
The consensus is taken as the most common base pair in that position
(with a minimum of two of the same base pair required).
(C) and (D) Output alignments from the RSAT program of sequences
comprising portions of the CRT (C) and Site II (D) cis-element se-
quences. The score is calculated by the oligo analysis tool by default and
is equivalent to �log10 of the E-value (a score of 1.3 is approximately
equal to an E-value of 0.05).
Calcium Regulation of Gene Expression 4083

assays to be induced in response to calcium (Kaplan et al., 2006).
To directly test calcium responsiveness of the CRT and Site II,
along with the consensus ABRE and CAM box identified by
microarray analysis, we first fused these regulatory elements to a
luciferase (LUC) reporter gene. Our strategy was to produce
chimeric genes with four copies of each element (Rushton et al.,
2002) fused to the LUC+ reporter (Figure 3) and subsequently
to use real-time PCR to detect LUC+ transcripts in response
to [Ca2+]c. For these experiments, we decided to use DMSO
and mastoparan, chemical agents previously shown to increase
[Ca2+]c in plants (Takahashi et al., 1998; Sangwan et al., 2002;
Kaplan et al., 2006). DMSO is a commonly used polar aprotic
solvent that has been shown to increase Ca2+ influx in plants
because of its rigidifying effects on cell plasma membranes,
which allows opening of calcium channels (Orvar et al., 2000).
Mastoparan is a G protein–activating cationic-amphiphilic tetra-
decapeptide, which in mammalian cells leads to elevations in
[Ca2+]c through activation of PLC (Perianin and Snyderman,
1989). Although the mechanism of the [Ca2+]c response to
mastoparan in plants is still not fully understood, it is certainly
different from the mechanism of DMSO (Takahashi et al., 1998);
therefore, a response to both of these treatments would give a
very strong indication of that our cis-elements are genuinely
calcium-regulated.
To confirm that DMSO and mastoparan were capable of
triggering [Ca2+]c elevations in our experimental system, Arabi-
dopsis seedlings, we tested their effects by measuring [Ca2+]cusing seedlings expressing aequorin (Knight and Knight, 1995).
As can be seen in Figures 4A and 4B, DMSO and mastoparan
both led to elevations in [Ca2+]c in Arabidopsis seedlings. In the
case of DMSO, this elevation was greater in magnitude and
duration than with mastoparan, but mastoparan produced a
more prolonged subsequent response. To confirm that these
[Ca2+]c elevations were capable of triggering the expression of
[Ca2+]c-regulated genes, we used quantitative real-time PCR to
test the effects of DMSO and mastoparan on the expression of
three genes selected from our list of 269 upregulated genes. The
transcripts of all three of these genes were increased in response
to both DMSO andmastoparan to varying degrees (Figures 4C to
4E). Having demonstrated that these chemical agonists were
capable of inducing expression of these candidate genes, we
proceeded to test our chimeric CRT-, ABRE-, CAM box–, and
Site II–LUC+ genes versus a similar construct lacking the cis-
element repeats (control). We found that all four constructs
showed increased LUC+ transcript levels in response to both
DMSO and mastoparan, but the control displayed no such
increase in expression (Figure 5). Two of the constructs, the
ABRE and CAM box, were significantly more highly induced by
mastoparan than DMSO (Figures 5A and 5B), whereas the CRT
and Site II did not show a significant difference in their levels of
LUC+ expression with the two [Ca2+]c agonists (Figures 5C and
5D). These data strongly indicated that these cis-elements are
calcium-regulated. We were also interested in whether the chi-
meric cis-element constructs would be responsive to real phys-
iological stimuli. We therefore measured LUC+ expression from
our chimeric genes after cold treatment. The CRT and CAM box
were upregulated after 24 h of cold treatment, but the ABRE and
Site II did not display increased expression in response to cold
(see Supplemental Figure 4 online).
cis-Element Responses to Mastoparan Treatment Are
[Ca2+]c-Dependent
The response of the cis-elements to treatmentswith two different
calcium agonists strongly indicated that they were responsive to
[Ca2+]c elevations in the absence of physiological stimuli. How-
ever, to confirm that their induction was due to the [Ca2+]celevation specifically, it is necessary to control for other calcium-
independent effects of the calcium agonists. By blocking the
[Ca2+]c elevation induced by an agonist, one can assess whether
changes in [Ca2+]c were truly responsible for the gene expression
changes. Lanthanum chloride (LaCl3) has been widely used to
inhibit the action of calcium channels (Knight et al., 1992; Knight
et al., 1996; Knight et al., 1997), usually at concentrations of 5 to
10 mM. However, at these concentrations, LaCl3 itself induces a
small elevation in [Ca2+]c (Figure 6A), which may also affect gene
expression. We therefore decided to test a range of LaCl3 con-
centrations in combination with mastoparan (because in general
this was more successful at inducing LUC+ expression than
DMSO) (Figure 5) to identify the lowest concentration that would
effectively block the [Ca2+]c elevation while minimizing the effect
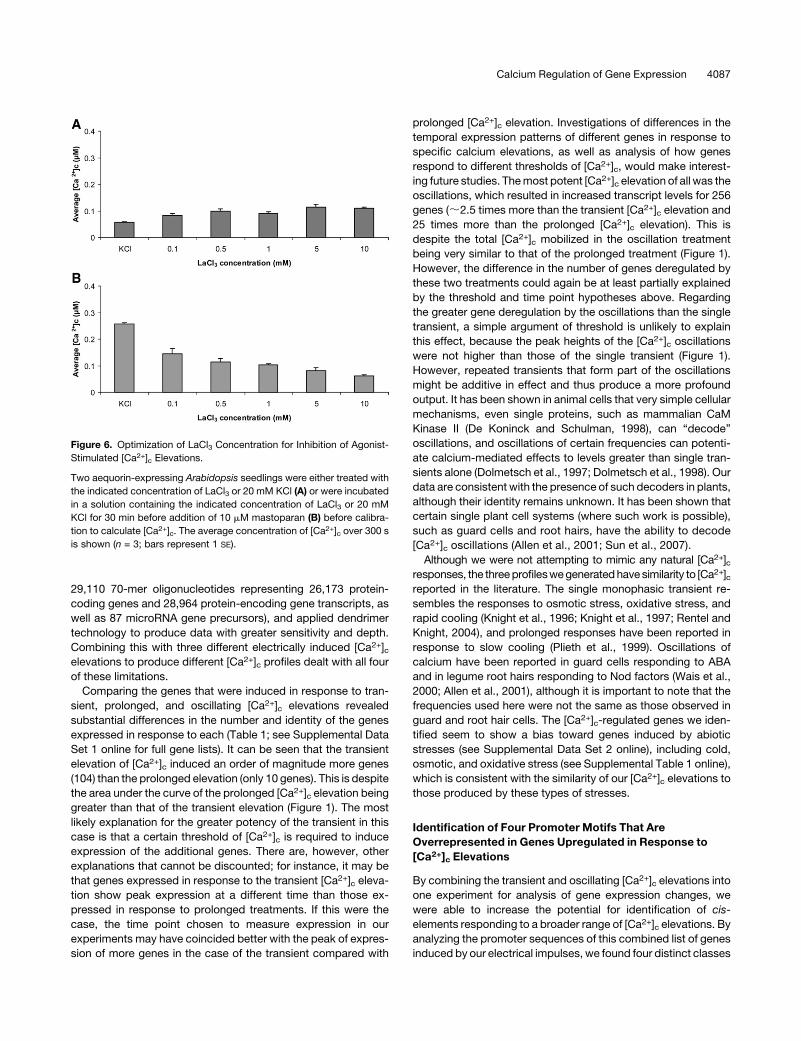
of LaCl3 alone on [Ca2+]c. Figure 6A shows that lanthanum
treatment provoked a [Ca2+]c increase in a dose-dependent
manner. Lanthanum concentrations of 5 and 10mMgave [Ca2+]celevations that were noticeably higher than at lower concentra-
tions. There was no significant difference between the [Ca2+]celevations produced by LaCl3 concentrations of 0.1 to 1 mM
(Figure 6A). Inhibition of mastoparan-induced [Ca2+]c was
greater at 1 mM than at 0.5 mM and 0.1 mM (Figure 6B).
Therefore, we chose to use 1 mM LaCl3 to inhibit the [Ca2+]celevations induced by mastoparan for subsequent gene expres-
sion studies (incorporating controls that received only 1 mM
LaCl3 into all experiments). Figure 7 shows that mastoparan-
induced LUC+ expression driven byCRT, ABRE, Site II, andCAM
Figure 3. Schematic of Constructs Used for Concatemer Studies.
The promoter region between the two NcoI sites was produced by PCR
amplification. The NcoI-digested PCR fragment was then cloned into
pDHLC+2, which contained the LUC+ coding region (the start codon of
the LUC+ coding region is incorporated in the NcoI site). The promoter-
LUC+ cassette was then cloned into the EcoRI site of pBIN19 for stable
expression in plants. The exact sequence of the four repeats for each cis-
element is shown in the table. A control construct, lacking the cis-
element repeats, was produced in a similar way.
4084 The Plant Cell

box sites were all strongly inhibited by lanthanum. This demon-
strates that mastoparan induction of expression through the
CRT, ABRE, Site II, and CAM box promoter motifs is truly
[Ca2+]c-dependent.
Finally, because the Site II and CAM box had not been
previously demonstrated to be activated by [Ca2+]c elevations
induced by N-(6-aminohexyl)-5-chloro-1-naphthalenesulfona-
mide hydrochloride (W7) (Kaplan et al., 2006), it was possible
that these two motifs were differentially sensitive to the [Ca2+]csignatures produced by DMSO and mastoparan compared with
that produced byW7. To test this, wemeasured LUC+ expression
driven by the Site II and CRT motifs in response to W7-induced
[Ca2+]c elevation in combination with LaCl3 pretreatment, as in
Kaplan et al. (2006). Figure 8 shows that Site II was clearly and
Figure 4. DMSO and Mastoparan Stimulate Increases in [Ca2+]c and Induce Expression of Selected Genes That Were Upregulated by Electrically
Stimulated [Ca2+]c Elevations.
(A) and (B) Arabidopsis seedlings expressing cytosolic aequorin were reconstituted overnight in coelenterazine, and [Ca2+]c measurements were
performed by luminometry. DMSO (2% v/v) (A) and mastoparan (10 mM) (B) treatments were applied at the time shown by the arrow. The average
calibrated [Ca2+]c response of two seedlings is shown (representative of three experiments).
(C) to (E) Under the same conditions, seedlings were harvested after 3 h treatment compared with a water control (mock). RQ values for expression of
At1g51090 (C), At1g02400 (D), and At1g01470 (E) measured using real-time PCR are shown. In each case, expression was normalized to expression
values for PEX4 (endogenous control). Each value is the mean of three technical replicates. Error bars indicate RQMIN and RQMAX, which constitute the
acceptable error for a 95% confidence limit according to Student’s t test.
Calcium Regulation of Gene Expression 4085
strongly induced in response to W7 in a [Ca2+]c-dependant
manner, but the CRT element was only very weakly induced.
DISCUSSION
Electrical Impulses Can Be Used to Generate “Designer”
[Ca2+]c Elevations
Wedescribe a powerful approach to produce [Ca2+]c elevations
with user-defined parameters including magnitude, duration,
and frequency of oscillation (Figure 1). A major advantage of
this method over the application of different chemical calcium
agonists to produce particular increases in [Ca2+]c is that each
[Ca2+]c elevation is produced by the same primary treatment
type (electrical impulse), thus reducing the likelihood of stimulus-
specific secondary effects. Using electrical stimulation, we pro-
duced three distinct [Ca2+]c elevations: single transients (Figure
1A), prolonged elevations (Figure 1C), and oscillations (Figure
1B).
We tested the ability of these distinct [Ca2+]c elevations to
induce gene expression in Arabidopsis seedlings. Calcium has
been shown to be necessary as well as sufficient for expression
of some plant genes, such as GST1 in response to ozone
(Clayton et al., 1999) and KIN1 and KIN2 in response to cold in
Arabidopsis (Knight et al., 1996; Tahtiharju et al., 1997). In a
previous study, we broadened the scope of this method of
inquiry by testing the expression of 6120 genes in response to a
chemical calcium agonist. This work resulted in the identification
of the ABRE as a Ca2+-regulated promoter motif (Kaplan et al.,
2006). We wished to build upon this work, because there were
several limitations to this original study. First, only one promoter
motif was identified as [Ca2+]c-regulated (Kaplan et al., 2006).
Given the number of genes reported in the literature to be
calcium-regulated, and taking into consideration the number of
regulons that likely include these genes (Galon et al., 2010a), it
seemed probable that there remained other elements to be
discovered. Second, themicroarray analysis was performedwith
chips, allowing detection of transcript levels for only 6120 indi-
vidual genes. Third, only one [Ca2+]c signature was tested; it is
possible that genes sensitive to particular parameters of an
increase in [Ca2+]c not represented by this specific elevation
were not responsive to this treatment. Finally, the agonist used
was the CaM inhibitor W7. In hindsight, this may have been a
poor choice, because it inhibits both CaM and CPKs, and
consequently is likely to interfere with the signal transduction
process linking elevated [Ca2+]c to gene expression. Therefore,
we performed a new analysis on full genome chips (comprising
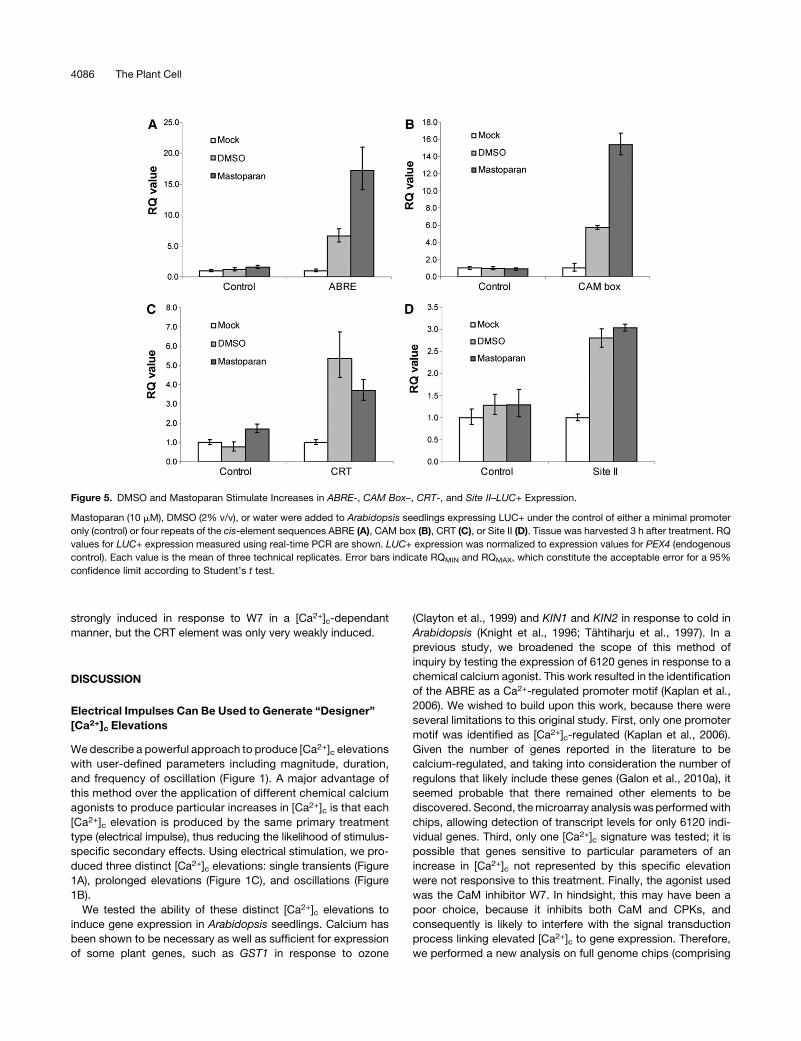
Figure 5. DMSO and Mastoparan Stimulate Increases in ABRE-, CAM Box–, CRT-, and Site II–LUC+ Expression.
Mastoparan (10 mM), DMSO (2% v/v), or water were added to Arabidopsis seedlings expressing LUC+ under the control of either a minimal promoter
only (control) or four repeats of the cis-element sequences ABRE (A), CAM box (B), CRT (C), or Site II (D). Tissue was harvested 3 h after treatment. RQ
values for LUC+ expression measured using real-time PCR are shown. LUC+ expression was normalized to expression values for PEX4 (endogenous
control). Each value is the mean of three technical replicates. Error bars indicate RQMIN and RQMAX, which constitute the acceptable error for a 95%
confidence limit according to Student’s t test.
4086 The Plant Cell
29,110 70-mer oligonucleotides representing 26,173 protein-
coding genes and 28,964 protein-encoding gene transcripts, as
well as 87 microRNA gene precursors), and applied dendrimer
technology to produce data with greater sensitivity and depth.
Combining this with three different electrically induced [Ca2+]celevations to produce different [Ca2+]c profiles dealt with all four
of these limitations.
Comparing the genes that were induced in response to tran-
sient, prolonged, and oscillating [Ca2+]c elevations revealed
substantial differences in the number and identity of the genes
expressed in response to each (Table 1; see Supplemental Data
Set 1 online for full gene lists). It can be seen that the transient
elevation of [Ca2+]c induced an order of magnitude more genes
(104) than the prolonged elevation (only 10 genes). This is despite
the area under the curve of the prolonged [Ca2+]c elevation being
greater than that of the transient elevation (Figure 1). The most
likely explanation for the greater potency of the transient in this
case is that a certain threshold of [Ca2+]c is required to induce
expression of the additional genes. There are, however, other
explanations that cannot be discounted; for instance, it may be
that genes expressed in response to the transient [Ca2+]c eleva-
tion show peak expression at a different time than those ex-
pressed in response to prolonged treatments. If this were the
case, the time point chosen to measure expression in our
experiments may have coincided better with the peak of expres-
sion of more genes in the case of the transient compared with
prolonged [Ca2+]c elevation. Investigations of differences in the
temporal expression patterns of different genes in response to
specific calcium elevations, as well as analysis of how genes
respond to different thresholds of [Ca2+]c, would make interest-
ing future studies. Themost potent [Ca2+]c elevation of all was the
oscillations, which resulted in increased transcript levels for 256
genes (;2.5 times more than the transient [Ca2+]c elevation and
25 times more than the prolonged [Ca2+]c elevation). This is
despite the total [Ca2+]c mobilized in the oscillation treatment
being very similar to that of the prolonged treatment (Figure 1).
However, the difference in the number of genes deregulated by
these two treatments could again be at least partially explained
by the threshold and time point hypotheses above. Regarding
the greater gene deregulation by the oscillations than the single
transient, a simple argument of threshold is unlikely to explain
this effect, because the peak heights of the [Ca2+]c oscillations
were not higher than those of the single transient (Figure 1).
However, repeated transients that form part of the oscillations
might be additive in effect and thus produce a more profound
output. It has been shown in animal cells that very simple cellular
mechanisms, even single proteins, such as mammalian CaM
Kinase II (De Koninck and Schulman, 1998), can “decode”
oscillations, and oscillations of certain frequencies can potenti-
ate calcium-mediated effects to levels greater than single tran-
sients alone (Dolmetsch et al., 1997; Dolmetsch et al., 1998). Our
data are consistent with the presence of such decoders in plants,
although their identity remains unknown. It has been shown that
certain single plant cell systems (where such work is possible),
such as guard cells and root hairs, have the ability to decode
[Ca2+]c oscillations (Allen et al., 2001; Sun et al., 2007).
Although we were not attempting to mimic any natural [Ca2+]cresponses, the threeprofileswegeneratedhave similarity to [Ca2+]creported in the literature. The single monophasic transient re-
sembles the responses to osmotic stress, oxidative stress, and
rapid cooling (Knight et al., 1996; Knight et al., 1997; Rentel and
Knight, 2004), and prolonged responses have been reported in
response to slow cooling (Plieth et al., 1999). Oscillations of
calcium have been reported in guard cells responding to ABA
and in legume root hairs responding to Nod factors (Wais et al.,
2000; Allen et al., 2001), although it is important to note that the
frequencies used here were not the same as those observed in
guard and root hair cells. The [Ca2+]c-regulated genes we iden-
tified seem to show a bias toward genes induced by abiotic
stresses (see Supplemental Data Set 2 online), including cold,
osmotic, and oxidative stress (see Supplemental Table 1 online),
which is consistent with the similarity of our [Ca2+]c elevations to
those produced by these types of stresses.
Identification of Four Promoter Motifs That Are
Overrepresented in Genes Upregulated in Response to
[Ca2+]c Elevations
By combining the transient and oscillating [Ca2+]c elevations into
one experiment for analysis of gene expression changes, we
were able to increase the potential for identification of cis-
elements responding to a broader range of [Ca2+]c elevations. By
analyzing the promoter sequences of this combined list of genes
induced by our electrical impulses, we found four distinct classes
Figure 6. Optimization of LaCl3 Concentration for Inhibition of Agonist-
Stimulated [Ca2+]c Elevations.
Two aequorin-expressing Arabidopsis seedlings were either treated with
the indicated concentration of LaCl3 or 20 mM KCl (A) or were incubated
in a solution containing the indicated concentration of LaCl3 or 20 mM
KCl for 30 min before addition of 10 mM mastoparan (B) before calibra-
tion to calculate [Ca2+]c. The average concentration of [Ca2+]c over 300 s
is shown (n = 3; bars represent 1 SE).
Calcium Regulation of Gene Expression 4087

of short DNA motif that appeared at a frequency statistically
higher than in the genome as a whole (Table 2, Figure 2). These
four motifs most closely resembled motifs already described in
the plant molecular biology literature, namely the CRT/DRE cold-
and drought-responsive element (Yamaguchi-Shinozaki and
Shinozaki, 1994; Stockinger et al., 1997; Liu et al., 1998), the
ABRE abscisic acid response element (Hobo et al., 1999), the
binding site of the CAMTA transcription factors (which we have
named CAM box) (Yang and Poovaiah, 2002), and finally the Site
II motif (Tremousaygue et al., 2003). The ABRE (CACGTGT) and
CAM box (ACGCGT) completely fit the consensus of the ABRE
(CACGTG[T/C/G]) and ABRE coupling element ([C/A]ACGCG[T/
C/A]) identified by our previous microarray experiment (Kaplan
et al., 2006). The Site II and CRT motifs were not identified in the
previous study (Kaplan et al., 2006), despite genes containing
these elements being well-represented on the microarray used
(89 of our 269 upregulated genes were present on the array and
were significantly enriched for both CRT and Site II). One pos-
sible explanation is that these elements were differentially in-
sensitive to [Ca2+]c signatures generated by the W7 treatment
used, whereas they are sensitive to DMSO- and mastoparan-
induced [Ca2+]c signatures. This seems to be true for the CRT,
which showed only a very modest activation in response to W7
(Figure 8); it is therefore possible that the inhibitory effect of the
W7 treatment upon CaM/CPK masks its activation. Indeed,
evidence suggests thatW7 reduces the expression of CRT/DRE-
containing genes, such asKIN1 andKIN2 (Tahtiharju et al., 1997).
The Site II element, however, showed substantial induction in
response to W7 treatment (Figure 8); therefore, it is more sur-
prising that this motif was not identified in the previous study. It is
likely that a combination of the use of full genome chips (repre-
senting more than fourfold the genes on the array used in the
Figure 7. ABRE-, CAM Box–, CRT-, and Site II–LUC+ Expression Is [Ca2+]c-Regulated.
Arabidopsis seedlings expressing LUC+ under the control of either a minimal promoter only (control) or four repeats of the cis-element sequences ABRE
(A), CAM box (B), CRT (C), or Site II (D) were pretreated with either 1 mM LaCl3 (La3+) or water for 30 min before the addition of either water or
mastoparan (to a final concentration of 10 mM). Tissue was harvested 3 h after treatment. RQ values for LUC+ expressionmeasured using real-time PCR
are shown. LUC+ expression was normalized to expression values for PEX4 (endogenous control). Each value is the mean of three technical replicates.
Error bars indicate RQMIN and RQMAX, which constitute the acceptable error for a 95% confidence limit according to Student’s t test.
4088 The Plant Cell

previous study) and the more sensitive labeling method, com-
bined with optimized microarray analysis, allowed us to identify
the Site II element in this study. Having identified four elements, it
is still possible that there are more [Ca2+]c-regulated promoter
motifs; identification of motifs statistically requires substantial
numbers of genes containing that motif to be present in the list,
and thus a small regulon of [Ca2+]c-regulated genes using
another promoter motif might not be detected. In addition,
because our analysis was performed at a single time point, it is
possible that transcriptomic analysis at earlier or later time points
would lead to the appearance of additional regulatory elements
—a possibility which can be addressed in future studies.
The CRT/DRE, CAM Box, ABRE, and Site II Motifs Are
Regulated by [Ca2+]c in Planta
Having identified the CRT/DRE, Site II, CAM box, and ABRE
motifs as being enriched in our list of genes induced by electrical
impulse, we tested transactivation of these motifs in response to
changes in [Ca2+]c in planta. It is important to note that although
activation of the ABRE was shown in our previous study (Kaplan
et al., 2006), it was only tested in response to calcium agonists;
without monitoring the effect of Ca2+ antagonists on this re-
sponse, it remains possible that the effect observedwas agonist-
specific rather than calcium-specific. The ABRE coupling element
(which resembles the CAM box) was not tested at all (Kaplan
et al., 2006). To our knowledge, [Ca2+]c-regulation of CRT/DRE
and Site II has not been previously reported. We used constructs
with four copies of the motifs (Figure 3), each sequence having
been empirically determined (Figure 2). We chose to use four
copies of the motifs, because this number has previously been
demonstrated to be the optimal compromise between motif
construct accuracy and sensitivity in this type of construct
(Rushton et al., 2002). We used two different calcium agonists,
mastoparan and DMSO, both of which had previously been
demonstrated to increase [Ca2+]c in plant cells (Takahashi et al.,
1998; Orvar et al., 2000). Both these agonists have different
modes of action leading to [Ca2+]c elevation and thus different
secondary effects, so induction of expression in response to
both provides strong evidence of calcium-regulation. We tested
mastoparan and DMSO in our experimental system and detected
significant elevations in [Ca2+]c (Figure 4). We demonstrated that
the expression of three candidate genes, chosen from our
upregulated gene list, could be induced by mastoparan and
DMSO, confirming that these agonists were appropriate for our
study (Figure 4). All fourmotifs showed increases in expression in
response to both mastoparan and DMSO (Figure 5). Interest-
ingly, the ABRE and CAM box showed greater expression in
response to mastoparan than DMSO, but Site II seemed to be
equally responsive to both (Figure 5). CRT/DRE showed greater
expression in response to DMSO, which is interesting because
DMSO has been postulated to stimulate influx of cellular calcium
by mimicking cold by rigidifying membranes and subsequently
activating cold-regulated genes (Orvar et al., 2000). The relative
differences in response tomastoparan andDMSO for each of the
four motifs might be due to the cognate transcription factors
responding to different specific characteristics of [Ca2+]c eleva-
tions, which are more closely mimicked by either mastoparan or
DMSO in particular cases (Figure 4).
The fact that all four motifs were induced in response to two
chemical agonists with very different modes of action (and
thus different secondary effects) was already strong evidence
of [Ca2+]c regulation of these motifs. However, to provide
conclusive evidence, mastoparan-induction of all four motifs
was tested in the presence of the calcium channel blocker
lanthanum, which inhibits the mastoparan-induced [Ca2+]celevation (Figure 6). Figure 7 shows that, in all four cases,
lanthanum inhibited the mastoparan-induced expression
of the four promoter motifs. We conclude, therefore, that
CRT/DRE, ABRE, CAM box, and Site II promoter motifs are
[Ca2+]c-regulated in planta. We have demonstrated that cal-
cium is both sufficient and necessary for expression via these
motifs in response to DMSO and mastoparan. Our data
suggest that these four promoter motifs are regulated by
calcium in response to [Ca2+]c-inducing stimuli in nature, but
they may well respond differentially to specific physiological
stimuli. Indeed, the CRT and CAM box were upregulated by
cold treatment, whereas the ABRE and Site II were not (see
Supplemental Figure 4 online), suggesting the possibility of
differential responses of the four motifs to the [Ca2+]c eleva-
tion elicited by this treatment. The CRT is already well-known
to respond to low temperature treatment (Stockinger et al.,
1997), and it is interesting that the CAM box is also upregu-
lated by cold, because CAMTAs have been shown to be
Figure 8. Response of CRT- and Site II–LUC+ Expression to W7
Treatment.
Arabidopsis seedlings expressing LUC+ under the control of either a
minimal promoter only (control) or four repeats of the cis-element
sequences CRT or Site II were pretreated with either 0.5 mM LaCl3(La3+) or water for 15 min before the addition of either 0.3% DMSO
control (mock) or W7 (to a final concentration of 600 mM). Tissue was
harvested 3 h after treatment. RQ values for LUC+ expression measured
using real-time PCR are shown. LUC+ expression was normalized to
expression values for PEX4 (endogenous control). Each value is the
mean of three technical replicates. Error bars indicate RQMIN and RQMAX,
which constitute the acceptable error for a 95% confidence limit
according to Student’s t test.
Calcium Regulation of Gene Expression 4089

important in the cold-induced upregulation of the CBF tran-
scription factor genes of Arabidopsis (Doherty et al., 2009). It
is not clear what other signals induce the CAM box, although a
role for the CAMTA transcription factors that bind this motif
has also been shown in response to pathogens and auxin
(Galon et al., 2008; Du et al., 2009; Galon et al., 2010b), which
also provoke elevations in [Ca2+]c (Felle, 1988; Knight et al.,
1996; Grant et al., 2000). The CRT element is also induced in
response to drought (Liu et al., 1998), and the ABRE is induced
in response to ABA and drought (Hobo et al., 1999), which
both induce [Ca2+]c (McAinsh et al., 1990; Knight et al., 1996;
Knight et al., 1997). It is not clear in which calcium-regulated
process the Site II motif participates; therefore, correlating
these conditions with [Ca2+]c elevations is not currently pos-
sible. Future experiments with a variety of physiological treat-
ments will help to further dissect how these promoter motifs
differentially respond to various stimuli and their respective
specific [Ca2+]c signals. The regulation of CRT/DRE, ABRE,
CAM box, and Site II is most likely through the CBF/DREB1/
DREB2 (Jaglo-Ottosen et al., 1998; Liu et al., 1998), ABF (Choi
et al., 2000), CAMTA (Finkler et al., 2007), and TCP transcrip-
tion factor (Martın-Trillo and Cubas, 2010) families, respec-
tively. We searched our upregulated gene list to test whether
any of the members of these transcription factor families were
themselves regulated transcriptionally by calcium. The gene
encoding one TCP family member (TCP13) was slightly upreg-
ulated (1.78-fold), but none of the ABF, CBF/DREB1/DREB2,
or CAMTA families were upregulated. These transcription
factors may therefore be regulated by [Ca2+]c on a posttrans-
lational level. In some cases, potential pathways for post-
translational regulation are already evident; for example, the
Ca2+-binding protein CaM regulates CAMTAs, and ABF4 has
been shown to interact with CPK32, one of the calcium-
dependant kinases (Choi et al., 2005). Future research effort
should therefore be directed toward revealing the precise
molecular pathways by which calcium regulates these tran-
scription factors and their interaction with these motifs in
target gene promoters.
METHODS
Vector Construction
The LUC+ coding region was obtained from pGL3 (Groskreutz et al.,
1995) and was cloned into pDH51 (Pietrzak et al., 1986) using SmaI and
XbaI restriction sites to produce the construct pDHLC+1, which con-
tained the LUC+ coding region between the 35Spromoter and terminator.
NcoI was then used to delete the region between the start of the 35S
promoter and the start codon of LUC+ (which was within the NcoI
restriction site). This gave a promoterless LUC+ construct, pDHLC+2,
into which NcoI-NcoI promoter fragments could be cloned. Promoter
fragments containing cis-element sequences were produced by PCR
amplification from pDHLC+1. Forward primers containing an NcoI site
and four repeats of the consensus cis-element sequence were designed
to anneal to a region 70 bp upstream of the 39 end of the 35S promoter.
The reverse primer annealed to the NcoI site at the start codon of LUC+.
The primer sequences can be found in Supplemental Table 3 online. The
PCR products were cloned as NcoI-NcoI fragments into pDHLC+2. The
whole chimeric cassettes were then cloned as EcoR1-EcoR1 fragments
into the EcoR1 site of pBIN19 (Bevan, 1984) for stable expression in
plants.
Plant Materials, Growth Conditions, and Transgenic
Plant Construction
Arabidopsis thaliana ecotype Columbia (Col-0) and Col-0 ecotype seeds
constitutively expressing apoaequorin under the 35S promoter were
obtained from Lehle Seeds. Sterilized Arabidopsis seeds were sown on
solid agar germination medium consisting of 0.8% (w/v) plant tissue
culture grade agar supplemented with 13 Murashige and Skoog (MS)
medium (Melford Laboratories) and an appropriate antibiotic if required.
Sterilized seeds on MS plates were stratified for at least 48 h in darkness
at 48C. Plates were subsequently transferred to a growth chamber at a
constant temperature of 218C, with a 16-h photoperiod at a light intensity
of 60mMm22 s21. Plants for seed productionwere transferred at 7 to 14 d
old to peat and were moved to a greenhouse at 218C with a 16-h
photoperiod. Aracon tubes (BetaTech) were used to isolate individual
mature plants. Plants were watered regularly until the siliques had fully
developed, then were transferred to a drying room until dried to a
sufficient level for seed collection. For plant transformation, binary
vectors based on pBIN19-containing chimeric concatamer constructs
were introduced into Agrobacterium tumefaciens C58C1 and trans-
formed into Col-0 using the floral dip method (Clough and Bent, 1998).
Primary T1 transformants were identified by kanamycin (50 mg/L) selec-
tion agar as described above, and subsequent analyses were performed
on the T2 generation. LUC expression in the T2 generation was tested by
imaging ;20 seedlings using a photon-counting camera. Expression
levels varied by approximately one order of magnitude, because of
positional effects. For each construct, lines were chosen that showed
median levels of expression and had single insertions (as determined by
segregation of LUC activity). Genomic DNA was extracted, and the
transgenic was sequenced to confirm identity of construct.
Production of [Ca2+]c Elevations by Application of
Electrical Stimulation
Seedlings were floated in standard media (0.1 mM each of KCl, CaCl2,
MgCl2) in a 1 cm 3 10 cm trough with platinum electrodes. The cuvette
was placed in a dark box and was allowed to rest for 2 to 4 h before
treatment (to avoid any touch-induced calcium elevations close to the
time of treatment). Voltage was applied via a PCL-728 Isolated 2-Channel
Digital Analog Output Card (Advantech) inside a personal computer,
controlled by the software Visidaq (Advantech). A programwaswritten for
the application of voltage in square wave format to allow manipulation of
the variables ON time, OFF time, and amplitude. Because the maximum
range of the PCL-728 was 6 10 V, the voltage was enhanced by
connection through a fivefold voltage amplifier (generated by electronics
workshop, Department of Plant Sciences, University of Oxford) when
required. Specific regimens for each treatment were as follows: Transient
calcium elevation; 40 V for 1.5 s. Oscillations; voltage was applied for 1 s
every 40 s at increasing intensities, specifically 10 V, 12 V, 14 V, 15 V, 16.5
V, 17.5 V, 19.5 V, 21 V, 22.5 V, 24 V. Prolonged calcium elevation; initially,
2.5 Vwas applied for 100ms every 1 s, then voltagewas rapidly increased
to account for attenuation. When the maximum voltage of 10 V was
reached, the “ON” time of 100 ms was increased by 10-ms increments to
further compensate for attenuation. Controls were not stimulated by
voltage but were harvested alongside the treated samples.
Chemical and Cold Treatments
For all chemical treatments, plants were floated on water overnight,
before chemical treatments the next morning. When LaCl3 was used to
inhibit [Ca2+]c elevations by DMSO and mastoparan, it was added to
4090 The Plant Cell

seedlings for a pretreatment period of 30min. Formeasurement of [Ca2+]cduring chemical treatment for luminometry, double concentration of the
chemical was added to the seedlings during measurement, giving a final
concentration of 10 mM mastoparan and 2% w/v DMSO. For transcript
analysis, seedlings were treated as above, and tissue was harvested by
briefly drying on tissue paper and flash freezing in liquid nitrogen 3 h after
treatment. For all experiments involving concatemer LUC+ fusions,
experiments were performed in the T2 generation of at least two inde-
pendent validated transgenic lines. For testing expression of LUC+ in
response toW7, we followed the conditions described previously (Kaplan
et al., 2006), namely 15min preincubation with 0.5 mM LaCl3, followed by
1 h treatment in 600 mM W7 or equivalent 0.3% DMSO control. For cold
treatments, seedlings were transferred to a growth chamber at 58C and
were maintained there for 24 h, and (ambient) control samples were
retained at 208C under matched light conditions. Plants were harvested
promptly after 24 h.
In Vivo Reconstitution of Aequorin and [Ca2+]c-Dependent
Luminescence Measurements
To reconstitute aequorin before calcium imaging, seedlings expressing
cytosolic apoaequorin were reconstituted by floating on water containing
10 mM coelenterazine (stock 1% [v/v] methanol; LUX Biotechnology) in
the dark at 218C for 12 to 24 h. For [Ca2+]c measurements during chemical
treatments, seedlings were transferred to a cuvette that was placed
inside a digital chemiluminometer consisting of a 9829A photomultiplier
tube powered by a PM28B high-voltage supply and cooled to2258Cwith
FACT50 air-cooled thermoelectric housing and an AD2 amplifier/discrim-
inator (all from Thorn EMI). Output from the AD2 was channeled via a CTl
computer counter board (Thorn EMI) to produce numerical output to a
personal computer. Measurements of aequorin luminescencewere taken
every 1 s. To convert luminescence into [Ca2+]c, 2 M CaCl2 and 30%
ethanol were added to discharge the remaining aequorin. For [Ca2+]cimaging during electrical stimulation, aequorin luminescencewas recorded
under a three microchannel plate-intensified charge-coupled device
camera (Photek 216; Photek). The quantity of photons per unit area
over time was measured by the camera, and the resulting cumulative
image was established and stored by the acquisition and processing
software (Image 32; Photek). Total aequorin for calibration wasmeasured
by removing the seedling(s) to a piece of wet filter paper (Grade 1;
Whatman) and treating them with cold on the Peltier element as follows:
the temperature was decreased to 08C until aequorin luminescence
returned to basal level, then was reduced to2208C. When luminescence
again decreased to a minimum, the temperature was increased up to
room temperature. The aequorin luminescence measured during treat-
ments was calibrated into [Ca2+]c as described previously (Knight and
Knight, 2000). For transcript analysis, tissue was harvested by briefly
drying on tissue paper and flash freezing in liquid nitrogen 1 h after
treatment.
Quantitative Real-Time PCR
A High-Capacity cDNA Reverse Transcription Kit (Applied Biosystems)
was used to reverse transcribe cDNA from 1.5 mg total RNA extracted
using Qiagen RNeasy plant mini kit (Qiagen) in conjunction with RNase-
free DNase (Qiagen) to remove any genomic DNA contamination. Quan-
titative real-timePCRwasperformedon6mLof 1:50dilutedcDNA ina15-mL
reaction using an Applied Biosystems 7300 system. Relative levels of
LUC+ transcript were measured using a custom-made gene-specific
TaqMan Probe prepared by Applied Biosystems to the following spec-
ifications: forward primer, TGGGCTCACTGAGACTACATCA; reverse
primer, CGCGCCCGGTTTATCATC; 6-carboxy-fluorescein–labeled
probe, CCCCTCGGGTGTAATC; and expression levels were normalized
to the expression of an endogenous control gene, PEX4 (At4g25760;
Applied Biosystems probe identifier At02304594_g1). Reactions were
performed in an optical 96-well plate (Starlab) with three technical
replicates for each sample. Gene-specific primer pairs were used with
Fast Start SYBRGreenMaster with ROX (Roche Diagnostics) to measure
relative expression of At1g02400 (forward, CCCATCTGACCCTA-
CATGCT; reverse, TGGCTTCTTTGCTGTGTTTG), At1g01470 (forward,
ATCAAGAGCCGTCATGTCCT; reverse, TCATTCGATTCCGATCTGTG)
and At1g51090 (forward, CTATCCGCAAATTCCCTCAA; reverse,
GCCTCTCAGGATCGTAACAAA), and expression levels were normalized
to expression of PEX4 (forward, TCATAGCATTGATGGCTCATCCT; re-
verse, ACCCTCTCACATCACCAGATCTTAG). In all cases, relative quan-
titation was performed by the DDCT (comparative cycle threshold)
method (Livak and Schmittgen, 2001), and relative quantitation (RQ)
values and estimates of statistical variation for each sample were calcu-
lated as described previously (Knight et al., 2009). The algorithm used is
described in Relative Quantitation (RQ) Algorithms in Applied Biosystems
Real-Time PCR Systems Software (Applied Biosystems Real-Time PCR
Systems, 2007).
Preparation of Microarray Slides
Microarray slides were obtained from Dr. David Galbraith (University of
Arizona, Tucson, AZ) and were printed with the Operon Arabidopsis
Version 3 Array-Ready Oligo Set. The slides were baked for 40 min at
808C and were immediately UV cross-linked twice in a Stratalinker 2400
(Stratagene) at 300 mJ. Prior to use, slides were prehybridized for 20 min
at 658C in a coplin jar containing 3.53 SSC, 0.1% SDS, and 10 mg/mL
BSA. After prehybridization, slides were washed with shaking for 1 min in
water and then for 1 min in isopropyl alcohol before drying with an
airbrush (Paasche Airbrush Company).
Microarray Analysis
RNA was extracted using the RNeasy Plant Total RNA kit (Qiagen), and
the quality of RNA samples was assessed using an Agilent 2100
Bioanalyser (Agilent Technologies). Between 1 and 2 mg total RNA was
labeled using reverse transcriptase Superscript III (Invitrogen) and the
Genisphere 3DNA 900 indirect labeling kit (Genisphere). cDNA was
transferred evenly across the microarray using a “LifterSlip” (Erie Scien-
tific Company), and hybridization was performed using an Advalytix
SlideBooster SB400 (Advalytix AG) with a power of 27 and a pulse:pause
ratio of 3:7 at 558C for 16 h. After washing, the slides were hybridized in a
similar way for a second time with the 3DNA dendrimer capture reagents
supplied with the kit for 4 h, according to the manufacturer’s instructions.
After each hybridization, the microarrays were washed at 558C in a
solution of 23 SSC/0.2% SDS followed by room-temperature washes of
23 SSC and 0.23 SSC all for 10 min with shaking at 150 rpm. After the
final wash, the slide was dried using an airbrush (Paasche Airbrush
Company). Hybridized slides were scanned using a Perkin Elmer Scan-
Array Express HT (Perkin Elmer Wellesley) using 100% laser power and a
variable photomultiplier tube setting determined by automatic sensitivity
calibration with a signal target ratio of 98%.
Data Extraction
The resulting image files were transferred into the analysis program
BlueFuse Version 3.0 or 3.2 (BlueGnome). Spots with insufficient signal
above background and artifacts were removed from the data set both by
manual flagging and by automatic exclusion of spots below a certain
threshold (chosen manually) of an empirically determined BlueFuse
“pON” score. The pON score is a measure of the probability of there
being a hybridization signal for each spot independently of the other
Calcium Regulation of Gene Expression 4091
channel. This score takes into consideration both the intensity of signal
above background and the circularity and uniformity expected of a
genuine microarray spot (Snyder and Saunders, 2006).
Data Normalization and Analysis Using BASE
Data output from Bluefuse were modified into a fused file format, which
could be recognized by the BASE tool (Saal et al., 2002). The cross-
channel correction tool (developed by the CBRG) was used to correct the
intensities of spots with a one-channel bias by subtracting 2% intensity of
channel one from channel two or vice versa (with a floor intensity of 200).
Data were globally normalized to the median fold ratio of the central 60%
of data, which had an intensity of >200 in both channels. The overall
median fold ratio for the combined normalized data from biological
replicates was determined using the fold change algorithm within BASE
Statistical tests were performed using a local implementation of Cyber-T
within BASE (using a sliding window size of 101 and a Bayes confidence
estimate value of three times the number of slides in the experiment to a
maximum of 10). The BASE plug-ins for cross channel correction,
normalization, and Cyber-T test are available on request from the
CBRG (http://www.molbiol.ox.ac.uk/CBRG_home.shtml).
Promoter Motif Analysis
Analysis of overrepresented hexamer sequences in 500 bp of upstream
sequences (downloaded from The Arabidopsis Information Resource
website; http://www.Arabidopsis.org/tools/bulk/index.jsp) was performed
using the oligo analysis, pattern assembly, and DNA pattern matching
tools available online at the RSAT site (http://rsat.ulb.ac.be/rsat) accord-
ing to the developers’ instructions (van Helden, 2003). Positional analysis
of hexamer sequenceswas achieved in a similar way by downloading 500
bp of upstream sequences from The Arabidopsis Information Resource
and transferring these to the pattern matching tool in RSAT.
Ontological Analysis
Gene lists were functionally classified using the Bio-Array Resource for
Plant Biology Classification Superviewer (http://bar.utoronto.ca/ntools/
cgi-bin/ntools_classification_superviewer.cgi), which uses Gene Ontol-
ogy data to calculate the fold enrichment to particular gene classifications
of the input gene list compared with the expected frequency in Arabi-
dopsis and assigns a P-value according to the strength of the enrichment.
For details of normalized frequency and P-value calculation, please see
the header on individual output Tables (see Supplemental Data Sets 2 and
3 online)
Comparison of Gene Lists with Existing Microarray Data
The list of 269 [Ca2+]c-regulated genes and four sublists representing
genes containing either CRT/DRE (39 genes), ABRE (63 genes), CaM Box
(20 genes), or Site II (97 genes) were compared with the AtGenExpress
abiotic and biotic stress treatments (Kilian et al., 2007) using the Bio-Array
Resource Expression browser (Toufighi et al., 2005) (http://bar.utoronto.
ca/affydb/cgi-bin/affy_db_exprss_browser_in.cgi). Using this tool, we
extracted the expression of genes from our lists that had corresponding
data in the AtGenExpress series in response to specific abiotic and biotic
stresses. Average fold values of expression for each treatment were
calculated for each list.
Accession Numbers
The microarray experiments described herein are publicly available from
www.ebi.ac.uk/arrayexpress with accession numbers E-MEXP-2659
(oscillations and prolonged calcium elevations) and E-MEXP-2661 (tran-
sient calcium elevation).
Supplemental Data
The following materials are available in the online version of this article.
Supplemental Figure 1. RSAT Alignments of Hexamer Sequences
Relating to the ABRE and CAM Box cis-Element Sequences.
Supplemental Figure 2. Positional Analysis of Promoter Motifs
Upstream of Genes Responding to [Ca2+]c Elevations.
Supplemental Figure 3. Association Analysis of Motifs Enriched in
Upstream Regions of Genes Responding to [Ca2+]c Elevations.
Supplemental Figure 4. Effect of Cold Treatment on ABRE-, CAM
box–, CRT-, and Site II–LUC+ Expression.
Supplemental Table 1. Comparison of Genes Upregulated by [Ca2+]cElevations with Publicly Available AtGenExpress Data—Abiotic
Stress.
Supplemental Table 2. Comparison of Genes Upregulated by [Ca2+]cElevations with Publicly Available AtGenExpress Data—Biotic Stress.
Supplemental Table 3. Primers for Production of Promoter Frag-
ments Used in Our Study.
Supplemental Data Set 1. Genes Significantly Changed in Micro-
array Experiments.
Supplemental Data Set 2. Ontological Analysis of Up- and Down-
regulated Combined Gene Lists.
Supplemental Data Set 3. Ontological Analysis of Gene Lists
Containing Each of Four [Ca2+]c-Regulated Promoter Motifs.
Supplemental Data Set 4. Comparison of Gene Lists Containing
Each of Four [Ca2+]c-Regulated Promoter Motifs with Publicly Avail-
able AtGenExpress Data for Abiotic and Biotic Stress Experiments.
ACKNOWLEDGMENTS
We acknowledge technical assistance from Paul Loftus and Pauline
White; advice on microarray analysis from Richard Capper; BASE
access kindly provided by the CBRG; production of equipment for
electrical stimulation by Doug Morris (Department of Plant Sciences)
and the workshop of the Physiology Department at the University of
Oxford; advice on electrical stimulation by Christoph Plieth (University of
Kiel, Germany), and the Biotechnology and Biological Sciences Re-
search Council for funding PhD studentship for H.J.W.
AUTHOR CONTRIBUTIONS
H.J.W. designed and performed microarray experiments and performed
all microarray analyses, produced basic concatemer constructs, and
wrote substantial parts of the article. A.W.S. produced transgenic plants
expressing concatemer constructs and performed some of the real-time
experiments. J.F.C.S. performed most of the real-time experiments. T.L.
produced the binary constructs to express the concatemers in transgenic
plants. R.L. performed some of the real-time experiments. N.J.S. devel-
oped the system for the dendrimer-based microarray experiments and
optimised microarray analysis. H.K. performed some of the real-time
experiments and wrote parts of the article. M.R.K. designed experiments
and wrote substantial parts of the article.
Received August 25, 2011; revised October 14, 2011; accepted October
25, 2011; published November 15, 2011.
4092 The Plant Cell
REFERENCES
Albrecht, V., Weinl, S., Blazevic, D., D’Angelo, C., Batistic, O.,
Kolukisaoglu, U., Bock, R., Schulz, B., Harter, K., and Kudla, J.
(2003). The calcium sensor CBL1 integrates plant responses to abiotic
stresses. Plant J. 36: 457–470.
Allen, G.J., Chu, S.P., Harrington, C.L., Schumacher, K., Hoffmann,
T., Tang, Y.Y., Grill, E., and Schroeder, J.I. (2001). A defined range
of guard cell calcium oscillation parameters encodes stomatal move-
ments. Nature 411: 1053–1057.
Applied Biosystems Real-Time PCR Systems (2007). Relative Quan-
titation (RQ) Algorithms in Applied Biosystems Real-Time PCR Sys-
tems Software User Bulletin. (Foster City, CA: Applied Biosystems).
Baldi, P., and Long, A.D. (2001). A Bayesian framework for the analysis
of microarray expression data: Regularized t-test and statistical
inferences of gene changes. Bioinformatics 17: 509–519.
Bevan, M. (1984). Binary Agrobacterium vectors for plant transforma-
tion. Nucleic Acids Res. 12: 8711–8721.
Bibikova, T.N., Zhigilei, A., and Gilroy, S. (1997). Root hair growth in
Arabidopsis thaliana is directed by calcium and an endogenous
polarity. Planta 203: 495–505.
Bouche, N., Scharlat, A., Snedden, W., Bouchez, D., and Fromm, H.
(2002). A novel family of calmodulin-binding transcription activators in
multicellular organisms. J. Biol. Chem. 277: 21851–21861.
Boudsocq, M., Willmann, M.R., McCormack, M., Lee, H., Shan, L.B.,
He, P., Bush, J., Cheng, S.H., and Sheen, J. (2010). Differential
innate immune signalling via Ca(2+) sensor protein kinases. Nature
464: 418–422.
Chiasson, D., Ekengren, S.K., Martin, G.B., Dobney, S.L., and
Snedden, W.A. (2005). Calmodulin-like proteins from Arabidopsis
and tomato are involved in host defense against Pseudomonas
syringae pv. tomato. Plant Mol. Biol. 58: 887–897.
Choi, H., Hong, J., Ha, J., Kang, J., and Kim, S.Y. (2000). ABFs, a
family of ABA-responsive element binding factors. J. Biol. Chem. 275:
1723–1730.
Choi, H.I., Park, H.J., Park, J.H., Kim, S., Im, M.Y., Seo, H.H., Kim, Y.
W., Hwang, I., and Kim, S.Y. (2005). Arabidopsis calcium-dependent
protein kinase AtCPK32 interacts with ABF4, a transcriptional regu-
lator of abscisic acid-responsive gene expression, and modulates its
activity. Plant Physiol. 139: 1750–1761.
Clayton, H., Knight, M.R., Knight, H., McAinsh, M.R., and
Hetherington, A.M. (1999). Dissection of the ozone-induced calcium
signature. Plant J. 17: 575–579.
Clough, S.J., and Bent, A.F. (1998). Floral dip: A simplified method for
Agrobacterium-mediated transformation of Arabidopsis thaliana. Plant
J. 16: 735–743.
Coca, M., and Segundo, B. (2010). AtCPK1 calcium-dependent protein
kinase mediates pathogen resistance in Arabidopsis. Plant J. 63:
526–540.
DeFalco, T.A., Bender, K.W., and Snedden, W.A. (2010). Breaking the
code: Ca2+ sensors in plant signalling. Biochem. J. 425: 27–40.
De Koninck, P., and Schulman, H. (1998). Sensitivity of CaM kinase II
to the frequency of Ca2+ oscillations. Science 279: 227–230.
Dodd, A.N., Kudla, J., and Sanders, D. (2010). The language of
calcium signaling. Annu. Rev. Plant Biol. 61: 593–620.
Doherty, C.J., Van Buskirk, H.A., Myers, S.J., and Thomashow, M.F.
(2009). Roles for Arabidopsis CAMTA transcription factors in cold-
regulated gene expression and freezing tolerance. Plant Cell 21:
972–984.
Dolmetsch, R.E., Xu, K., and Lewis, R.S. (1998). Calcium oscillations
increase the efficiency and specificity of gene expression. Nature 392:
933–936.
Dolmetsch, R.E., Lewis, R.S., Goodnow, C.C., and Healy, J.I. (1997).
Differential activation of transcription factors induced by Ca2+ re-
sponse amplitude and duration. Nature 386: 855–858.
Du, L.Q., Ali, G.S., Simons, K.A., Hou, J.G., Yang, T.B., Reddy, A.S.
N., and Poovaiah, B.W. (2009). Ca(2+)/calmodulin regulates salicylic-
acid-mediated plant immunity. Nature 457: 1154–1158.
Felle, H. (1988). Auxin causes oscillations of cytosolic free calcium and
pH in Zea mays coleoptiles. Planta 174: 495–499.
Finkler, A., Ashery-Padan, R., and Fromm, H. (2007). CAMTAs:
Calmodulin-binding transcription activators from plants to human.
FEBS Lett. 581: 3893–3898.
Galon, Y., Finkler, A., and Fromm, H. (2010a). Calcium-regulated
transcription in plants. Mol. Plant 3: 653–669.
Galon, Y., Nave, R., Boyce, J.M., Nachmias, D., Knight, M.R., and
Fromm, H. (2008). Calmodulin-binding transcription activator (CAM-
TA) 3 mediates biotic defense responses in Arabidopsis. FEBS Lett.
582: 943–948.
Galon, Y., Aloni, R., Nachmias, D., Snir, O., Feldmesser, E., Scrase-
Field, S., Boyce, J.M., Bouche, N., Knight, M.R., and Fromm, H.
(2010b). Calmodulin-binding transcription activator 1 mediates auxin
signaling and responds to stresses in Arabidopsis. Planta 232:
165–178.
Giuliano, G., Pichersky, E., Malik, V.S., Timko, M.P., Scolnik, P.A.,
and Cashmore, A.R. (1988). An evolutionarily conserved protein
binding sequence upstream of a plant light-regulated gene. Proc.
Natl. Acad. Sci. USA 85: 7089–7093.
Grant, M., Brown, I., Adams, S., Knight, M., Ainslie, A., and Mansfield,
J. (2000). The RPM1 plant disease resistance gene facilitates a rapid
and sustained increase in cytosolic calcium that is necessary for the
oxidative burst and hypersensitive cell death. Plant J. 23:
441–450.
Groskreutz, D.J., Sherf, B.A., Wood, K.V., and Schenborn, E.T.
(1995). Increased expression and convenience with the new pGL3
luciferase reporter vectors. Promega Notes 50: 2–8.
Herde, O., Fuss, H., Pena-Cortes, H., and Fisahn, J. (1995). Protein-
ase inhibitor II gene expression induced by electrical stimulation and
control of photosynthetic activity in tomato plants. Proc. Natl. Acad.
Sci. USA 36: 737–742.
Herve, C., Dabos, P., Bardet, C., Jauneau, A., Auriac, M.C.,
Ramboer, A., Lacout, F., and Tremousaygue, D. (2009). In vivo
interference with AtTCP20 function induces severe plant growth
alterations and deregulates the expression of many genes important
for development. Plant Physiol. 149: 1462–1477.
Hobo, T., Asada, M., Kowyama, Y., and Hattori, T. (1999). ACGT-
containing abscisic acid response element (ABRE) and coupling
element 3 (CE3) are functionally equivalent. Plant J. 19: 679–689.
Jaglo-Ottosen, K.R., Gilmour, S.J., Zarka, D.G., Schabenberger, O.,
and Thomashow, M.F. (1998). Arabidopsis CBF1 overexpression
induces COR genes and enhances freezing tolerance. Science 280:
104–106.
Kaplan, B., Davydov, O., Knight, H., Galon, Y., Knight, M.R., Fluhr, R.,
and Fromm, H. (2006). Rapid transcriptome changes induced by
cytosolic Ca2+ transients reveal ABRE-related sequences as Ca2+-
responsive cis elements in Arabidopsis. Plant Cell 18: 2733–2748.
Kilian, J., Whitehead, D., Horak, J., Wanke, D., Weinl, S., Batistic, O.,
D’Angelo, C., Bornberg-Bauer, E., Kudla, J., and Harter, K. (2007).
The AtGenExpress global stress expression data set: Protocols,
evaluation and model data analysis of UV-B light, drought and cold
stress responses. Plant J. 50: 347–363.
Kim, T.H., Bohmer, M., Hu, H.H., Nishimura, N., and Schroeder, J.I.
(2010). Guard cell signal transduction network: Advances in under-
standing abscisic acid, CO2, and Ca2+ signaling. Annu. Rev. Plant
Biol. 61: 561–591.
Knight, H., and Knight, M.R. (1995). Recombinant aequorin methods
Calcium Regulation of Gene Expression 4093

for intracellular calcium measurement in plants. Methods Cell Biol. 49:
201–216.
Knight, H., and Knight, M.R. (2000). Imaging spatial and cellular
characteristics of low temperature calcium signature after cold accli-
mation in Arabidopsis. J. Exp. Bot. 51: 1679–1686.
Knight, M.R., Smith, S.M., and Trewavas, A.J. (1992). Wind-induced
plant motion immediately increases cytosolic calcium. Proc. Natl.
Acad. Sci. USA 89: 4967–4971.
Knight, H., Trewavas, A.J., and Knight, M.R. (1996). Cold calcium
signaling in Arabidopsis involves two cellular pools and a change in
calcium signature after acclimation. Plant Cell 8: 489–503.
Knight, H., Trewavas, A.J., and Knight, M.R. (1997). Calcium signal-
ling in Arabidopsis thaliana responding to drought and salinity. Plant
J. 12: 1067–1078.
Knight, M.R., Campbell, A.K., Smith, S.M., and Trewavas, A.J. (1991).
Transgenic plant aequorin reports the effects of touch and cold-shock
and elicitors on cytoplasmic calcium. Nature 352: 524–526.
Knight, H., Mugford Nee Garton, S.G., Ulker, B., Gao, D., Thorlby, G.,
and Knight, M.R. (2009). Identification of SFR6, a key component in
cold acclimation acting post-translationally on CBF function. Plant
J. 58: 97–108.
Kosugi, S., and Ohashi, Y. (1997). PCF1 and PCF2 specifically bind to
cis elements in the rice proliferating cell nuclear antigen gene. Plant
Cell 9: 1607–1619.
Kosugi, S., Suzuka, I., and Ohashi, Y. (1995). Two of three promoter
elements identified in a rice gene for proliferating cell nuclear antigen
are essential for meristematic tissue-specific expression. Plant J. 7:
877–886.
Kudla, J., Batistic, O., and Hashimoto, K. (2010). Calcium signals: The
lead currency of plant information processing. Plant Cell 22: 541–563.
Li, C.X., Potuschak, T., Colon-Carmona, A., Gutierrez, R.A., and
Doerner, P. (2005). Arabidopsis TCP20 links regulation of growth and
cell division control pathways. Proc. Natl. Acad. Sci. USA 102: 12978–
12983.
Liu, Q., Kasuga, M., Sakuma, Y., Abe, H., Miura, S., Yamaguchi-
Shinozaki, K., and Shinozaki, K. (1998). Two transcription factors,
DREB1 and DREB2, with an EREBP/AP2 DNA binding domain sep-
arate two cellular signal transduction pathways in drought- and low-
temperature-responsive gene expression, respectively, in Arabidopsis.
Plant Cell 10: 1391–1406.
Livak, K.J., and Schmittgen, T.D. (2001). Analysis of relative gene
expression data using real-time quantitative PCR and the 2-DDCT
Method. Methods 25: 402–408.
Long, A.D., Mangalam, H.J., Chan, B.Y.P., Tolleri, L., Hatfield, G.W.,
and Baldi, P. (2001). Improved statistical inference from DNA micro-
array data using analysis of variance and a Bayesian statistical
framework. Analysis of global gene expression in Escherichia coli
K12. J. Biol. Chem. 276: 19937–19944.
Magnan, F., Ranty, B., Charpenteau, M., Sotta, B., Galaud, J.P., and
Aldon, D. (2008). Mutations in AtCML9, a calmodulin-like protein from
Arabidopsis thaliana, alter plant responses to abiotic stress and
abscisic acid. Plant J. 56: 575–589.
Marcotte, W.R.J., Jr., Russell, S.H., and Quatrano, R.S. (1989).
Abscisic acid-responsive sequences from the Em gene of wheat.
Plant Cell 1: 969–976.
Martın-Trillo, M., and Cubas, P. (2010). TCP genes: A family snapshot
ten years later. Trends Plant Sci. 15: 31–39.
McAinsh, M.R., and Pittman, J.K. (2009). Shaping the calcium signa-
ture. New Phytol. 181: 275–294.
McAinsh, M.R., Brownlee, C., and Hetherington, A.M. (1990). Absci-
sic acid-induced elevation of guard cell Ca2+ precedes stomatal
closure. Nature 343: 186–188.
McAinsh, M.R., Brownlee, C., and Hetherington, A.M. (1997). Cal-
cium ions as second messengers in guard cell signal transduction.
Physiol. Plant. 100: 16–29.
Menkens, A.E., Schindler, U., and Cashmore, A.R. (1995). The G-box:
A ubiquitous regulatory DNA element in plants bound by the GBF
family of bZIP proteins. Trends Biochem. Sci. 20: 506–510.
Myers, C., Romanowsky, S.M., Barron, Y.D., Garg, S., Azuse, C.L.,
Curran, A., Davis, R.M., Hatton, J., Harmon, A.C., and Harper, J.F.
(2009). Calcium-dependent protein kinases regulate polarized tip
growth in pollen tubes. Plant J. 59: 528–539.
Okamoto, H., Gobel, C., Capper, R.G., Saunders, N., Feussner, I.,
and Knight, M.R. (2009). The alpha-subunit of the heterotrimeric
G-protein affects jasmonate responses in Arabidopsis thaliana. J. Exp.
Bot. 60: 1991–2003.
Orvar, B.L., Sangwan, V., Omann, F., and Dhindsa, R.S. (2000). Early
steps in cold sensing by plant cells: The role of actin cytoskeleton and
membrane fluidity. Plant J. 23: 785–794.
Perianin, A., and Snyderman, R. (1989). Mastoparan, a wasp venom
peptide, identifies two discrete mechanisms for elevating cytosolic
calcium and inositol trisphosphates in human polymorphonuclear
leukocytes. J. Immunol. 143: 1669–1673.
Pietrzak, M., Shillito, R.D., Hohn, T., and Potrykus, I. (1986). Expres-
sion in plants of two bacterial antibiotic resistance genes after
protoplast transformation with a new plant expression vector. Nucleic
Acids Res. 14: 5857–5868.
Plieth, C., Hansen, U.-P., Knight, H., and Knight, M.R. (1999). Tem-
perature sensing by plants: The primary characteristics of signal
perception and calcium response. Plant J. 18: 491–497.
Pruneda-Paz, J.L., Breton, G., Para, A., and Kay, S.A. (2009). A
functional genomics approach reveals CHE as a component of the
Arabidopsis circadian clock. Science 323: 1481–1485.
Rentel, M.C., and Knight, M.R. (2004). Oxidative stress-induced
calcium signaling in Arabidopsis. Plant Physiol. 135: 1471–1479.
Rushton, P.J., Reinstadler, A., Lipka, V., Lippok, B., and Somssich,
I.E. (2002). Synthetic plant promoters containing defined regulatory
elements provide novel insights into pathogen- and wound-induced
signaling. Plant Cell 14: 749–762.
Saal, L.H., Troein, C., Vallon-Christersson, J., Gruvberger, S., Borg,
A., and Peterson, C. (2002). BioArray Software Environment (BASE):
A platform for comprehensive management and analysis of micro-
array data. Genome Biol. 3: software0003.0001–0003.0006.
Sangwan, V., Orvar, B.L., Beyerly, J., Hirt, H., and Dhindsa, R.S.
(2002). Opposite changes in membrane fluidity mimic cold and heat
stress activation of distinct plant MAP kinase pathways. Plant J. 31:
629–638.
Snyder, L.A., and Saunders, N.J. (2006). The majority of genes in the
pathogenic Neisseria species are present in non-pathogenic Neisseria
lactamica, including those designated as ‘virulence genes’. BMC
Genomics 7: 128.
Stears, R.L., Getts, R.C., and Gullans, S.R. (2000). A novel, sensitive
detection system for high-density microarrays using dendrimer tech-
nology. Physiol. Genomics 3: 93–99.
Stockinger, E.J., Gilmour, S.J., and Thomashow, M.F. (1997). Arabi-
dopsis thalianaCBF1 encodes an AP2 domain-containing transcriptional
activator that binds to the C-repeat/DRE, a cis-acting DNA regulatory
element that stimulates transcription in response to low temperature and
water deficit. Proc. Natl. Acad. Sci. USA 94: 1035–1040.
Sun, J., Miwa, H., Downie, J.A., and Oldroyd, G.E.D. (2007). Masto-
paran activates calcium spiking analogous to Nod factor-induced
responses in Medicago truncatula root hair cells. Plant Physiol. 144:
695–702.
Tahtiharju, S., Sangwan, V., Monroy, A.F., Dhindsa, R.S., and Borg,
M. (1997). The induction of kin genes in cold-acclimating Arabidopsis
thaliana. Evidence of a role for calcium. Planta 203: 442–447.
4094 The Plant Cell

Takahashi, K., Isobe, M., and Muto, S. (1998). Mastoparan induces an
increase in cytosolic calcium ion concentration and subsequent
activation of protein kinases in tobacco suspension culture cells.
Biochim. Biophys. Acta 1401: 339–346.
Takahashi, F., Mizoguchi, T., Yoshida, R., Ichimura, K., and
Shinozaki, K. (2011). Calmodulin-dependent activation of MAP ki-
nase for ROS homeostasis in Arabidopsis. Mol. Cell 41: 649–660.
Toufighi, K., Brady, S.M., Austin, R., Ly, E., and Provart, N.J. (2005).
The Botany Array Resource: E-northerns, expression angling, and
promoter analyses. Plant J. 43: 153–163.
Tremousaygue, D., Garnier, L., Bardet, C., Dabos, P., Herve, C., and
Lescure, B. (2003). Internal telomeric repeats and ‘TCP domain’
protein-binding sites co-operate to regulate gene expression in
Arabidopsis thaliana cycling cells. Plant J. 33: 957–966.
van Helden, J. (2003). Regulatory sequence analysis tools. Nucleic
Acids Res. 31: 3593–3596.
van Helden, J., Andre, B., and Collado-Vides, J. (1998). Extracting
regulatory sites from the upstream region of yeast genes by compu-
tational analysis of oligonucleotide frequencies. J. Mol. Biol. 281:
827–842.
Very, A.A., and Davies, J.M. (2000). Hyperpolarization-activated cal-
cium channels at the tip of Arabidopsis root hairs. Proc. Natl. Acad.
Sci. USA 97: 9801–9806.
Wais, R.J., Galera, C., Oldroyd, G., Catoira, R., Penmetsa, R.V.,
Cook, D., Gough, C., Denarie, J., and Long, S.R. (2000). Genetic
analysis of calcium spiking responses in nodulation mutants of
Medicago truncatula. Proc. Natl. Acad. Sci. USA 97: 13407–13412.
Weinl, S., and Kudla, J. (2009). The CBL-CIPK Ca(2+)-decoding signal-
ing network: Function and perspectives. New Phytol. 184: 517–528.
Welchen, E., and Gonzalez, D.H. (2005). Differential expression of the
Arabidopsis cytochrome c genes Cytc-1 and Cytc-2. Evidence for the
involvement of TCP-domain protein-binding elements in anther- and
meristem-specific expression of the Cytc-1 gene. Plant Physiol. 139:
88–100.
Welchen, E., and Gonzalez, D.H. (2006). Overrepresentation of ele-
ments recognized by TCP-domain transcription factors in the up-
stream regions of nuclear genes encoding components of the
mitochondrial oxidative phosphorylation machinery. Plant Physiol.
141: 540–545.
Wildon, D.C., Thain, J.F., Minchin, P.E.H., Gubb, I.R., Reilly, A.J.,
Skipper, Y.D., Doherty, H.M., O’Donnell, P.J., and Bowles, D.J.
(1992). Electrical signalling and systemic proteinase inhibitor induction
in the wounded plant. Nature 360: 62–65.
Williamson, R.E., and Ashley, C.C. (1982). Free Ca2+ and cytoplasmic
streaming in the alga Chara. Nature 296: 647–650.
Xu, G.Y., Rocha, P.S., Wang, M.L., Xu, M.L., Cui, Y.C., Li, L.Y., Zhu,
Y.X., and Xia, X.J. (2011). A novel rice calmodulin-like gene,
OsMSR2, enhances drought and salt tolerance and increases ABA
sensitivity in Arabidopsis. Planta 234: 47–59.
Yamaguchi-Shinozaki, K., and Shinozaki, K. (1994). A novel cis-acting
element in an Arabidopsis gene is involved in responsiveness to
drought, low-temperature, or high-salt stress. Plant Cell 6: 251–264.
Yan, A., Xu, G.S., and Yang, Z.B. (2009). Calcium participates in
feedback regulation of the oscillating ROP1 Rho GTPase in pollen
tubes. Proc. Natl. Acad. Sci. USA 106: 22002–22007.
Yang, T., and Poovaiah, B.W. (2002). A calmodulin-binding/CGCG box
DNA-binding protein family involved in multiple signaling pathways in
plants. J. Biol. Chem. 277: 45049–45058.
Zhou, L.M., Fu, Y., and Yang, Z.B. (2009). A genome-wide functional
characterization of Arabidopsis regulatory calcium sensors in pollen
tubes. J. Integr. Plant Biol. 51: 751–761.
Zik, M., and Irish, V.F. (2003). Global identification of target genes
regulated by APETALA3 and PISTILLATA floral homeotic gene action.
Plant Cell 15: 207–222.
Calcium Regulation of Gene Expression 4095

DOI 10.1105/tpc.111.090480; originally published online November 15, 2011; 2011;23;4079-4095Plant Cell
Saunders, Heather Knight and Marc R. KnightHelen J. Whalley, Alexander W. Sargeant, John F.C. Steele, Tim Lacoere, Rebecca Lamb, Nigel J.
ArabidopsisTranscriptomic Analysis Reveals Calcium Regulation of Specific Promoter Motifs in
This information is current as of June 13, 2018
Supplemental Data /content/suppl/2011/10/26/tpc.111.090480.DC1.html
References /content/23/11/4079.full.html#ref-list-1
This article cites 90 articles, 31 of which can be accessed free at:
Permissions https://www.copyright.com/ccc/openurl.do?sid=pd_hw1532298X&issn=1532298X&WT.mc_id=pd_hw1532298X
eTOCs http://www.plantcell.org/cgi/alerts/ctmain
Sign up for eTOCs at:
CiteTrack Alerts http://www.plantcell.org/cgi/alerts/ctmain
Sign up for CiteTrack Alerts at:
Subscription Information http://www.aspb.org/publications/subscriptions.cfm
is available at:Plant Physiology and The Plant CellSubscription Information for
ADVANCING THE SCIENCE OF PLANT BIOLOGY © American Society of Plant Biologists


