Download - Treasury Annual Report 2019-20

TR
EA
SU
RY
AN
NU
AL R
EP
OR
T
2019
–20
Annual Report2019–20
treasury.gov.au


Annual Report2019–20

ii The Treasury Annual Report 2019–20
© Commonwealth of Australia 2020
ISSN 0728-9405
This publication is available for your use under a Creative Commons BY Attribution 3.0 Australia licence, with the exception of the Commonwealth Coat of Arms, the Treasury logo, photographs, images, signatures and where otherwise stated. The full licence terms are available from creativecommons.org/licenses/by/3.0/au/legalcode.
Use of Treasury material under a Creative Commons BY Attribution 3.0 Australia licence requires you to attribute the work (but not in any way that suggests that Treasury endorses you or your use of the work).
TREASURY MATERIAL USED ‘AS SUPPLIED’Provided you have not modified or transformed Treasury material in any way including, for example, by changing the Treasury text; calculating percentage changes; graphing or charting data; or deriving new statistics from published Treasury statistics — then Treasury prefers the following attribution:
Source: The Treasury
DERIVATIVE MATERIALIf you have modified or transformed Treasury material, or derived new material from those of Treasury in any way, then Treasury prefers the following attribution:
Based on Treasury data
USE OF THE COAT OF ARMSThe terms under which the Coat of Arms can be used are set out on the Department of the Prime Minister and Cabinet website (see www.pmc.gov.au/government/commonwealth-coat-arms).
OTHER USESEnquiries regarding this licence and any other use of this document are welcome at:
Branch Head Communications Branch The Treasury Langton Crescent Parkes ACT 2600 Email: [email protected]
A copy of this document and other Treasury information appears on the Treasury website. The Treasury website address is: www.treasury.gov.au.
Printed by Canprint Communications Pty Ltd

iii
8 November 2020
The Hon Josh Frydenberg MP Treasurer Parliament House CANBERRA ACT 2600
Dear Treasurer
TREASURY ANNUAL REPORT 2019-20
I present the Treasury annual report for the year ended 30 June 2020.
The annual report has been prepared in accordance with section 46 of the Public Governance, Performance and Accountability Act 2013, and includes Treasury’s audited financial statements as prepared under section 42 of the Act.
The annual report is provided in line with the extension you granted, under subsection 34C(5) of the Acts Interpretation Act 1901, due to the impact on Treasury by the COVID-19 pandemic.
In addition, as required under the Public Governance, Performance and Accountability Rule 2014, I certify that I am satisfied that Treasury has in place appropriate fraud prevention, detection, investigation and reporting mechanisms that meet Treasury’s needs, including fraud risk assessments and fraud control plans, and that Treasury has taken all reasonable measures to appropriately deal with fraud.
Yours sincerely
Dr Steven Kennedy PSM Secretary to the Treasury
cc The Hon Alan Tudge MP, Minister for Population, Cities and Urban Infrastructure
The Hon Michael Sukkar MP, Assistant Treasurer and Minister for Housing
Senator the Hon Jane Hume, Assistant Minister for Superannuation, Financial Services and Financial Technology
Senator the Hon Zed Seselja, Assistant Minister for Finance, Charities and Electoral Matters
iv The Treasury Annual Report 2019–20
ContentsLetter of transmittal iiiIntroduction and guide to the report viii
Other sources of information viiiContact details viii
Part 1 — Overview 2
Secretary’s review 3
Departmental overview 5Part 2 — Report on performance 10
Annual performance statements 2019-20 11Treasury’s purpose 12Results and analysis 13Financial performance 33Part 3 – Management and accountability 38
Corporate governance 39Governance committees 39Risk management 45Fraud prevention and control 45Internal audit arrangements 45Ethical standards 46SES remuneration 46Significant non-compliance issues with relevant finance laws 46
External scrutiny 47External audit 47
Management of human resources 48Performance management 48Workplace relations 48Learning and development 48Staffing information 50
Asset management 59Purchasing 60Consultants 61Executive remuneration 62
Introduction 62Remuneration policies and practices 62Key management personnel 63Senior executive remuneration 65Other highly paid staff 66

v
Part 4 – Financial statements 68
Independent Auditor’s Report 69Statement by the Secretary and Chief Financial Officer 73Statement of Comprehensive Income 74Statement of Financial Position 75Statement of Changes in Equity 76Cash Flow Statement 77Administered Schedule of Comprehensive Income 78Administered Schedule of Assets and Liabilities 79Administered Reconciliation Schedule 80Administered Cash Flow Statement 81Notes to and forming part of the financial statements 82Part 5 – Appendices 148
Advertising and market research 149Grants 151Disability reporting 152Information publication scheme 153Work health and safety 154Carer support 156Ecologically sustainable development and environmental performance 157Australia and the international financial institutions 158
Australia and the International Monetary Fund 158Australia and the World Bank Group 163
Consumer data right 166Resource tables 167List of Requirements 171Abbreviations and Acronyms 177Glossary 180
vi The Treasury Annual Report 2019–20
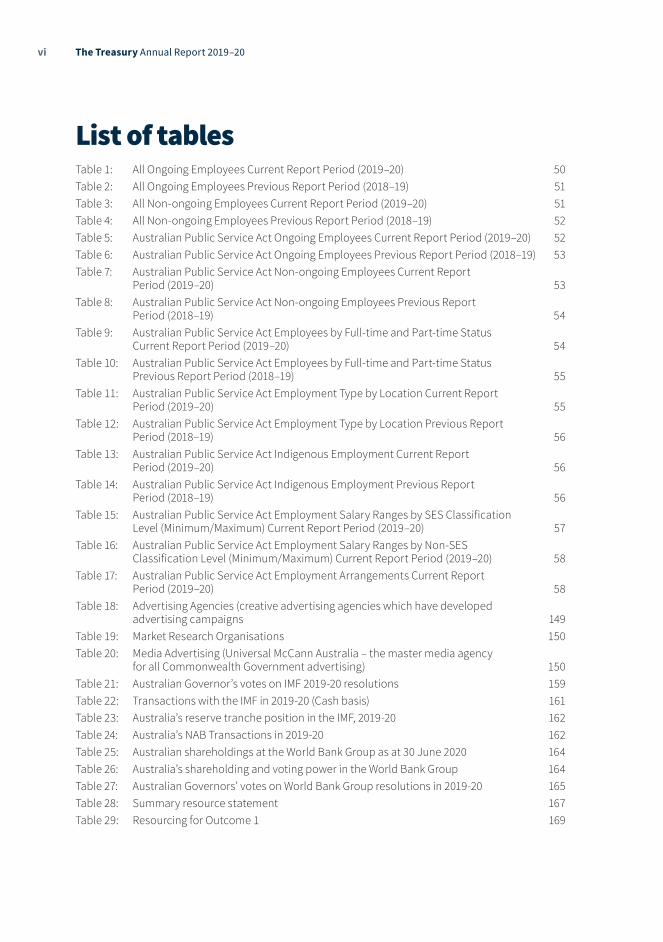
List of tablesTable 1: All Ongoing Employees Current Report Period (2019–20) 50Table 2: All Ongoing Employees Previous Report Period (2018–19) 51Table 3: All Non-ongoing Employees Current Report Period (2019–20) 51Table 4: All Non-ongoing Employees Previous Report Period (2018–19) 52 Table 5: Australian Public Service Act Ongoing Employees Current Report Period (2019–20) 52Table 6: Australian Public Service Act Ongoing Employees Previous Report Period (2018–19) 53Table 7: Australian Public Service Act Non-ongoing Employees Current Report
Period (2019–20) 53Table 8: Australian Public Service Act Non-ongoing Employees Previous Report
Period (2018–19) 54Table 9: Australian Public Service Act Employees by Full-time and Part-time Status
Current Report Period (2019–20) 54Table 10: Australian Public Service Act Employees by Full-time and Part-time Status
Previous Report Period (2018–19) 55Table 11: Australian Public Service Act Employment Type by Location Current Report
Period (2019–20) 55Table 12: Australian Public Service Act Employment Type by Location Previous Report
Period (2018–19) 56Table 13: Australian Public Service Act Indigenous Employment Current Report
Period (2019–20) 56Table 14: Australian Public Service Act Indigenous Employment Previous Report
Period (2018–19) 56Table 15: Australian Public Service Act Employment Salary Ranges by SES Classification
Level (Minimum/Maximum) Current Report Period (2019–20) 57Table 16: Australian Public Service Act Employment Salary Ranges by Non-SES
Classification Level (Minimum/Maximum) Current Report Period (2019–20) 58Table 17: Australian Public Service Act Employment Arrangements Current Report
Period (2019–20) 58Table 18: Advertising Agencies (creative advertising agencies which have developed
advertising campaigns 149Table 19: Market Research Organisations 150Table 20: Media Advertising (Universal McCann Australia – the master media agency
for all Commonwealth Government advertising) 150Table 21: Australian Governor’s votes on IMF 2019-20 resolutions 159Table 22: Transactions with the IMF in 2019-20 (Cash basis) 161Table 23: Australia’s reserve tranche position in the IMF, 2019-20 162Table 24: Australia’s NAB Transactions in 2019-20 162Table 25: Australian shareholdings at the World Bank Group as at 30 June 2020 164Table 26: Australia’s shareholding and voting power in the World Bank Group 164Table 27: Australian Governors’ votes on World Bank Group resolutions in 2019-20 165Table 28: Summary resource statement 167Table 29: Resourcing for Outcome 1 169

vii
List of figures and chartsFigure 1: Treasury Group senior management as at 30 June 2020 6Figure 2: Treasury outcome and program structure 8Figure 3: Treasury portfolio outcome and program structure as at 30 June 2020 33

viii The Treasury Annual Report 2019–20
Introduction and guide to the reportThe Treasury Annual Report 2019-20 outlines performance against outcomes, program and performance information contained in the Portfolio Budget Statements 2019-20, Portfolio Additional Estimates Statements 2019-20 and the Treasury Corporate Plan 2019-20.
This report includes the reporting requirements and financial accounts for the Australian Government Actuary. The financial accounts for the Foreign Investment Review Board and Takeovers Panel are also included in this report, along with limited performance reporting. More comprehensive performance reporting may be found in their respective annual reports.
Part 1 details Treasury’s role, functions, senior management structure, organisational structure and portfolio structure.
Part 2 provides an analysis of performance against Treasury’s policy and program outcomes.
Part 3 reports on management and accountability issues as required under the annual report guidelines.
Part 4 presents the audited financial statements of Treasury as required under the annual report guidelines.
Part 5 includes other information as required under the annual report guidelines.
This report concludes with a glossary, a list of abbreviations and acronyms and an index of the report.
Other sources of informationTreasury releases information on its activities through publications, press releases, speeches, reports and the annual report. All of Treasury’s publications are available on its website: www.treasury.gov.au.
Contact detailsThe contact officer for enquiries regarding this report is:
Principal Adviser Executive Coordination and Governance Branch The Treasury Langton Crescent PARKES ACT 2600 Email: [email protected]


Part 1 — Overview
Secretary’s review 3
Departmental overview 5
2 The Treasury Annual Report 2019–20

Secretary’s reviewI am pleased to introduce my first annual report as Secretary to the Treasury. It covers one of the most demanding years in the department’s history, and the achievements in this report are a credit to the commitment and dedication of our staff.
Portfolio updateThroughout 2019-20 we were at the forefront of providing economic advice to the Government that supports the effective management of the Australian economy. This is a significant responsibility that relies on our professionalism, judgment and expertise.
Under the leadership of my predecessor Phil Gaetjens, we delivered advice on significant tax reforms and saw the passage of the Protecting Your Super laws. We also established the Centre for Population and put in place a research program focused on understanding Australia’s current and future population, and the reasons and drivers of change.
Phil launched Treasury’s first Inclusion and Diversity Strategy, bringing together a set of action plans that promote inclusive practices. We invested in the wellbeing of our staff through a range of initiatives, such as resilience and mental health workshops and hosted the Canberra leg of the R U OK? Trust the Signs national tour. This investment was eerily prescient given the challenges presented in 2020 for all Australians.
I was appointed as Secretary in September 2019. In my first few months, we were heavily involved in delivering the Government’s financial services reform agenda following the Royal Commission.
Treasury was responsible for a large proportion of Bills introduced into Parliament in the 2019-20 financial year: in total, there were 52 Bills containing 113 measures across the range of our responsibilities.
Throughout the year we provided policy advice on the digital economy. We established the framework for the Consumer Data Right program and assisted the Government in its response to the ACCC’s Digital Platforms Inquiry.
In other work, we supported the independent Retirement Income Review and continued to promote Australia’s interests within forums such as the G20 and the International Monetary Fund. Our international activities included formal dialogues with economic institutions in our region. Our staff posted in Washington DC, London, Paris, Tokyo, Beijing, Jakarta and New Delhi continued to play a crucial role in representing Treasury’s interests, and this year we deployed Treasury officials to Indonesia and Papua New Guinea.
From August 2019-March 2020, our staff visited five regional areas in four states as part of our regional engagement program, giving them a broader perspective of how the economic policies we design affect regional economies. This program was in addition to the many face-to-face and virtual engagement and consultation activities undertaken across the department, including through our Melbourne, Sydney and Perth offices.
Dr Steven Kennedy PSM Secretary
3

4 The Treasury Annual Report 2019–20
In early 2020, following a devastating summer of bushfires across the country, Treasury worked closely with other agencies on preparing the Government’s bushfire response plan. This provided support to affected communities and businesses through the $2 billion Bushfire Recovery Fund and other bushfire assistance policies.
Since the outbreak of the COVID-19 pandemic — the biggest shock to Australia in decades — we have focused on assessing the impact of the COVID-19 shock and providing ongoing advice to the Government on its economic response. We undertook analysis of real-time data and economic projections of the impact of the spread of the virus and Government restriction policies on different sectors of the economy, and advised on the implications for economic recovery. We engaged extensively with the community, including through the establishment of the Coronavirus Business Liaison Unit. All of this informed the development of the Government’s $198 billion COVID 19 Response package released since the onset of the pandemic.
We have played a key role in the delivery of a number of the response measures, including JobKeeper, HomeBuilder, tax incentives to help businesses invest, temporary regulatory measures to assist businesses during the COVID-19 pandemic and implementation of the zero dollar threshold for foreign investment. We have supported significant engagement with the States and Territories, including through the Council of Federal Financial Relations.
To respond to the evolving situation we created new teams and taskforces and established flexible, cross-departmental teams. Despite all the challenges of COVID-19, like the rest of the public service, we adapted effectively to new ways of working.
The year aheadThe year ahead is marked by our ongoing work on the COVID-19 pandemic. Considerable uncertainty about the progression of the virus and its full impact on the economy remains. In the months and years ahead, we will continue to support the COVID-19 economic response measures and recovery work.
We will continue to progress and implement significant reforms to Australia’s foreign investment framework. As well as addressing national security risks and streamlining investments in non-sensitive businesses, the reforms provide additional resources and stronger powers for Treasury to ensure compliance with the foreign investment laws.
We have delivered the 2020-21 Budget and over the remainder of 2020-21 will deliver the Mid-Year Economic and Fiscal Outlook, the 2021-22 Budget, and the next Intergenerational Report, which will assess the long-term sustainability of Government policies.
I want to express my thanks and gratitude to the staff of the Treasury for their hard work and dedication. It has been a demanding year on many fronts and we have delivered advice to Government on the economic outlook and Budget measures on a scale rarely seen in this country, along with directly delivering a number of key Government programs and a significant legislative agenda.
I also want to acknowledge the whole public sector, both Commonwealth and State, who have pulled together in the face of this crisis to coordinate the unprecedented policy response.
I am pleased to report on our performance for the 2019-20 financial year.
Dr Steven Kennedy Secretary to the Treasury

5Part 1 Overview
Departmental overviewTreasury is the Government’s pre-eminent economic adviser.This is a significant responsibility which relies on our professionalism, judgment and expertise in providing advice to the Government that supports the effective management of the Australian economy.
The Treasury Portfolio Budget Statements 2019-20 outcome is:
Supporting and implementing informed decisions on policies for the good of the Australian people, including for achieving strong, sustainable economic growth, through the provision of advice to Treasury Ministers and the efficient administration of Treasury’s functions.
Under the Treasury Corporate Plan 2019-20, our purpose is to support and implement informed decisions on policies for the good of the Australian people, consistent with achieving strong, sustainable economic growth and fiscal settings.
COVID-19 - a once-in-a-century pandemic – delivered an enormous shock to our economy. The effective delivery of our purpose was even more important as we assisted the Government’s economic response and recovery efforts.
Our work has been vital in supporting the Government’s economic response to the pandemic and is now focused on developing economic advice and analysis as well as designing and delivering programs to support the Government’s economic recovery measures focused on employment and building confidence of individuals and businesses.

6 The Treasury Annual Report 2019–20
Figure 1: Treasury Group senior management as at 30 June 2020
SECRETARY: DR STEVEN KENNEDY PSM
Deputy Secretary: Luke Yeaman International Policy and Engagement Division – Division Head: Lisa Elliston Macroeconomic Conditions Division – Division Head: Trevor Power Macroeconomic Modelling and Policy Division – Division Head: Ian Beckett
Overseas operations Beijing: Rachel Thompson Jakarta: Katherine Tuck and Kristy Baker London: Emily Martin New Delhi: Percy Bell OECD (Paris): Brendan McKenna Tokyo: David Lowe Washington DC: Marty Robinson
MACROECONOMIC GROUP
Deputy Secretary: Jenny Wilkinson Budget Policy Division – Division Head: Jonathan Rollings Centre for Population – Executive Director: Victoria Anderson Environment, Industry and Infrastructure Division – Division Head: Matt Brine JobKeeper Division – Division Head: Phillipa Brown A/g National Security and Commonwealth-State Relations Division – Division Head: Damien White Social Policy Division – Division Head: Vicki Wilkinson
FISCAL GROUP
REVENUE GROUP
Deputy Secretary: Maryanne Mrakovcic Board of Taxation Secretariat – Chief Executive Officer: Lynn Kelly Corporate and International Tax Division – Division Head: Paul McCullough Individuals and Indirect Tax Division – Division Head: Hector Thompson A/g Law Design Office – Division Head: Simon Writer Tax Analysis Division – Division Head: Katrina Di Marco

7Part 1 Overview
Deputy Secretary: Meghan Quinn PSM Australian Government Actuary: Guy Thorburn Financial System Division – Division Head: James Kelly Market Conduct Division – Division Head: Christine Barron Retirement Income Policy Division – Division Head: Robert Jeremenko Takeovers Panel – Director: Allan Bulman
MARKETS GROUP
Deputy Secretary: Roxanne Kelley PSM Chief Financial Officer Division – Division Head: Robert Twomey Communications and Parliamentary Division – Division Head: Shannon Kenna Foreign Investment Division – Division Head: Roger Brake Information Services Division – Division Head: Mike Webb People and Organisational Strategy Division – Division Head: Cristy England
Sydney Office – Head: Lynn Kelly Melbourne Office – Head: Damian Mullaly Perth Office – Head: Aidan Storer
CORPORATE AND FOREIGN INVESTMENT
GROUP
Coronavirus Coordination Team – Lead: Michelle Dowdell Regulation Resolution Unit – Division Head: Mark Cully Coronavirus Business Liaison Unit – Lead: Charlotte Tressler Productivity Commission Economic Liaison – Principal Adviser: Ana Markulev Recovery Plan Taskforce – Division Head: Hamish McDonald Markets Taskforce – Lead: Kate O’Rourke
COVID-19 RESPONSE

8 The Treasury Annual Report 2019–20
Figure 2: Treasury outcome and program structure
Outcome 1: Supporting and implementing informed decisions on policies for the good of the Australian people, including for achieving strong, sustainable economic growth, through the provision of advice to Treasury Ministers and the efficient administration of Treasury’s functions.
Program 1.1: Department of the Treasury
Program 1.2: Payments to International Financial Institutions
Program 1.3: Support for Markets and Business
Program 1.4: General Revenue Assistance
Program 1.5: Assistance to the States for Healthcare Services
Program 1.6: Assistance to the States for Skills and Workforce Development
Program 1.7: Assistance to the States for Disability Services
Program 1.8: Assistance to the States for Affordable Housing
Program 1.9: National Partnership Payments to the States

9Part 1 Overview

10 The Treasury Annual Report 2019–20
Part 2 — Report on performance
Annual performance statements 2019-20 11
Treasury’s purpose 12
Results and analysis 13
Financial performance 33

11
Annual performance statements 2019-20Statement of PreparationI, as the Accountable Authority of the Department of the Treasury, present the Annual Performance Statements 2019-20 as required under section 39(1)(a) of the Public Governance, Performance and Accountability Act 2013 (PGPA Act).
In my opinion, the Annual Performance Statements are based on properly maintained records, accurately reflect the performance of the Treasury and complies with section 39(2) of the PGPA Act.
Dr Steven Kennedy PSM Secretary to the Treasury
15 September 2020

12 The Treasury Annual Report 2019–20
Treasury’s PurposeTreasury’s purpose is to support and implement informed decisions on policies for the good of the Australian people, consistent with achieving strong, sustainable economic growth and fiscal settings, as set out in the Corporate Plan 2019-20 (Corporate Plan).
Treasury’s purpose statement in the Portfolio Budget Statements 2019-20 (PBS) was consistent with Treasury’s outcome statement – to support and implement informed decisions on policies for the good of the Australian people, consistent with achieving strong, sustainable economic growth and fiscal settings.
As set out in the Corporate Plan, Treasury pursues its purpose through directing our efforts across four strategic focus areas:
� promoting a sound economic environment
� effective Government spending arrangements and regulations
� well-functioning markets to encourage consumer and investor confidence
� sustainable taxation and revenue arrangements.
To enable a clear read between the PBS and the Corporate Plan, the Annual Performance Statements include an analysis against each of the four areas of strategic focus set out in the Corporate Plan.

13Part 2 Report on Performance
Results and AnalysisAnalysis of performance against the purpose of promoting a sound economic environmentIn 2019-20, Treasury provided advice to Treasury ministers on matters of macroeconomic importance, including current economic conditions and the outlook for the Australian economy, macroeconomic policies (monetary and fiscal), and current and prospective international economic and strategic issues.
Treasury has continued to provide economic forecasts and projections following the release of the National Accounts, as well as regular updates on economic conditions, as data became available. We established the Centre for Population to provide regular advice on population issues to the Minister for Population and the Treasurer. This includes modelling and advice on the economic and demographic implications of policy options that contribute to the Government’s agenda.
� Treasury has provided macroeconomic analysis and advice to the Government on the impacts of COVID-19 and the implications for the economic recovery. We focused our modelling and data analysis capability on working closely across government and private sectors to obtain, curate and report on high-frequency indicators of economic activity. This helped Treasury’s monitoring of the Australian economy during the COVID-19 pandemic. Through this time, Treasury strengthened our liaison with the private sector and industry through the establishment of the Coronavirus Business Liaison Unit. This unit engaged regularly with peak business and industry groups on systemic economic issues arising from COVID-19.
� We continued to advise Government on and promote Australia’s interests in the international arena, including through advocacy for global economic openness, and supporting global and regional macroeconomic stability. Building on the active monitoring of global economic developments and responses to COVID-19, Treasury contributed to the economic and financial response to the pandemic through the G20 and international financial institutions, including the International Monetary Fund (IMF).

14 The Treasury Annual Report 2019–20
Results against the purpose of promoting a sound economic environment
Performance criteria
International engagement
Advance Australia’s interests through effective support of ministerial and senior official international engagement.
Target • Clear articulation of Australia’s interests in departmental context setting meetings held prior to significant international engagement
• Deepened engagement and collaboration with other countries to enhance Australia’s influence in multilateral forums
• Focused meeting briefs and interventions on advancing Australia’s interests• Efficient and effective logistical support to travel and events• Shared meeting outcomes and observations, internally and with other government
agencies, to facilitate consistency (where appropriate) in whole-of-government positions and representation.
Source PBS Program 1.2
Corporate Plan 2019-20
Results Criteria met.
In 2019-20, Treasury supported the Treasurer, or his representative, to advance Australia’s economic interests through engaging with multilateral forums, including: • G20, through Finance Ministers and Central Bank Governors’ meetings, including
responding to the economic impacts of COVID-19 via the G20 Action Plan• IMF and World Bank Spring and Annual meetings, including ensuring the institutions
are responding to COVID-19 through the provision of emergency financing, funding and technical assistance
• international counterparts to exchange views on the economic impacts and policy responses to COVID-19
• publication of a joint op-ed Multilateralism: A Pillar of Economic Stability with Finance Ministers from Singapore, Indonesia and Canada about the importance of the G20 as a forum for global leaders to agree on solutions to shared economic problems
• visits to the United States of America to meet counterparts and explore productivity-enhancing policies.
Treasury supported and furthered engagement with our regional counterparts through continued deployment of Treasury officials to the Indonesian Ministry of Finance and participating in formal dialogues and discussions with economic institutions in strategic countries such as Japan, South Korea, India, Vietnam, Indonesia and the Philippines.
Internationally, Treasury participated in working groups in the G20 and co-chaired (alongside Brazil) the G20 Infrastructure Working Group, leading development of the InfraTech agenda, implementing the G20 Quality Infrastructure Investment Principles and progressing efforts to increase private sector investment to fill the infrastructure investment gap in both developed and emerging economies.

15Part 2 Report on Performance
Performance criteria
Modelling capability
Advice and analysis on international and domestic economic and financial conditions will make a contribution to policy analysis and development.
Target • Timely and accurate updates on domestic and global economic and financial conditions, and information notes with deeper analysis of core aspects of the international and domestic economies
• Robust and effective economic models to be used across Treasury for economic forecasting and analysis of major policy proposals
• Consideration of stakeholder views, informed by Treasury’s regular business liaison program, and engagement with overseas posts, academia, policy institutes, and other government departments and agencies.
Source PBS Program 1.1
Corporate Plan 2019-20
Results Criteria met.
In 2019-20, Treasury continued to deliver regular assessments of economic conditions and develop forecasts and projections of the economic outlook in line with government priorities, including: • preparing updates of economic forecasts and projections following the quarterly release of
the National Accounts as well as preparing economic notes and correspondence following key macroeconomic data releases, and special data releases in relation to COVID-19
• providing ministerial submissions to the Treasurer on a range of topics relating to the domestic economy
• providing analysis and advice to the Government on the impacts of the COVID-19 pandemic and the implications for the economic recovery. This included engaging with the National Coronavirus Co-ordination Commission and the Department of the Prime Minister and Cabinet to provide advice to the National Cabinet. Treasury further undertook analysis of Government restriction policies based on the Australian Health Protection Principal Committee re-opening guidelines.
Treasury continued to invest in the development and application of macroeconomic models and more recently an applied microdata analytical capability, including:• using our modelling capability to advise the Government on the potential impact of the
COVID-19 pandemic on different sectors of the economy, as well as on the implications of fiscal policy for economic growth and recovery
• using an Econometric Macroeconomic Model of Australia (EMMA), to produce economic projections and assist with analysis of the economy, from February 2020. This model has been a key part of Treasury’s ability to provide the Government with ongoing economic advice during the COVID-19 pandemic
• focusing our modelling and data analysis capability on working closely across government and private sectors to obtain, curate and report on high frequency indicators of economic activity, such as youth labour data and labour market data to help Treasury’s monitoring of the Australian economy during the COVID-19 pandemic. We also used real-time administrative data to analyse the effect of interventions such as JobKeeper and JobSeeker on labour market outcomes.
Treasury regularly presents its modelling methodologies to an expert panel to challenge ideas and ensure modelling approaches are robust.

16 The Treasury Annual Report 2019–20
In October and November 2019, Treasury undertook a business liaison program to consider the views of stakeholders on the economy. In response to COVID-19, we strengthened our liaison with these stakeholders through the creation of the Coronavirus Business Liaison Unit in March 2020. This unit engaged regularly with peak business and industry groups (including the Australian Chamber of Commerce and Industry, the Business Council of Australia, the Council of Small Business Organisations Australia, the Australian Industry Group, the National Farmers’ Federation and the Australian Banking Association) on systemic issues arising from COVID-19.
In addition, Treasury created the Coronavirus Economic Recovery Taskforce in April 2020. The Taskforce informs decision-making to support the Australian economy to return to full employment and strong economic growth as we emerge from the COVID-19 pandemic. The taskforce is working across government to identify the set of policies Australia needs in place to maximise jobs and economic growth and promote economic resilience in the aftermath of the pandemic.
Performance criteria
Demographic change
Analysis and advice on the economic implications of policy options and demographic change.
Target Timely and insightful modelling and advice on population issues and the economic and demographic implications of policy options that contribute to the Government’s agenda, including the establishment of the new Centre for Population by the end of 2019, in line with government priorities.
Source PBS Program 1.1
Corporate Plan 2019-20
Results Criteria met.
The Centre for Population was established on 1 July 2019, and officially launched by the Minister for Population, Cities and Urban Infrastructure on 4 October 2019. The Centre provides regular advice on population issues to the Minister for Population and the Treasurer as needed.
The Centre developed a research program of major projects for 2020. The research themes focused on understanding Australia’s current and future population, reasons and drivers for location, and impacts of population changes. Research was to be delivered through a combination of Treasury analysis, commissioning experts to undertake targeted work, and collaboration with academia and Commonwealth and State and Territory government agencies.
Up until March 2020, the Centre engaged with stakeholders within and outside government. The Centre:• held 67 stakeholder meetings with academics, universities, think tanks, large corporates,
regional development bodies, local councils, and industry organisations• convened two meetings of the population interdepartmental committee • held bilateral discussions with States, Territories and the Australian Local Government
Association (ALGA)• established and convened meetings of the Population Senior Officials Working Group, the
Data and Forecasting Working Group and Regional Analysis Working Group• negotiated the National Population and Planning Framework with States, Territories and the
ALGA, which was agreed by COAG in February 2020.

17Part 2 Report on Performance
In response to COVID-19, the Centre continued: • progressing its research agenda, including the Population Statement and the National
Population and Planning Framework, albeit on a longer timeframe than initially envisaged• providing population forecasts and projections, including forecasting net overseas migration• working closely with the Australian National University on development of a state population
projections model• providing advice to the Treasurer, ahead of National Cabinet, on the number of workers
affected by potential school closures during the initial surge in COVID-19 cases. This advice incorporated adjustments for families with non-participating parents and older children who could provide care for children unable to attend school.
The Centre also redeployed employees to other parts of Treasury to respond to immediate priorities to support the Government’s economic response to COVID-19 from March 2020 until 15 May 2020, when the Centre’s work resumed.
Performance criteria
International and regional engagement
Deepened regional engagement and engagement with governance and financial obligations related to international financial institutions to promote Australia’s interests.
Target • Timely and accurate payments to the IMF in accordance with the International Monetary Agreements Act 1947, and to multilateral development banks of which Australia is a member, specifically the World Bank Group, the Asian Development Bank, the European Bank of Reconstruction and Development, the Asian Infrastructure Investment Bank, and the Global Infrastructure Hub
• Engagement with regional stakeholders including the provision of efficient and effective logistical support
• Expenditure of the Regional Engagement Fund in accordance with the Guidelines to Access Treasury’s Regional Engagement Fund
• Effective appointment processes to governance boards which meet the requirements of individual institutions’ constitutions.
Source PBS Programs 1.2 and 1.3
Corporate Plan 2019-20
Results Criteria met.
In 2019-20, payments were made to international financial institutions in accordance with the International Monetary Agreements Act 1947. These payments were made on behalf of the Government to promote Australia’s interests.
Over the period, Treasury completed more than 20 transactions to the IMF, including a $407 million maintenance of value payment, five New Arrangements to Borrow repurchases (over $105 million), five Special Drawing Rights (SDR) sales (over $22 million), two SDR purchases (over $61 million), seven quota calls (over $1.26 billion), and four quota calls (over $890 million) in response to emergency financing requests due to COVID-19. These transactions were completed within the required timeframes.
18 The Treasury Annual Report 2019–20
Treasury also made timely payments to the Multilateral Development Banks, where required. This included:• lodging a promissory note worth $213.27 million with the Reserve Bank of Australia (RBA) by
the due date in January 2020, to pay for the third instalment of the World Bank’s eighteenth replenishment of the International Development Association (IDA18)
• lodging a promissory note for $117.13 million with the RBA by the due date in June 2020, to pay for the fourth and final instalment of the Asian Development Bank’s eleventh replenishment of the Asian Development Fund
• making a capital payment of $214.87 million to the Asian Infrastructure Investment Bank by the due date in December 2019, the fifth and final instalment of Australia’s paid in capital to the bank.
Treasury also worked with international organisations to promote Australia’s interests throughout 2019-20. We concluded the IMF’s Fifteenth General Review of Quotas and progressed legislative amendments to facilitate Australia’s commitment to modify the IMF resourcing arrangements, which include doubling the New Arrangements to Borrow and commencement of a new round of Bilateral Borrowing Arrangements.
We progressed the Government’s commitment to lend resources to the IMF Poverty Reduction and Growth Trust and facilitated the IMF staff and yearly Article IV visits to Australia. We supported appointment processes to governance boards in accordance with individual institutions’ requirements, including appointments to the board of the Asian Infrastructure Investment Bank.
Prior to COVID-19 travel restrictions, the Regional Engagement Fund supported a range international engagements including a visit to South Korea to further develop the relationship with its Ministry of Economy and Finance, a joint trip with the Australian Securities and Investments Commission to Indonesia to undertake a Financial Stability Board review, attendance at a joint committee on the Asia Region Funds Passport in Singapore, and continued capacity building in South Asian countries via support for the IMF’s South Asia Regional Training and Technical Assistance Centre. The engagements were funded in accordance with the Guidelines to Access Treasury’s Regional Engagement Fund.

19Part 2 Report on Performance
Case study Since late 2019, Treasury has responded to the economic challenges of the 2019-20 bushfires and more recently, the COVID-19 pandemic, by providing advice and analysis to government, and implementing response programs.
We’ve established taskforces and units to coordinate response work and consult with business and industry, and used our modelling capability to understand the impacts of these events and the effect of interventions. We redeployed our staff, within the department, to work on COVID-19 priorities.
With timing of the essence, we provided advice to government, developed response measures and drafted supporting legislation. We undertook analysis of real time data and economic projections on government restriction policies on different sectors of the economy, and advised on the implications for economic recovery.
Our work informed the development of significant Government response packages, including:
� the $134 billion of direct fiscal support in response to the COVID-19 pandemic
� measures supporting the Government’s Economic Pathway to Recovery Plan
� the $2 billion Bushfire Recovery Fund, and other bushfire assistance policies.
Treasury has directly supported the implementation of response work, including the implementation of the JobKeeper Program and the Government’s announcement on 29 March 2020 that monetary thresholds for foreign investment screening would be reduced to zero during the pandemic, a time of heightened risk for distressed Australian businesses.
We drafted regulations to implement the change in the foreign investment arrangements and adapted our business structure and processes to support a significant increase in the volume of new applications and enquiries, when compared with the same quarter last year, prioritising investment applications that protect and support Australian businesses and jobs.

20 The Treasury Annual Report 2019–20
Analysis of performance against the purpose of promoting effective government spending arrangements and regulationsIn 2019-20, Treasury advice informed the Government’s decisions on the economic and social policy reforms announced in the 2019-20 Mid-Year Economic and Fiscal Outlook (MYEFO) and in response to the COVID-19 pandemic and the 2019-20 bushfires. We advised the Government on its fiscal strategy, economic, social and national security policies relating to education, employment, immigration, population, families, welfare payments, housing, health, ageing, disability, Indigenous matters, as well as justice issues, defence, national security, transport, infrastructure, industry, environment, energy and resources, agriculture, communications, competition, consumer data right, tourism, and regional matters.
In light of the economic challenges since the MYEFO, Treasury’s advice has particularly focussed on developing the economic policy responses to COVID-19. This included advice on specific policies, the overall size and composition of the economic support package, and formulating an economic plan and measures for the pathway to recovery. We also provided advice to the Government on its fiscal position, including liaising with the Australian Office of Financial Management (AOFM) in relation to the management of the Government’s borrowing requirements.
From March 2020, Treasury developed advice and worked with the Australian Taxation Office (ATO) to design and implement the JobKeeper payment in a rapid response to the economic and employment crisis following the COVID-19 pandemic. The JobKeeper payment is one of the largest fiscal and labour market interventions in Australia’s economic history and has been critical in supporting businesses and employees through the COVID-19 pandemic. We worked closely with the ATO, other government agencies and relevant stakeholders to maximise the reach of the JobKeeper program while ensuring it was able to be implemented as quickly and efficiently as possible.
Treasury also advised on changes to the income support system to assist individuals during the COVID-19 pandemic. This advice was aligned with developments in the economic and labour market conditions, and considered the interaction with the JobKeeper payment and agency service delivery capacity.
Although the 2020-21 Budget has been delayed until 6 October 2020, Treasury continued to release reports throughout the year on the economic and fiscal outlook, including managing the ongoing budget processes and commencing work on the Intergenerational Report, which has been delayed until mid-2021. We also delivered the 2018-19 Final Budget Outcome, the 2019-20 MYFEO in 2019 and additional debt statements in accordance with the Charter of Budget Honesty Act 1998.
Treasury supported an increase in frequency of Council on Federal Financial Relations (CFFR) meetings, which supported the coordination of policy responses between the Commonwealth and State and Territory governments. Lastly, Treasury continued to make financial support payments to the States and Territories in accordance with the Intergovernmental Agreement on Federal Financial Relations. Treasury’s work in this area forms part of the coordinated action to address Australia’s economic and social challenges.

21Part 2 Report on Performance
Results against the purpose of promoting effective government spending arrangements and regulations
Performance criteria
Coordinate the preparation of the Australian Government Budget
All Budget documentation required by the Charter of Budget Honesty Act 1998 (the Charter) is delivered.
Target • The Treasury complies with the requirements of the Charter.• Documents required under the Charter are delivered as they fall due.
Source PBS Program 1.1
Corporate Plan 2019-20
Results Criteria met.In 2019-20, the following Australian Government Budget documents were prepared and released in accordance with the Charter:• 2018-19 Final Budget Outcome released on 19 September 2019• 2019-20 Mid-Year Economic and Fiscal Outlook update released on 16 December 2019• two additional debt statements (outside of the Budget update).
As a result of the uncertainty surrounding the impact of COVID-19, the 2020-21 Budget was deferred until 6 October 2020. Delivery on 6 October 2020 is consistent with the requirements of the Charter.
Treasury prepared two reports for the Government to table, under clause 33 of the Charter that provided reasons for increases in the face value of Commonwealth debt on issue since MYEFO in December 2019. The Government tabled statements on 12 May and 12 June 2020, consistent with Charter requirements for tabling debt increases since the last update.
The Charter was amended to defer delivery of the next Intergenerational Report. As a result of these amendments, the report is required to be tabled on or before 30 June 2021.
In addition to the Budget documents released under the Charter, the Government announced in April 2020 (and then updated in June 2020) that an economic and fiscal update will be delivered in July 2020.

22 The Treasury Annual Report 2019–20
Performance criteria
Payments to States and Territories
Payments to State and Territory Governments are timely, and meet the requirements of the Intergovernmental Agreement on Federal Financial Relations (IGAFFR).
Target • 100 per cent of payments are made in accordance with the IGAFFR and its related schedules.• Relevant estimates are updated accurately and in a timely fashion. • Meetings of the Council on Federal Financial Relations are held at least biannually.
Source PBS Programs 1.4-1.9
Corporate Plan 2019-20
Results Criteria met.
In 2019-20, Treasury made payments to the States and Territories (the States) on the 7th and 21st of each month (or the next business day), in accordance with the IGAFFR.
In light of the 2019-20 bushfires and the COVID-19 pandemic, Treasury made extraordinary payments on 10 and 21 January 2020, 12 February 2020, 23 March 2020, 21 April 2020 and 21 May 2020. An extraordinary payment was also made on 30 June 2020.
All payments were made in accordance with the IGAFFR and other agreements between the Commonwealth and the States. As required by the IGAFFR, Treasury provided advice to the States on the components of each payment before it was made. We also met our obligation to provide GST revenue data to the States on a monthly basis and maintained a schedule of estimates of annual net GST receipts, in accordance with the IGAFFR.
During this period, specific purpose payments amounted to $61.69 billion and payments of general revenue assistance amounted to $66.11 billion. Current and past agreements are available on the Council on Federal Financial Relations’ website.
During this period, the Council on Federal Financial Relations met 13 times with a key focus on the economic response to the COVID-19 pandemic, the transition to the recovery phase and reform priorities as tasked by the National Cabinet.
Performance criteria
Fiscal policy contributions
Fiscal policy is influential and positive, and supports the Government’s economic agenda for the good of the Australian people.
Target • Ministers and relevant stakeholders indicate a constructive and positive contribution to public policy outcomes.
• Policy advice considers the views of relevant stakeholders; including industry, regulators and other entities, as required.
Source PBS Program 1.1
Corporate Plan 2019-20

23Part 2 Report on Performance
Results Criteria met.
Between 1 July 2019 and 30 June 2020, Treasury made contributions across fiscal policy issues in support of the Government’s economic agenda, such as providing advice on policy proposals and fiscal decisions in the context of the 2019-20 MYEFO, and on the package of economic support following the 2019-20 bushfires, the COVID-19 pandemic and changing global strategic circumstances.
Treasury’s work informed the development of significant government response packages, including:• the $134 billion of direct fiscal support in response to the COVID-19 pandemic • measures supporting the Government’s Economic Pathway to Recovery Plan• the $2 billion Bushfire Recovery Fund, and other bushfire assistance policies.
In providing policy advice, Treasury monitored and analysed the impacts of COVID-19 across different sectors of the economy. We engaged with business and industry groups, other government departments and agencies, taskforces, and state-based stakeholders. This work informed our fiscal policy advice to identify high-priority areas of Australia’s economy in need of immediate and temporary financial assistance, and in preparing the longer-term economic plan for recovery.
Treasury supported implementation of the Government’s response through:• advice on the considerations and decisions around key transitional support measures
including JobKeeper, JobSeeker, the Cash Flow Boost and other initiatives• developing and implementing HomeBuilder, an economic stimulus measure to support
the residential construction sector, through negotiating a National Partnership Agreement, signed by the Commonwealth and all States and Territories and establishing an Officials Working Group
• implementing a new National Partnership Agreement to assist the States and Territories with the health costs of COVID-19.
As at 30 June 2020, this work supported approximately 1.62 million recipients of unemployment benefits (JobSeeker and Youth Allowance — Other), COVID-19 supplement payments to around 2.2 million Australians fortnightly, totalling approximately $5.7 billion, and Economic Support Payments to around seven million people, totalling approximately $5.3 billion.
In 2019-20, Treasury’s work in providing policy advice on housing also included: • policy development relating to the National Housing Finance and Investment Corporation
(NHFIC)• developing and implementing the First Home Loan Deposit Scheme, administered by the
NHFIC, which commenced on 1 January 2020• consulting with the Australian Council of Social Service (ACOSS) regarding disadvantage and
inequality to inform advice to ministers and which is appreciated by ACOSS to discuss their views and those of their stakeholders
• working with the Department of Social Services on finalising the Data Integration Plan under the National Housing and Homelessness Agreement
• contributing to submissions for inquiries by the House of Representatives Standing Committee on Social Policy and Legal Affairs’ Inquiry into Homelessness in Australia, and the Senate Inquiry into the Adequacy of Newstart.
Treasury also made contributions to policy outcomes in 2019-20 through finalisation of negotiations on the 2020-25 National Health Reform Agreement and Seventh Community Pharmacy Agreement.
Treasury has regularly received positive feedback from Treasury ministers, their offices and other stakeholders on the high quality and timeliness of advice. For example:• the Treasurer’s Office provided positive feedback on briefing on the industrial relations
system and the Annual Wage Review submission• the advice provided on the Migration Program and highlighting the economic effects of
different migrant cohorts was very well received by the Treasurer’s Office and was influential in shaping the Government’s position on migration policy.

24 The Treasury Annual Report 2019–20
Case studyThe JobKeeper payment is one of the largest fiscal and labour market interventions in Australia’s economic history. It has been acknowledged by ministers and relevant stakeholders as providing a key means of support for businesses and employees during the COVID-19 pandemic.
Treasury provided policy advice and designed the JobKeeper payment in March 2020 in a rapid response to a steep deterioration in economic activity and employment following the COVID-19 pandemic. We worked closely with other government agencies and consulted with stakeholders in the development and implementation of the program.
JobKeeper had a large take-up, at over 920,000 organisations covering around 3.5 million individual recipients over the April-May 2020 period and it has achieved wide coverage, representing 30 per cent of pre-COVID-19 levels of private sector employment (based on February 2020 levels). As at 23 June 2020, payments totalled $20.3 billion over the four payment fortnights to 24 May 2020.
Treasury conducted a review of JobKeeper, which drew on a wide range of evidence, including quantitative evidence, engagement with industry stakeholders, and case studies of business experiences. The review was provided to the Government in late June 2020 and found that JobKeeper has delivered on all three key objectives: supporting business and job survival, preserving the employment relationship, and providing needed income support.
Quantitative evidence that was considered in the review included: JobKeeper administrative data from the ATO; data from the Australian Bureau of Statistics on the labour market, as well as several rounds of rapid surveys on the business and household impacts of COVID-19; and Treasury analysis of business microdata. Treasury held 49 consultation meetings with industry stakeholders in April to June 2020 to discuss the legislation and any issues arising from the JobKeeper program, including seeking feedback to inform the review.
In the absence of the JobKeeper program, Treasury estimates that the unemployment rate could have been around five percentage points higher in the June quarter 2020.

25Part 2 Report on Performance
Analysis of performance against the purpose of developing well-functioning markets that encourage consumer and investor confidenceIn 2019-20, Treasury’s advice informed the Government’s approach to supporting markets. This encouraged consumer and investor confidence, and helped the community and the economy respond to the onset of COVID-19. We provided advice on the financial system and developments in the financial sector. We worked to maintain and improve regulatory and general business frameworks to create stronger corporations, and greater trust and confidence in the corporate sector and in consumer law. We also provided advice and analysis on Australia’s retirement income system.
The advent of COVID-19 required a major adjustment to Treasury’s work program to support the Government’s response to the pandemic. This included redirecting resources and working closely with counterparts in the Council of Financial Regulators and other agencies. We developed policies and programs to support the continued flow of credit, provide a safety net for businesses in respect of insolvency, and measures to allow businesses to operate virtually and digitally. Close attention was also given to consumer issues arising directly from the pandemic.
Treasury progressed improvements to the product safety system and the retirement income system by developing legislation to make default insurance in superannuation more appropriate, assisted the exit of Eligible Rollover Funds from the market and provided policy advice to the Government for its response to the report of the Australian Competition and Consumer Commission (ACCC) on digital platforms. We established the overall framework for the Consumer Data Right program and the Australian Business Growth Fund. We also assisted the work of an independent panel on the Retirement Income Review.

26 The Treasury Annual Report 2019–20
Results against the purpose of developing well-functioning markets that encourage consumer and investor confidence
Performance criteria
Policy advice
Policy contributions are influential and positive to the Government’s economic agenda in support of well-functioning markets that encourage consumer and investor confidence.
Target • Ministers and relevant stakeholders find Treasury’s advice to be constructive, valuable and in line with Government priorities
• Policy advice considers the views of relevant stakeholders; including industry, regulators and other entities, as required.
Source PBS Programs 1.1 and 1.3
Corporate Plan 2019-20
Results Criteria met.
In 2019-20, Treasury provided advice to Treasury ministers to support markets that encourage consumer and investor confidence, including consulting with stakeholders.
Our work included: • providing advice on establishing the Retirement Income Review to assess how the three
pillars of the retirement income system will perform in the future as Australians live longer and the population ages, by facilitating the independent panel’s consultative approach and release of a consultation paper on 22 November 2019
• consultation on ‘Improving the Effectiveness of the Consumer Product Safety System’ on behalf of Consumer Affairs Australia and New Zealand, including over 25 roundtable discussions, conducting a consumer and a small business survey (which received 3,100 and 18 responses respectively), and receipt of over 30 non-confidential submissions. Formal feedback provided by stakeholders involved in consultations noted that sessions were informative, well run and that Treasury made ‘a real effort to seek industry feedback’
• roundtable discussion with industry stakeholders to progress the development of the Government’s proposed ‘Motor Vehicle Service and Repair Information Sharing Scheme’, receiving 53 submissions and releasing a high level summary of consultation processes
• providing advice on improving efficiencies by making default insurance in superannuation more appropriate and facilitating the exit of Eligible Rollover Funds from the market
• drafting an amendment to the Treasury Laws Amendment (Putting Members’ Interest First) Bill 2019 to facilitate the passage of legislation in line with the Government’s priorities
• consulting with industry and providing advice on amendments to the Treasury Laws Amendment (Prohibiting Energy Market Misconduct) Bill 2019 to support its passage through Parliament
• developing legislation and a framework for the Consumer Data Right program ahead of its launch on 1 July 2020, including consulting through an inquiry and issues paper on continuing and expanding to the energy sector, with 73 submissions received
• consulting with shareholders of the Australian Business Growth Fund to design its operations and develop a Shareholders’ Agreement to support the passage of the Australian Business Growth Fund Bill 2019 through Parliament
• conducting public consultation to inform policy advice on the Government’s response and implementation roadmap to the ACCC final report on digital platforms. We continued to collaborate with the ACCC and the Department of Infrastructure, Transport, Regional Development and Communications on developing a mandatory code governing commercial relations between digital platforms and Australian news media businesses.

27Part 2 Report on Performance
Treasury also provided advice to the Government on market issues related to the 2019-20 bushfires and the COVID-19 pandemic. This led to the implementation of measures to provide temporary relief to businesses and individuals, including:• allowing temporary early access to superannuation, working with the ATO and the Australian
Prudential Regulation Authority (APRA) to facilitate the timely release of superannuation. Treasury also provided policy advice to halve the superannuation minimum drawdown requirement in 2019-20 and 2020-21 to support retirees affected by financial market volatility and collaborated with the Department of Social Services to reduce social security deeming rates in recognition of low interest rates on savings
• establishing the Structured Finance Support Fund (to support funding for non-bank and smaller bank lenders) and the Coronavirus SME Guarantee Scheme to enhance lenders’ willingness to provide credit to SMEs (and advice on a related scheme for the arts sector)
• making temporary changes to insolvency laws so that businesses have a temporary safety net ahead of resuming normal operations when the crisis has passed
• allowing businesses to hold virtual annual general meetings and to allow company documents to be signed electronically
• providing a temporary exemption from responsible lending obligations for lenders providing credit to existing small business customers.
Following the onset of COVID-19, Treasury engaged with the APRA, the Australian Securities and Investments Commission (ASIC) and the ACCC to share information and co-ordinate actions where appropriate. The CFR increased the frequency of its meetings, and Treasury chaired regular, and at times daily calls, with CFR counterparts. Engagement with international counterparts, particularly New Zealand, also increased in frequency.
Performance criteria
Facilitate the Government’s response to the Royal Commission into Misconduct in the Banking, Superannuation and Financial Services Industry
In accordance with government priorities, deliver the Government’s response to the Royal Commission into Misconduct in the Banking, Superannuation and Financial Services Industry and its broader legislative and reform program for financial systems, corporate law and consumer policy.
Target • Legislative reform program is introduced to the Parliament in accordance with the Treasury Legislation Prioritisation Framework and government priorities.
Source PBS Programs 1.1 and 1.3
Corporate Plan 2019-20
Results Criteria met.
In 2019-20, Treasury continued to facilitate the Government’s implementation of recommendations from the Royal Commission into Misconduct in the Banking, Superannuation and Financial Services Industry (Royal Commission).
Treasury provided advice and prepared the Government’s Implementation Roadmap for the Royal Commission, which was released on 19 August 2019. The roadmap outlined how the Government will deliver on legislation to implement Royal Commission recommendations and additional actions committed to in the Government’s response of 4 February 2019.
Since the Government’s response to the Royal Commission, the Government has implemented 24 of the commitments made, with ten of these commitments being completed between 1 July 2019 and 30 June 2020. Treasury provided the secretariat for the capability review of the Australian Prudential Regulation Authority, a Royal Commission recommendation, and provided advice and developed legislation across a range of measures.
Treasury has also provided advice and developed a further 34 commitments made by the Government in response to the Royal Commission. Of these, we have consulted on exposure draft legislation for 27 commitments and released proposal papers for seven further commitments.
28 The Treasury Annual Report 2019–20
In delivering the Government’s response to the Royal Commission, Treasury has worked closely with the Office of Parliamentary Counsel, ASIC and APRA. We have engaged with over 125 stakeholders and held around 250 meetings with stakeholders. Over 300 submissions have been received from stakeholders across formal consultation processes.
As a result of the significant impacts of COVID-19, on 8 May 2020 the Government announced a six month deferral on the implementation of commitments associated with the Royal Commission.
Treasury’s work to implement the Government’s response to the Royal Commission has received widespread positive feedback, including:• from the Treasurer and the Treasurer’s Office on the roadmap and subsequent progress in
delivering the legislative agenda• from regulators and the Office of Parliamentary Counsel on the collaborative and
professional approach to delivery• external stakeholders for the clarity and certainty around timelines and processes.
Performance criteria
Administration of the foreign investment framework
Effective development and administration of Australia’s foreign investment framework.
Target • Regulatory performance meets whole-of-government standards.
Source PBS Programs 1.1 and 1.3
Corporate Plan 2019-20
Results Criteria met.
Treasury’s performance is consistent with whole-of-government standards for 2019-20, which are set out in the Australian Government Regulator Performance Framework. This assessment will be verified by the ministerial approved consultation body as part of the Regulator Performance Framework process.
The framework aims to improve the performance of regulators by establishing a means for Commonwealth regulators to evaluate, in partnership with key stakeholder groups, overall regulatory performance. To enhance performance and demonstrate ongoing commitment to the standards, in 2019-20 Treasury:• developed policy proposals to strengthen the foreign investment framework• advised on and implemented temporary threshold changes to address COVID-19 related risks• developed guidance and consulted with stakeholders on the temporary threshold changes• undertook a review of Foreign Investment Division’s business practices and capability
needs, including further work to improve business processes in light of temporary changes to foreign investment thresholds
• implemented initiatives to improve the administration of the foreign investment framework, including improvements to processes, IT and staff development and training
• implemented initiatives to improve how conditions applying to foreign investment approvals are developed and applied
• created a new team to enhance understanding of key sectors• undertook extensive formal and informal stakeholder engagement• increased staffing numbers to manage a growing case load, including as a result of
temporary threshold changes• prioritised urgent applications that supported Australian jobs and businesses during the
COVID-19 pandemic.

29Part 2 Report on Performance
Case studyForeign investment is critical to Australia’s economy and prosperity.
Australia operates a foreign investment regime that is open, transparent and welcoming. Foreign investment proposals are reviewed against the national interest on a case-by-case basis – an approach that maximises investment flows while protecting Australia’s interests. Our foreign investment review framework strikes a balance between facilitating investment and protecting Australia’s national interest.
In 2019-20, Treasury developed policy proposals to ensure that our foreign investment framework keeps pace with emerging risks and global developments. Other countries have also reviewed their foreign investment systems in light of these developments.
These reforms were announced by the Treasurer on 5 June 2020 and are the most comprehensive changes to Australia’s foreign investment review framework since the introduction of the Foreign Acquisitions and Takeovers Act 1975. The reforms strengthen the foreign investment review framework in three broad ways: they address national security risks, strengthen integrity and compliance, and streamline investment in non-sensitive businesses.
Consultation with stakeholders commenced shortly after the announcement, with legislation expected to commence on 1 January 2021.

30 The Treasury Annual Report 2019–20
Analysis of performance against the purpose of developing effective arrangements for revenue and taxation matters that support a sustainable tax systemThroughout 2019-20, Treasury continued to provide high quality and timely advice to Treasury ministers and the Government on a range of taxation policy issues. Treasury supported the Government to deliver its extensive legislative program in accordance with the relevant requirements, and published the 2018-19 Final Budget Outcome, 2019-20 Mid-Year Economic and Fiscal Outlook (MYEFO) and the 2019 Tax Benchmarks and Variations Statement with revenue estimates to the required standard.
In light of the economic challenges since the 2019-20 MYEFO, Treasury supported the Government’s economic policy responses to COVID-19 by providing policy advice on specific tax policies, contributing taxation policy insights for the pathway to recovery, and supporting the implementation of the Government’s responses including through legislation.
Due to the high degree of uncertainty in the economic and fiscal position from the pandemic, including in relation to revenue estimates, the Government decided to postpone the 2020-21 Budget from May to 6 October 2020. Treasury provided analysis and advice to support the Treasurer’s 12 May 2020 Ministerial Statement on the Economy, and provided modelling and analytical support to other initiatives, including the JobKeeper program.
During the 2019-20 bushfires, Treasury provided advice, costings and legislated the Government’s tax measures to respond to these natural disasters, including exempting bushfire disaster relief payments from taxation and listing new bushfire-related entities as deductible gift recipients. In addition, we helped improve the accessibility of information on bushfire-related charities, assisting donors to support affected local communities. During the bushfire and COVID-19 crises, Treasury developed tax administration measures, such as enabling tax lodgement deferrals by affected individuals and businesses to the ATO.
Results against the purpose of developing effective arrangements for revenue and taxation matters that support a sustainable tax system
Performance criteria
Modelling and forecasting capability
Modelling and forecasting capability support and improve the understanding of developments in the economy and inform policy processes.
Target • Models and forecasting activities are based on best-practice and deliver outcomes which are within accepted ranges.
Source PBS Program 1.1
Corporate Plan 2019-20

31Part 2 Report on Performance
Results Criteria met.
In 2019-20, Treasury continued to generate revenue forecasts and costings to support the Government’s consideration of a range of taxation, superannuation, social and fiscal policies. We continued to improve and build innovative computational modelling to support tax and budget forecasting. This included construction of the Model of Australian Retirement Income and Assets (MARIA) a dynamic microsimulation model that projects the distribution of retirement incomes, assets and Age Pension expenditures out to 2055. MARIA has enabled Treasury to analyse policy change over a much longer time horizon and was a finalist in the 2019 ACT Institute of Public Administration Australia Public Service Innovation Awards.
We are continuing to invest in our modelling capability and model development, including finalising the first phase of the new model of the Fiscal Impact of New Australians (FIONA). Once completed, this model will illustrate the costs and benefits to the Budget of the annual intake of new Australian permanent residents.
Treasury undertakes analysis of its revenue modelling and forecasting to ensure revenue estimates are presented within acceptable ranges and publishes the outcomes in estimate updates throughout the year.
The Government decided to defer the 2020-21 Budget from May to October 2020 in recognition that it was extremely difficult to formulate reliable economic and fiscal estimates, including revenue estimates, during COVID-19.
Performance criteria
Delivery of the legislative program
Management, development and delivery of the legislative program is in accordance with the relevant legislative requirements and guidance, including timeframes and meeting of quality standards.
Target • Legislative program is delivered within the required timeframe and the quality of legislation implemented meets a satisfactory standard, in line with government priorities.
Source PBS Program 1.1
Corporate Plan 2019-20
Results Criteria met.
In 2019-20, Treasury supported the Government through the delivery of its extensive legislative program, adapting quickly to a series of significant changes in previous priorities when responding to the Financial Services Royal Commission, the 2019-20 bushfires and the COVID-19 pandemic. Treasury coordinated and led the Government’s legislative responses to the COVID-19 pandemic from March to June 2020.
Treasury legislation and regulation was prepared in accordance with relevant requirements and guidance, including timeframes, and supported by legal advice.
In the 2019-20 financial year, 52 bills containing 113 measures were introduced into the Parliament and 37 regulations covering 37 measures were considered by the Federal Executive Council. An additional 122 non-tied legislative measures were registered on the Federal Register of Legislation. Treasury also dealt with 46 measures from other portfolios and provided 60 responses to requests from parliamentary committees concerning legislation.

32 The Treasury Annual Report 2019–20
Performance criteria
Policy advice
Treasury makes influential and positive policy contributions to revenue and taxation issues.
Target • Ministers and relevant stakeholders indicate a constructive and positive contribution to public policy outcomes, in line with government priorities.
• Policy advice considers the views of relevant stakeholders; including industry, regulators and other entities, as required.
Source PBS Program 1.1
Corporate Plan 2019-20
Results Criteria met.
In 2019-20, Treasury provided policy advice and analysis on taxation policy matters. Our feedback from ministers and our stakeholders supports our contribution. We responded to the COVID-19 pandemic by developing taxation measures to support the Government’s response to the pandemic and supporting the economy during the recovery. These measures included enhancing the Instant Asset Write-Off, the Backing Business Incentive and the Boosting Cash Flow for Employers measures.
We also supported the Government’s response to the 2019-20 bushfires by developing taxation administration measures to: • exempt bushfire disaster relief payments from taxation• list new bushfire-related entities as deductible gift recipients, including the Australian
Volunteers Support Trust and the Community Rebuilding Trust• help improve the accessibility of information on bushfire-related charities, assisting donors
to support affected communities.
Throughout 2019-20, Treasury continued to engage in public consultation on draft taxation legislation, including in relation to strengthening the integrity of hybrid mismatches and testamentary trusts, extending the definition of significant global entities and the Australia-Israel Tax Treaty.
In addition, Treasury has engaged in ongoing international discussions of importance to Australia, particularly the Organisation for Economic Co-operation and Development’s Inclusive Framework process in relation to the taxation of the digital economy, and engaged with domestic stakeholders through the Digital Tax Working Group.

33Part 2 Report on Performance
Financial performanceTreasury has a sound financial position, meeting its debt obligations as and when they fall due. Excluding depreciation, amortisation, changes in asset revaluation reserves and leasing adjustments, Treasury reported an operating surplus of $3.6 million in 2019-20, which was driven by underspends throughout the department due to COVID-19 restrictions and a diversion of resources for the Government’s COVID-19 response.
This compares with an operating deficit of $2.1 million in 2018-19 after adjusting for depreciation and amortisation and changes in asset revaluation reserves. Treasury’s administered expenses in 2019-20 were $139.2 billion compared with $140.3 billion in 2018-19.
Figure 3: Treasury portfolio outcome and program structure as at 30 June 2020
Portfolio Minister — Treasurer The Hon Josh Frydenberg MP
Minister for Population, Cities and Urban InfrastructureThe Hon Alan Tudge MP
Assistant Treasurer and Minister for HousingThe Hon Michael Sukkar MP
Assistant Minister for Superannuation, Financial Services and Financial TechnologySenator the Hon Jane Hume
Assistant Minister for Finance, Charities and Electoral Matters Senator the Hon Zed Seselja
Department of the TreasurySecretary, Dr Steven Kennedy
Outcome 1: Supporting and implementing informed decisions on policies for the good of the Australian people, including for achieving strong, sustainable economic growth, through the provision of advice to Treasury Ministers and the efficient administration of Treasury’s functions.
Program 1.1: Department of the Treasury
Program 1.2: Payments to International Financial Institutions
Program 1.3: Support for Markets and Business
Program 1.4: General Revenue Assistance
Program 1.5: Assistance to the States for Healthcare Services
Program 1.6: Assistance to the States for Skills and Workforce Development
Program 1.7: Assistance to the States for Disability Services
Program 1.8: Assistance to the States for Affordable Housing
Program 1.9: National Partnership Payments to the States
Australian Bureau of Statistics Australian Statistician, Dr David Gruen
Outcome 1: Decisions on important matters made by Governments, business and the broader community are informed by objective, relevant and trusted official statistics produced through the collection and integration of data, its analysis, and the provision of statistical information.
Program 1.1: Australian Bureau of Statistics

34 The Treasury Annual Report 2019–20
Australian Competition and Consumer Commission Chair, Mr Rod Sims
Outcome 1: Lawful competition, consumer protection, and regulated national infrastructure markets and services through regulation, including enforcement, education, price monitoring and determining the terms of access to infrastructure services.
Program 1.1: Australian Competition and Consumer Commission
Program 1.2: Australian Energy Regulator
Australian Office of Financial Management Chief Executive Officer, Mr Robert Nicholl
Outcome 1: The advancement of macroeconomic growth and stability, and the effective operation of financial markets, through issuing debt, investing in financial assets and managing debt, investments and cash for the Australian Government.
Program 1.1: Australian Office of Financial Management
Australian Prudential Regulation Authority Chair, Mr Wayne Byres
Outcome 1: Enhanced public confidence in Australia’s financial institutions through a framework of prudential regulation that balances financial safety and efficiency, competition, contestability and competitive neutrality and, in balancing these objectives, promotes financial system stability in Australia.
Program 1.1: Australian Prudential Regulation Authority
Australian Reinsurance Pool CorporationChief Executive Officer, Dr Christopher Wallace
Purpose: To protect Australia from economic losses caused by terrorism catastrophe.
Australian Securities and Investments Commission Chair, Mr James Shipton
Outcome 1: Improved confidence in Australia’s financial markets through promoting informed investors and financial consumers, facilitating fair and efficient markets and delivering efficient registry systems.
Program 1.1: Australian Securities and Investments Commission
Program 1.2: Banking Act 1959, Life Insurance Act 1995, unclaimed monies and special accounts

35Part 2 Report on Performance
Australian Taxation Office Commissioner, Mr Chris Jordan AO
Outcome 1: Confidence in the administration of aspects of Australia’s taxation and superannuation systems through helping people understand their rights and obligations, improving ease of compliance and access to benefits, and managing non-compliance with the law.
Program 1.1: Australian Taxation Office
Program 1.2: Tax Practitioners Board
Program 1.3: Australian Business Register
Program 1.4: Australian Charities and Not-for-profits Commission
Program 1.5: Australian Screen Production Incentive
Program 1.6: Junior Minerals Exploration Incentive
Program 1.7: Fuel Tax Credits Scheme
Program 1.8: National Rental Affordability Scheme
Program 1.9: Product Stewardship for Oil
Program 1.10: Research and Development Tax Incentive
Program 1.11: Low Income Superannuation Tax Offset
Program 1.12: Private Health Insurance Rebate
Program 1.13: Superannuation Co-contribution Scheme
Program 1.14: Superannuation Guarantee Scheme
Program 1.15: Targeted Assistance through the Taxation System
Program 1.16: Interest on Overpayment and Early Payments of Tax
Program 1.17: Bad and Doubtful Debts and Remissions
Program 1.18: Other Administered
Commonwealth Grants Commission Secretary, Mr Michael Willcock
Outcome 1: Informed Government decisions on fiscal equalisation between the States and Territories through advice and recommendations on the distribution of GST revenue
Program 1.1: Commonwealth Grants Commission
Financial Adviser Standards and Ethics Authority LimitedChief Executive Officer, Mr Stephen Glenfield
Outcome 1: Strengthen the professional and ethical standards of financial advisers through enhancing educational and training requirements and ethical standards to improve consumer outcomes.
Infrastructure and Project Financing AgencyChief Executive Officer, Ms Leilani Frew
Outcome 1: To leverage additional private sector investment in infrastructure and secure better returns from the Commonwealth’s investment by assisting the Government to identify, assess, and broker financing opportunities for infrastructure and projects, including through engagement with Commonwealth entities, State and Territory Governments, and the private sector.
Program 1.1: Infrastructure and Project Financing Agency

36 The Treasury Annual Report 2019–20
Inspector-General of Taxation Inspector-General, Ms Karen Payne
Outcome 1: Improved tax administration through investigation of complaints, conducting reviews, public reporting and independent advice to government and its relevant entities.
Program 1.1: Inspector-General of Taxation
National Competition Council President, Ms Julie-Anne Schafer
Outcome 1: Competition in markets that are dependent on access to nationally significant monopoly infrastructure, through recommendations and decisions promoting the efficient operation of, use of and investment in infrastructure.
Program 1.1: National Competition Council
National Housing Finance and Investment CorporationChair, Mr Brendan Crotty
Outcome 1: Improved housing outcomes for Australians, including through financial and other assistance to improve the efficiency and scale of the community housing sector, as well as for critical infrastructure that increases housing supply.
Office of the Auditing and Assurance Standards Board Chair, Dr Roger Simnett AO
Outcome 1: The formulation and making of auditing and assurance standards that are used by auditors of Australian entity financial reports or for other auditing and assurance engagements.
Program 1.1: Auditing and Assurance Standards Board
Office of the Australian Accounting Standards Board Chair, Dr Keith Kendall
Outcome 1: The formulation and making of external reporting standards that are used by Australian entities to prepare financial reports and enable users of these reports to make informed decisions.
Program 1.1: Australian Accounting Standards Board
Productivity Commission Chair, Mr Michael Brennan
Outcome 1: Well-informed policy decision-making and public understanding on matters relating to Australia’s productivity and living standards, based on independent and transparent analysis from a community-wide perspective.
Program 1.1: Productivity Commission
Reserve Bank of AustraliaGovernor, Mr Philip Lowe
Purpose: In its role as Australia’s central bank, the Reserve Bank of Australia determines and implements monetary policy, fosters financial stability, undertakes a range of activities in financial markets, acts as a banker to the Australian Government, issues Australia’s banknotes and has policy, supervisory and operational roles in the payments system.
Royal Australian Mint Chief Executive Officer, Mr Ross MacDiarmid
Outcome 1: The coinage needs of the Australian economy, collectors and foreign countries are met through the manufacture and sale of circulating coins, collector coins and other minted like products.
Program 1.1: Royal Australian Mint

37Part 2 Report on Performance
38 The Treasury Annual Report 2019–20
Corporate governance 39
Governance committees 39Risk management 45Fraud prevention and control 45Internal audit arrangements 45Ethical standards 46SES remuneration 46Significant non-compliance issues with relevant finance laws 46
External scrutiny 47
External audit 47
Management of human resources 48
Performance management 48Workplace relations 48Learning and development 48Staffing information 50
Asset management 59
Purchasing 60
Consultants 61
Executive remuneration 62
Introduction 62Remuneration policies and practices 62Key management personnel 63Senior executive remuneration 65Other highly paid staff 66
Part 3 – Management and accountability

39
Corporate governanceTreasury’s corporate governance structures are designed to promote the achievement of our purpose, the proper use and management of public resources, our systems of risk and control, and the department’s financial sustainability.
Governance committees
Executive BoardThe Executive Board comprises the Secretary and Deputy Secretaries. The Executive Board supports the Secretary to fulfil his obligations as the Accountable Authority under the Public Governance, Performance and Accountability Act 2013 and the Secretary remains the primary decision maker on all Executive Board considerations.
Health and Safety CommitteeThe Health and Safety Committee (HSC) assists the Secretary in carrying out his statutory obligations in accordance with the Work Health and Safety Act 2011. The HSC facilitates cooperation between Treasury management and employees to develop and review health and safety policies, procedures and initiatives, and manage health and safety risks in the workplace.
Workplace Relations Committee The Workplace Relations Committee (WRC) is Treasury’s primary staff consultation body, convened in accordance with the Treasury Enterprise Agreement 2018-2021. The WRC undertakes consultation with our officials on issues affecting their working environment and employment conditions.
Inclusive Workplace Committee The Inclusive Workplace Committee (IWC) is the key body for advancing inclusion and diversity in Treasury. The IWC supports the Executive Board to set and implement the department’s strategic direction for inclusion and diversity activities.
Information Strategy Committee The Information Strategy Committee provides an enterprise view on information management and supports the department’s digital capability in line with the objectives in our corporate plan and ICT strategy.
Audit CommitteeThe Audit Committee provides independent advice to the Secretary on Treasury’s governance, risk, control and performance arrangements; including the department’s financial and annual performance statements. The Audit Committee Charter is available on the Treasury website at www.treasury.gov.au. The Audit Committee comprises five members — an independent chair, two independent members and two internal members.
The Audit Committee met six times in 2019-20 and received regular briefings from Treasury’s management on our priorities, operations and risks, as well as the outcomes of risk and audit activities. A Financial Statements Sub-Committee supports the Audit Committee by providing advice on the preparation of Treasury’s financial statements.

40 The Treasury Annual Report 2019–20
The
tabl
e be
low
pro
vide
s det
ails
of t
he A
udit
Com
mitt
ee m
embe
rs, t
heir
qual
ifica
tions
, att
enda
nce
and
rem
uner
atio
n:
Nam
ePo
sitio
nQ
ualifi
catio
nsEx
peri
ence
Date
of
Com
men
cem
ent
Date
of C
essa
tion
Atte
ndan
ce
at A
udit
Com
mitt
ee
Mee
tings
Rem
uner
atio
n
Mr W
ill L
aurie
Exte
rnal
Cha
ir,
Audi
t Com
mitt
ee
Exte
rnal
Cha
ir,
Fina
ncia
l St
atem
ents
Su
b-Co
mm
ittee
Bach
elor
of
Econ
omic
s
Gra
duat
e D
iplo
ma
in A
pplie
d Fi
nanc
e an
d In
vest
men
t
Man
agin
g Pa
rtne
r, Pr
ice
Wat
erho
use
and
PWC,
Ca
nber
ra (3
0 ye
ars)
.
Chai
r of v
ario
us a
udit
and
risk
com
mitt
ees o
f the
Co
mm
onw
ealth
and
ACT
G
over
nmen
ts, i
nclu
ding
At
torn
ey-G
ener
al’s
, D
efen
ce, A
NAO
, ACT
Chi
ef
Min
iste
r’s a
nd T
reas
ury
(20
year
s).
Priv
ate
sect
or b
oard
ex
perie
nce
in o
nlin
e re
taili
ng, p
rope
rty,
pr
ofes
sion
al s
ervi
ces a
nd
not-f
or-p
rofit
edu
catio
n.
13 O
ctob
er 2
014
30 S
epte
mbe
r 201
93
/ 3$6
,468
.00
(in
cl. G
ST)
Mr R
ob N
icho
llEx
tern
al M
embe
rBa
chel
or o
f Ec
onom
ics
Mas
ter o
f Ec
onom
ics
Rese
arch
fello
w in
th
e D
epar
tmen
t of
Eco
nom
ics,
U
nive
rsity
of
Tasm
ania
CEO
, Aus
tral
ian
Offi
ce o
f Fin
anci
al
Man
agem
ent (
sinc
e Ja
nuar
y 20
11).
Seni
or e
xecu
tive
role
s in
pub
lic a
nd fi
nanc
ial
polic
y, a
nd c
omm
erci
al
and
regu
lato
ry
expe
rienc
e.
13 J
uly
2015
12 N
ovem
ber 2
019
3 / 3
*

41Part 3 Management and accountability
Nam
ePo
sitio
nQ
ualifi
catio
nsEx
peri
ence
Date
of
Com
men
cem
ent
Date
of C
essa
tion
Atte
ndan
ce
at A
udit
Com
mitt
ee
Mee
tings
Rem
uner
atio
n
Ms E
lizab
eth
Mon
tano
Exte
rnal
Mem
ber
Bach
elor
of A
rts /
Ba
chel
or o
f Law
s (U
NSW
)
Solic
itor a
dmitt
ed
NSW
and
Co
mm
onw
ealth
Fello
w o
f the
Au
stra
lian
Inst
itute
of
Com
pany
Di
rect
ors
Chai
r, D
eput
y Ch
air
and
mem
ber o
f boa
rds
and
audi
t com
mitt
ees
acro
ss a
rang
e of
G
over
nmen
t and
no
t for
pro
fit e
ntiti
es
(20
year
s).
Broa
d ra
ngin
g ex
perie
nce
in
gove
rnan
ce a
nd
the
mac
hine
ry o
f go
vern
men
t, in
clud
ing
in fi
nanc
ial a
nd
perf
orm
ance
repo
rtin
g,
risk,
ass
uran
ce, a
nd
prog
ram
and
pro
ject
m
anag
emen
t and
ov
ersi
ght.
Form
er C
EO in
the
Com
mon
wea
lth.
Seni
or fi
nanc
ial
serv
ices
law
yer,
King
& W
ood
Mal
leso
ns.
1 O
ctob
er 2
015
-6
/ 6$1
4,04
1.76
(in
cl. G
ST)

42 The Treasury Annual Report 2019–20
Nam
ePo
sitio
nQ
ualifi
catio
nsEx
peri
ence
Date
of
Com
men
cem
ent
Date
of C
essa
tion
Atte
ndan
ce
at A
udit
Com
mitt
ee
Mee
tings
Rem
uner
atio
n
Ms L
ynn
Kelly
Inte
rnal
Mem
ber
Bach
elor
of
Econ
omic
s
Mas
ter o
f In
tern
atio
nal T
ax
Char
tere
d Ac
coun
tant
, Ch
arte
red
Acco
unta
nts
Aust
ralia
/New
Ze
alan
d
Char
tere
d Ta
x Ad
vise
r, Ta
x In
stitu
te o
f Au
stra
lia
Stat
e Di
rect
or,
NSW
Tre
asur
y.
Inte
rim C
EO o
f the
Bo
ard
of T
axat
ion.
Expe
rienc
e in
ta
xatio
n, sp
anni
ng th
e pu
blic
sec
tor,
corp
orat
e an
d ad
viso
ry fi
rms
(25
year
s).
2 Ju
ly 2
019
-6
/ 6*
Ms V
icto
ria
Ande
rson
Inte
rnal
Mem
ber
Bach
elor
of A
rts /
Ba
chel
or o
f Law
s (H
ons)
Grad
uate
Dip
lom
a of
Leg
al P
ract
ice
Exec
utiv
e Di
rect
or,
Cent
re fo
r Pop
ulat
ion,
Tr
easu
ry.
Seni
or p
ositi
ons
in T
reas
ury
and
the
Dep
artm
ent o
f Ag
ricul
ture
, inc
ludi
ng
as C
hief
Ris
k O
ffice
r an
d he
ad o
f the
Co
rpor
ate
Gov
erna
nce
Bran
ch.
2 Ju
ly 2
019
-5
/ 6*

43Part 3 Management and accountability
Nam
ePo
sitio
nQ
ualifi
catio
nsEx
peri
ence
Date
of
Com
men
cem
ent
Date
of C
essa
tion
Atte
ndan
ce
at A
udit
Com
mitt
ee
Mee
tings
Rem
uner
atio
n
Mr D
on C
ross
Exte
rnal
Mem
ber
Num
erou
s qu
alifi
catio
ns
and
prof
essi
onal
m
embe
rshi
ps in
ac
coun
ting,
frau
d co
ntro
l, bu
sine
ss,
and
audi
ting.
Fello
w o
f the
In
stitu
te o
f Ch
arte
red
Acco
unta
nts
and
a Ce
rtifi
ed
Prac
tisin
g Ac
coun
tant
.
Chai
r or m
embe
r of
sev
eral
aud
it co
mm
ittee
s and
sub-
com
mitt
ees.
Seni
or P
artn
er a
t KPM
G an
d Le
ad P
artn
er fo
r KP
MG’
s key
str
ateg
ic
gove
rnm
ent a
ccou
nts.
Expe
rienc
e in
go
vern
men
t pro
gram
de
liver
y an
d re
form
, fin
anci
al s
tate
men
ts
audi
t and
inte
rnal
aud
it fo
r pol
icy,
regu
lato
ry
and
serv
ice
deliv
ery
agen
cies
.
1 Au
gust
201
9-
2 / 2
$8,0
20.7
9
(incl
. GST
)
Exte
rnal
Cha
ir,
Audi
t Com
mitt
ee
Exte
rnal
Cha
ir,
Fina
ncia
l St
atem
ents
Sub
-Co
mm
ittee
1 O
ctob
er 2
019
-3
/ 3$1
5,34
5.00
(in
cl. G
ST)

44 The Treasury Annual Report 2019–20
Nam
ePo
sitio
nQ
ualifi
catio
nsEx
peri
ence
Date
of
Com
men
cem
ent
Date
of C
essa
tion
Atte
ndan
ce
at A
udit
Com
mitt
ee
Mee
tings
Rem
uner
atio
n
Dr P
hilip
pa
Ryan
Exte
rnal
Mem
ber
PhD
(Law
)
Mas
ter o
f Ed
ucat
ion
Bach
elor
of L
aws
(Hon
s)
Bach
elor
of A
rts
Barr
iste
r, N
SW B
ar.
Seni
or L
ectu
rer i
n La
w,
Colle
ge o
f Law
, AN
U.
Non
-Exe
cutiv
e Di
rect
or,
WAM
Cap
ital a
nd
Land
er &
Rog
ers.
Mem
ber,
ISO
Tec
hnic
al
Com
mitt
ees a
nd
Stan
dard
s Aus
tral
ia
Bloc
kcha
in T
echn
ical
Co
mm
ittee
.
Expe
rienc
e in
fid
ucia
ry o
blig
atio
ns,
gove
rnan
ce, r
isk,
pr
ivac
y, te
chno
logy
an
d lit
igat
ion.
1 N
ovem
ber
2019
-3
/ 3$1
5,00
0.00
(e
xcl.
GST
)
* As e
mpl
oyee
s of t
he A
ustr
alia
n Pu
blic
Ser
vice
, rem
uner
atio
n w
as n
ot a
pplic
able
.

45Part 3 Management and accountability
Risk management Treasury has established frameworks, tools and plans to support risk management, including the development and delivery of annual communication and capability plans, targeting areas for improvement and identifying actions and measures against these areas.
During 2019-20, Treasury reviewed and updated our enterprise risks and tolerance statements. Treasury’s enterprise risks are framed around our purpose in designing and delivering advice that is underpinned by robust modelling, forecasting and engagement. They reflect the uncertainty associated with delivery of the Government’s economic agenda and legislative program, and in the activities to support the capability of Treasury’s people and systems, and embed a culture of accountability. The Chief Risk Officer (CRO), as part of Treasury’s leadership team, supports a strong risk culture where staff are encouraged to engage with risk and opportunity in developing and delivering on our purpose. The CRO is supported by a risk working group including representatives from key corporate and policy areas across the department. As at 30 June 2020, the CRO role was held by Ms Roxanne Kelley, Deputy Secretary, Corporate and Foreign Investment Group. Treasury is reviewing its risk management framework to ensure responsibility for managing risk is embedded across the department.
Fraud prevention and controlTreasury has a fraud and corruption control plan in place, as well as processes and systems for the prevention and detection of fraud and responding to and reporting incidents.
During 2019-20, Treasury reviewed the fraud control and corruption plan and fraud and corruption risk assessment. This included analysis of risks across key business processes and the delivery of policy advice and the Budget. Treasury is using the outcomes of this work to continue to enhance our fraud and corruption control and awareness activities, to ensure our systems, processes and assets are resilient and safe-guarded from misuse.
Treasury has actively considered integrity and fraud risks from the rapid implementation of the Government’s economic response to the COVID-19 pandemic, including whole-of-program risks for the Jobkeeper program.
Treasury reports fraud information data annually to the Treasurer and the Australian Institute of Criminology. Treasury’s 2019-20 fraud certification can be found in the Letter of Transmittal.
Internal audit arrangementsInternal audit provides independent advice and assurance to the Secretary on the effectiveness of the governance, risk, compliance and performance arrangements, and our financial and operational controls.
Internal audit prepares and delivers an annual internal audit plan. The plan is developed in consultation with the Executive Board and other key departmental stakeholders, so that it reflects our risk profile and assurance concerns. Delivery of the plan is viewed as an important mechanism to assist Treasury in the delivery of our purpose and priorities, and to support continuous improvement.
In 2019-20, our internal audit function delivered compliance, framework, performance and management initiated reviews with a focus on corporate performance reporting, governance arrangements, our management of service providers, sensitive information and data, and the design and implementation of controls for a new payments management system.
46 The Treasury Annual Report 2019–20
Ethical standardsAs the Government’s pre-eminent economic adviser, Treasury expects the highest standard of behaviour and ethical conduct from our staff. We have policies and procedures in place to ensure appropriate ethical standards, including the APS Code of Conduct and Values, are upheld in accordance with the Public Service Act 1999.
SES remunerationSES remuneration is determined under section 24(1) of the Public Service Act 1999. Further information is provided at Management of human resources in Part 3 — Management and accountability.
Significant non-compliance issues with relevant finance lawsThere were no significant instances of non-compliance with the finance law reported to the responsible minister in 2019-20.
47Part 3 Management and accountability
External scrutinyExternal auditThe Australian National Audit Office (ANAO) conducts financial statements and performance audits on Treasury. During 2019-20, the ANAO tabled one performance audit report involving Treasury:
Audit Report No. 8 – Management of the Tourist Refund Scheme (published 9 September 2019)
The ANAO’s report, including the department’s response, is available on the ANAO website.

48 The Treasury Annual Report 2019–20
Management of human resourcesThe People and Organisational Strategy Division, within Corporate and Foreign Investment Group, has primary responsibility for Treasury’s people framework, including strategic workforce planning, performance management, workplace relations, learning and development, inclusion and diversity, recruitment, and payroll services. Treasury’s approach to human resources is guided by the Treasury Workforce Plan.
Performance management Treasury is committed to the ongoing development of its employees and a high performance work culture through the Performance Development System (PDS). The objectives of the system include:
� continuously improving organisational performance to enable the department to achieve its strategic outcomes and priorities
� providing a framework to improve individual and organisational performance, as well as supporting development and career planning
� providing an approach to ensure regular real-time and meaningful feedback and recognise and reward sustained high performance
� providing mechanisms for managing declines in performance and underperformance.
APS staff levels 1-6 are formally assessed biannually with Executive Level (EL) and Senior Executive Service (SES) staff having one formal appraisal each year. The APS Integrated Leadership System provides the behavioural framework for assessing performance.
During 2019-20, Treasury staff faced significant workplace disruptions, including bushfires and the COVID-19 pandemic. These events saw a significant portion of our workforce pivot towards flexible work arrangements (including home-based work), be internally redeployed, or undertake new assignments to respond to changing focus and priorities. Our priority was to maintain Treasury’s capability in how it responded to these events, and continue to equip staff to be flexible, agile and resilient, while learning new ways of working.
Workplace relationsRemuneration and employment conditions for Treasury’s APS and Executive Level officers are determined under the Treasury Enterprise Agreement 2018–2021. The enterprise agreement operates in conjunction with Commonwealth legislation and is supported by internal policies and guidelines. The department occasionally uses individual flexibility arrangements to secure specific expertise or specialist skills critical to business needs.
Learning and developmentTreasury supports ongoing professional development, and continues to invest in its people to build skills, knowledge and capabilities to meet current and future workforce requirements and to deliver business priorities. A collaborative approach is taken across the department to deliver quality learning outcomes. It is focused on developing targeted and tailored learning and development programs; facilitating on-the-job learning, secondments and exchanges; and delivering flexible and e-learning solutions.

49Part 3 Management and accountability
In response to the COVID-19 pandemic, Treasury’s learning and development (L&D) program was redirected towards initiatives focused on building our resilience, agility and innovation capabilities. The use of technology was integrated into the delivery of our L&D programs to enable a flexible delivery of and engagement with our L&D offering.
In 2019-20, a total of 992 employees attended a variety of courses including:
� 217 employees participated in a range of diversity programs
� 55 employees participated in economics and policy programs
� 90 employees participated in management programs
� 111 employees participated in onboarding programs.
Treasury staff also completed 2,698 e-Learning programs, of which 1,973 were compliance, 382 were onboarding, 79 were performance development and 24 were diversity training programs.
Treasury continued to facilitate external learning opportunities for employees through which:
� two employees participated in the Institute of Public Administration Australia Future Leaders Program
� two employees are undertaking PhD study at the Australian National University through the Sir Roland Wilson Scholarship Program
� two employees undertook postgraduate level studies with the support of a postgraduate study award
� one employee participated in the Young Leaders Program offered by the Japanese Ministry of Education, Culture, Sports, Science and Technology and the National Graduate Institute for Policy Studies in Tokyo
� three employees took part in the Graduate Colloquium at the Cranlana Centre for Ethical Leadership
� seven employees participated in the Reserve Bank of Australia’s Springboard Women’s Development Program
� three employees participated in the Australian Taxation Office’s EL2 Talent Development Program
� EL1, EL2 and SES employees participated in the National Security College development programs.
Additionally, 39 employees were supported through our studies assistance program to undertake university qualifications and vocational training.
Entry level programsTreasury’s entry level programs remain key recruitment initiatives with 37 participants commencing in February 2020 across three programs. Two participants joined through the Career Starter Program (aimed at school leavers) and two participants joined through the Indigenous Australian Government Development Program, which aims to contribute to improving employment opportunities, experiences and outcomes for Indigenous Australians in the Australian Public Service. The remaining 33 participants joined Treasury’s Graduate Development Program – a two year program aimed at recent university graduates. Two participants were recruited through an Indigenous affirmative measures process, further contributing to our Indigenous employee representation. Our 2021 graduate recruitment campaign received 1,120 applications.

50 The Treasury Annual Report 2019–20
Staffing informationAt 30 June 2020, Treasury had 1,048 operative employees, an increase from 895 operative employees at 30 June 2019.1 The corresponding full-time equivalent figure was 1,019. An additional 106 inoperative employees are attached to Treasury.2
The average staffing level across 2019-20 was 926.2.
Treasury’s workforce is increasingly diverse. Half (50.1 per cent) of Treasury’s operative workforce are women, 77.5 per cent are under 45 years of age, 3.1 per cent identify as having disability and two per cent identify as Aboriginal and/or Torres Strait Islander.
At 30 June 2020, women comprised 43.6 per cent of the operative SES cohort, inclusive of higher duties arrangements. Treasury’s target for female representation in the SES is gender parity.
Treasury’s geographic footprint extends beyond Canberra, with offices established in Sydney, Melbourne, and Perth, and officers posted or deployed overseas.
Table 1: All Ongoing Employees Current Report Period (2019–20)
State
Male Female Indeterminate
TotalFull- time
Part- time
Total Male
Full- time
Part- time
Total Female
Full- time
Part- time
Total Indeterminate
NSW 24 2 26 22 3 25 - - - 51
QLD - - - - - - - - - -
SA - - - - - - - - - -
TAS - - - - - - - - - -
VIC 22 - 22 15 2 17 - - - 39
WA 2 - 2 - - - - - - 2
ACT 424 24 448 389 69 458 - - - 906
NT - - - - - - - - - -
External Territories
- - - - - - - - - -
Overseas 5 - 5 5 - 5 - - - 10
Total 477 26 503 431 74 505 - - - 1,008
1 Figures exclude the Secretary as they are not an employee under the Public Service Act 1999.2 An employee is deemed ‘inoperative’ if they are on long-term leave (paid or unpaid) or on temporary transfer or secondment to
another agency for a period of 12 weeks or more.

51Part 3 Management and accountability
Table 2: All Ongoing Employees Previous Report Period (2018–19)
State
Male Female Indeterminate
TotalFull- time
Part- time
Total Male
Full- time
Part- time
Total Female
Full- time
Part- time
Total Indeterminate
NSW 15 1 16 17 4 21 - - - 37
QLD - - - - - - - - - -
SA - - - - - - - - - -
TAS - - - - - - - - - -
VIC 10 - 10 6 2 8 - - - 18
WA 1 - 1 - - - - - - 1
ACT 371 27 398 316 80 396 - - - 794
NT - - - - - - - - - -
External Territories
- - - - - - - - - -
Overseas 4 - 4 4 - 4 - - - 8
Total 401 28 429 343 86 429 - - - 858
Table 3: All Non-ongoing Employees Current Report Period (2019–20)3
State
Male Female Indeterminate
TotalFull- time
Part- time
Total Male
Full- time
Part- time
Total Female
Full- time
Part- time
Total Indeterminate
NSW - - - 1 - 1 - - - 1
QLD - - - - - - - - - -
SA - - - - - - - - - -
TAS - - - - - - - - - -
VIC - 1 1 4 - 4 - - - 5
WA - - - - 2 2 - - - 2
ACT 13 6 19 7 6 13 - - - 32
NT - - - - - - - - - -
External Territories
- - - - - - - - - -
Overseas - - - - - - - - - -
Total 13 7 20 12 8 20 - - - 40
3 Non-ongoingdataincludestwocasualemployees.Thatis,at30June2020Treasuryhas38non-ongoing(specificterm)employees and two casual employees for a total of 40.

52 The Treasury Annual Report 2019–20
Table 4: All Non-ongoing Employees Previous Report Period (2018–19)4
State
Male Female Indeterminate
TotalFull- time
Part- time
Total Male
Full- time
Part- time
Total Female
Full- time
Part- time Total
NSW 1 - 1 1 - 1 - - - 2
QLD - - - - - - - - - -
SA - - - - - - - - - -
TAS - - - - - - - - - -
VIC - - - 2 1 3 - - - 3
WA 1 - 1 - 1 1 - - - 2
ACT 14 5 19 9 2 11 - - - 30
NT - - - - - - - - - -
External Territories
- - - - - - - - - -
Overseas - - - - - - - - - -
Total 16 5 21 12 4 16 - - - 37
Table 5: Australian Public Service Act Ongoing Employees Current Report Period (2019–20)
Classification
Male Female Indeterminate
TotalFull- time
Part- time
Total Male
Full- time
Part- time
Total Female
Full- time
Part- time Total
SES 3 1 - 1 4 - 4 - - - 5
SES 2 19 1 20 10 3 13 - - - 33
SES 1 35 1 36 25 2 27 - - - 63
EL 2 99 11 110 75 20 95 - - - 205
EL 1 141 9 - 117 18 135 - - - 285
APS 6 89 2 91 99 20 119 - - - 210
APS 5 36 1 37 64 6 70 - - - 107
APS 4 33 1 34 20 5 25 - - - 59
APS 3 23 - 23 16 - 16 - - - 39
APS 2 - - - - - - - - - -
APS 1 1 - 1 1 - 1 - - - 2
Other - - - - - - - - - -
Total 477 26 503 431 74 505 - - - 1,008
4 Non-ongoingdataincludestwocasualemployees.Thatis,at30June2019Treasuryhad35non-ongoing(specificterm)employees and two casual employees for a total of 37.

53Part 3 Management and accountability
Table 6: Australian Public Service Act Ongoing Employees Previous Report Period (2018–19)
Classification
Male Female Indeterminate
TotalFull- time
Part- time
Total Male
Full- time
Part- time
Total Female
Full- time
Part- time Total
SES 3 1 - 1 3 - 3 - - - 4
SES 2 14 2 16 7 2 9 - - - 25
SES 1 29 1 30 21 1 22 - - - 52
EL 2 79 13 92 62 26 88 - - - 180
EL 1 114 7 121 79 26 105 - - - 226
APS 6 65 4 69 91 18 109 - - - 178
APS 5 35 1 36 48 9 57 - - - 93
APS 4 30 - 30 23 3 26 - - - 56
APS 3 34 - 34 9 1 10 - - - 44
APS 2 - - - - - - - - - -
APS 1 - - - - - - - - - -
Other - - - - - - - - - -
Total 401 28 429 343 86 429 - - - 858
Table 7: Australian Public Service Act Non-ongoing Employees Current Report Period (2019–20)
Classification
Male Female Indeterminate
TotalFull- time
Part- time
Total Male
Full- time
Part- time
Total Female
Full- time
Part- time Total
SES 3 - - - - - - - - - -
SES 2 - - - - - - - - - -
SES 1 - - - - - - - - - -
EL 2 2 4 6 1 1 2 - - - 8
EL 1 5 2 7 3 2 5 - - - 12
APS 6 5 1 6 1 - 1 - - - 7
APS 5 - - - 4 2 6 - - - 6
APS 4 1 - 1 1 1 2 - - - 3
APS 3 - - - 1 - 1 - - - 1
APS 2 - - - 1 2 3 - - - 3
APS 1 - - - - - - - - - -
Other - - - - - - - - - -
Total 13 7 20 12 8 20 - - - 40

54 The Treasury Annual Report 2019–20
Table 8: Australian Public Service Act Non-ongoing Employees Previous Report Period (2018–19)
Classification
Male Female Indeterminate
TotalFull- time
Part- time
Total Male
Full- time
Part- time
Total Female
Full- time
Part- time Total
SES 3 1 - 1 - - - - - - 1
SES 2 1 - 1 - - - - - - 1
SES 1 1 1 2 - - - - - - 2
EL 2 4 1 5 1 1 2 - - - 7
EL 1 5 - 5 2 1 3 - - - 8
APS 6 - 1 1 2 - 2 - - - 3
APS 5 4 - 4 2 2 4 - - - 8
APS 4 - 1 1 4 - 4 - - - 5
APS 3 - - - 1 - 1 - - - 1
APS 2 - 1 1 - - - - - - 1
APS 1 - - - - - - - - - -
Other - - - - - - - - - -
Total 16 5 21 12 4 16 - - - 37
Table 9: Australian Public Service Act Employees by Full-time and Part-time Status Current Report Period (2019–20)
Classification
Ongoing Non-ongoing
TotalFull-time
Part-time
Total Ongoing
Full-time Part-time
Total Non-ongoing
SES 3 5 - 5 - - - 5
SES 2 29 4 33 - - - 33
SES 1 60 3 63 - - - 63
EL 2 174 31 205 3 5 8 213
EL 1 258 27 285 8 4 12 297
APS 6 188 22 210 6 1 7 217
APS 5 100 7 107 4 2 6 113
APS 4 53 6 59 2 1 3 62
APS 3 39 - 39 1 - 1 40
APS 2 - - - 1 2 3 3
APS 1 2 - 2 - - - 2
Other - - - - - - -
Total 908 100 1,008 25 15 40 1,048

55Part 3 Management and accountability
Table 10: Australian Public Service Act Employees by Full-time and Part-time Status Previous Report Period (2018–19)
Classification
Ongoing Non-ongoing
TotalFull-time
Part-time
Total Ongoing
Full-time Part-time
Total Non-ongoing
SES 3 4 - 4 1 - 1 5
SES 2 21 4 25 1 - 1 26
SES 1 50 2 52 1 1 2 54
EL 2 141 39 180 5 2 7 187
EL 1 193 33 226 7 1 8 234
APS 6 156 22 178 2 1 3 181
APS 5 83 10 93 6 2 8 101
APS 4 53 3 56 4 1 5 61
APS 3 43 1 44 1 - 1 45
APS 2 - - - - 1 1 1
APS 1 - - - - - - -
Other - - - - - - -
Total 744 114 858 28 9 37 895
Table 11: Australian Public Service Act Employment Type by Location Current Report Period (2019–20)
State Ongoing Non-ongoing Total
NSW 51 1 52
QLD - - -
SA - - -
TAS - - -
VIC 39 5 44
WA 2 2 4
ACT 906 32 938
NT - - -
External Territories - - -
Overseas 10 - 10
Total 1,008 40 1,048

56 The Treasury Annual Report 2019–20
Table 12: Australian Public Service Act Employment Type by Location Previous Report Period (2018–19)
State Ongoing Non-ongoing Total
NSW 37 2 39
QLD - - -
SA - - -
TAS - - -
VIC 18 3 21
WA 1 2 3
ACT 794 30 824
NT - - -
External Territories - - -
Overseas 8 - 8
Total 858 37 895
Table 13: Australian Public Service Act Indigenous Employment Current Report Period (2019–20)
Employment Type Total
Ongoing 21
Non-ongoing -
Total 21
Table 14: Australian Public Service Act Indigenous Employment Previous Report Period (2018–19)
Employment Type Total
Ongoing 12
Non-ongoing -
Total 12

57Part 3 Management and accountability
SES remunerationSES remuneration and employment conditions are determined under section 24(1) of the Public Service Act 1999. These are supported by a remuneration model that determines pay levels within each SES level based on performance. Treasury does not offer performance pay. An SES remuneration package is in recognition of all hours worked, including any reasonable additional hours. SES staff are not entitled to overtime payments, penalty rates or time off in lieu. SES staff received a two per cent salary increase on 12 December 2019.
Table 15: Australian Public Service Act Employment Salary Ranges by SES Classification Level (Minimum/Maximum) Current Report Period (2019–20)5
Classification Minimum salary Maximum salary
SES 3 $332,785 $389,742
SES 2 $256,792 $300,561
SES 1 $209,518 $243,507
5 SES salary ranges do not include the Secretary as the Secretary’s remuneration is determined by the Remuneration Tribunal.

58 The Treasury Annual Report 2019–20
Non-SES remunerationAPS and Executive Level remuneration and employment conditions are determined under the Treasury Enterprise Agreement 2018–2021. APS and Executive Level staff received a two per cent salary increase on 5 November 2019.
Table 16: Australian Public Service Act Employment Salary Ranges by Non-SES Classification Level (Minimum/Maximum) Current Report Period (2019–20)
Classification Minimum salary Maximum salary
EL 2 $140,342 $161,065
EL 1 $114,897 $131,799
APS 6 $88,084 $106,714
APS 5 $78,086 $83,086
APS 4 $69,453 $73,086
APS 3 $62,182 $65,814
APS 2 $54,913 $58,549
APS 1 $47,641 $51,734
Other $- $-
Employment arrangements
Table 17: Australian Public Service Act Employment Arrangements Current Report Period (2019–20)6
Instrument SES Non-SES Total
Enterprise Agreement - 955 955
Section 24(1) determination 81 - 81
Australian Workplace Agreement 12 - 12
Individual flexibility arrangement - - -
Total 93 955 1,048
6 Thesefiguresincludebothongoingandnon-ongoingemployeesbutdonotincludetheSecretary.

59Part 3 Management and accountability
Asset managementManagement of Treasury’s assets is governed by the Accountable Authority’s Instructions on asset management and aligns with government best practice. Treasury’s asset management framework includes an asset register, an asset management plan and a capital management plan. The asset register records details of all assets held by Treasury. An annual stocktake of assets keeps the register accurate and up-to-date. The department’s fixed assets include office fit-out, right-of-use assets, purchased and internally developed software, computer equipment, infrastructure and library materials.

60 The Treasury Annual Report 2019–20
PurchasingTreasury’s procurement activities were undertaken in accordance with the Public Governance, Performance and Accountability Act 2013, Commonwealth Procurement Rules, and the Commonwealth Government’s Indigenous Procurement Policy. Treasury applies these requirements through its internal financial and procurement policies.
Information on all Treasury contracts awarded with a value of $10,000 (incl. GST) or more, is available on AusTender at: www.tenders.gov.au.
No contracts of $100,000 or more (including GST) were entered into during 2019-20 that did not provide for the Auditor-General to have access to the contractor’s premises.
Treasury supports small business participation in the Commonwealth Government procurement market.
Participation statistics are available on the Department of Finance website at: www.finance.gov.au.
Treasury’s procurement practices support small and medium enterprises participating in procurement opportunities. This includes the mandatory use of the Commonwealth Contracting Suite for low risk procurements up to $200,000 (including GST) and the use of credit cards as a payment mechanism for low value procurements under $10,000 (including GST).
Treasury recognises the importance of ensuring small businesses are paid on time. The results of the survey of Australian Government Payments to Small Businesses are available on the Department of Jobs and Small Business website at: www.employment.gov.au.
Treasury fully supports the Indigenous Procurement Policy and the portfolio has met its purchasing target, set by the Government, to ensure Indigenous employment and business opportunities continue to grow.

61Part 3 Management and accountability
ConsultantsTreasury engages consultants where specialist skills are required and these are not available in-house. Consultancies normally relate to individuals, partnerships or corporations that provide professional, independent and expert advice and services.
The decision to engage a consultant is made in accordance with the Public Governance, Performance and Accountability Act 2013, Commonwealth Procurement Rules and Treasury’s internal policies.
During 2019-20, 45 new consultancy contracts were entered into involving total actual expenditure of $2,471,016 (including GST). In addition, 15 ongoing consultancy contracts were active during the period, involving total actual expenditure of $908,940 (including GST).
Annual reports contain information about actual expenditure on contracts for consultancies. Information on the value of individual contracts and consultancies is available on the AusTender website at www.tenders.gov.au.

62 The Treasury Annual Report 2019–20
Executive remunerationIntroductionThe categories of officials covered by the disclosures include:
� Key management personnel
� Senior executives remuneration
� Other highly paid staff
Remuneration policies and practicesThe Secretary to the Treasury’s remuneration is set by a Remuneration Tribunal Determination.
SES remuneration and employment conditions are determined under section 24(1) of the Public Service Act 1999. These are supported by a remuneration model that determines pay levels within each SES level based on performance. SES are subject to annual performance appraisals.
Remuneration and employment conditions for the Treasury’s non-SES officers are determined under the Treasury Enterprise Agreement 2018–2021. The enterprise agreement operates in conjunction with applicable Commonwealth legislation and the Treasury’s policies and guidelines to define the terms and conditions of employment for staff. The department occasionally uses individual flexibility arrangements to secure specific expertise or specialist skills critical to business needs, which are governed by the Treasury Enterprise Agreement 2018–2021.
In determining the appropriate conditions and rates for overseas posts, the Treasury may be guided by the conditions of service extended to the Department of Foreign Affairs and Trade.

63Part 3 Management and accountability
Key management personnelDuring the reporting period ended 30 June 2020, Treasury had 12 executives who met the definition of key management personnel (KMP). Their names and length of term as KMP are summarised below:
Name Position Term as KMP
Simon Atkinson Deputy Secretary Part year - ended 8 November 2019
Matthew Flavel Deputy Secretary Part year - ended 17 January 2020
Philip Gaetjens Secretary Part year - ended 1 September 2019
Roxanne Kelley PSM Deputy Secretary Part year - appointed 16 March 2020
Dr Steven Kennedy PSM Secretary Part year - appointed 2 September 2019
Maryanne Mrakovcic Deputy Secretary Full year
Meghan Quinn PSM Deputy Secretary Full year
Paul Verschuer Deputy Secretary Part year - ended 20 March 2020
Damien White Deputy Secretary Part year - 24 October 2019 to 18 February 2020
Jennifer Wilkinson Deputy Secretary Part year - appointed 28 January 2020
Vicki Wilkinson Deputy Secretary Part year - 22 July 2019 to 8 September 2019 and 11 November 2019 to 27 January 2020
Luke Yeaman Deputy Secretary Part year - appointed 18 May 2020
In the notes to the financial statements for the period ending 30 June 2020, Treasury disclosed the following KMP expenses:
Note 3.2
2020 $
2019 $
Short-term employee benefits 2,882,755 3,065,587
Post-employment benefits 404,108 443,682
Other long-term employee benefits 72,560 129,644
Termination benefits 224,133 -
Total key management personnel remuneration expenses 3,583,556 3,638,913

64 The Treasury Annual Report 2019–20
In a
ccor
danc
e w
ith th
e PG
PA R
ule,
this
info
rmat
ion
need
s to
be d
isag
greg
ated
in th
e an
nual
repo
rt a
s fol
low
s:
Nam
e1Po
sitio
n tit
le
Shor
t-ter
m b
enefi
ts
Post
-em
ploy
men
t be
nefit
sO
ther
long
-ter
m
bene
fits
Term
inat
ion
bene
fits $
Tota
l re
mun
erat
ion $
Base
sala
ry2 $
Bonu
ses $
Oth
er
bene
fits a
nd
allo
wan
ces $
Supe
rann
uatio
n co
ntri
butio
ns $
Long
se
rvic
e le
ave3 $
Oth
er
long
-ter
m
bene
fits $
Sim
on A
tkin
son
Dep
uty
Secr
etar
y 1
65,9
50
- -
25,
511
4,4
09
- -
195
,871
Mat
thew
Fla
vel
Dep
uty
Secr
etar
y 2
13,2
18
- -
33,
530
10,
833
- -
257
,580
Phili
p Ga
etje
nsSe
cret
ary
126
,598
-
- 1
5,60
1 2
0,76
4 -
- 1
62,9
64
Roxa
nne
Kelle
y PS
MD
eput
y Se
cret
ary
124
,002
-
- 2
1,27
6 3
,483
-
- 1
48,7
61
Dr S
teve
n Ke
nned
y PS
MSe
cret
ary
665
,785
-
- 8
3,46
2 1
9,26
6 -
- 7
68,5
13
Mar
yann
e M
rako
vcic
Dep
uty
Secr
etar
y 4
13,4
74
- 1
7,81
5 6
1,45
5 1
8,39
2 -
- 5
11,1
36
Meg
han
Qui
nn P
SMD
eput
y Se
cret
ary
403
,254
-
- 6
3,36
0 1
3,88
0 -
- 4
80,4
94
Paul
Ver
schu
erD
eput
y Se
cret
ary
291
,353
-
38,
097
37,
881
(25,
130)
- 2
24,1
33
566
,334
Dam
ien
Whi
teD
eput
y Se
cret
ary
100
,269
-
- 1
5,66
2 4
12
- -
116
,343
Jenn
ifer W
ilkin
son
Dep
uty
Secr
etar
y 1
77,7
69
- -
24,
668
5,0
84
- -
207
,521
Vick
i Wilk
inso
nD
eput
y Se
cret
ary
96,
365
- -
15,
975
367
-
- 1
12,7
07
Luke
Yea
man
Dep
uty
Secr
etar
y 4
8,80
6 -
- 5
,726
8
00
- -
55,
332
Tota
l 2
,826
,843
-
55,
912
404
,108
7
2,56
0 -
224
,133
3
,583
,556
Not
es
1. In
clud
es tw
o (2
) em
ploy
ees w
ho h
ave
acte
d in
a K
MP
posi
tion
in e
xces
s of t
hree
(3) m
onth
s dur
ing
the
perio
d.
2. In
clud
es th
e m
ovem
ent i
n an
nual
leav
e en
title
men
ts d
urin
g th
e pe
riod
and
may
incl
ude
high
er d
utie
s.
3. E
xclu
des b
ond
rate
impa
ct o
n lo
ng s
ervi
ce le
ave.

65Part 3 Management and accountability
Seni
or e
xecu
tive
rem
uner
atio
nD
urin
g th
e re
port
ing
perio
d en
ded
30 J
une
2020
, Tre
asur
y ha
d 12
3 se
nior
exe
cutiv
es.
The
follo
win
g ta
ble
prov
ides
the
aver
age
rem
uner
atio
n by
ban
d fo
r sen
ior
exec
utiv
es d
urin
g th
e re
port
ing
perio
d.
Rem
uner
atio
n Ba
nd
Num
ber
of S
enio
r Ex
ecut
ives
Shor
t-ter
m b
enefi
ts
Post
-em
ploy
men
t be
nefit
sO
ther
long
-ter
m b
enefi
ts
Aver
age
Term
inat
ion
bene
fits $
Aver
age
Tota
l re
mun
erat
ion5 $
Aver
age
Base
sa
lary
1 $
Aver
age
Bonu
ses $
Aver
age
Oth
er
bene
fits a
nd
allo
wan
ces2,
3 $
Aver
age
Supe
rann
uatio
n co
ntri
butio
ns $
Aver
age
Long
serv
ice
leav
e4 $
Aver
age
Oth
er lo
ng-
term
ben
efits
$
$0 -
$220
,000
42 6
5,51
4 -
497
1
0,52
0 1
,022
-
- 7
7,55
3
$220
,001
- $2
45,0
007
199
,398
-
(146
) 3
0,27
9 6
,630
-
- 2
36,1
60
$245
,001
- $2
70,0
0019
215
,382
-
716
3
1,86
0 1
0,52
6 -
- 2
58,4
83
$270
,001
- $2
95,0
0019
235
,332
-
5
34,
978
10,
885
- -
281
,200
$295
,001
- $3
20,0
0011
256
,891
-
- 3
8,17
7 1
0,63
5 -
- 3
05,7
03
$320
,001
- $3
45,0
0010
280
,786
-
1,2
76
41,
493
8,5
32
- -
332
,087
$345
,001
- $3
70,0
004
299
,775
-
- 4
3,57
1 1
2,54
1 -
- 3
55,8
87
$370
,001
- $3
95,0
002
301
,888
-
5,0
22
46,
627
20,
006
- -
373
,543
$395
,001
- $4
20,0
001
304
,778
-
- 8
8,32
3 1
1,46
7 -
- 4
04,5
68
$545
,001
- $5
70,0
001
234
,180
-
251
,055
3
8,86
2 3
6,98
8 -
- 5
61,0
84
$570
,001
- $5
95,0
002
240
,140
-
290
,163
3
9,52
9 7
,201
-
- 5
77,0
34
$595
,001
- $6
20,0
001
206
,871
-
376
,242
2
4,76
5 -
- -
607
,878
$620
,001
- $6
45,0
003
236
,113
-
349
,478
3
5,91
8 7
,288
-
- 6
28,7
98
$720
,001
- $7
45,0
001
213
,865
-
484
,496
3
0,06
1 -
- -
728
,423
Not
es1.
Incl
udes
the
mov
emen
t in
annu
al le
ave
entit
lem
ents
dur
ing
the
perio
d.2.
Incl
udes
, but
is n
ot li
mite
d to
, allo
wan
ces a
nd b
enefi
ts re
ceiv
ed w
hils
t on
over
seas
pos
t. 3.
Due
to a
cha
nge
mad
e to
RM
G 13
8: C
omm
onw
ealth
ent
ities
exe
cutiv
e re
mun
erat
ion
repo
rtin
g gu
ide
for a
nnua
l rep
orts
, Frin
ge B
enefi
ts T
ax o
n be
nefit
s tha
t do
not r
esul
t in
repo
rtab
le fr
inge
ben
efit a
mou
nts f
or e
mpl
oyee
s, in
clud
ing
hous
ing
bene
fits p
rovi
ded
to s
taff
on o
vers
eas p
osts
, is n
o lo
nger
incl
uded
in th
e ex
ecut
ive
rem
uner
atio
n ca
lcul
atio
n.
4. E
xclu
des b
ond
rate
impa
ct o
n lo
ng s
ervi
ce le
ave.
5. T
he ta
ble
incl
udes
the
part
yea
r im
pact
of s
enio
r exe
cutiv
es w
ho e
ither
com
men
ced
or s
epar
ated
dur
ing
the
year

66 The Treasury Annual Report 2019–20
Oth
er h
ighl
y pa
id st
affTh
e fo
llow
ing
tabl
e pr
ovid
es th
e av
erag
e re
mun
erat
ion
by b
and
for o
ther
hig
hly
paid
sta
ff du
ring
the
repo
rtin
g pe
riod.
Rem
uner
atio
n Ba
nd
Num
ber o
f ot
her h
ighl
y pa
id st
aff
Shor
t-ter
m b
enefi
ts
Post
-em
ploy
men
t be
nefit
sO
ther
long
-ter
m b
enefi
ts
Aver
age
Term
inat
ion
bene
fits $
Aver
age
Tota
l re
mun
erat
ion $
Aver
age
Base
Sal
ary1 $
Aver
age
Bonu
ses $
Aver
age
Oth
er
bene
fits a
nd
allo
wan
ces2,
3 $
Aver
age
Supe
rann
uatio
n co
ntri
butio
ns $
Aver
age
Long
serv
ice
leav
e4 $
Aver
age
Oth
er
long
-ter
m
bene
fits $
$445
,001
- $4
70,0
00 1
1
61,2
22
- 2
52,5
78
27,
402
5,5
97
- -
446
,800
$545
,001
- $5
70,0
00 1
1
67,8
64
- 3
48,3
20
23,
997
7,3
08
- -
547
,490
Not
es
1. In
clud
es th
e m
ovem
ent i
n an
nual
leav
e en
title
men
ts d
urin
g th
e pe
riod.
2. In
clud
es, b
ut is
not
lim
ited
to, a
llow
ance
s and
ben
efits
rece
ived
whi
lst o
n ov
erse
as p
ost.
3. D
ue to
a c
hang
e m
ade
to R
MG
138:
Com
mon
wea
lth e
ntiti
es e
xecu
tive
rem
uner
atio
n re
port
ing
guid
e fo
r ann
ual r
epor
ts, F
ringe
Ben
efits
Tax
on
bene
fits t
hat d
o no
t res
ult i
n re
port
able
frin
ge b
enefi
t am
ount
s for
em
ploy
ees,
incl
udin
g ho
usin
g be
nefit
s pro
vide
d to
sta
ff on
ove
rsea
s pos
ts, i
s no
long
er in
clud
ed in
the
exec
utiv
e re
mun
erat
ion
calc
ulat
ion.
4. E
xclu
des b
ond
rate
impa
ct o
n lo
ng s
ervi
ce le
ave.

67Part 3 Management and accountability
68 The Treasury Annual Report 2019–20
Independent Auditor’s Report 69
Statement by the Secretary and Chief Financial Officer 73
Statement of Comprehensive Income 74
Statement of Financial Position 75
Statement of Changes in Equity 76
Cash Flow Statement 77
Administered Schedule of Comprehensive Income 78
Administered Schedule of Assets and Liabilities 79
Administered Reconciliation Schedule 80
Administered Cash Flow Statement 81
Notes to and forming part of the financial statements 82
Part 4 – Financial statements

69
GPO Box 707 CANBERRA ACT 260138 Sydney Avenue FORREST ACT 2603Phone (02) 6203 7300 Fax (02) 6203 7777
INDEPENDENT AUDITOR’S REPORTTo the TreasurerOpinion
In my opinion, the financial statements of the Department of the Treasury (Treasury) for the year ended 30 June 2020:
(a) comply with Australian Accounting Standards – Reduced Disclosure Requirements and the Public Governance, Performance and Accountability (Financial Reporting) Rule 2015; and
(b) present fairly the financial position of Treasury as at 30 June 2020 and its financial performance and cash flows for the year then ended.
The financial statements of Treasury, which I have audited, comprise the following as at 30 June 2020 and for the year then ended:
• Statement by the Secretary and Chief Financial Officer; • Statement of Comprehensive Income; • Statement of Financial Position; • Statement of Changes in Equity; • Cash Flow Statement; • Administered Schedule of Comprehensive Income; • Administered Schedule of Assets and Liabilities; • Administered Reconciliation Schedule; • Administered Cash Flow Statement; and • Notes to the financial statements, comprising a summary of significant accounting policies and other
explanatory information.
Basis for opinion
I conducted my audit in accordance with the Australian National Audit Office Auditing Standards, which incorporate the Australian Auditing Standards. My responsibilities under those standards are further described in the Auditor’s Responsibilities for the Audit of the Financial Statements section of my report. I am independent of Treasury in accordance with the relevant ethical requirements for financial statement audits conducted by me. These include the relevant independence requirements of the Accounting Professional and Ethical Standards Board’s APES 110 Code of Ethics for Professional Accountants (including Independence Standards) (the Code) to the extent that they are not in conflict with the Auditor-General Act 1997. I have also fulfilled my other responsibilities in accordance with the Code. I believe that the audit evidence I have obtained is sufficient and appropriate to provide a basis for my opinion.
Key audit matters
Key audit matters are those matters that, in my professional judgement, were of most significance in my audit of the financial statements of the current period. These matters were addressed in the context of my audit of the financial statements as a whole, and in forming my opinion thereon, and I do not provide a separate opinion on these matters.

70 The Treasury Annual Report 2019–20
Key audit matterAccuracy and Occurrence of Grants Expense
Refer to Note 6.1C Special Appropriations
The Entity administers grant payments to State and Territory Governments under the Federal Financial Relations Act 2009 (the Act). The Treasurer signs a determination approving these grant payments.
Accuracy and occurrence of grants expense is a key audit matter due to:
• the significant value of the grants paid and the complex eligibility criteria set out in agreements for a number of the grant programs; and
• Treasury’s reliance on other Australian Government entities and State and Territory Governments to provide information to support payments and confirm the eligibility criteria have been met.
For the year ended 30 June 2020, the value of grants paid by Treasury under the Act was $93.0 billion.
How the audit addressed the matter
The audit procedures I applied to address the matter included:
• testing, on a sample basis, the design and operating effectiveness of controls within other Australian Government entities to support the information provided to Treasury that substantiates the eligibility and grant payment amount; and
• testing, on a sample basis, the accuracy and occurrence of payments processed by Treasury by testing the operating effectiveness of controls supporting the Treasurer’s determination and agreeing payments to supporting documentation.
Key audit matterCompleteness and Valuation of the Natural Disaster Relief and Recovery Arrangements (NDDRA) and the Disaster Relief Funding Arrangements (DRFA) Provision
Refer to Note 5.4A ‘Other Provisions’
Treasury manages payments to State and Territory Governments to assist with relief and recovery costs following a natural disaster.
The completeness and valuation of the provision is a key audit matter due to the complexities in the judgements involved in estimating the provision. Treasury relies upon estimated eligible reconstruction cost information provided by State and Territory Governments to estimate the future value and timing of payments under disaster arrangements. Also, due to the nature of disasters, there is uncertainty at the time of the disaster of the estimated costs to restore State and Territory infrastructure to its original condition. Treasury applies judgement to determine whether the cost estimates are sufficiently reliable to be included in the provision at the time of the preparation of the financial statements.
For the year ended 30 June 2020, the provision for costs associated with natural disaster arrangements was valued at $1.88 billion.
How the audit addressed the matterThe audit procedures I applied to address the matter included:
• examining the assessment of the eligibility of costs estimated under the arrangements. On a sample basis, I tested whether the estimate of eligibility costs had been calculated in accordance with the arrangements;
• testing, on a sample basis, information provided by State and Territory Governments supporting the movement in quarterly estimates data to assess whether Treasury’s reliance on the data is reasonable to estimate future cash flows;
• assessing the adequacy of the quality assurance processes over project level data from the State and Territory Governments that supports the provision estimate;
• assessing whether the provision calculation was consistent with the estimate of reconstruction costs provided by the State and Territory Governments;
• assessing the completeness of declared disasters and their inclusion in the provision; and
• assessing the adequacy of the reliability assessments performed by Treasury to support the accuracy of the provision.

71Part 4 Financial statements
Accountable Authority’s responsibility for the financial statements
As the Accountable Authority of Treasury, the Secretary is responsible under the Public Governance, Performance and Accountability Act 2013 (the Act) for the preparation and fair presentation of annual financial statements that comply with Australian Accounting Standards – Reduced Disclosure Requirements and the rules made under the Act. The Secretary is also responsible for such internal control as the Secretary determines is necessary to enable the preparation of financial statements that are free from material misstatement, whether due to fraud or error.
In preparing the financial statements, the Secretary is responsible for assessing the ability of Treasury to continue as a going concern, taking into account whether Treasury’s operations will cease as a result of an administrative restructure or for any other reason. The Secretary is also responsible for disclosing, as applicable, matters related to going concern and using the going concern basis of accounting unless the assessment indicates that it is not appropriate.
Auditor’s responsibilities for the audit of the financial statements My objective is to obtain reasonable assurance about whether the financial statements as a whole are free from material misstatement, whether due to fraud or error, and to issue an auditor’s report that includes my opinion. Reasonable assurance is a high level of assurance, but is not a guarantee that an audit conducted in accordance with the Australian National Audit Office Auditing Standards will always detect a material misstatement when it exists. Misstatements can arise from fraud or error and are considered material if, individually or in the aggregate, they could reasonably be expected to influence the economic decisions of users taken on the basis of the financial statements.
As part of an audit in accordance with the Australian National Audit Office Auditing Standards, I exercise professional judgement and maintain professional scepticism throughout the audit. I also:
• identify and assess the risks of material misstatement of the financial statements, whether due to fraud or error, design and perform audit procedures responsive to those risks, and obtain audit evidence that is sufficient and appropriate to provide a basis for my opinion. The risk of not detecting a material misstatement resulting from fraud is higher than for one resulting from error, as fraud may involve collusion, forgery, intentional omissions, misrepresentations, or the override of internal control;
• obtain an understanding of internal control relevant to the audit in order to design audit procedures that are appropriate in the circumstances, but not for the purpose of expressing an opinion on the effectiveness of Treasury’s internal control;
• evaluate the appropriateness of accounting policies used and the reasonableness of accounting estimates and related disclosures made by the Accountable Authority;
• conclude on the appropriateness of the Accountable Authority’s use of the going concern basis of accounting and, based on the audit evidence obtained, whether a material uncertainty exists related to events or conditions that may cast significant doubt on Treasury’s ability to continue as a going concern. If I conclude that a material uncertainty exists, I am required to draw attention in my auditor’s report to the related disclosures in the financial statements or, if such disclosures are inadequate, to modify my opinion. My conclusions are based on the audit evidence obtained up to the date of my auditor’s report. However, future events or conditions may cause Treasury to cease to continue as a going concern; and
• evaluate the overall presentation, structure and content of the financial statements, including the disclosures, and whether the financial statements represent the underlying transactions and events in a manner that achieves fair presentation.
I communicate with the Accountable Authority regarding, among other matters, the planned scope and timing of the audit and significant audit findings, including any significant deficiencies in internal control that I identify during my audit.

72 The Treasury Annual Report 2019–20
From the matters communicated with the Accountable Authority, I determine those matters that were of most significance in the audit of the financial statements of the current period and are therefore the key audit matters. I describe these matters in my auditor’s report unless law or regulation precludes public disclosure about the matter or when, in extremely rare circumstances, I determine that a matter should not be communicated in my report because the adverse consequences of doing so would reasonably be expected to outweigh the public interest benefits of such communication.
Australian National Audit Office
Grant Hehir Auditor-General
Canberra
10 September 2020

73Part 4 Financial statements
The TreasuryStatement by the Secretary and Chief Financial OfficerIn our opinion, the attached financial statements for the year ended 30 June 2020 comply with subsection 42(2) of the Public Governance, Performance and Accountability Act 2013 (PGPA Act), and are based on property maintained financial records as per subsection 41 (2) of the PGPA Act.
In our opinion, at the date of this statement, there are reasonable grounds to believe that the Treasury will be able to pay its debts as and when they fall due.
Dr Steven Kennedy PSM Secretary to the Treasury 10 September 2020
Robert Twomey Chief Financial Officer 10 September 2020

74 The Treasury Annual Report 2019–20
3
Statement of Comprehensive Income for the period ended 30 June 2020
2020 2019 Notes $'000 $'000 NET COST OF SERVICES Expenses
Employee benefits 1.1A 152,138 139,268 Suppliers 1.1B 57,411 54,766 Grants 1.1C 609 9,695 Finance costs 1.1D 1,664 86 Depreciation and amortisation 2.2A 17,188 7,767 Write-down and impairment of assets 2.2A 740 501 Act of grace payments 220 - Net foreign exchange losses 8 (4)
Total expenses 229,978 212,079 Own-source income Own-source revenue
Revenue from contracts with customers 1.2A 9,750 8,174 Other revenue 1.2B 6,016 4,631
Total own-source revenue 15,766 12,805 Gains
Gains 1.2C 96 30 Total gains 96 30 Total own-source income 15,862 12,835 Net cost of services (214,116) (199,244)
Revenue from Government 1.2D 206,298 189,355 Surplus/(Deficit) (7,818) (9,889) OTHER COMPREHENSIVE INCOME Items not subject to subsequent reclassification to net cost of services
Changes in asset revaluation surplus - - Total other comprehensive income - - Total Comprehensive income / (loss) (7,818) (9,889)
This statement should be read in conjunction with the accompanying notes.
Statement of Comprehensive Incomefor the period ended 30 June 2020

75Part 4 Financial statements
4
Statement of Financial Position as at 30 June 2020
2020 2019 Notes $'000 $'000 ASSETS Financial assets
Cash and cash equivalents 2.1A 651 2,772 Trade and other receivables 2.1B 80,052 62,442
Total financial assets 80,703 65,214 Non-financial assets1
Buildings 2.2A 137,650 16,713 Plant and equipment 2.2A 11,447 12,397 Intangibles 2.2A 13,163 9,072 Prepayments 5,264 5,832
Total non-financial assets 167,524 44,014 Total assets 248,227 109,228 LIABILITIES Payables
Suppliers 2.3A 10,775 8,498 Other payables 2.3B 2,920 3,511
Total payables 13,695 12,009 Interest bearing liabilities
Leases 2.4A 122,800 - Total interest bearing liabilities 122,800 - Provisions
Employee provisions 3.1A 63,174 53,475 Provision for restoration 2.5A 4,229 3,564
Total provisions 67,403 57,039 Total liabilities 203,898 69,048 Net assets 44,329 40,180 EQUITY
Asset revaluation reserve 12,676 12,676 Contributed equity 97,890 86,274 Retained earnings (66,237) (58,770)
Total equity 44,329 40,180
This statement should be read in conjunction with the accompanying notes.
1. Right-of-use assets are included in the following line items: Buildings and Plant and equipment.
Statement of Financial Positionas at 30 June 2020

76 The Treasury Annual Report 2019–20
5
Statement of Changes in Equity for the period ended 30 June 2020
2020 2019 $'000 $'000 CONTRIBUTED EQUITY Opening balance 86,274 77,142 Transactions with owners Contributions by owners
Equity injection appropriation 1,456 728 Departmental capital budget appropriation 10,160 8,404
Total transactions with owners 11,616 9,132 Closing balance as at 30 June 97,890 86,274 RETAINED EARNINGS Opening balance (58,770) (48,879)
Adjustment to opening balance 2 (2) Adjustment on initial application of AASB 15/AASB 1058 54 - Adjustment on initial application of AASB 16 295 -
Total opening balance (58,419) (48,881) Comprehensive income
Surplus/(Deficit) for the period (7,818) (9,889) Total comprehensive income (7,818) (9,889) Closing balance as at 30 June (66,237) (58,770) ASSET REVALUATION RESERVE Opening balance 12,676 12,676 Comprehensive income
Other comprehensive income - - Total comprehensive income - - Closing balance as at 30 June 12,676 12,676 TOTAL EQUITY Opening balance 40,180 40,939
Adjustment to opening balance 2 (2) Adjustment on initial application of AASB 15/AASB 1058 54 - Adjustment on initial application of AASB 16 295 -
Total opening balance 40,531 40,937 Comprehensive income
Surplus/(Deficit) for the period (7,818) (9,889) Total comprehensive income (7,818) (9,889) Transactions with owners Contributions by owners
Equity injection appropriation 1,456 728 Departmental capital budget appropriation 10,160 8,404
Total transactions with owners 11,616 9,132 Closing balance as at 30 June 44,329 40,180
This statement should be read in conjunction with the accompanying notes. Accounting Policy Equity injections Amounts appropriated which are designated as ‘equity injections’ for a year (less any formal reductions) and Departmental Capital Budgets (DCBs) are recognised directly in contributed equity in that year. Other distributions to owners The Financial Reporting Rule (FRR) requires that distributions to owners be debited to contributed equity unless it is in the nature of a dividend.
Statement of Changes in Equityfor the period ended 30 June 2020

77Part 4 Financial statements
6
Cash Flow Statement for the period ended 30 June 2020
2020 2019 $'000 $'000 OPERATING ACTIVITIES Cash received
Appropriations 214,885 215,227 Sale of goods and rendering of services 6,783 8,336 GST received 5,690 4,426 Other 2,227 1,134
Total cash received 229,585 229,123 Cash used
Employees 141,734 132,085 Suppliers 47,988 54,114 Interest payments on lease liabilities 1,579 - Grants 609 9,695 Section 74 receipts transferred to OPA 23,877 29,445 GST paid 5,659 3,911
Total cash used 221,446 229,250 Net cash from/(used by) operating activities 8,139 (127) INVESTING ACTIVITIES Cash used
Purchase of buildings 5,974 3,105 Purchase of plant and equipment 2,321 3,873 Purchase of intangibles 6,797 3,928
Total cash used 15,092 10,906 Net cash from/(used by) investing activities (15,092) (10,906) FINANCING ACTIVITIES Cash received
Contributed equity - departmental capital budget 10,160 8,404 Contributed equity - equity injections 1,942 4,761
Total cash received 12,102 13,165 Cash used
Principal payments of lease liabilities 7,270 - Total cash used 7,270 - Net cash from/(used by) financing activities 4,832 13,165 Net increase/(decrease) in cash held (2,121) 2,132 Cash at the beginning of the reporting period 2,772 640 Cash at the end of the reporting period 651 2,772
This statement should be read in conjunction with the accompanying notes.
Cash Flow Statementfor the period ended 30 June 2020

78 The Treasury Annual Report 2019–20
7
Administered Schedule of Comprehensive Income for the period ended 30 June 2020
2020 2019 Notes $'000 $'000 NET COST OF SERVICES Expenses
Grants 4.1A 100,458,412 103,945,261 Interest 37,577 64,000 Medicare Guarantee Fund 4.1B 37,961,055 36,233,451 Payments to corporate Commonwealth entities 4.1C 61,762 48,973 Foreign exchange losses 4.1D 548,488 20,752 Suppliers 4.1E 158,365 15,763
Total expenses 139,225,659 140,328,200 Income Revenue Non-taxation revenue
Revenue from contracts with customers 4.2A 649,062 605,211 Interest 4.2B 15,597 16,972 Dividends 4.2C 3,071,501 1,694,632 COAG revenue from government agencies 4.2D 1,592,278 2,259,418 Other revenue 4.2E 112,511 93,818
Total non-taxation revenue 5,440,949 4,670,051 Total revenue 5,440,949 4,670,051 Total income 5,440,949 4,670,051 Net (cost of)/contribution by services (133,784,710) (135,658,149) Surplus/(Deficit) (133,784,710) (135,658,149) OTHER COMPREHENSIVE INCOME Items subject to subsequent reclassification to net cost of services
Changes in asset revaluation surplus 1,297,692 3,411,602 Total comprehensive income/(loss) (132,487,018) (132,246,547)
The above schedule should be read in conjunction with the accompanying notes.
Administered Schedule of Comprehensive Incomefor the period ended 30 June 2020

79Part 4 Financial statements
8
Administered Schedule of Assets and Liabilities as at 30 June 2020
2020 2019 Notes $'000 $'000 ASSETS Financial assets
Cash and cash equivalents 5.1A 449,817 239,677 Loans and other receivables 5.1B 8,119,663 2,539,131 Investments 5.1C 46,312,169 43,954,514
Total assets administered on behalf of 54,881,649 46,733,322 Government
LIABILITIES Payables
Grants 5.2A 126,753 156,043 Other payables 5.2B 6,862,715 6,533,145 Unearned income 5.2C 3,658 6,169
Total payables 6,993,126 6,695,357 Interest bearing liabilities
Promissory notes 5.3A 10,051,022 9,988,269 Total interest bearing liabilities 10,051,022 9,988,269
Provisions
Provisions 5.4A 1,980,773 1,392,582 Total provisions 1,980,773 1,392,582 Total liabilities administered on behalf of
19,024,921 18,076,208 Government Net assets/(liabilities) 35,856,728 28,657,114
The above schedule should be read in conjunction with the accompanying notes.
Administered Schedule of Assets and Liabilitiesas at 30 June 2020
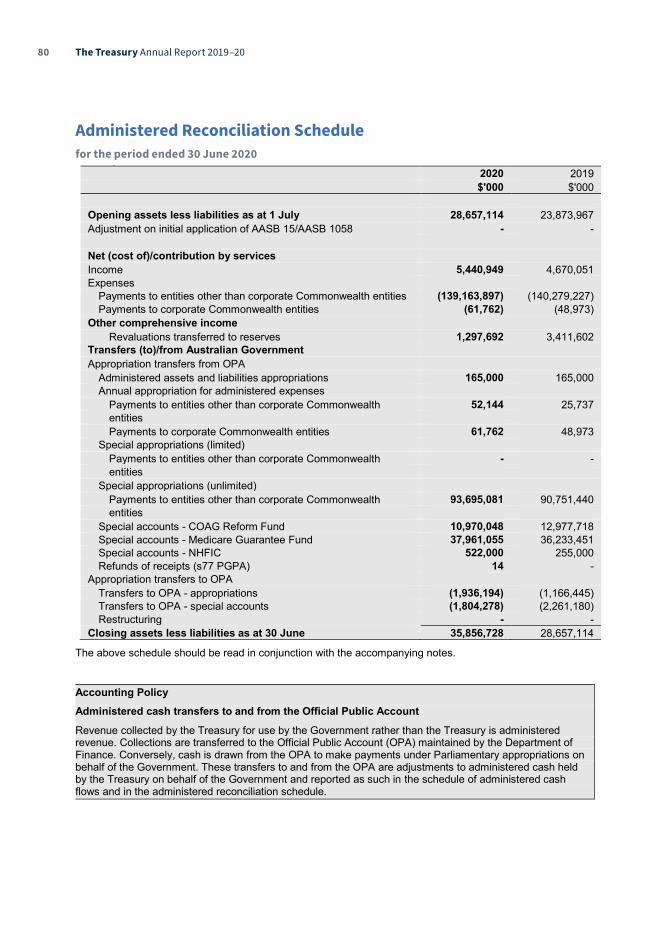
80 The Treasury Annual Report 2019–20
9
Administered Reconciliation Schedule for the period ended 30 June 2020
2020 2019 $'000 $'000 Opening assets less liabilities as at 1 July 28,657,114 23,873,967 Adjustment on initial application of AASB 15/AASB 1058 - - Net (cost of)/contribution by services Income 5,440,949 4,670,051 Expenses
Payments to entities other than corporate Commonwealth entities (139,163,897) (140,279,227) Payments to corporate Commonwealth entities (61,762) (48,973)
Other comprehensive income Revaluations transferred to reserves 1,297,692 3,411,602
Transfers (to)/from Australian Government Appropriation transfers from OPA
Administered assets and liabilities appropriations 165,000 165,000 Annual appropriation for administered expenses
Payments to entities other than corporate Commonwealth 52,144 25,737 entities Payments to corporate Commonwealth entities 61,762 48,973
Special appropriations (limited) Payments to entities other than corporate Commonwealth - - entities
Special appropriations (unlimited) Payments to entities other than corporate Commonwealth 93,695,081 90,751,440 entities
Special accounts - COAG Reform Fund 10,970,048 12,977,718 Special accounts - Medicare Guarantee Fund 37,961,055 36,233,451 Special accounts - NHFIC 522,000 255,000 Refunds of receipts (s77 PGPA) 14 -
Appropriation transfers to OPA Transfers to OPA - appropriations (1,936,194) (1,166,445) Transfers to OPA - special accounts (1,804,278) (2,261,180) Restructuring - -
Closing assets less liabilities as at 30 June 35,856,728 28,657,114
The above schedule should be read in conjunction with the accompanying notes.
Accounting Policy Administered cash transfers to and from the Official Public Account
Revenue collected by the Treasury for use by the Government rather than the Treasury is administered revenue. Collections are transferred to the Official Public Account (OPA) maintained by the Department of Finance. Conversely, cash is drawn from the OPA to make payments under Parliamentary appropriations on behalf of the Government. These transfers to and from the OPA are adjustments to administered cash held by the Treasury on behalf of the Government and reported as such in the schedule of administered cash flows and in the administered reconciliation schedule.
Administered Reconciliation Schedulefor the period ended 30 June 2020

81Part 4 Financial statements
10
Administered Cash Flow Statement for the period ended 30 June 2020
2020 2019 Notes $'000 $'000 OPERATING ACTIVITIES Cash received
Sale of goods and rendering of services 2,572 6,266 Interest 17,709 14,994 Dividends 1,694,718 898,553 Net GST received 1,556 640 HIH Group liquidation proceeds 19,196 - COAG receipts from government agencies 1,592,278 2,259,418 Other receipts from government agencies1 23,744,980 20,964,335 Other 93,313 93,823
Total cash received 27,166,322 24,238,029 Cash used
Grant payments 142,080,517 139,731,749 Other grants to the States and Territories1 23,744,980 20,964,335 Interest 48,178 61,824 Other 50,201 16,398
Total cash used 165,923,876 160,774,306 Net cash from/(used by) operating activities (138,757,554) (136,536,277) INVESTING ACTIVITIES Cash received
Repayment of IMF NAB loans 106,790 150,250 Repayment of NHFIC AHBA Loan 212,000 -
Total cash received 318,790 150,250 Cash used
Settlement of IMF Promissory notes 320,025 - Settlement of international financial institution's obligations 240,843 225,638 Purchase of administered investments 165,000 165,000 Settlement of loans to other government agencies 311,860 15,323
Total cash used 1,037,728 405,961 Net cash from/(used by) investing activities (718,938) (255,711) Net increase (decrease) in cash held (139,476,492) (136,791,988) Cash and cash equivalents at the beginning of the period 239,677 - Cash from Official Public Account
Appropriations 93,974,001 90,993,121 Special accounts 49,453,103 49,466,169
Total cash from Official Public Account 143,427,104 140,459,290 Cash to Official Public Account
Appropriations 1,936,194 1,166,445 Special accounts 1,804,278 2,261,180
Total cash to Official Public Account 3,740,472 3,427,625 Net cash from/(to) Official Public Account 139,926,309 137,031,665 Cash and cash equivalents at the end of the reporting period2 449,817 239,677
This schedule should be read in conjunction with the accompanying notes. 1. These balances reflect the payments that are facilitated by the Treasury to the States and Territories for education services and the Water for the Environment Special Account. Refer to Note 6.1D for more information. 2. The Cash and cash equivalents balance reflects the balance of the NHFIC Special Account held by the Treasury. Refer to Note 6.2 Special Accounts for more information.
Administered Cash Flow Statementfor the period ended 30 June 2020
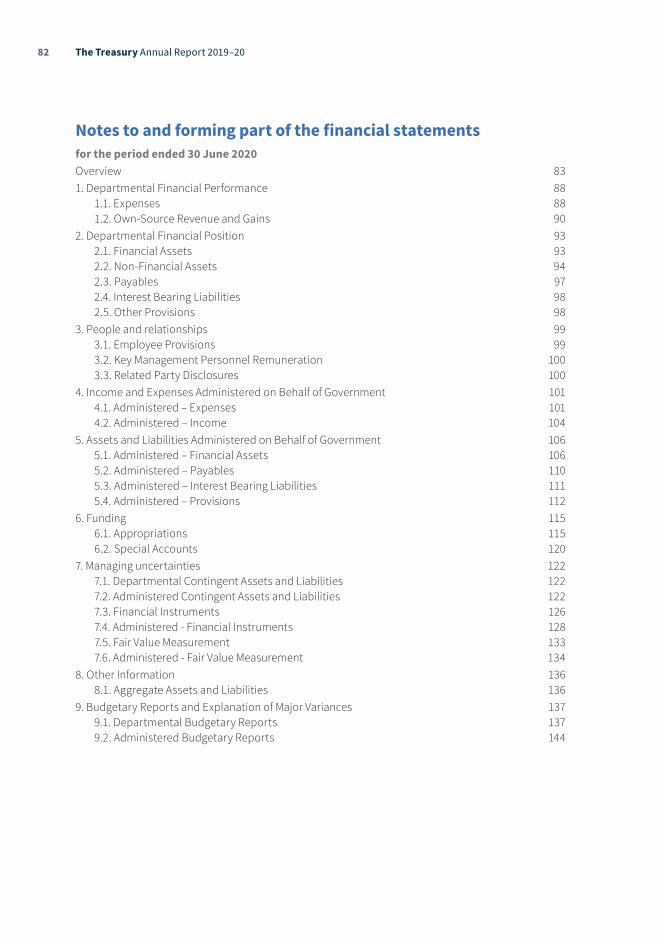
82 The Treasury Annual Report 2019–20
Notes to and forming part of the financial statementsfor the period ended 30 June 2020Overview 831. Departmental Financial Performance 88
1.1. Expenses 881.2. Own-Source Revenue and Gains 90
2. Departmental Financial Position 932.1. Financial Assets 932.2. Non-Financial Assets 942.3. Payables 972.4. Interest Bearing Liabilities 982.5. Other Provisions 98
3. People and relationships 993.1. Employee Provisions 993.2. Key Management Personnel Remuneration 1003.3. Related Party Disclosures 100
4. Income and Expenses Administered on Behalf of Government 1014.1. Administered – Expenses 1014.2. Administered – Income 104
5. Assets and Liabilities Administered on Behalf of Government 1065.1. Administered – Financial Assets 1065.2. Administered – Payables 1105.3. Administered – Interest Bearing Liabilities 1115.4. Administered – Provisions 112
6. Funding 1156.1. Appropriations 1156.2. Special Accounts 120
7. Managing uncertainties 1227.1. Departmental Contingent Assets and Liabilities 1227.2. Administered Contingent Assets and Liabilities 1227.3. Financial Instruments 1267.4. Administered - Financial Instruments 1287.5. Fair Value Measurement 1337.6. Administered - Fair Value Measurement 134
8. Other Information 1368.1. Aggregate Assets and Liabilities 136
9. Budgetary Reports and Explanation of Major Variances 1379.1. Departmental Budgetary Reports 1379.2. Administered Budgetary Reports 144

83Part 4 Financial statements
Overview
Objectives of the Department of the TreasuryThe Department of the Treasury is an Australian Government controlled entity. It is a not-for-profit entity. The objective of The Department of the Treasury, known as ‘the Treasury’ is to support and implement informed decisions on policies for the good of the Australian people, including for achieving strong, sustainable economic growth, through the provision of advice to Treasury Ministers and the efficient administration of the Treasury’s functions.
The Basis of PreparationThe financial statements are general purpose financial statements and are required by section 42 of the Public Governance, Performance and Accountability Act 2013.
The financial statements have been prepared in accordance with:
� Public Governance, Performance and Accountability (Financial Reporting) Rule 2015; and
� Australian Accounting Standards and interpretations – Reduced Disclosure Requirements issued by the Australian Accounting Standards Board (AASB) that apply for the reporting period.
The Treasury has applied the Reduced Disclosure Requirements issued by the AASB with the exception of disclosures for administered activities prepared under the following accounting standards, as required under Subsection 18(3) of the Public Governance, Performance and Accountability (Financial Reporting) Rule 2015:
� AASB 7 Financial Instruments: Disclosure;
� AASB 12 Disclosure of Interests in Other Entities; and
� AASB 13 Fair Value Measurement.
The financial statements have been prepared on an accrual basis and in accordance with the historical cost convention, except for certain assets at fair value. Except where stated, no allowance is made for the effect of changing prices on the results or the financial position. The financial statements are presented in Australian dollars. The financial statements are rounded to the nearest thousand.
Reporting of Administered ActivitiesAdministered revenues, expenses, assets, liabilities and cash flows are disclosed in the administered schedules and related notes.
Except where otherwise stated, administered items are accounted for on the same basis and using the same policies as for departmental items, including the application of Australian Accounting Standards.
Appropriations of administered capital are recognised in administered equity when the amounts appropriated by Parliament are drawn down. For the purposes of the Treasury annual report, administered equity transactions are not disclosed separately.
New Accounting StandardsNo accounting standard has been adopted earlier than the application date as stated in the standard.
The following new standards were issued prior to the signing of the statement by the Departmental Secretary and Chief Financial Officer, were applicable to the current reporting period and had a material effect on the Treasury’s financial statements:

84 The Treasury Annual Report 2019–20
13
Standard/Interpretation Nature of change in accounting policy, transitional provisions, and adjustment to financial statements
AASB 15 Revenue from Contracts with Customers / AASB 2016-8 Amendments to Australian Accounting Standards – Australian Implementation Guidance for Not-for-Profit Entities and AASB 1058 Income of Not-For-Profit Entities
AASB 15, AASB 2016-8 and AASB 1058 became effective 1 July 2019.
AASB 15 establishes a comprehensive framework for determining whether, how much and when revenue is recognised. It replaces existing revenue recognition guidance, including AASB 118 Revenue, AASB 111 Construction Contracts and Interpretation 13 Customer Loyalty Programmes. The core principle of AASB 15 is that an entity recognises revenue to depict the transfer of promised goods or services to customers in an amount that reflects the consideration to which the entity expects to be entitled in exchange for those goods or services.
AASB 1058 is relevant in circumstances where AASB 15 does not apply. AASB 1058 replaces most of the not-for-profit (NFP) provisions of AASB 1004 Contributions and applies to transactions where the consideration to acquire an asset is significantly less than fair value principally to enable the entity to further its objectives, and where volunteer services are received.
The details of the changes in accounting policies, transitional provisions and adjustments are disclosed below and in the relevant notes to the financial statements.
AASB 16 Leases AASB 16 became effective on 1 July 2019.
This new standard has replaced AASB 117 Leases, Interpretation 4 Determining whether an Arrangement contains a Lease,
Interpretation 115 Operating Leases—Incentives and Interpretation 127 Evaluating the Substance of Transactions Involving the Legal Form of a Lease.
AASB 16 provides a single lessee accounting model, requiring the recognition of assets and liabilities for all leases, together with options to exclude leases where the lease term is 12 months or less, or where the underlying asset is of low value. AASB 16 substantially carries forward the lessor accounting in AASB 117, with the distinction between operating leases and finance leases being retained. The details of the changes in accounting policies, transitional provisions and adjustments are disclosed below and in the relevant notes to the financial statements.
Application of AASB 15 Revenue from Contracts with Customers / AASB 1058 Income of Not-For-Profit Entities
The Treasury adopted AASB 15 and AASB 1058 using the modified retrospective approach, under which the cumulative effect of initial application is recognised in retained earnings at 1 July 2019. Accordingly, the comparative information presented for 2020 is not restated, that is, it is presented as previously reported under the various applicable AASBs and related interpretations.
Under the new income recognition model the Treasury shall first determine whether an enforceable agreement exists and whether the promises to transfer goods or services to the customer are ‘sufficiently specific’. If an enforceable agreement exists and the promises are ‘sufficiently specific’ (to a transaction or part of a transaction), the Treasury applies the general AASB 15 principles to determine the appropriate revenue recognition. If these criteria are not met, the Treasury shall consider whether AASB 1058 applies.
In relation to AASB 15, the Treasury elected to apply the new standard to all new and uncompleted contracts from the date of initial application. The Treasury is required to aggregate the effect of all of the contract modifications that occur before the date of initial application.

85Part 4 Financial statements
14
Impact on Transition of AASB 15/1058 1 July 2019 The impact on transition is summarised below: $'000 Departmental Assets Goods and services receivables 558 Total assets 558 Liabilities Unearned Income (612) Total liabilities (612) Total adjustment recognised in retained earnings (54)
Application of AASB 16 Leases
The Treasury adopted AASB 16 using the modified retrospective approach, under which the cumulative effect of initial application is recognised in retained earnings at 1 July 2019. Accordingly, the comparative information presented for 2020 is not restated, that is, it is presented as previously reported under AASB 117 and related interpretations.
The Treasury elected to apply the practical expedient to not reassess whether a contract is, or contains a lease at the date of initial application. Contracts entered into before the transition date that were not identified as leases under AASB 117 were not reassessed. The definition of a lease under AASB 16 was applied only to contracts entered into or changed on or after 1 July 2019.
AASB 16 provides for certain optional practical expedients, including those related to the initial adoption of the standard. The Treasury applied the following practical expedients when applying AASB 16 to leases previously classified as operating leases under AASB 117:
exclude initial direct costs from the measurement of right-of-use assets at the date of initial application for leases where the right-of-use asset was determined as if AASB 16 had been applied since the commencement date;
reliance on previous assessments on whether leases are onerous as opposed to preparing an impairment review under AASB 136 Impairment of assets as at the date of initial application; and
applied the exemption not to recognise right-of-use assets and liabilities for leases with less than 12 months of lease term remaining as of the date of initial application.
As a lessee, the Treasury previously classified leases as operating or finance leases based on its assessment of whether the lease transferred substantially all of the risks and rewards of ownership. Under AASB 16, the Treasury recognises right-of-use assets and lease liabilities for most leases. However, the Treasury has elected not to recognise right-of-use assets and lease liabilities for some leases of low value assets based on the value of the underlying asset when new or for short-term leases with a lease term of 12 months or less.
On adoption of AASB 16, the Treasury recognised right-of-use assets and lease liabilities in relation to leases of office space and motor vehicles, which had previously been classified as operating leases.
The lease liabilities were measured at the present value of the remaining lease payments, discounted using the Treasury’s incremental borrowing rate as at 1 July 2019. The Treasury’s incremental borrowing rate is the rate at which a similar borrowing could be obtained from an independent creditor under comparable terms and conditions. The weighted-average rate applied was 1.35%.

86 The Treasury Annual Report 2019–20
15
The right-of-use assets were measured as follows:
a) Office space: measured at an amount equal to the lease liability, adjusted by the amount of any prepaid or accrued lease payments.
b) All other leases: the carrying value that would have resulted from AASB 16 being applied from the commencement date of the leases, subject to the practical expedients noted above.
Impact on Transition of AASB 16 On transition to AASB 16, the Treasury recognised additional right-of-use assets and additional lease liabilities, recognising the difference in retained earnings. The impact on transition is summarised below: 1 July 2019 Departmental $'000 Right-of-use assets - property, plant and equipment 98,979 Lease liabilities (98,021) Prepayments (958) Lease liabilities (straight lining) 295 Retained earnings (295) The following table reconciles the Departmental minimum lease commitments disclosed in the Treasury's 30 June 2019 annual financial statements to the amount of lease liabilities recognised on 1 July 2019: 1 July 2019 $'000 Minimum operating lease commitment at 30 June 2019 44,598 Less: removal of GST component on adoption (3,806) Less: short-term leases not recognised under AASB 16 (1,511) Plus: effect of extension options reasonable certain to be exercised 70,189 Undiscounted lease payments 109,470 Less: effect of discounting using the incremental borrowing rate as at the date of initial application (11,449) Lease liabilities recognised at 1 July 2019 98,021
Taxation The Treasury is exempt from all forms of taxation except Fringe Benefits Tax (FBT) and the Goods and Services Tax (GST).
Foreign currency Transactions denominated in a foreign currency are converted at the exchange rate at the date of the transaction. Foreign currency receivables and payables are translated at the exchange rates current as at balance date.
Compliance with Statutory Conditions for Payments from the Consolidated Revenue Fund During 2019-20 the Treasury reviewed its exposure to the risk of not complying with statutory conditions on payments from appropriations, namely section 83 of the Constitution. To minimise potential breaches, the Treasury continues its established verification procedures, in consultation with the Portfolio Departments, particularly in relation to payments under the Federal Financial Relations Act 2009 and COAG Reform Fund Act 2008. An assessment framework determines the risk profile of each National Partnership Agreement (NPA) which forms the basis of what additional assurance may be required when making a payment. This review identified that no payments were made in contravention of section 83 of the Constitution (2019: Nil).
The Treasury will continue to monitor its level of compliance with section 83 of the Constitution across all legislation for which it is administratively responsible.

87Part 4 Financial statements
16
Glossary of abbreviations The following abbreviations are standardised throughout the financial statements:
• ATO - Australian Taxation Office • COAG - Council of Australian Governments • NHFIC - National Housing Finance and Investment Corporation • DRFA - Disaster Recovery Funding Arrangements (applicable to events after 1 November 2018) • NDRRA - Natural Disaster Relief and Recovery Arrangements (applicable to events prior to 1
November 2018) • SDR - Special Drawing Rights
Events After the Reporting Period
Departmental There are no known events occurring after the reporting period that could impact on the financial statements.
Administered Impact of Novel Coronavirus (COVID-19) Outbreak On 10 March 2020, the World Health Organisation declared the COVID-19 outbreak a global pandemic. COVID-19 has severely impacted many economies around the world, including Australia’s. The Treasury, having administrative policy control over certain aspects of the Australian Government’s economic response to COVID-19, has recorded its COVID-19 measures in accordance with applicable accounting standards and has prepared the financial statements for the reporting period with the most up to date information available at the time of signing the statements. The impact of COVID-19 has been particularly evident in relation to developing nations. These nations have approached the International Monetary Fund (IMF) and development banks for financial assistance. The Treasury is currently negotiating with the IMF, development banks and other developed nations to determine what assistance can be provided to the developing nations at this time. The outcome of these negotiations is currently uncertain. If the Treasury is called on to make additional investments, these may have a material impact on the administered financial statements of the Treasury in future.

88 The Treasury Annual Report 2019–20
17
1. Departmental Financial Performance This section analyses the financial performance of the Treasury for the year ended 2020. 1.1. Expenses
2020 2019 $'000 $'000 Note 1.1A: Employee benefits
Wages and salaries 112,640 98,450 Superannuation
Defined contribution plans 11,448 9,148 Defined benefit plans 8,069 9,217
Redundancies 533 497 Leave and other entitlements 16,469 18,573 Other 2,979 3,383
Total employee benefits 152,138 139,268 Accounting Policy Accounting policies for employee related expenses are contained in Note 3: People and Relationships.
Note 1.1B: Suppliers Goods and services supplied or rendered
Consultants, secondees and contractors 19,064 14,445 Information communication technology 14,937 10,112 Property operating expenses 6,430 5,930 Travel 4,378 4,878 Legal 3,642 2,718 Publications and subscriptions 2,152 1,886 Fees - audit, accounting, bank and other 1,480 1,490 Conferences and training 1,413 1,602 Insurance 339 359 Printing 156 453 Other 1,727 1,423
Total goods and services supplied or rendered 55,718 45,296 Goods supplied 7,557 4,488 Rendering of services 48,161 40,808 Total goods and services supplied or rendered 55,718 45,296 Other suppliers Workers compensation premiums 826 871 Operating lease rentals1 - 8,599 Short-term leases 840 - Low value leases 27 - Total other suppliers 1,693 9,470 Total suppliers 57,411 54,766
1. The Treasury has applied AASB 16 using the modified retrospective approach and therefore the comparative information has not been restated and continues to be reported under AASB 117. The Treasury has no short-term lease commitments as at 30 June 2020. The above lease disclosures should be read in conjunction with the accompanying notes 1.1D Finance costs, 2.2 Non-financial assets and 2.4A Leases.

89Part 4 Financial statements
18
Accounting Policy Short-term leases and leases of low-value assets The Treasury has elected not to recognise right-of-use assets and lease liabilities for short-term leases of assets that have a lease term of 12 months or less and leases of low-value assets (less than $10,000). The Treasury recognises the lease payments associated with these leases as an expense on a straight-line basis over the lease term.
2020 2019 $'000 $'000 Note 1.1C: Grants Public sector:
Australian Government Entities (related entities) - 4,741 Private sector:
Non-profit organisations 609 4,954 Total grants 609 9,695
Note 1.1D: Finance costs
Interest on lease liabilities1 1,579 - Unwinding of discount 85 86
Total finance costs 1,664 86 1. The Treasury has applied AASB 16 using the modified retrospective approach and therefore the comparative information has not been restated and continues to be reported under AASB 117. The above lease disclosures should be read in conjunction with the accompanying notes 1.1B Suppliers, 2.2 Non-financial assets and 2.4A Leases. Accounting Policy All borrowing costs are expensed as incurred.

90 The Treasury Annual Report 2019–20
19
1.2. Own-Source Revenue and Gains
2020 2019 Own-Source Revenue $'000 $'000 Note 1.2A: Revenue from contracts with customers
Rendering of services 9,750 8,174 Total revenue from contracts with customers 9,750 8,174
Disaggregation of revenue from contracts with customers Major product / service line:
Actuarial services 3,383 2,040 Shared services 3,161 3,325 Cost recoveries 1,597 1,493 Research services 915 443 Legislative and Governance Forum on Consumer Affairs
contributions 374 516
Income from subleasing 279 320 Other 41 37
9,750 8,174 Type of customer:
Australian Government entities (related parties) 9,220 7,563 State and Territory Governments 374 516 Non-government entities 156 95
9,750 8,174 Accounting Policy Revenue from contracts with customers is recognised when control of the goods or services are transferred to the customer at an amount that reflects the consideration to which the Treasury expects to be entitled in exchange for those goods or services. The Treasury has concluded that it is the principal in all of its revenue arrangements because it controls the goods or services before transferring them to the customer. Actuarial Services This revenue stream relates to services performed by the Australian Government Actuary division to other Commonwealth entities. The Treasury recognises revenue upon the completion of the services (that is, at a point in time) as defined by the underlying contract as this is when the customer obtains the ability to direct the use of, and obtain substantially all of the benefits from the services (typically a report or other deliverable). Invoicing occurs in line with the underlying agreement and can be in advance or in arrears. Shared Services This revenue stream relates to the Treasury providing finance, payroll and IT function services to other Commonwealth entities. The Treasury recognises revenue on the basis of expenses incurred to complete the service (that is, over time) because the customer simultaneously receives and consumes the benefits provided to them. The Treasury uses the input method in measuring progress of the services because there is a direct relationship between the Treasury’s effort (that is, expenditure incurred) and the transfer of the service to the customer. Invoicing occurs in line with the underlying agreement and can be in advance or in arrears.

91Part 4 Financial statements
20
Cost Recoveries This revenue stream relates to cost recovery contributions received from Commonwealth and State government entities as well as other entities to support the Treasury’s facilitation of various grant programs, forums and/or councils. These arrangements are underpinned by enforceable agreements that are sufficiently specific to allow the Treasury to determine when the obligations are satisfied in return for consideration. The Treasury recognises revenue on the basis of expenses incurred to complete the service (that is, over time) because the customer simultaneously receives and consumes the benefits provided to them. The Treasury uses the input method in measuring progress of the services because there is a direct relationship between the Treasury’s effort (that is, expenditure incurred) and the transfer of the service to the customer. Invoicing occurs in line with the underlying agreement and can be in advance or in arrears. Research Services This revenue stream relates to economic modelling and policy services to other Commonwealth entities. The Treasury recognises revenue on the basis of expenses incurred to complete the service (that is, over time) because the customer simultaneously receives and consumes the benefits provided to them. The Treasury uses the input method in measuring progress of the services because there is a direct relationship between the Treasury’s effort (that is, expenditure incurred) and the transfer of the service to the customer. Invoicing occurs in line with the underlying agreement and can be in advance or in arrears. Legislative and Governance Forum on Consumer Affairs This revenue stream relates to contributions from States and Territories to fund the operations and projects of the Legislative and Governance Forum on Consumer Affairs (CAF). The operational contributions are based on the Commonwealth committing 30 per cent of funding with the remaining 70 per cent shared between the States and Territories. There are no sufficiently specific obligations related to these contributions, therefore the Department recognises revenue uniformly over time within the financial period in which the funds relate to. The Department recognises project revenue on the basis of expenses incurred to deliver the project (that is, over time) because the customer simultaneously receives and consumes the benefits provided to them. The Department uses the input method in measuring progress of the services delivered because there is a direct relationship between the Departments effort (that is, expenditure incurred) and the transfer of the service to the customer. Invoicing occurs in line with the underlying State and Territories agreements and can be in advance or arrears. Payment is generally due within 30 days upon issue of invoice. Income from Subleasing Right-of-use assets The Treasury sublets a portion of office space to the Australian Office of Financial Management. The Treasury does not transfer substantially all the risks and rewards incidental to ownership of its lease through this sublease and therefore classifies this sublease as an operating lease. Rental income is accounted for on a straight-line basis over the lease term and is included in revenue from contracts with customers due to its operational nature. Receivables for goods and services, which have 30 day terms, are recognised at the nominal amounts due less any impairment allowance account. Collectability of debts is reviewed at the end of the reporting period. Allowances are made when collectability of the debt is no longer probable.

92 The Treasury Annual Report 2019–20
21
2020 2019 $'000 $'000 Note 1.2B: Other revenue
ANAO audit services received free of charge 490 575 Secondment services received free of charge 5,349 3,794 Other 177 262
Total other revenue 6,016 4,631
Note 1.2C: Other gains Reversal of restoration provision 96 30
Total other gains 96 30 Accounting Policy Resources received free of charge Resources received free of charge are recognised as revenue when, and only when, a fair value can be reliably determined and the services would have been purchased if they had not been donated. Use of those resources is recognised as an expense. Resources received free of charge are recorded as either revenue or gains depending on their nature. Contributions of assets at no cost of acquisition or for nominal consideration are recognised as gains at their fair value when the asset qualifies for recognition, unless received from another government entity as a consequence of a restructuring of administrative arrangements. Sale of assets Gains from disposal of assets are recognised when control of the asset has passed to the buyer.
Note 1.2D: Revenue from Government Appropriations
Departmental appropriations 206,298 185,518 Supplementation
Other - 3,837 Total revenue from Government 206,298 189,355
Accounting Policy Revenue from Government Amounts appropriated for departmental appropriations for the year (adjusted for any formal additions and reductions) are recognised as Revenue from Government when the Treasury gains control of the appropriation, except for certain amounts that relate to activities that are reciprocal in nature, in which case revenue is recognised only when it has been earned. Appropriations receivable are recognised at their nominal amounts.

93Part 4 Financial statements
22
2. Departmental Financial Position This section analyses the Treasury assets used to generate financial performance and the operating liabilities incurred as a result. Employee related information is disclosed in the People and Relationships section. 2.1. Financial Assets
2020 2019 $'000 $'000 Note 2.1A: Cash and cash equivalents
Cash on hand or on deposit 651 2,772 Total cash and cash equivalents 651 2,772
Note 2.1B: Trade and other receivables Goods and services receivables Contract assets 1,195 - Total goods and services receivables 1,195 - The contract assets are shared services and cost recoveries provided including TechnologyOne licences and workers compensation premiums not invoiced at 30 June.
Appropriations receivable 72,956 54,315 Supplementation receivable - 3,837 Goods and services receivables 3,785 2,715 Net GST receivable from the ATO 1,298 1,153 Other receivables 820 424
Total trade and other receivables (gross) 78,859 62,444 Less impairment loss allowance (2) (2) Total trade and other receivables (net) 80,052 62,442
Credit terms for goods and services were within 30 days (2019: 30 days). Accounting Policy Financial assets Trade receivables, loans and other receivables that are held for the purpose of collecting the contractual cash flows, where the cash flows are solely payments for principal and interest that are not provided at below-market interest rates, are subsequently measured at amortised cost using the effective interest method adjusted for any loss allowance.

94 The Treasury Annual Report 2019–20
23
2.2.
Non
-Fin
anci
al A
sset
s
Note
2.2
A: R
econ
cilia
tion
of th
e op
enin
g an
d cl
osin
g ba
lanc
es o
f pro
pert
y, p
lant
and
equ
ipm
ent a
nd c
ompu
ter s
oftw
are
(201
9-20
)
Bu
ildin
gs
Plan
t and
eq
uipm
ent
Com
pute
r so
ftwar
e in
tern
ally
de
velo
ped
Com
pute
r so
ftwar
e pu
rcha
sed
Tota
l
$’00
0 $’
000
$’00
0 $’
000
$’00
0 As
at 1
Jul
y 20
19
G
ross
boo
k va
lue
20,9
51
17,0
97
20,8
64
9,01
6
67,9
28
Accu
mul
ated
dep
reci
atio
n / a
mor
tisat
ion
and
impa
irmen
t (4
,238
) (4
,700
) (1
2,88
3)
(7,9
25)
(29,
746)
To
tal v
alue
as
at 1
Jul
y 20
19
16,7
13
12,3
97
7,98
1
1,09
1
38,1
82
Rec
ogni
tion
of ri
ght o
f use
ass
et o
n in
itial
app
licat
ion
of A
ASB
16
98,9
51
28
- -
98,9
79
Adju
sted
tota
l val
ue a
s at
1 J
uly
2019
11
5,66
4
12,4
25
7,98
1
1,09
1
137,
161
Ad
ditio
ns
33,8
99
2,33
8
6,59
1
206
43
,034
Pu
rcha
sed
5,97
4
2,32
1
- 20
6
8,50
1
Inte
rnal
ly d
evel
oped
-
- 6,
591
-
6,59
1
Rig
ht-o
f-use
ass
ets
27,9
25
17
- -
27,9
42
Dep
reci
atio
n an
d am
ortis
atio
n (2
,965
) (3
,070
) (2
,016
) (6
90)
(8,7
41)
Dep
reci
atio
n on
righ
t-of-u
se a
sset
s (8
,436
) (1
1)
- -
(8,4
47)
Impa
irmen
ts o
n rig
ht-o
f-use
ass
ets
reco
gnis
ed in
net
cos
t of s
ervi
ces
- (7
) -
- (7
) D
ispo
sals
(5
12)
(228
) -
- (7
40)
From
writ
e-do
wn
and
impa
irmen
t of a
sset
s (5
12)
(228
) -
- (7
40)
Tota
l as
at 3
0 Ju
ne 2
020
137,
650
11
,447
12
,556
60
7
162,
260
To
tal a
s at
30
June
202
0 re
pres
ente
d by
:
Gro
ss b
ook
valu
e 15
2,02
1
18,9
77
26,2
68
9,22
2
206,
488
Fa
ir va
lue
24,2
25
16,5
39
- -
40,7
64
At c
ost
126,
876
34
19
,625
9,
222
15
5,75
7
Und
er c
onst
ruct
ion
920
2,
404
6,
643
-
9,96
7
Accu
mul
ated
dep
reci
atio
n / a
mor
tisat
ion
and
impa
irmen
t (1
4,37
1)
(7,5
30)
(13,
712)
(8
,615
) (4
4,22
8)
Tota
l as
at 3
0 Ju
ne 2
020
137,
650
11
,447
12
,556
60
7
162,
260
C
arry
ing
amou
nt o
f rig
ht-o
f-use
ass
ets
118,
440
27
-
- 11
8,46
7

95Part 4 Financial statements
24
No indicators of impairment were found for property, plant and equipment or computer software as at 30 June 2020. No significant non-financial assets are expected to be sold or disposed within the next 12 months. All revaluations are independent and are conducted in accordance with the revaluation policy stated at Note 7.5 Fair Value Measurement. The fair value of property, plant and equipment has been taken to be the market value of similar properties or depreciated replacement value as determined by an independent valuer.
Contractual commitments1 for the acquisition of property, plant and equipment and intangible assets. Commitments are payable as follows: 2020 2019 $'000 $'000
Within 1 year 889 2,445 Between 1 to 5 years 2,891 -
Total commitments 3,780 2,445 1. Commitments are GST inclusive where relevant. Accounting Policy Assets are recorded at cost on acquisition except as stated below. The cost of acquisition includes the fair value of assets transferred in exchange and liabilities undertaken. Financial assets are initially measured at their fair value plus transaction costs where appropriate. Assets acquired at no cost, or for nominal consideration, are initially recognised as assets and income at their fair value at the date of acquisition, unless acquired as a consequence of restructuring of administrative arrangements. In the latter case, assets are initially recognised as contributions by owners at the amounts at which they were recognised in the transferor’s accounts immediately prior to the restructuring. Asset recognition threshold Purchases of plant and equipment and computer software are recognised initially at cost in the statement of financial position, except for purchases costing less than $10,000 (building – leasehold improvements and internally developed software $50,000) which are expensed in the year of acquisition. The initial cost of an asset includes an estimate of the cost of dismantling and removing the item and restoring the site on which it is located. This is particularly relevant to restoration provisions in property leases taken up by the Treasury where there exists an obligation to restore the property to its original condition. These costs are included in the value of the Treasury’s leasehold improvements with a corresponding provision for the restoration recognised. Lease Right of Use (ROU) Assets Leased ROU assets are capitalised at the commencement date of the lease and comprise of the initial lease liability amount, initial direct costs incurred when entering into the lease less any lease incentives received. These assets are accounted for as separate asset classes to corresponding assets owned outright, but included in the same column as where the corresponding underlying assets would be presented if they were owned. Following initial application, an impairment review is undertaken for any right of use lease asset that shows indicators of impairment and an impairment loss is recognised against any right of use lease asset that is impaired. Lease ROU assets continue to be measured at cost after initial recognition. Revaluations Following initial recognition at cost, property, plant and equipment (excluding ROU assets) are carried at fair value (or an amount not materially different from fair value) less subsequent accumulated depreciation and accumulated impairment losses. Valuations are conducted with sufficient frequency to ensure that the carrying amounts of assets do not differ materially from the assets’ fair values as at the reporting date. The regularity of independent valuations depends upon the volatility of movements in market values for the relevant assets.

96 The Treasury Annual Report 2019–20
25
Revaluation adjustments are made on a class basis. Any revaluation increment is credited to equity under the heading of asset revaluation reserve except to the extent that it reverses a previous revaluation decrement of the same asset class that was previously recognised in the surplus/deficit. Revaluation decrements for a class of assets are recognised directly in the surplus/deficit except to the extent that they reverse a previous revaluation increment for that class. Any accumulated depreciation as at the revaluation date is eliminated against the gross carrying amount of the asset and the asset is restated to the revalued amount. Depreciation and Amortisation Depreciable property, plant and equipment assets are written-off to their estimated residual values over their estimated useful lives to the Treasury using, in all cases, the straight-line method of depreciation. Depreciation rates (useful lives), residual values and methods are reviewed at each reporting date and necessary adjustments are recognised in the current, or current and future reporting periods, as appropriate. Software is amortised on a straight-line basis. Depreciation rates applying to each class of depreciable assets are based on the following useful lives: 2020 2019 Buildings - leasehold improvements 5-25 years 1.75-25 years Plant and equipment:
Plant and equipment 3-10 years 3-10 years Motor vehicles 4 years 4 years Office equipment 5 years 5 years
Computer software 3-5 years 3-5 years The depreciation rates for ROU assets are based on the commencement date to the earlier of the end of the useful life of the ROU asset or the end of the lease term. Impairment All assets were assessed for impairment at 30 June 2020. Where indications of impairment exist, the asset’s recoverable amount is estimated and an impairment adjustment made if the asset’s recoverable amount is less than its carrying amount. The recoverable amount of an asset is the higher of its fair value less costs of disposal and its value in use. Value in use is the present value of the future cash flows expected to be derived from the asset. Where the future economic benefit of an asset is not primarily dependent on the asset’s ability to generate future cash flows and the asset would be replaced if the Treasury were deprived of the asset, its value in use is taken to be its depreciated replacement cost. Derecognition An item or property, plant and equipment is derecognised upon disposal or when no further future economic benefits are expected from its use or disposal. Intangibles The Treasury’s intangible assets comprise internally developed and purchased software for internal use. These assets are carried at cost less accumulated amortisation and any accumulated impairment losses. All software assets were assessed for indications of impairment as at 30 June 2020, including the impact of factors such as project cessation and platform changes. No indications of impairment for intangible assets were identified as at 30 June 2020, therefore nil impairment loss for intangible assets was recognised (2019: nil). Accounting Judgement and Estimates The fair value of buildings – leasehold improvements and plant and equipment has taken to be the market value of similar properties or depreciated replacement value as determined by an independent valuer. Refer to section 7.5 Fair Value Measurement - Accounting Policy.

97Part 4 Financial statements
26
2.3. Payables
2020 2019 $'000 $'000 Note 2.3A: Suppliers
Trade creditors and accruals 9,950 8,203 Operating lease rentals - 295 Contract liabilities 825 -
Total suppliers 10,775 8,498 Settlement was usually made within 20 days (7 day payment terms were introduced in April 2020 to assist suppliers with their cash flows during the outbreak of COVID-19). The contract liabilities are associated with the performance obligations not yet met at 30 June for the Australian Government Actuary, the Department of Foreign Affairs and Trade and the Legislative and Governance Forum on Consumer Affairs.
Note 2.3B: Other payables Salaries and wages 2,234 983 Superannuation 330 137 Other creditors 356 385 Unearned income - 2,006
Total other payables 2,920 3,511 Other payables are expected to be settled in no more than 12 months. 1. The Treasury has applied AASB 16 using the modified retrospective approach and therefore the comparative information has not been restated and continues to be reported under AASB 117. Prior year operating lease rentals were transferred to equity on transition. Accounting Policy Financial liabilities Other financial liabilities include trade creditors and accruals are recognised at amortised cost. Liabilities are recognised to the extent that the goods or services have been received (and irrespective of having been invoiced). Settlement is usually made net 20 days.

98 The Treasury Annual Report 2019–20
27
2.4. Interest Bearing Liabilities
2020 2019 $'000 $'000 Note 2.4A: Leases Lease liabilities
Buildings 122,773 - Plant and equipment 27 -
Total leases 122,800 - 1. The Treasury has applied AASB 16 using the modified retrospective approach and therefore the comparative information has not been restated and continues to be reported under AASB 117. Total cash outflow for leases for the year ended 30 June 2020 was $8.8 million ($7.2 million in principal payments and $1.6 million in interest payments). Accounting Policy Refer Overview section for accounting policy on leases. 2.5. Other Provisions
Note 2.5A: Provision for restoration Total $’000 $’000 Carrying amount 1 July 2019 3,564 3,564 Additional provisions made 840 840 Amounts used (164) (164) Amounts reversed (96) (96) Unwinding of discount or change in discount rate 85 85 Closing balance 30 June 2020 4,229 4,229
The Treasury has 3 (2019: 5) lease agreements containing provisions to restore the premises to their original condition at the conclusion of the lease. The Treasury has made a provision to reflect the present value of this obligation. The value of the provision has been estimated by an independent valuer based on occupied floor space as per the leasing agreements.
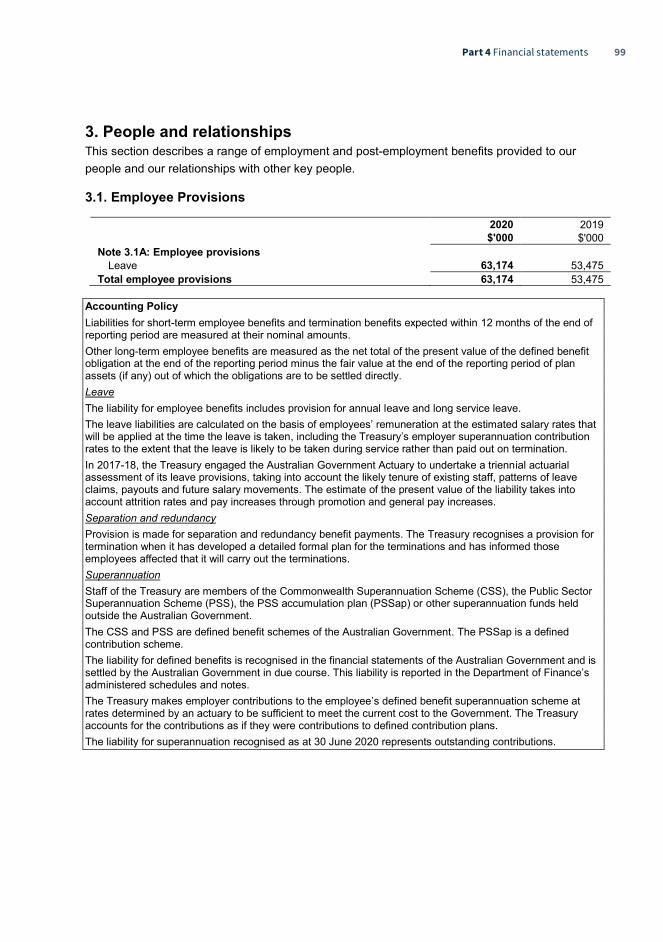
99Part 4 Financial statements
28
3. People and relationships This section describes a range of employment and post-employment benefits provided to our people and our relationships with other key people. 3.1. Employee Provisions
2020 2019 $'000 $'000 Note 3.1A: Employee provisions
Leave 63,174 53,475 Total employee provisions 63,174 53,475
Accounting Policy Liabilities for short-term employee benefits and termination benefits expected within 12 months of the end of reporting period are measured at their nominal amounts. Other long-term employee benefits are measured as the net total of the present value of the defined benefit obligation at the end of the reporting period minus the fair value at the end of the reporting period of plan assets (if any) out of which the obligations are to be settled directly. Leave The liability for employee benefits includes provision for annual leave and long service leave. The leave liabilities are calculated on the basis of employees’ remuneration at the estimated salary rates that will be applied at the time the leave is taken, including the Treasury’s employer superannuation contribution rates to the extent that the leave is likely to be taken during service rather than paid out on termination. In 2017-18, the Treasury engaged the Australian Government Actuary to undertake a triennial actuarial assessment of its leave provisions, taking into account the likely tenure of existing staff, patterns of leave claims, payouts and future salary movements. The estimate of the present value of the liability takes into account attrition rates and pay increases through promotion and general pay increases. Separation and redundancy Provision is made for separation and redundancy benefit payments. The Treasury recognises a provision for termination when it has developed a detailed formal plan for the terminations and has informed those employees affected that it will carry out the terminations. Superannuation Staff of the Treasury are members of the Commonwealth Superannuation Scheme (CSS), the Public Sector Superannuation Scheme (PSS), the PSS accumulation plan (PSSap) or other superannuation funds held outside the Australian Government. The CSS and PSS are defined benefit schemes of the Australian Government. The PSSap is a defined contribution scheme. The liability for defined benefits is recognised in the financial statements of the Australian Government and is settled by the Australian Government in due course. This liability is reported in the Department of Finance’s administered schedules and notes. The Treasury makes employer contributions to the employee’s defined benefit superannuation scheme at rates determined by an actuary to be sufficient to meet the current cost to the Government. The Treasury accounts for the contributions as if they were contributions to defined contribution plans. The liability for superannuation recognised as at 30 June 2020 represents outstanding contributions.

100 The Treasury Annual Report 2019–20
29
3.2. Key Management Personnel Remuneration Key management personnel are those persons having authority and responsibility for planning, directing and controlling the activities, directly or indirectly, of the Treasury. The Treasury has determined the key management personnel to be the Secretary and Deputy Secretaries. Key management personnel remuneration is reported in the table below:
2020 2019 $'000 $'000 Short-term employee benefits 2,883 3,065 Post-employment benefits 404 444 Other long-term employee benefits 73 130 Termination benefits 224 - Total key management personnel remuneration expenses1 3,584 3,639
The total number of key management personnel that are included in the above table are 12 (2019:12). 1. The above key management personnel remuneration excludes the remuneration and other benefits of the Treasurer and other Portfolio Ministers. Their remuneration and other benefits are set by the Remuneration Tribunal and are not paid by the Treasury. 3.3. Related Party Disclosures Related party relationships: The Treasury is an Australian Government controlled entity. Related parties to the Treasury are key management personnel including the Portfolio Minister and Executive and other Australian Government entities. Transactions with related parties: Giving consideration to relationships with related entities and transactions entered into during the reporting period by the Treasury, it has been determined that one related party transaction is to be separately disclosed (2019: nil). During the reporting period, Treasury paid $2.0 million (GST inclusive) in administered grant funding to the Australian Housing and Urban Research Institute Limted (AHURI). One of the key management personnel was a government-appointed director of AHURI during 2019-20.
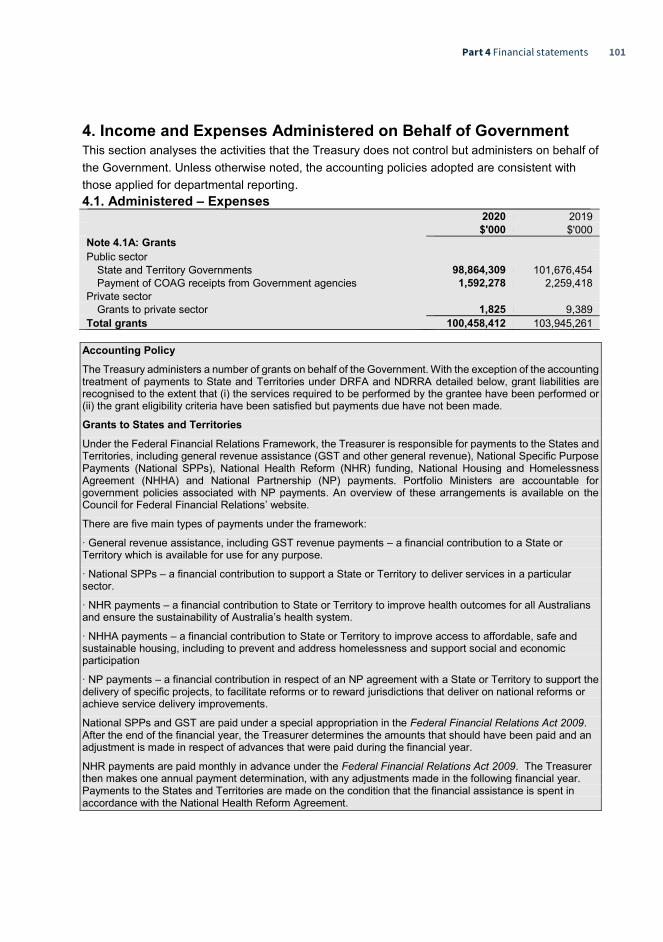
101Part 4 Financial statements
30
4. Income and Expenses Administered on Behalf of Government This section analyses the activities that the Treasury does not control but administers on behalf of the Government. Unless otherwise noted, the accounting policies adopted are consistent with those applied for departmental reporting. 4.1. Administered – Expenses
2020 2019 $'000 $'000 Note 4.1A: Grants Public sector
State and Territory Governments 98,864,309 101,676,454 Payment of COAG receipts from Government agencies 1,592,278 2,259,418
Private sector Grants to private sector 1,825 9,389
Total grants 100,458,412 103,945,261 Accounting Policy The Treasury administers a number of grants on behalf of the Government. With the exception of the accounting treatment of payments to State and Territories under DRFA and NDRRA detailed below, grant liabilities are recognised to the extent that (i) the services required to be performed by the grantee have been performed or (ii) the grant eligibility criteria have been satisfied but payments due have not been made.
Grants to States and Territories
Under the Federal Financial Relations Framework, the Treasurer is responsible for payments to the States and Territories, including general revenue assistance (GST and other general revenue), National Specific Purpose Payments (National SPPs), National Health Reform (NHR) funding, National Housing and Homelessness Agreement (NHHA) and National Partnership (NP) payments. Portfolio Ministers are accountable for government policies associated with NP payments. An overview of these arrangements is available on the Council for Federal Financial Relations’ website.
There are five main types of payments under the framework:
∙ General revenue assistance, including GST revenue payments – a financial contribution to a State or Territory which is available for use for any purpose.
∙ National SPPs – a financial contribution to support a State or Territory to deliver services in a particular sector.
∙ NHR payments – a financial contribution to State or Territory to improve health outcomes for all Australians and ensure the sustainability of Australia’s health system.
∙ NHHA payments – a financial contribution to State or Territory to improve access to affordable, safe and sustainable housing, including to prevent and address homelessness and support social and economic participation
∙ NP payments – a financial contribution in respect of an NP agreement with a State or Territory to support the delivery of specific projects, to facilitate reforms or to reward jurisdictions that deliver on national reforms or achieve service delivery improvements.
National SPPs and GST are paid under a special appropriation in the Federal Financial Relations Act 2009. After the end of the financial year, the Treasurer determines the amounts that should have been paid and an adjustment is made in respect of advances that were paid during the financial year.
NHR payments are paid monthly in advance under the Federal Financial Relations Act 2009. The Treasurer then makes one annual payment determination, with any adjustments made in the following financial year. Payments to the States and Territories are made on the condition that the financial assistance is spent in accordance with the National Health Reform Agreement.

102 The Treasury Annual Report 2019–20
31
NP and other general revenue assistance payments are paid under the Federal Financial Relations Act 2009 which allows the Treasurer (or the delegated Minister within the Treasury Portfolio) to determine an amount to be paid to a State or Territory for the purpose of making a grant of financial assistance. Once determined, this amount must be credited to the COAG Reform Fund and the Treasurer must ensure that, as soon as practicable after the amount is credited, the COAG Reform Fund is debited for the purposes of making the grant. In addition, the Treasurer must have regard to the Intergovernmental Agreement on Federal Financial Relations.
The Treasury is primarily reliant on certified payment advice from the Chief Financial Officers of Commonwealth agencies who have policy and program responsibility, to assure that the terms and conditions of the NP have been met prior to making a payment. The Treasury then advises the Treasurer on amounts to be determined.
Disaster Recovery Funding Arrangements (DRFA) and Natural Disaster Relief and Recovery Arrangements (NDRRA)
The Treasury accounts for payments made to States and Territories under DRFA and NDRRA by recognising a liability equal to the discounted value of estimated future payments to States and Territories regardless of whether or not a State or Territory has completed eligible disaster reconstruction work or submitted an eligible claim to the Commonwealth. States and Territories were requested to provide to the Department of Home Affairs (Home Affairs) an estimate of costs expected to be incurred for disasters affecting States and Territories that occurred prior to 1 July 2020 which would be eligible for assistance. The signed representations from the States and Territories are quality assured by Home Affairs, which in turn provides a certification of the expenditure estimates to the Treasury.
Payments to the States and Territories through the COAG special account COAG receipts are received from other government agencies for the following payments:
∙ Department of Social Services (DSS) – Commonwealth’s share of the wage increases arising from Fair Work Australia’s decision on 1 February 2012 to grant an Equal Remuneration Order in the Social and Community Services sector.
∙ Department of Social Services (DSS) – payments to States and Territories in relation to the DisabilityCare Australia Fund.
The Treasury receives funds from the relevant portfolio agency and pays the amount to the States and Territories. These amounts are recorded as ‘COAG receipts from Government Agencies’ to recognise the income and a corresponding grant expense for the payment to the States and Territories.
Mirror taxes collected by State Governments
On behalf of the States, the Government imposes mirror taxes which replace State taxes that may be constitutionally invalid in relation to Government places. Mirror taxes are collected and retained by the States, under the Commonwealth Places (Mirror Taxes) Act 1998. State Governments bear the administration costs of collecting mirror taxes.
2020 2019 $'000 $'000 Note 4.1B: Medicare Guarantee Fund
Medicare Guarantee Fund 37,961,055 36,233,451 Total Medicare Guarantee Fund 37,961,055 36,233,451

103Part 4 Financial statements
32
Accounting Policy Medicare Guarantee Fund
The purpose of the Medicare Guarantee Act 2017 (the Act) is to secure ongoing funding of the Medical Benefits Schedule (MBS) and Pharmaceutical Benefits Scheme (PBS).
The Act establishes the Medicare Guarantee Fund (MGF), which consists of the Medicare Guarantee Fund (Treasury) Special account (Treasury Special Account) and the Medicare Guarantee Fund (Health) Special Account (Health Special Account). The Treasury Special Account is administered by the Department of the Treasury and the Health Special Account is administered by the Department of Health.
Under the Act, the Treasurer must credit the Treasury Special Account with an amount that is sufficient to cover the estimated costs of the MBS and PBS for the next financial year. The Treasury is reliant on advice from the Department of Health in determining the estimated costs. The sole purpose of the Treasury Special Account is to ensure that amounts are available for transfer to the Health Special Account to fund the MBS and PBS.
The MGF funding payment is recorded in Treasury Administered expenses to reflect the payment into the Health Special Account from the Treasury Special Account. Refer to Note 6.2 Special accounts.
2020 2019 $'000 $'000 Note 4.1C: Payments to corporate Commonwealth entities
NHFIC Operating funding 26,762 13,973 NHFIC grants payment 35,000 35,000
Total payments to corporate Commonwealth entities 61,762 48,973 Accounting Policy Payments to corporate Commonwealth entities from amounts appropriated for that purpose are classified as administered expenses, equity injections or loans of the relevant portfolio department. The appropriation to the Treasury is disclosed in Note 6 Funding.
Refer to Notes 5.1B Loans and other receivables, 5.1C Investments and 7.2 Administered Contingent Assets and Liabilities for more information on the National Housing Finance and Investment Corporation (NHFIC).
Note 4.1D: Net foreign exchange losses
IMF SDR allocation 87,235 250,912 IMF Maintenance of Value 648,787 406,863 IMF quota revaluation (185,958) (534,870) IFIs revaluation 6,536 (87,399) IMF new arrangement to borrow loans revaluation (8,112) (14,754)
Total net foreign exchange losses 548,488 20,752
Note 4.1E: Suppliers Small & Medium Enterprises Guarantee Scheme – Claims Provision1 93,385 - AFCA disputes payments2 31,447 - Advertising campaigns 26,354 14,107 NHFIC First Home Loan Deposit Scheme – Claims provision1 6,735 - General supplier expenses 444 1,656 Total suppliers 158,365 15,763
1. Refer to Note 5.4A Accounting Policy for further details on the Small & Medium Enterprises Guarantee Scheme and the NHFIC First Home Loan Deposit Scheme.
2. The Royal Commission into Misconduct in the Banking, Superannuation and Financial Services Industry presented its final report to the Governor-General on 1 February 2019. As part of its response, the Government expanded the remit of the Australian Financial Complaints Authority (AFCA) to accept applications for external disputes dating back to 1 January 2008 that relate to misconduct, which AFCA, its predecessor schemes, or the courts have not yet dealt with. AFCA disputes payments are expected to be finalised in 2020-21.

104 The Treasury Annual Report 2019–20
33
4.2. Administered – Income
2020 2019 Revenue $'000 $'000 Non-Taxation Revenue Note 4.2A: Revenue from contracts with customers
GST administration fees - external entities 646,600 599,200 Guarantee of State and Territory borrowing fee 2,462 6,011
Total revenue from contracts with customers 649,062 605,211
Note 4.2B: Interest Gross IMF remuneration 9,954 10,666 Less: burden sharing (35) (39) Net IMF remuneration 9,919 10,627 Interest on loan to IMF under New arrangements to borrow 2,259 4,106 Interest on loans to States and Territories 2,168 2,162 Interest on NHFIC AHBA Loans 1,216 38
Total interest 15,597 16,972
Note 4.2C: Dividends Reserve Bank of Australia 2,562,718 1,684,632 Australian Reinsurance Pool Corporation1 10,000 10,000 International Finance Corporation 498,783 -
Total dividends 3,071,501 1,694,632
Note 4.2D: COAG revenue from Government DisabilityCare Australia Fund revenue (DSS)2 1,550,529 2,087,755 Interstate Road Transport revenue (DoI)2 - 6,586 Social and Community Services Sector (DSS)2 41,749 165,077
Total COAG receipts from government agencies 1,592,278 2,259,418
Note 4.2E: Other revenue HIH Group liquidation proceeds 19,196 - Australian Reinsurance Pool Corporation Fee1 90,000 90,000 Other revenue 3,315 3,818
Total Other revenue 112,511 93,818 1. Australian Reinsurance Pool Corporation Dividend and Service fee are agreed in advance as part of the Budget process and finalised once the appropriate determination is provided under Section 38(2) of the Terrorism Insurance Act 2003. 2. COAG revenue from Government – refer to Note 4.1A Grants - Accounting Policy for further details. Accounting Policy Administered revenue
All administered revenue relate to ordinary activities performed by the Treasury on behalf of the Australian Government. As such, administered appropriations are not revenue of the individual entity that oversees distribution or expenditure of the funds as directed.

105Part 4 Financial statements
34
Reserve Bank of Australia dividend
The Treasurer is able to determine what portion of the Reserve Bank of Australia’s earnings is made available as a dividend to the Commonwealth having regard to the Reserve Bank Board’s advice and in accordance with section 30 of the Reserve Bank Act 1959.
The Treasury recognise the dividend revenue and a corresponding receivable in the year the Reserve Bank of Australia reports a net profit available to the Commonwealth, subject to reliable measurement. This does not affect the timing of the dividend receipt in the Cash Flow Statement, only the timing of the accrued revenue in the Statement of Comprehensive Income. Dividends are measured at nominal amounts.
Australian Reinsurance Pool Corporation dividend and fee
The dividend and fee from the Australian Reinsurance Pool Corporation (ARPC) are recognised when the relevant Minister signs the legislative instrument and thus control of the income stream is established. These are measured at nominal amounts.
International Monetary Fund remuneration
Remuneration is interest paid by the International Monetary Fund (IMF) to Australia for the use of its funds. Remuneration is paid on a portion of Australia’s IMF quota commitment. This money is lent by Australia under the IMF’s Financial Transaction Plan, under which members in a strong external position provide quota resources to support IMF lending to borrowing member countries.
Where the IMF’s holdings of Australian dollars fall below a specified level, it pays remuneration on Australia’s average remunerated reserve tranche position. The rate of remuneration is based on the SDR interest rate. The SDR interest rate is the market interest rate computed by the IMF, which is based on a weighted average of representative interest rates on short-term government debt instruments (generally 3 month bond rates) of the five entities whose currencies make up the SDR basket: the United States, United Kingdom, European Union, Japan and China. This rate is then adjusted to account for the financial consequences of overdue obligations to the IMF which are shared between members and reflected at Note 4.2B as ‘burden sharing’.
Remuneration is calculated and paid at the end of the IMF’s financial quarters. An annual Maintenance of Value adjustment is made to the IMF’s holdings of Australia’s quota paid in Australian dollars to maintain its value in SDR terms. International Monetary Fund New Arrangements to Borrow (NAB)
Australia also receives interest on amounts lent to the IMF under the New Arrangements to Borrow (NAB). Amounts lent to the IMF under the NAB accrue interest daily at the SDR interest rate (or such other rate as agreed by 85 per cent of NAB participants). The IMF pays interest on NAB amounts quarterly.
The IMF must repay amounts lent through the NAB five years after each call is made. Amounts can be repaid earlier at the IMF’s discretion.
International Finance Corporation
On 16 April 2020, the Board of Governors of the International Finance Corporation passed Resolution 270 - Conversion of Retained Earnings and General Capital Increase. Following the passage of the Resolution, retained earnings converted to 16,999,998 additional shares with a par value of $1,000 USD each. Australia was allocated 313,535 shares valued at $498.783 million. This is treated as a non-cash dividend.
The Guarantee of State and Territory borrowing
Under the Guarantee of State and Territory Borrowing, a fee is paid to provide the guarantee over new and nominated existing State and Territory securities. Fees are reported as a fee for service in accordance with AASB 118 Revenue. The guarantee closed to new issuances of guaranteed liabilities on 31 December 2010.
Financial guarantee contracts
Financial guarantee contracts are accounted for in accordance with AASB 139 Financial Instruments: Recognition and Measurement. They are not treated as contingent liabilities, as they are regarded as financial instruments outside the scope of AASB 137 Provisions, Contingent Liabilities and Contingent Assets. The Treasury’s administered financial guarantee contracts relate to components of the Guarantee of State and Territory Borrowing.

106 The Treasury Annual Report 2019–20
35
5. Assets and Liabilities Administered on Behalf of Government This section analyses assets used to conduct operations and the operating liabilities incurred as a result, which the Treasury does not control but administers on behalf of the Government. Unless otherwise noted, the accounting policies adopted are consistent with those applied for departmental reporting. 5.1. Administered – Financial Assets
2020 2019 $'000 $'000 Note 5.1A: Cash and cash equivalents Cash held in the OPA - NHFIC Special Account 449,817 239,677 Total cash and cash equivalents 449,817 239,677
Accounting Policy
The Treasury’s administered cash and cash equivalents relate to special account balances held in the OPA. Refer to Note 6.2 Special accounts for more information.
Note 5.1B: Loans and other receivables Loans
Loans to States and Territories
47,855 47,855
Loans to NHFIC
115,183 15,323 IMF new arrangements to borrow loan 213,060 311,738 Total loans 376,098 374,916 Other receivables Guarantee of State and Territory Borrowing contractual fee receivable1 3,658 6,169 Guarantee of State and Territory Borrowing fee receivable 188 298 Net GST receivable from the ATO 1,397 (5) IMF related moneys owing 320 2,447 Dividends receivable 2,563,000 1,685,000 Accrued interest - Loans to NHFIC 53 38 GST Revenue allocations and COAG refundable 5,174,947 470,268 Other receivables 2 - Total other receivables 7,743,565 2,164,215 Total loans and other receivables (gross) 8,119,663 2,539,131 Receivables are expected to be recovered in No more than 12 months 7,742,101 2,160,478 More than 12 months 377,562 378,653 Total receivables (gross) 8,119,663 2,539,131 Receivables (gross) are aged as follows Not overdue 8,119,663 2,539,131 Total receivables (gross) 8,119,663 2,539,131
1. Refer to Note 5.2C Unearned income for corresponding liability.

107Part 4 Financial statements
36
Accounting Policy
Except for financial guarantee contracts, all loans and receivables are classified as amortised cost under AASB 9. Refer to Note 7.4 Administered financial instruments for further details on accounting treatment.
Loans to NHFIC
Loans to NHFIC relate to the Affordable Housing Bond Aggregator (AHBA), which was established by NHFIC to provide loans to registered Community Housing Providers (CHPs). In accordance with the National Housing Finance and Investment Corporation Investment Mandate 2018, each loan allocated to the AHBA must relate to a particular loan to a CHP unless approved by the Treasurer and Minister for Finance. Interest is to be charged on each loan at a rate that covers the Commonwealth’s cost of borrowing over the life of the loan. The interest has been accrued as earned and disclosed in Notes 4.2B and 5.1B.
IMF New Arrangements to Borrow
Through the New Arrangements to Borrow (NAB), Australia and 39 other member countries have committed to lend additional resources to the IMF. The NAB constitutes a second line of funding defence to supplement IMF resources to forestall or cope with an impairment of the international monetary system. The NAB is used in circumstances in which the IMF needs to supplement its quota resources for lending purposes. The NAB is covered by general activation periods of up to six months, with each activation period subject to a specified maximum level of commitments.
Australia has received NAB repayments following past NAB lending however, the NAB is not currently active or being called upon. The IMF must repay amounts lent through the NAB five years after each call is made. Amounts can be repaid earlier at the IMF’s discretion.
GST Revenue allocation and COAG refundable
Under the COAG arrangements, the Treasury records the COAG grants position based on accrual or receivable balance information provided by Commonwealth Agencies for each COAG grant. Historically, the Treasury has reported on a net basis the grants payable under Note 5.2A Grants. From 2018-19, the Treasury reports on a gross basis, separately disclosing grants payable (grants not paid prior to year-end) and receivable (primarily GST revenue allocations and other COAG grants receivable).
GST is paid to the State and Territories based on estimated figures provided in the Budget and revisited in the Mid-Year Economic and Fiscal Outcome (MYEFO) round. The key driver of the calculation of the distribution of GST is population and actual collections. At the end of each financial year, the Australian Bureau of Statistics provides population data and the ATO provides the actual GST collection figures. The difference between the estimated State and Territory payments is recorded as GST revenue allocation.
Current year GST revenue allocation is $5,174.9 million (2019: $470.3 million).
Refer to Note 5.2A Grants for further details.

108 The Treasury Annual Report 2019–20
37
2020 2019 $'000 $'000 Note 5.1C: Investments International financial institutions
Asian Development Bank 617,551 608,860 Asian Infrastructure & Investment Bank 1,075,623 842,093 European Bank for Reconstruction
and Development 102,438 101,442 International Bank for Reconstruction
and Development 340,014 332,742 International Finance Corporation 525,811 67,488 Multilateral Investment Guarantee Agency 9,035 8,842
Total international financial institutions 2,670,472 1,961,467 Australian Government entities
Reserve Bank of Australia 29,601,000 28,338,000 Australian Reinsurance Pool Corporation 520,526 461,321 NHFIC 305,225 165,000
Total Australian Government entities 30,426,751 28,964,321 Commonwealth Companies
Financial Adviser Standards and Ethics Authority Ltd 1,436 1,174 Total Commonwealth Companies 1,436 1,174 Other Investments
IMF quota 13,213,510 13,027,552 Total other investments 13,213,510 13,027,552 Total Investments 46,312,169 43,954,514 Investments are expected to be recovered in more than 12 months.
Accounting Policy Administered investments
Investments are classified as fair value through other comprehensive income. Refer to Note 7.4 Administered Financial Instruments for further details on the Treasury’s accounting policy.
Development banks
Australia holds shares in the World Bank Group (WBG), the Asian Development Bank (ADB), the European Bank for Reconstruction and Development (EBRD) and the Asian Infrastructure Investment Bank (AIIB).
Principal activities:
The World Bank was established in 1944 and comprises the International Bank for Reconstruction and Development (IBRD) and the International Development Association (IDA). The World Bank, alongside the International Finance Corporation (IFC), the Multilateral Investment Guarantee Agency (MIGA) and the International Centre for Settlement of Investment Disputes (ICSID), form the WBG.
The IBRD provides financing and technical assistance to middle income countries and creditworthy poor countries. The IDA provides grants, concessional finance and technical assistance to low income countries. The IFC supports the development of the private sector by providing direct finance to private sector operations. MIGA provides guarantee services for projects, which reduce the risks for other co-financing partners including the private sector. ICSID provides international facilities for conciliation and arbitration of investment disputes.

109Part 4 Financial statements
38
The ADB was established in 1966 and has a mandate to reduce poverty and promote economic development in its developing member countries in Asia and the Pacific. The ADB does this by financing (through a mix of loans, grants, guarantees and co-financing activities with both other donors and the private sector) public sector and private sector activities. It also provides technical assistance to developing member countries so they can improve their policy and business investment environments. A significant portion of the ADB’s activities are focused on the infrastructure, transportation and energy sectors.
The EBRD was established in 1991 to assist former communist eastern European countries committed to the principles of multi-party democracy, pluralism and market economies, to develop their private sector and capital markets. The EBRD currently operates in more than 30 countries from Central and Eastern Europe to Central Asia and the Southern and Eastern Mediterranean region. It provides project financing for banks, industries and businesses, both new ventures and investments in existing companies. It also works with publicly owned companies, to support privatisation, restructuring state owned firms and improvement of municipal services.
The AIIB was established on 25 December 2015. The AIIB focuses on the development of infrastructure and other productive sectors in Asia. The AIIB also aims to promote interconnectivity and economic integration in the region by working in close collaboration with other multilateral and bilateral development institutions.
International Monetary Fund
The IMF is an organisation with 189 member countries, working to ensure the stability of the international monetary system - the system of exchange rates and international payments that enables countries (and their citizens) to transact with each other. The IMF does this through: surveillance, including annual economic assessments of member countries; technical assistance to member countries; and by making resources available (with adequate safeguards) to members experiencing balance of payments difficulties.
Quota subscriptions which are denominated in SDRs represent a member’s shareholding in the IMF and generate most of the IMF’s financial resources.
Australian Government entities
Administered investments in controlled corporate entities are not consolidated because their consolidation is relevant only at the whole of government level.
The Reserve Bank of Australia is Australia's central bank. Its duty is to contribute to the maintenance of price stability, full employment and the economic prosperity and welfare of the Australian people. It does this by setting the cash rate to meet a medium-term inflation target, working to maintain a strong financial system and efficient payments system and issuing the nation's banknotes. The Bank provides selected banking services to the Australian Government and its agencies and to a number of overseas central banks and official institutions. Additionally, it manages Australia's gold and foreign exchange reserves.
The Australian Reinsurance Pool Corporation (ARPC) is a Commonwealth public financial corporation established by the Terrorism Insurance Act 2003 to administer the terrorism reinsurance scheme, providing primary insurers with reinsurance for commercial property and associated business interruption losses arising from a declared terrorist incident.
The National Housing Finance and Investment Corporation (NHFIC) was established under the National Housing Finance and Investment Corporation Act 2018 in June 2018. NHFIC’s purpose is to improve housing outcomes for Australians by providing funding to eligible housing projects through two key financing mechanisms: the National Housing Infrastructure Facility (NHIF), which provides loans, investments and grants for enabling infrastructure to support new housing; and the Affordable Housing Bond Aggregator (AHBA), which provides cheaper, longer-term financing to community housing providers.
Financial Adviser Standards and Ethics Authority Ltd (FASEA) is a Commonwealth entity that was established in April 2017 to set standards for the ethical conduct, educational qualifications and ongoing training of licensed financial advisers in Australia.
The Commonwealth, as represented by the Assistant Minister for Superannuation, Financial Services and Financial Technology, is the sole shareholder. FASEA is funded by contributions from participating financial institutions under FASEA’s Funding agreement. All revenue and any subsequent profits are to be used to fund the operations of FASEA and cannot be distributed to the Commonwealth. Upon winding up, any surplus is returned to the contributing financial institutions and the shareholder is required to contribute $10.00

110 The Treasury Annual Report 2019–20
39
5.2. Administered – Payables
2020 2019 $'000 $'000 Note 5.2A: Grants
Public sector COAG grants payable 126,753 156,033 Other grants payable - 10
Total grants 126,753 156,043 Grants are expected to be settled in no more than 12 months.
Note 5.2B: Other payables
GST appropriation payable 6,668 3,710 IMF SDR allocation 6,198,575 6,111,340 IMF related monies owing 693 11,294 IMF Maintenance of Value 648,787 406,863 Suppliers 7,992 (62)
Total other payables 6,862,715 6,533,145 Other payables expected to be settled
No more than 12 months 15,353 14,968 More than 12 months 6,847,362 6,518,177
Total other payables 6,862,715 6,533,145
Note 5.2C: Unearned income Guarantee of State and Territory borrowing
contractual guarantee service obligation1 3,658 6,169 Total unearned income 3,658 6,169
Total unearned income expected to be settled
No more than 12 months 2,194 2,432 More than 12 months 1,464 3,737
Total unearned income 3,658 6,169 1. Refer Note 5.1B Loans and other receivables for corresponding receivable. COAG grants payable Historically, COAG grants payable was netted-off against GST revenue allocations receivable and other COAG grants receivable. From 2018-19, these have been separately disclosed on a gross basis, with GST revenue allocations receivable and other COAG grants receivable now disclosed in Note 5.1B Loans and other receivables.
IMF Special Drawing Right Allocation
The SDR allocation liability reflects the current value in AUD of the Treasury’s liability to repay to the IMF the cumulative allocations of SDRs provided to Australia since joining the IMF. This liability is classified as ‘other payables’.
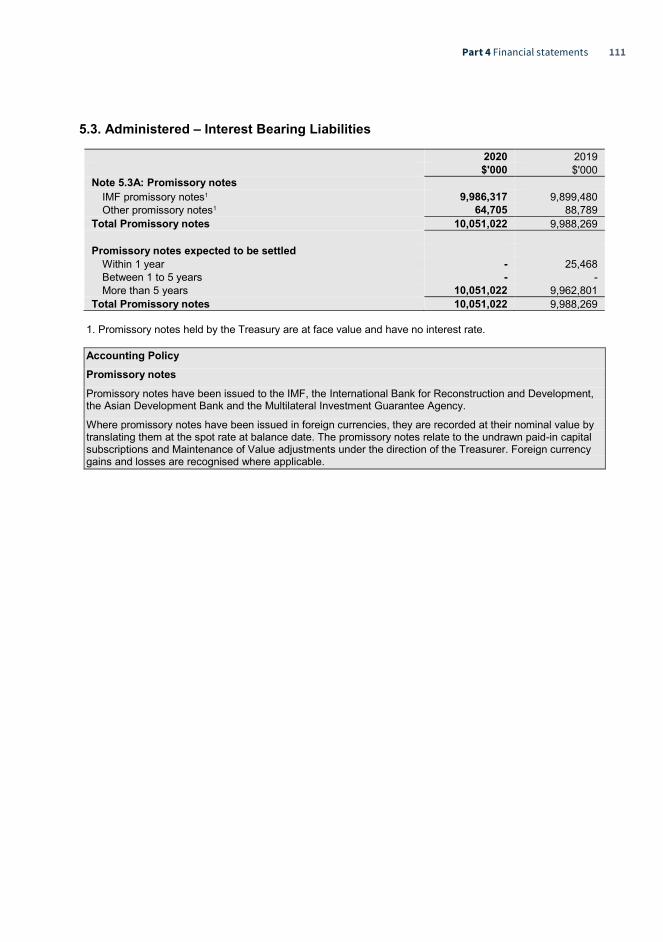
111Part 4 Financial statements
40
5.3. Administered – Interest Bearing Liabilities
2020 2019 $'000 $'000 Note 5.3A: Promissory notes
IMF promissory notes1 9,986,317 9,899,480 Other promissory notes1 64,705 88,789
Total Promissory notes 10,051,022 9,988,269 Promissory notes expected to be settled
Within 1 year - 25,468 Between 1 to 5 years - - More than 5 years 10,051,022 9,962,801
Total Promissory notes 10,051,022 9,988,269 1. Promissory notes held by the Treasury are at face value and have no interest rate. Accounting Policy Promissory notes
Promissory notes have been issued to the IMF, the International Bank for Reconstruction and Development, the Asian Development Bank and the Multilateral Investment Guarantee Agency.
Where promissory notes have been issued in foreign currencies, they are recorded at their nominal value by translating them at the spot rate at balance date. The promissory notes relate to the undrawn paid-in capital subscriptions and Maintenance of Value adjustments under the direction of the Treasurer. Foreign currency gains and losses are recognised where applicable.

112 The Treasury Annual Report 2019–20
41
5.4. Administered – Provisions
2020 2019 $'000 $'000 Note 5.4A: Provisions
Small & Medium Enterprises Guarantee Scheme (SMEGS) 93,385 - NHFIC First Home Loan Deposit Scheme (FHLDS) 6,735 - DRFA and NDRRA provision 1,880,653 1,392,582
Queensland 872,428 1,050,712 New South Wales 686,071 16,567 Victoria 37,066 52,525 Western Australia 138,906 133,508 Northern Territory 37,582 65,348 Tasmania 51,180 73,721 South Australia 56,586 190 Australian Capital Territory 834 11
Total provisions 1,980,773 1,392,582 Provisions expected to be settled
No more than 12 months 1,197,630 532,379 More than 12 months 783,143 860,203
Total provisions 1,980,773 1,392,582
SMEGS FHLDS DRFA and
NDRRA Total $’000 $’000 $’000 $’000 As at 1 July 2019 - - 1,392,582 1,392,582
Additional provisions made 93,385 6,735 746,326 846,446 Amounts used - - (499,922) (499,922) Amounts reversed - - - - Unwinding of discount or change in
discount rate - - 241,667 241,667 Total as at 30 June 2020 93,385 6,735 1,880,653 1,980,773
Accounting Judgements and Estimates Disaster Recovery Funding Arrangements (DRFA) and the Natural Disaster Relief and Recovery Arrangements (NDRRA) Provisions
The DRFA and NDRRA liability represents the Treasury’s best estimate of payments expected to be made to States and Territories as at balance date. The DRFA 2018 Determination applies from 1 November 2018 in respect of eligible events that occur on or after that date. All eligible events occurring up to and including 31 October 2018 are governed by NDRRA Determination 2017. No change to the method of accounting for the provision arises from this change in the determination.
The estimate is based on information provided by the States and Territories to the Department of Home Affairs (Home Affairs), the Commonwealth agency responsible for the administration of disaster relief. The estimates provided by the States and Territories are based on their assessment of the costs expected to be incurred that would be eligible for assistance under the applicable Determination. Home Affairs performs their quality assurance processes in order to assess reasonableness of estimates provided by the States and Territories with regard to estimates eligibility under DRFA and NDRRA.
The Treasury reviews the quality assured estimates to ensure they are consistent with government decisions and then calculates the provision by discounting the future cash flows. Given the nature of disasters, there is a level of uncertainty in the estimated reconstruction costs at the time of a disaster. This uncertainty decreases as reconstruction efforts progress to completion.

113Part 4 Financial statements
42
Contingent liabilities
The DRFA and NDRRA provision at 30 June 2020 includes estimated payments for disaster events that occurred prior to 1 July 2020, except for new events that occurred during the 2019-20 financial year for which costs cannot yet be quantified reliably. There were seven such events that are included in the DRFA and NDRRA contingent liability. These are:
- Tasmanian East Coast Storm in April 2020;
- East Victorian Coast Storms in April 2020;
- Western NSW Floods in February 2020;
- Western NSW Storms and Floods in April 2020;
- Western NSW Storms and Floods in April 2020;
- Cabonne Shire Storms and Floods in March 2020; and
- South Australian Flood Event between January – February 2020.
Estimates of all natural disasters are regularly reviewed and revised when new information becomes available.
Small & Medium Enterprises (SME) Guarantee Scheme (SMEGS) Provision
The SMEGS provision represents the Treasury’s best estimate of claims expected from eligible lenders as at balance date. Under the Guarantee of Lending to Small and Medium Enterprises (Coronavirus Economic Response Package) Act 2020 and the Australian Government SME Guarantee Scheme- Scheme Rules effective 8 July 2020, the Commonwealth guarantees 50% of reliable new loans issued by eligible lenders to SMEs up to $40 billion. The loans need to meet the eligibility and credit criteria of the eligible lenders (banks, credit unions and ADIs) approved by Treasury.
Eligible lenders are required to upload the approved loans to an Australian Prudential Regulations Authority (APRA) form, complying with the Financial Sector (Collection of Data) Act 2001 Determination No.4 of 2020. The data required is governed by the Reporting Form ARF 920.0 Australian Government SME Guarantee Scheme (Portfolio Information) (ARF 920.0) and Reporting Form ARF 920.1 Australian Government SME Guarantee Scheme (Loan Level Details) (ARF 920.1). These forms are used for the purpose of enabling APRA to assist the Treasury administer SMEGS.
The APRA data provides the basis of the total loans and maturity dates of each loan as at balance date. These data points are multiplied by a determined default rate and discounted using Commonwealth Treasury Bonds rates with a comparable duration. The expected default rate has been determined using a combination of default data from similar international programs and the banking industry.
The impact of the Novel Coronavirus (COVID-19) has resulted in an evolving economic response which impacts upon the SMEGS provision. The Government response to date has been to release an initial phase (Phase 1) and a second phase (Phase 2) on 23 July 2020. As at 30 June 2020, only Phase 1 guarantees have been reflected, as Phase 2 will not be in effect until 1 October 2020
Phase 1 will remain open until 30 September 2020, which guarantees 50% of unsecured loans of up to $250,000 with maximum terms of three years, and a six month repayment holiday.
Contingent liabilities
Refer to Note 7.2 Administered Contingent Assets and Liabilities

114 The Treasury Annual Report 2019–20
43
NHFIC First Home Loan Deposit Scheme (FHLDS) Provision
The FHLDS provision represents the Treasury’s best estimate of claims expected from NHFIC as at balance date. FHLDS is an Australian Government initiative launched on 1 January 2020, administered by NHFIC. Under the Scheme, NHFIC guarantees up to 15% of new loans to eligible first home buyers that meet the criteria, capped at 10,000 loans annually up until 2024/25. The Treasury funds valid claims under the National Housing Finance and Investment Corporation Act 2019 and the National Housing Finance and Investment Corporation Investment Mandate Direction 2018.
Each guarantee is issued and tracked by NHFIC, with the lenders entering the data in line with the requirements under the Scheme, into a NHFIC database. This include the purchase price, location/postcode, maturity date and the portion of the 15% being guaranteed. These data points are multiplied by a determined default rate, a determined capital growth (house price) rate and discounted by Commonwealth Treasury Bonds rates with a comparative duration. The determined default rate has been established using a combination of default data from Lenders Mortgage Insurers (LMI) and the banking industry. The determined capital growth rate has been calculated using the market data according to the location and type of property and factoring-in the consumer price index (CPI) over the forward years.
As at 30 June 2020, 9,984 places were used with 6,814 guarantee certificates issued for loans which were settled or pending settlement. 3,169 places were reserved and pending a property purchase or approvals, with 1 place released without guarantee.

115Part 4 Financial statements
44
6. F
undi
ng
This
sec
tion
iden
tifie
s th
e Tr
easu
ry fu
ndin
g st
ruct
ure.
6.
1. A
ppro
pria
tions
No
te 6
.1A:
Ann
ual A
ppro
pria
tions
('Re
cove
rabl
e G
ST e
xclu
sive
')
An
nual
App
ropr
iatio
ns fo
r 202
0
App
ropr
iatio
n A
ct
PGPA
Act
Tota
l ap
prop
riatio
n
Appr
opria
tion
appl
ied
in 2
020
(cur
rent
and
pr
ior y
ears
)
An
nual
Ap
prop
riatio
n AF
M
Sect
ion 74
Re
ceip
ts
Sect
ion
75
Tran
sfer
s Va
rianc
e1
$'00
0 $'
000
$'00
0 $'
000
$'00
0 $'
000
$'00
0 DE
PAR
TMEN
TAL
O
rdin
ary
annu
al s
ervi
ces
210,
135
-
23,8
77
- 23
4,01
2
(211
,316
) 22
,696
C
apita
l Bud
get2
10,1
60
- -
- 10
,160
(1
0,16
0)
- O
ther
ser
vice
s
Equi
ty
1,45
6
- -
- 1,
456
(1
,234
) 22
2
Tota
l dep
artm
enta
l 22
1,75
1
- 23
,877
-
245,
628
(2
22,7
10)
22,9
18
ADM
INIS
TERE
D
Ord
inar
y an
nual
ser
vice
s
Adm
inis
tere
d ite
ms
108,
399
-
- 14
,150
12
2,54
9
(113
,906
) 8,
643
O
ther
ser
vice
s
Adm
inis
tere
d as
sets
and
liabi
litie
s 16
5,00
0
- -
- 16
5,00
0
(165
,000
) -
Tota
l adm
inis
tere
d
273,
399
-
-
14,1
50
28
7,54
9
(2
78,9
06)
8,64
3
1. T
he v
aria
nce
in O
rdin
ary
annu
al s
ervi
ces
is la
rgel
y dr
iven
by
the
timin
g of
cas
h pa
ymen
ts.
2. D
epar
tmen
tal a
nd A
dmin
iste
red
Cap
ital B
udge
ts a
re a
ppro
pria
ted
thro
ugh
Appr
opria
tions
Act
s (N
o.1
and
No.
3). T
hey
form
par
t of t
he o
rdin
ary
annu
al s
ervi
ces
and
are
not s
epar
atel
y id
entif
ied
in th
e Ap
prop
riatio
n Ac
ts.

116 The Treasury Annual Report 2019–20
45
Annu
al A
ppro
pria
tions
for 2
019
A
ppro
pria
tion
Act
PG
PA A
ct
Ap
prop
riatio
n ap
plie
d in
201
9 (c
urre
nt a
nd
prio
r yea
rs)
An
nual
App
ropr
iatio
n AF
M
Sect
ion 74
Sect
ion
75
Tota
l ap
prop
riatio
n Va
rianc
e
$'00
0 $'
000
$'00
0 $'
000
$'00
0 $'
000
$'00
0 D
EPAR
TMEN
TAL
O
rdin
ary
annu
al s
ervi
ces
185,
518
-
25,0
19
- 21
0,53
7
(208
,669
) 1,
868
C
apita
l Bud
get
8,40
4
- -
- 8,
404
(8
,404
) -
Oth
er s
ervi
ces
Eq
uity
72
8
- -
- 72
8
(4,7
61)
(4,0
33)
Tota
l dep
artm
enta
l 19
4,65
0
- 25
,019
-
219,
669
(2
21,8
34)
(2,1
65)
ADM
INIS
TER
ED
O
rdin
ary
annu
al s
ervi
ces
Ad
min
iste
red
item
s 81
,996
-
- -
81,9
96
(74,
504)
7,
492
O
ther
ser
vice
s
Adm
inis
tere
d as
sets
and
liabi
litie
s 35
9,85
0
- -
- 35
9,85
0
(315
,000
) 44
,850
To
tal a
dmin
iste
red
441,
846
- -
- 44
1,84
6 (3
89,5
04)
52,3
42

117Part 4 Financial statements
46
Note 6.1B: Unspent Annual Appropriations ('Recoverable GST exclusive')
Authority 2020 2019 $'000 $'000
Departmental Appropriation Act (No. 1) 2018-19 - 56,379 Appropriation Act (No. 4) 2018-19 - Equity - 708 Supply Act (No. 1) 2019-20 - - Supply Act (No. 1) 2019-20 - DCB - - Supply Act (No. 2) 2019-20 - Equity - - Appropriation Act (No. 1) 2019-201 56,923 - Appropriation Act (No. 1) 2019-20 - DCB - - Appropriation Act (No. 2) 2019-20 - Equity 222 - Appropriation Act (No. 3) 2019-20 16,462 -
Total departmental 73,607 57,087
Authority 2020 2019 $'000 $'000
Administered Appropriation Act (No. 1) 2016-172 - 11,581 Appropriation Act (No. 2) 2016-172 - 35,000 Supply Act (No.1) 2016-172 - 1,258 Supply Act (No.2) 2016-172 - 25,000 Appropriation Act (No. 1) 2017-182 7 7 Appropriation Act (No. 2) 2017-182 60,000 60,000 Appropriation Act (No. 3) 2017-182 - 2,852 Appropriation Act (No. 1) 2018-19 - 8 Appropriation Act (No. 2) 2018-19 44,850 44,850 Appropriation Act (No. 3) 2018-19 131 7,484 Supply Act (No.1) 2019-20 - - Supply Act (No.2) 2019-20 - - Appropriation Act (No. 1) 2019-20 7,939 - Appropriation Act (No. 2) 2019-20 - - Appropriation Act (No. 3) 2019-20 5,682 - Appropriation (Coronavirus Economic Response Package) Act
(No. 1) 2019-2020 - Operating 5,030 - Total administered 123,639 188,040
1. Cash held amounts (2020: $0.651 million, 2019: $2.772 million) are included in Appropriation Act (No.1) for the relevant year. 2. 2017-18 Appropriation Acts have been repealed on 1 July 2020. 2016-17 Appropriations have been repealed on 1 July 2019.

118 The Treasury Annual Report 2019–20
47
Note 6.1C: Special Appropriations ('Recoverable GST exclusive') The following table lists current special appropriations contained in legislation that the Treasury is responsible for administering.
Authority
Appropriation applied 2020 2019 $'000 $'000
Asian Development Bank (Additional Subscription) Act 1972, s7 - - Asian Development Bank (Additional Subscription) Act 1977, s7 - - Asian Development Bank (Additional Subscription) Act 1983, s6 - - Asian Development Bank (Additional Subscription) Act 1995, s6 - - Asian Development Bank (Additional Subscription) Act 2009, s6 (25,467) (24,765) Asian Development Bank Act 1966, s4 - - Asian Infrastructure Investment Bank Act 2015, s7 (215,376) (200,870) Australian Business Growth Fund (Coronavirus Economic Response Package) Act 2020, s18 - - Banking Act 1959, s69(8) - - Commonwealth Places (Mirror Taxes) Act 1998, s23(4) (593,240) (607,237) European Bank for Reconstruction and Development Act 1990, s4 - - Federal Financial Relations Act 2009, s22 (93,086,036) (90,462,218) Financial Agreements (Commonwealth Liability) Act 1932, s4(3) - - Guarantee of State and Territory Borrowing Appropriation Act 2009, s5 - - Guarantee of Lending to Small and Medium Enterprises (Coronavirus Economic Response Package) Act 2020, s6 - - Guarantee Scheme for Large Deposits and Wholesale Funding Appropriation Act 2008, s5 - - International Bank for Reconstruction and Development (General Capital Increase) Act 1989, s6 - - International Bank for Reconstruction and Development (Share Increase) Act 1988, s5(1) - - International Finance Corporation Act 1955 - - International Financial Institutions (Share Increase) Act 1982, s7(1) - - International Financial Institutions (Share Increase) Act 1986, s7(1) - - International Monetary Agreements Act 1947, s5a(6) - - International Monetary Agreements Act 1947, s7(3) (320,000) - International Monetary Agreements Act 1947, s7(4) - - International Monetary Agreements Act 1947, s8 (48,204) (61,823) International Monetary Agreements Act 1947, s8A - - International Monetary Agreements Act 1947, s8B(2) - - International Monetary Agreements Act 1947, s8C(3) - - International Monetary Agreements Act 1947, s8CAA(2) - - International Monetary Agreements Act 1947, s8CA(4) - - International Monetary Agreements Act 1947, s9 - - International Monetary Agreements Act 1960, s4 - - International Monetary Agreements Act 1974, s6 - - Medicare Guarantee Act 2017, s18 (37,961,055) (36,233,451) Multilateral Investment Guarantee Agency Act 1997, S4 - - National Housing Finance and Investment Corporation Act 2018, s47A (311,860) (15,323) Papua New Guinea Loans Guarantee Act 1975, s4 - - Public Governance, Performance and Accountability Act 2013, s77 (14) - State Grants Act 1927, s7 - - Superannuation Industry (Supervision) Act 1993, s231(4) - - Terrorism Insurance Act 2003, s37, s42(3) - - Total (132,561,252) (127,605,687)

119Part 4 Financial statements
48
Note
6.1
D: D
iscl
osur
e by
age
nt in
rela
tion
to A
nnua
l and
Spe
cial
App
ropr
iatio
ns ('
Rec
over
able
GST
exc
lusi
ve')
De
partm
ent o
f Edu
catio
n D
epar
tmen
t of A
gric
ultu
re
an
d Tr
aini
ng
and
Wat
er R
esou
rces
Paym
ents
to th
e St
ates
and
Ter
ritor
ies:
Pa
ymen
ts to
the
Stat
es a
nd T
errit
orie
s:
ed
ucat
ion
serv
ices
W
ater
for t
he E
nviro
nmen
t Spe
cial
Acc
ount
20
20
$'00
0 $'
000
Tota
l rec
eipt
s 23
,739
,808
5,
172
To
tal p
aym
ents
23
,739
,808
5,
172
De
partm
ent o
f Edu
catio
n D
epar
tmen
t of A
gric
ultu
re
an
d Tr
aini
ng
and
Wat
er R
esou
rces
Paym
ents
to th
e St
ates
and
Ter
ritor
ies:
Pa
ymen
ts to
the
Stat
es a
nd T
errit
orie
s:
ed
ucat
ion
serv
ices
W
ater
for t
he E
nviro
nmen
t Spe
cial
Acc
ount
20
19
$'00
0 $'
000
Tota
l rec
eipt
s 20
,963
,520
81
5
Tota
l pay
men
ts
20,9
63,5
20
815
To
tal r
ecei
pts
and
Tota
l pay
men
ts a
re m
ade
thro
ugh
the
Trea
sury
on
beha
lf of
oth
er C
omm
onw
ealth
ent
ities
to S
tate
and
Ter
ritor
y Tr
easu
ries
unde
r the
CO
AG
Arra
ngem
ents
.

120 The Treasury Annual Report 2019–20
49
6.2.
Spe
cial
Acc
ount
s No
te 6
.2A:
Spe
cial
Acc
ount
s ('R
ecov
erab
le G
ST e
xclu
sive
')
NH
FIC
Spec
ial A
ccou
nt1
Med
icar
e G
uara
ntee
Fu
nd (T
reas
ury)
Spe
cial
Ac
coun
t2 Fu
el In
dexa
tion
Spec
ial
Acco
unt3
COAG
Ref
orm
Fun
d Sp
ecia
l Acc
ount
4
Serv
ices
for O
ther
En
titie
s an
d Tr
ust M
oney
Sp
ecia
l Acc
ount
5
20
20
2019
20
20
2019
20
20
2019
20
20
2019
20
20
2019
$'
000
$'00
0 $'
000
$'00
0 $'
000
$'00
0 $'
000
$'00
0 $'
000
$'00
0 Ba
lanc
e br
ough
t for
war
d fr
om p
revi
ous
perio
d 23
9,67
7
- -
- -
- -
- -
- In
crea
ses
Appr
opria
tion
for r
epor
ting
perio
d 31
0,00
0
105,
000
37
,961
,055
36
,233
,451
73
0,00
0
557,
000
8,
647,
666
10
,161
,299
-
- O
ther
rece
ipts
21
2,00
0
150,
000
-
- -
- 2,
322,
278
2,
816,
418
-
1,76
2
Tota
l inc
reas
es
522,
000
25
5,00
0
37,9
61,0
55
36,2
33,4
51
730,
000
55
7,00
0
10,9
69,9
44
12,9
77,7
17
- 1,
762
Av
aila
ble
for p
aym
ents
76
1,67
7
255,
000
37
,961
,055
36
,233
,451
73
0,00
0
557,
000
10
,969
,944
12
,977
,717
-
1,76
2
Decr
ease
s
Ad
min
iste
red
Paym
ents
mad
e to
Sta
tes
and
Terri
torie
s -
- -
- -
- (1
0,96
9,94
4) (
12,9
77,7
17)
- -
Paym
ents
mad
e to
oth
er
entit
ies
(311
,860
) (1
5,32
3)
- -
- -
- -
- (1
,762
) Tr
ansf
ers
mad
e to
Med
icar
e G
uara
ntee
Fun
d (H
ealth
) Sp
ecia
l Acc
ount
-
- (3
7,96
1,05
5) (
36,2
33,4
51)
- -
- -
- -
Tran
sfer
mad
e to
CO
AG
Ref
orm
Fun
d Sp
ecia
l Acc
ount
-
- -
- (7
30,0
00)
(557
,000
) -
- -
- To
tal a
dmin
iste
red
(311
,860
) (1
5,32
3) (
37,9
61,0
55)
(36,
233,
451)
(7
30,0
00)
(557
,000
) (1
0,96
9,94
4) (
12,9
77,7
17)
- (1
,762
) To
tal d
ecre
ases
(3
11,8
60)
(15,
323)
(37
,961
,055
) (3
6,23
3,45
1)
(730
,000
) (5
57,0
00)
(10,
969,
944)
(12
,977
,717
) -
(1,7
62)
Tota
l bal
ance
car
ried
to th
e ne
xt p
erio
d 44
9,81
7
239,
677
-
- -
- -
- -
- Ba
lanc
e re
pres
ente
d by
C
ash
held
in O
ffici
al P
ublic
Ac
coun
t 44
9,81
7
239,
677
-
- -
- -
- -
- To
tal b
alan
ce c
arrie
d to
the
next
per
iod
449,
817
23
9,67
7
- -
- -
- -
- -

121Part 4 Financial statements
1. Appropriation: Public Governance, Performance and Accountability Act 2013, section 80.
Establishing instrument: National Housing Finance and Investment Corporation Act 2018, section 47.A
Purpose: To secure funding for the establishment and operation of NHFIC’s Affordable Housing Bond Aggregator (AHBA), which is to improve housing outcomes by providing cheaper and longer-term secured loan finance for community housing providers. NHFIC can access this funding through submitting an Utilisation Request to gain access to the funding at the Commonwealth cost of borrowing rate (up to the annual limit as outlined below).
The Commonwealth must credit the Account amounts equal to the following:
a. (a) $105 million, to be credited on the day this section commences;
b. (b) $310 million, to be credited on 1 July 2019;
c. (c) $270 million, to be credited on 1 July 2020;
d. (d) $165 million, to be credited on 1 July 2021; and each amount paid to the Commonwealth by the NHFIC (principal), on or after the day this section commences, that:
i. (i) is a repayment of money debited from the Account, or of other money lent by the Commonwealth to the NHFIC; and
i. (ii) is paid in accordance with the Investment Mandate.
Any principal repayment to the Commonwealth through this Account, may be “recycled” and the amount re-issued. Interest is used to cover the Commonwealth’s cost of borrowing and cannot be “recycled’.
2. Appropriation: Public Governance, Performance and Accountability Act 2013, section 80.
Establishing instrument: Medicare Guarantee Act 2017, section 6.
Purpose: The Medicare Guarantee Act 2017 (the Act) is to secure ongoing funding of the Medical Benefits Schedule (MBS) and Pharmaceutical Benefits Scheme (PBS).
The Act establishes the Medicare Guarantee Fund (MGF), which consists of the Medicare Guarantee Fund (Treasury) Special account (Treasury Special Account) and the Medicare Guarantee Fund (Health) Special Account (Health Special Account). The Treasury Special Account
is administered by the Department of the Treasury and the Health Special Account is administered by the Department of Health.
3. Appropriation: Public Governance, Performance and Accountability Act 2013, section 80.
Establishing instrument: Fuel Indexation (Road Funding) Special Account Act 2015, subsection 8(1).
Purpose: To ensure that amounts equal to the net revenue from indexation on customs and excise duties on fuel are transferred to the COAG Reform Fund in order to provide funding to the States and Territories for expenditure in relation to Australian road infrastructure investment.
4. Appropriation: Public Governance, Performance and Accountability Act 2013, section 80.
Establishing instrument: COAG Reform Fund Act 2008, section 5.
Purpose: For the making of grants of financial assistance to the States and Territories.
Note: The Treasury makes payments to the States and Territories from the COAG Reform Fund special account based on information provided by other Government departments that have policy and program implementation responsibility.
5. Appropriation: Public Governance, Performance and Accountability Act 2013, section 80.
Establishing instrument: Establishment of SOTEM Special Account — Treasury Determination 2012/09.
Purpose: To disburse amounts held on trust for the benefit of a person other than the Commonwealth or in connection with services performed on or behalf of other governments and bodies.
Note: Receipt relates to funding received and held on trust for the Global Infrastructure Hub.
Financial System Stability Special Account (Administered)The Treasury’s ‘Financial System Stability’ special account established under section 70E of the Banking Act 1959 for the making of payments authorised under specified sections of the Banking Act 1959, the Insurance Act 1973 and the Life Insurance Act 1995 and to meet expenses of administering the special account. For the years ended 30 June 2019 and 30 June 2020 this special account had nil balances and no transactions were credited or debited to the account.

122 The Treasury Annual Report 2019–20
51
7. Managing uncertainties This section analyses how the Treasury manages financial risks within its operating environment. 7.1. Departmental Contingent Assets and Liabilities Quantifiable Contingencies Contingent liabilities are nil in 2020 (2019: $105,026). There were no quantifiable contingent assets in 2020 (2019: nil). Contingent liabilities and contingent assets Contingent liabilities and contingent assets are not recognised in the statement of financial position but are reported in the notes. They may arise from uncertainty as to the existence of a liability or asset, or represent an asset or liability in respect of which the amount cannot be reliably measured. Contingent assets are disclosed when settlement is probable but not virtually certain and contingent liabilities are disclosed when the probability of settlement is greater than remote.
7.2. Administered Contingent Assets and Liabilities Quantifiable administered contingencies Quantifiable administered contingencies that are not remote are disclosed in the schedule of administered items as quantifiable administered contingencies. Commitments under expanded IMF New Arrangements to Borrow (NAB) Australia has made a line of credit available to the International Monetary Fund (IMF) under its New Arrangements to Borrow (NAB) since 1998. This is a contingent loan to help ensure that the IMF has the resources available to maintain stability and support recovery in the global economy. The value of Australia’s NAB credit arrangement stands at approximately 2.22 billion Special Drawing Rights (SDR, the IMF’s unit of account) (approximately A$4.46 billion at 30 June 2020). In November 2017, the NAB was renewed for an additional five year period until November 2022. The Fund does not publish annual estimates of the amount it expects to call under the NAB facility. However, to be drawn upon, the NAB needs to be activated by the IMF Executive Board. The last NAB activation period was terminated in February 2016.The IMF did not call on Australia’s NAB facility in 2019-20 and, as at the completion of these statements, has not done so in the current year. IMF Bilateral Borrowing Arrangement (BBA) In addition to the NAB credit line as part of a broad international effort to increase the resources available to the IMF, Australia has made available an SDR4.61billion (approximately A$9.27 billion at 30 June 2020) contingent bilateral loan to the IMF. The contingent loan is on terms consistent with separate bilateral loan and note purchase agreements between the IMF and all contributing countries. It will be drawn upon by the IMF only if needed to supplement the IMF’s quota and NAB resources and any loans would be repaid in full with interest. Australia’s three-year bilateral borrowing arrangement with the IMF was created in 2016 and agreed in 2019 to be extended by a year to conclude on 31 December 2020. International financial institutions — uncalled capital subscriptions The Australian Government has held an uncalled capital subscription to the International Bank for Reconstruction and Development (IBRD) since 1947. Australia’s uncalled capital subscription to the IBRD totals US$3.6 billion (estimated value A$5.2 billion as at 30 June 2020). The Australian Government has also held an uncalled capital subscription to the European Bank for Reconstruction and Development (EBRD) since 1991. Australia’s uncalled capital subscription to the EBRD totals EUR237.5 million (estimated value A$388.7 million as at 30 June 2020). The Australian Government has further held an uncalled capital subscription to the Asian Development Bank (ADB) since 1966. Australia’s uncalled capital subscription to the ADB totals US$7.0 billion (estimated value A$10.3 billion as at 30 June 2020). The Australian Government has further held an uncalled capital subscription to the Multilateral Investment Guarantee Agency of US$26.5 million (estimated value A$38.5 million as at 30 June 2020).

123Part 4 Financial statements
52
The Asian Infrastructure Investment Bank (AIIB) was established on 25 December 2015. The Australian Government has subscribed to shares in the AIIB, which includes an uncalled capital subscription. Australia’s uncalled capital subscription to the AIIB totals US$2.9 billion (estimated value A$4.3 billion as at 30 June 2020). None of these international financial institutions have ever drawn on Australia’s uncalled capital subscriptions. Loan to New South Wales for James Hardie Asbestos Injuries Compensation Fund The Commonwealth has agreed to lend up to $160 million to the State Government of New South Wales (NSW) to support the loan facility to top up the James Hardie Asbestos Injuries Compensation Fund. Draw down on the loan is subject to the James Hardie Asbestos Injuries Compensation Fund requiring funds to meet its liabilities and is contingent on NSW meeting a number of conditions under the loan agreement with the Australian Government. The timing and amounts that may be drawn down by NSW cannot be determined accurately. No new loans were provided to the State Government of NSW in respect of the loan facility in 2019-20 (2018-19: nil). Unquantifiable administered contingencies Contingent Liabilities Housing Loans Insurance Corporation (HLIC)
The Australian Government sold HLIC on 12 December 1997 and has assumed all residual contingencies. The contingent liability relates to the HLIC’s contracts of mortgage insurance to the time of sale. Any potential economic outflow cannot be determined accurately given the complexity of any estimation calculation of the economic outflow would be reliant upon numerous unquantifiable variables. Only at the time of the event, can the amount of economic outflow be determined accurately.
Terrorism insurance — Australian Reinsurance Pool Corporation
The Terrorism Insurance Act 2003 established a scheme for terrorism insurance covering damage to commercial property, including associated business interruption and public liability. The Australian Reinsurance Pool Corporation (ARPC) uses reinsurance premiums paid by insurers to meet its administrative expenses, to maintain a pool of funds and to purchase reinsurance to help meet future claims. The Commonwealth guarantees to pay any liabilities of the ARPC, but the Treasurer must declare a reduced payout rate to insured entities if the Government’s liability would otherwise exceed $10 billion.
Guarantee by Commonwealth — NHFIC
NHFIC was established under the National Housing Finance and Investment Corporation Act 2018 to perform the functions under Section 8 of the Act. NHFIC’s operations are funded by the Commonwealth (refer to Notes 4.1.C, 5.1A and 5.1C) and by raising finance through the issuance of bonds into the commercial market. As NHFIC is in the early stages of development, the Commonwealth Government has provided a guarantee capped at $2 billion to further encourage the commercial market to invest in NHFIC-issued bonds. The Treasurer may, by legislative instrument, set a date that the guarantee is effective to, but not earlier than, 1 July 2023. Under the National Housing Finance and Investment Corporation Investment Mandate Direction 2018, the Treasurer and Minister for Finance may also adjust the cap through a legislative act.
Loans to NHFIC’s Affordable Housing Bond Aggregator (AHBA)
The Commonwealth has agreed to make available amounts incrementally over the next 5 years of up to $1 billion to NHFIC’s AHBA via a loan, as outlined in Note 6.2 Special accounts. Under the AHBA Loan Agreement with the Treasury, NHFIC can access the funds by completing a Utilisation Request and providing this to Treasury. Interest is to be charged on each individual loan at the Commonwealth’s cost of borrowing.
The timing and amounts of potential drawdowns by NHFIC cannot be determined accurately. An additional complexity is the ‘recycling’ of funds repaid or prepaid by NHFIC, which can be re-borrowed by NHFIC.
The closing balance of AHBA loan drawdown is disclosed in Note 5.1B and any unused amount available at 30 June 2020 has been recorded in Note 5.1A Cash and cash equivalents and Note 6.2 Special accounts.
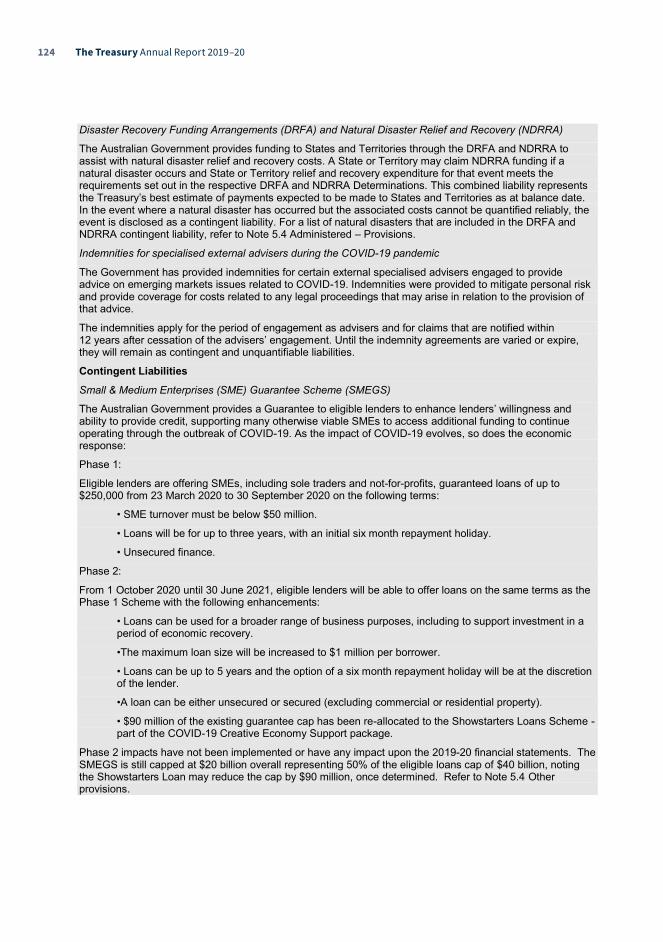
124 The Treasury Annual Report 2019–20
53
Disaster Recovery Funding Arrangements (DRFA) and Natural Disaster Relief and Recovery (NDRRA)
The Australian Government provides funding to States and Territories through the DRFA and NDRRA to assist with natural disaster relief and recovery costs. A State or Territory may claim NDRRA funding if a natural disaster occurs and State or Territory relief and recovery expenditure for that event meets the requirements set out in the respective DRFA and NDRRA Determinations. This combined liability represents the Treasury’s best estimate of payments expected to be made to States and Territories as at balance date. In the event where a natural disaster has occurred but the associated costs cannot be quantified reliably, the event is disclosed as a contingent liability. For a list of natural disasters that are included in the DRFA and NDRRA contingent liability, refer to Note 5.4 Administered – Provisions.
Indemnities for specialised external advisers during the COVID-19 pandemic
The Government has provided indemnities for certain external specialised advisers engaged to provide advice on emerging markets issues related to COVID-19. Indemnities were provided to mitigate personal risk and provide coverage for costs related to any legal proceedings that may arise in relation to the provision of that advice.
The indemnities apply for the period of engagement as advisers and for claims that are notified within 12 years after cessation of the advisers’ engagement. Until the indemnity agreements are varied or expire, they will remain as contingent and unquantifiable liabilities.
Contingent Liabilities Small & Medium Enterprises (SME) Guarantee Scheme (SMEGS)
The Australian Government provides a Guarantee to eligible lenders to enhance lenders’ willingness and ability to provide credit, supporting many otherwise viable SMEs to access additional funding to continue operating through the outbreak of COVID-19. As the impact of COVID-19 evolves, so does the economic response:
Phase 1:
Eligible lenders are offering SMEs, including sole traders and not-for-profits, guaranteed loans of up to $250,000 from 23 March 2020 to 30 September 2020 on the following terms:
• SME turnover must be below $50 million.
• Loans will be for up to three years, with an initial six month repayment holiday.
• Unsecured finance.
Phase 2:
From 1 October 2020 until 30 June 2021, eligible lenders will be able to offer loans on the same terms as the Phase 1 Scheme with the following enhancements:
• Loans can be used for a broader range of business purposes, including to support investment in a period of economic recovery.
•The maximum loan size will be increased to $1 million per borrower.
• Loans can be up to 5 years and the option of a six month repayment holiday will be at the discretion of the lender.
•A loan can be either unsecured or secured (excluding commercial or residential property).
• $90 million of the existing guarantee cap has been re-allocated to the Showstarters Loans Scheme - part of the COVID-19 Creative Economy Support package.
Phase 2 impacts have not been implemented or have any impact upon the 2019-20 financial statements. The SMEGS is still capped at $20 billion overall representing 50% of the eligible loans cap of $40 billion, noting the Showstarters Loan may reduce the cap by $90 million, once determined. Refer to Note 5.4 Other provisions.

125Part 4 Financial statements
54
Contingent Assets
HIH Claims Support Scheme (HCSS) As an insured creditor in the liquidation of the HIH Group, the Australian Government is entitled to payments arising from the HCSS’s position in the Proof of Debt of respective HIH companies. The Treasury has received payments from the HIH Estate during 2019-20; however the timing and amount of future payments are unknown and will depend on the outcome of the estimation process and the completion of the liquidation of the HIH Group. Burden sharing in the International Monetary Fund remuneration Since 1986, the IMF has used its burden sharing mechanism to make up for the loss of income from unpaid charges on the loans of debtor members. Under burden sharing, temporary financing in equal amounts is obtained from debtor and creditor members by increasing the rate of charge and reducing the rate of remuneration, respectively, to (1) cover shortfalls in the IMF’s regular income from unpaid charges (“deferred charges”) and (2) accumulate precautionary balances against possible credit default in a contingent account, the Special Contingent Account (SCA-1). SCA-1 accumulations were suspended effective November 1, 2006. Due to the inherent uncertainty around shortfalls in IMF income, burden sharing contributions represent a contingent asset that cannot be reliably measured and as such is recorded as an unquantifiable contingent asset.

126 The Treasury Annual Report 2019–20
55
7.3. Financial Instruments
2020 2019 $'000 $'000 Note 7.3A: Categories of Financial Instruments Financial assets at amortised cost
Cash and cash equivalents 651 2,772 Trade and other receivables - Good and services receivables 4,980 2,715 Trade and other receivables - Other receivables 820 424
Total financial assets at amortised cost 6,451 5,911 Financial Liabilities Financial liabilities measured at amortised cost
Suppliers 10,775 8,498 Other payables 2,920 3,511
Total financial liabilities measured at amortised cost 13,695 12,009 Total financial liabilities 13,695 12,009
Accounting Policy Financial assets The Treasury classifies its financial assets in the following categories: a) financial assets at fair value through profit or loss; b) financial assets at fair value through other comprehensive income; and c) financial assets measured at amortised cost. The classification depends on both the Treasury's business model for managing the financial assets and contractual cash flow characteristics at the time of initial recognition. Financial assets are recognised when the Treasury becomes a party to the contract and, as a consequence, has a legal right to receive or a legal obligation to pay cash and derecognised when the contractual rights to the cash flows from the financial asset expire or are transferred upon trade date. Financial Assets at Amortised Cost Financial assets included in this category need to meet two criteria: 1. the financial asset is held in order to collect the contractual cash flows; and 2. the cash flows are solely payments of principal and interest (SPPI) on the principal outstanding amount. Amortised cost is determined using the effective interest method. Effective Interest Method Income is recognised on an effective interest rate basis for financial assets that are recognised at amortised cost. Financial Assets at Fair Value Through Other Comprehensive Income (FVOCI) Financial assets classified as at fair value through other comprehensive income are held with the objective of both collecting contractual cash flows and selling the financial assets and the cash flows meet the SPPI test. Any gains or losses as a result of fair value measurement or the recognition of an impairment loss allowance is recognised in other comprehensive income. Financial Assets at Fair Value Through Profit or Loss (FVTPL) Financial assets are classified as financial assets at fair value through profit or loss where the financial assets either doesn't meet the criteria of financial assets held at amortised cost or at FVOCI (i.e. mandatorily held at FVTPL) or may be designated. Financial assets at FVTPL are stated at fair value, with any resultant gain or loss recognised in profit or loss. The net gain or loss recognised in profit or loss incorporates any interest earned on the financial asset.

127Part 4 Financial statements
56
Impairment of Financial Assets Financial assets are assessed for impairment at the end of each reporting period based on expected credit losses, using the general approach which measures the loss allowance based on an amount equal to lifetime expected credit losses where risk has significantly increased, or an amount equal to 12-month expected credit losses if risk has not increased. The simplified approach for trade, contract and lease receivables is used. This approach always measures the loss allowance as the amount equal to the lifetime expected credit losses. A write-off constitutes a derecognition event where the write-off directly reduces the gross carrying amount of the financial asset. Financial liabilities Financial liabilities are classified as either financial liabilities ‘at fair value through profit or loss’ or other financial liabilities. Financial liabilities are recognised and derecognised upon ‘trade date’. Financial Liabilities at Fair Value Through Profit or Loss Financial liabilities at fair value through profit or loss are initially measured at fair value. Subsequent fair value adjustments are recognised in profit or loss. The net gain or loss recognised in profit or loss incorporates any interest paid on the financial liability. Financial Liabilities at Amortised Cost Financial liabilities at amortised cost, including borrowings, are initially measured at fair value, net of transaction costs. These liabilities are subsequently measured at amortised cost using the effective interest method, with interest expense recognised on an effective interest basis. Supplier and other payables are recognised at amortised cost. Liabilities are recognised to the extent that the goods or services have been received (and irrespective of having been invoiced).

128 The Treasury Annual Report 2019–20
57
7.4. Administered - Financial Instruments
2020 2019 $'000 $'000 Note 7.4A: Categories of Financial Instruments Financial assets at amortised cost
Cash and cash equivalents 449,817 239,677 IMF related monies owing 320 2,447 IMF new arrangements to borrow loan 213,060 311,738 Loans to States and Territories 47,855 47,855 Loans to NHFIC 115,183 15,323 Dividends receivable 2,563,000 1,685,000 Accrued interest - Loans to NHFIC 53 38 GST Revenue allocations and COAG refundable 5,174,947 470,268 Other receivables 190 2
Total assets at amortised cost 8,564,425 2,772,348 Financial assets at fair value through other comprehensive income
International financial institutions 2,670,472 1,961,467 Australian Government entities 30,426,751 28,964,321 Commonwealth companies 1,436 1,174 IMF Quota 13,213,510 13,027,552
Total assets at fair value through other comprehensive income 46,312,169 43,954,514 Financial assets at fair value through profit or loss
Guarantee of State and Territory Borrowing contractual fee receivable 3,658 6,169
Total assets at fair value through profit or loss 3,658 6,169 Total financial assets 54,880,252 46,733,031 Financial Liabilities Financial liabilities measured at amortised cost:
Promissory notes 10,051,022 9,988,269 Grant liabilities 126,753 156,043 IMF SDR allocation liability 6,198,575 6,111,340 Other payables 8,685 11,232 IMF Maintenance of Value 648,787 406,863
Total financial liabilities measured at amortised cost 17,033,822 16,673,747 Financial liabilities measured at fair value through profit or loss:
Guarantee of State and Territory Borrowing contractual guarantee service obligation 3,658 6,169
Total financial liabilities measured at fair value through profit or loss 3,658 6,169 Total financial liabilities 17,037,480 16,679,916

129Part 4 Financial statements
58
2020 2019 $'000 $'000 Note 7.4B: Net Gains and Losses on Financial Assets Financial assets at amortised cost
Interest revenue 5,643 6,306 Exchange gains/(loss) 8,112 14,754
Net gains/(losses) on financial assets at amortised cost 13,755 21,060 Financial assets at fair value through other comprehensive income
Interest revenue 9,954 10,666 Exchange gains/(loss) 179,422 622,269
Net gains/(losses) on financial assets at fair value through other comprehensive income 189,376 632,935 Financial assets at fair value through profit and loss
Guarantee of State and Territory Borrowing fee 2,462 6,011 Net gains/(losses) on financial assets at fair value through other comprehensive income 2,462 6,011 Net gains/(losses) on financial assets 205,593 660,006
2020 2019 $'000 $'000 Note 7.4C: Net Gains and Losses on Financial Liabilities Financial liabilities measured at amortised cost
IMF Charges 37,577 64,000 Exchange gains/(loss) (736,022) (657,775)
Net gains/(losses) on financial liabilities measured (698,445) (593,775) at amortised cost
Net gains/(losses) on financial liabilities (698,445) (593,775)
Note 7.4D: Credit risk The maximum exposure to credit risk of the Treasury’s administered financial assets is the carrying amount of ‘loans and receivables’ (2020: $8.1 billion and 2019: $2.5 billion) and the carrying amount of ‘equity accounted instruments’ (2020: $47.1 billion and 2019: $44.0 billion – ‘available for sale’ financial assets). The Treasury has performed assessments using historical data, financial statement data (audited and unaudited) and forward-looking data, including credit ratings, for transactions with other entities within the Commonwealth Government, other State and Territories governments and international financial institutions including the IMF. Based on the assessments, there is no indication that a significant increase in expected credit loss over next 12 months, or the lifetime of these transactions, will occur. International financial institutions (including the IMF), NHFIC and other Commonwealth entities that the Treasury holds its financial assets with, have a minimum AAA credit rating. The contractual fee receivable from the Guarantee of State and Territory Borrowing relates to State and Territory governments. These entities hold a minimum AA credit rating. Therefore, the Treasury does not consider any of its financial assets to be at risk of default. Further detail is provided in the Accounting Policy for Administered Financial Instruments.

130 The Treasury Annual Report 2019–20
59
No
te 7
.4E:
Liq
uidi
ty ri
sk
The
Trea
sury
’s a
dmin
iste
red
finan
cial
liab
ilitie
s ar
e pr
omis
sory
not
es, g
rant
liab
ilitie
s an
d th
e IM
F SD
R a
lloca
tion.
The
con
tract
ual g
uara
ntee
ser
vice
ob
ligat
ion
aris
ing
from
the
guar
ante
e sc
hem
e fo
r Sta
te a
nd T
errit
ory
borro
win
g is
not
incl
uded
as
ther
e is
no
liqui
dity
risk
ass
ocia
ted
with
this
item
. It i
s co
ntin
gent
on
the
valu
e of
the
asso
ciat
ed c
ontra
ctua
l fee
rece
ivab
le. T
he e
xpos
ure
to li
quid
ity ri
sk is
bas
ed o
n th
e no
tion
that
the
Trea
sury
will
enco
unte
r di
fficu
lty in
mee
ting
its o
blig
atio
ns a
ssoc
iate
d w
ith a
dmin
iste
red
finan
cial
liab
ilitie
s. T
his
is h
ighl
y un
likel
y du
e to
app
ropr
iatio
n fu
ndin
g th
roug
h sp
ecia
l ap
prop
riatio
ns a
nd n
on-la
psin
g ca
pita
l app
ropr
iatio
ns a
s w
ell a
s in
tern
al p
olic
ies
and
proc
edur
es p
ut in
pla
ce to
ens
ure
ther
e ar
e ap
prop
riate
reso
urce
s fo
r th
e Tr
easu
ry to
mee
t its
fina
ncia
l obl
igat
ions
. Th
e fo
llow
ing
tabl
es il
lust
rate
the
mat
uriti
es fo
r non
-der
ivat
ive
finan
cial
liab
ilitie
s:
Mat
uriti
es fo
r fin
anci
al li
abili
ties
in
2020
On
With
in 1
1
to 2
2
to 5
>
5
de
man
d ye
ar
year
s ye
ars
year
s To
tal
$'
000
$'00
0 $'
000
$'00
0 $'
000
$'00
0 Pr
omis
sory
not
es
- -
- -
10,0
51,0
22
10,0
51,0
22
Gra
nt li
abilit
ies
- 12
6,75
3
- -
- 12
6,75
3
IMF
SDR
allo
catio
n lia
bilit
ies
- -
- -
6,19
8,57
5
6,19
8,57
5
Oth
er p
ayab
les
649,
480
-
- -
- 64
9,48
0
Tota
l 64
9,48
0
126,
753
-
- 16
,249
,597
17
,025
,830
M
atur
ities
for f
inan
cial
liab
ilitie
s in
201
9
On
With
in 1
1
to 2
2
to 5
>
5
de
man
d ye
ar
year
s ye
ars
year
s To
tal
$'
000
$'00
0 $'
000
$'00
0 $'
000
$'00
0 Pr
omis
sory
not
es
- 25
,468
-
- 9,
962,
801
9,
988,
269
G
rant
liab
ilitie
s -
156,
043
-
- -
156,
043
IM
F SD
R a
lloca
tion
liabi
litie
s -
- -
- 6,
111,
340
6,
111,
340
O
ther
pay
able
s 41
8,09
5
- -
- -
418,
095
To
tal
418,
095
18
1,51
1
- -
16,0
74,1
41
16,6
73,7
47

131Part 4 Financial statements
60
Note 7.4F: Market risk Foreign currency risk refers to the risk that the fair value or future cash flows of a financial instrument will fluctuate due to changes in foreign exchange rates. The Treasury is exposed to foreign exchange currency risk primarily through undertaking certain transactions denominated in foreign currency. The Treasury is exposed to foreign currency denominated in USD, EUR and SDR. The following table details the effect on profit and equity as at 30 June 2020 from a 8.4 per cent (30 June 2019 from a 8.7 per cent) favourable/unfavourable change in AUD against the Treasury with all other variables held constant. The change in the risk variable has been determined by reference to standard parameters provided by the Department of Finance. Sensitivity analysis of the risk that the entity is exposed to for 2020 Effect on
Risk variable Change in
risk Net cost of
services Net assets variable 2020 2020 Risk Variable % $'000 $'000 IFI Investments Exchange rate 8.4 (207,164) (207,164) IFI investments Exchange rate (8.4) 245,209 245,209 IMF Remuneration Receivable Exchange rate 8.4 (25) (25) IMF Remuneration Receivable Exchange rate (8.4) 29 29 IMF new arrangements to borrow loan Exchange rate 8.4 (16,528) (16,528) IMF new arrangements to borrow loan Exchange rate (8.4) 19,564 19,564 IMF Quota Exchange rate 8.4 (1,025,050) (1,025,050) IMF Quota Exchange rate (8.4) 1,213,294 1,213,294 Promissory notes Exchange rate 8.4 (5,020) (5,020) Promissory notes Exchange rate (8.4) 5,941 5,941 IMF SDR allocation liability Exchange rate 8.4 (480,860) (480,860) IMF SDR allocation liability Exchange rate (8.4) 569,167 569,167 IMF Charges Payable Exchange rate 8.4 (54) (54) IMF Charges Payable Exchange rate (8.4) 64 64 Sensitivity analysis of the risk that the entity is exposed to for 2019 Effect on
Risk variable Change in
Risk Net cost of
services Net assets variable 2019 2019 Risk Variable % $'000 $'000 IFI Investments Exchange rate 8.7 (156,990) (156,990) IFI investments Exchange rate (8.7) 186,909 186,909 IMF Remuneration Receivable Exchange rate 8.7 (196) (196) IMF Remuneration Receivable Exchange rate (8.7) 233 233 IMF new arrangements to borrow loan Exchange rate 8.7 (24,951) (24,951) IMF new arrangements to borrow loan Exchange rate (8.7) 29,706 29,706 IMF Quota Exchange rate 8.7 (1,042,684) (1,042,684) IMF Quota Exchange rate (8.7) 1,241,399 1,241,399 Promissory notes Exchange rate 8.7 (5,068) (5,068) Promissory notes Exchange rate (8.7) 6,034 6,034 IMF SDR allocation liability Exchange rate 8.7 (489,132) (489,132) IMF SDR allocation liability Exchange rate (8.7) 582,351 582,351 IMF Charges Payable Exchange rate 8.7 (904) (904) IMF Charges Payable Exchange rate (8.7) 1,076 1,076

132 The Treasury Annual Report 2019–20
61
Accounting Policy Administered financial instruments AASB 9 identifies three classifications for financial instruments - those measured at (a) amortised cost; (b) fair value through other comprehensive income (FVOCI); and (c) fair value through profit or loss (FVPL).
A financial asset shall be classified as at amortised cost if the financial asset is held within a business model to collect contractual cash flows and that the contractual terms of the financial asset give rise on specified dates to cash flows that are solely payments of principal and interest on the principal amount outstanding.
With the exception of dividends receivable, which is measured at fair value, financial assets at amortised cost are initially recognised at fair value and subsequently measured using the effective interest method. Financial assets at amortised cost include:
• IMF-related monies receivable; • Loans to the IMF under the new arrangements to borrow; • Loans to NHFIC; • Loans to States and Territories; and • Dividends receivable.
A financial asset shall be classified as at FVOCI when the financial asset is held within a business model to collect contractual cash flows and to sell the financial asset. In addition, the Department of Finance has mandated that all equity instruments must be recorded as FVOCI.
Financial assets recorded at FVOCI are initially measured at cost and subsequently measured at fair value and include:
• Investments in development banks; • The IMF quota; and • Investments in Government entities.
Financial liabilities shall be classified as at amortised cost except for financial guarantee contracts.
Financial liabilities at amortised cost are initially measured at fair value and subsequently measured using the effective interest rate method. Financial liabilities at amortised cost include:
• SDR allocation; • Promissory notes; and • IMF related monies payable.
The contractual terms of promissory notes are non-interest bearing making the effective interest rate nil. Therefore, the measurement would be the initial value less any repayments plus or minus movements in exchange rates as a result of translation on the balance date.
The Treasury’s administered financial guarantee contracts relate to components of the Guarantee of State and Territory Borrowings and are classified as financial liabilities at fair value through profit or loss. They are not treated as contingent liabilities, as they are regarded as financial instruments outside the scope of AASB 137 Provisions, Contingent Liabilities and Contingent Assets.
Recognition of these amounts only relates to fee revenue aspects of the financial guarantee contracts. These amounts do not reflect any expected liability under the Guarantee Scheme itself as these are considered remote and unquantifiable. Administered contingent liabilities and assets are disclosed at Note 7.2 Administered Contingent Assets and Liabilities.

133Part 4 Financial statements
62
7.5. Fair Value Measurement Note 7.5A: Fair value measurement
Fair value measurements at the end of
the reporting period 2020 2019 $'000 $'000 Non-financial assets1 Property, plant and equipment - AUC2 2,404 3,304 Property, plant and equipment2 8,077 8,154 Library2 939 939 Buildings - AUC2 920 2,511 Buildings2 18,290 14,202 Total non-financial assets 30,630 29,110
1. The Treasury’s assets are held for operational purposes and not held for the purposes of deriving a profit. The current use of all non-financial assets is considered their highest and best use.
2. No non-financial assets were measured at fair value on a non-recurring basis as at 30 June 2020.
Accounting Policy The Treasury appointed Jones Lang LaSalle (JLL) to conduct a materiality review of the carrying amounts for all tangible property, plant and equipment assets as at 30 June 2020. An annual assessment is undertaken to determine whether the carrying amount of the assets is materially different from fair value. Comprehensive valuations are generally carried-out on a three year cycle, with the previous valuation conducted as at 30 June 2017. A comprehensive valuation in 2020 was deferred, due to the restrictions associated with the outbreak of the Novel Coronavirus (COVID-19). Based on advice provided by JLL, the Treasury is of the view that all tangible property, plant and equipment assets are materially held at fair value at 30 June 2020 in compliance with AASB 13. Where possible, asset valuations are based upon observable inputs to the extent they are available. Where this information is not available, valuation techniques rely upon unobservable inputs. The methods utilised to determine and substantiate the unobservable inputs are derived and evaluated as follows: All Asset Classes - Physical Depreciation and Obsolescence Assets that do not transact with enough frequency or transparency to develop objective opinions of value from observable market evidence have been measured utilising the Depreciated Replacement Cost approach. Under the Depreciated Replacement Cost approach the estimated cost to replace the asset is calculated and then adjusted to take into physical depreciation and obsolescence. Physical depreciation and obsolescence has been determined based on professional judgement regarding physical, economic and external obsolescence factors relevant to the asset under consideration. For all leasehold improvement assets, the consumed economic benefit / asset obsolescence deduction is determined based on the term of the associated lease. Library - Replacement cost The value of the library was determined on the basis of the average cost for items within each collection. The replacement cost has considered purchases over recent years and these have been evaluated for reasonableness against current market prices. The Treasury's policy is to recognise transfers in and out of the fair value hierarchy levels as at the end of the reporting period. There have been no transfers between level 1 and level 2 of the hierarchy during the year.

134 The Treasury Annual Report 2019–20
63
7.6.
Adm
inis
tere
d - F
air V
alue
Mea
sure
men
t Th
e fo
llow
ing
tabl
es p
rovi
de a
n an
alys
is o
f ass
ets
and
liabi
litie
s th
at a
re m
easu
red
at fa
ir va
lue.
Th
e di
ffere
nt le
vels
of t
he fa
ir va
lue
hier
arch
y ar
e de
fined
bel
ow.
Leve
l 1:
Quo
ted
pric
es (u
nadj
uste
d) in
act
ive
mar
kets
for i
dent
ical
ass
ets
or li
abilit
ies
that
the
entit
y ca
n ac
cess
at m
easu
rem
ent d
ate.
Le
vel 2
: In
puts
oth
er th
an q
uote
d pr
ices
incl
uded
with
in L
evel
1 th
at a
re o
bser
vabl
e fo
r the
ass
et o
r lia
bilit
y, e
ither
dire
ctly
or i
ndire
ctly
. Le
vel 3
: U
nobs
erva
ble
inpu
ts fo
r the
ass
et o
r lia
bilit
y.
No
te 7
.6A:
Fai
r Val
ue M
easu
rem
ents
, Val
uatio
n Te
chni
ques
and
Inpu
ts U
sed
Recu
rrin
g fa
ir va
lue
mea
sure
men
ts a
t the
end
of t
he re
port
ing
perio
d by
hie
rarc
hy fo
r ass
ets
and
liabi
litie
s in
202
0
Fa
ir va
lue
mea
sure
men
ts a
t the
end
of t
he
repo
rtin
g pe
riod
usin
g
2
020
201
9 Ca
tego
ry (L
evel
1,
2 o
r 3)
Valu
atio
n te
chni
que(
s) a
nd
inpu
ts u
sed1,
2
$'00
0 $'
000
Fina
ncia
l ass
ets:
Inte
rnat
iona
l fin
anci
al in
stitu
tions
: 2,
670,
472
1,
961,
467
3
Va
lue
of s
hare
s he
ld
Asia
n D
evel
opm
ent B
ank
617,
551
60
8,86
0
As
ian
Infra
stru
ctur
e an
d In
vest
men
t Ban
k 1,
075,
623
84
2,09
3
Euro
pean
Ban
k fo
r Rec
onst
ruct
ion
a
nd D
evel
opm
ent
102,
438
10
1,44
2
Inte
rnat
iona
l Ban
k fo
r
R
econ
stru
ctio
n a
nd D
evel
opm
ent
340,
014
33
2,74
2
Inte
rnat
iona
l Fin
ance
Cor
pora
tion
525,
811
67
,488
M
ultil
ater
al In
vest
men
t Gua
rant
ee A
genc
y
9,03
5
8,84
2
Aust
ralia
n G
over
nmen
t ent
ities
: 30
,426
,751
28
,964
,321
3
Ne
t ass
ets
Res
erve
Ban
k of
Aus
tralia
29
,601
,000
28
,338
,000
Au
stra
lian
Rei
nsur
ance
Poo
l Cor
pora
tion
520,
526
46
1,32
1
NH
FIC
30
5,22
5
165,
000
Co
mm
onw
ealth
Com
pani
es:
1,43
6
1,17
4
3
Net a
sset
s Fi
nanc
ial A
dvis
er S
tand
ards
and
Eth
ics
Auth
ority
Ltd
1,
436
1,
174
O
ther
Inve
stm
ents
: 13
,213
,510
13
,027
,552
3
Va
lue
of q
uota
hel
d IM
F qu
ota
13,2
13,5
10
13,0
27,5
52
Tota
l fin
anci
al a
sset
s 46
,312
,169
43
,954
,514
Tota
l fai
r val
ue m
easu
rem
ents
46
,312
,169
43
,954
,514
1.
No
chan
ge in
val
uatio
n te
chni
ques
occ
urre
d du
ring
the
perio
d.
2. S
igni
fican
t obs
erva
ble
inpu
ts o
nly.

135Part 4 Financial statements
64
Fair
valu
e m
easu
rem
ents
Th
e hi
ghes
t and
bes
t use
of T
reas
ury'
s in
vest
men
ts in
Aus
tralia
n G
over
nmen
t ent
ities
doe
s no
t diff
er b
ecau
se th
e fa
ir va
lue
is b
ased
on
the
net a
sset
pos
ition
of
the
entit
y.
The
high
est a
nd b
est u
se o
f Tre
asur
y's
inve
stm
ents
in In
tern
atio
nal F
inan
cial
Inst
itutio
ns d
oes
not d
iffer
bec
ause
the
fair
valu
e is
bas
ed o
n th
e va
lue
of s
hare
s he
ld in
the
rele
vant
inst
itutio
n.
No
te 7
.6B:
Lev
el 1
and
Lev
el 2
tran
sfer
s fo
r rec
urrin
g fa
ir va
lue
mea
sure
men
ts
N
o as
sets
wer
e tra
nsfe
rred
betw
een
Leve
l 1 a
nd L
evel
2.
No
te 7
.6C:
Rec
onci
liatio
n fo
r rec
urrin
g Le
vel 3
fair
valu
e m
easu
rem
ents
Recu
rrin
g Le
vel 3
fair
valu
e m
easu
rem
ents
- re
conc
iliat
ion
for a
sset
s
Fi
nanc
ial a
sset
s
Inve
stm
ents
To
tal
20
20
2019
20
20
2019
$'00
0 $'
000
$'00
0 $'
000
As a
t 1 J
uly
43,9
54,5
14
39,5
51,5
32
43,9
54,5
14
39,5
51,5
32
Ope
ning
adj
ustm
ent f
or A
ASB
9
- 2,
309
-
2,30
9 To
tal g
ains
/(los
ses)
reco
gnis
ed in
oth
er c
ompr
ehen
sive
inco
me
1,46
2,69
2
3,57
4,29
3
1,46
2,69
2 3,
574,
293
Tota
l gai
ns/(l
osse
s) re
cogn
ised
in n
et c
ost o
f ser
vice
s
IM
F Q
uota
fore
ign
exch
ange
gai
n/(lo
ss)
185,
958
53
4,87
0
185,
958
534,
870
Inte
rnat
iona
l Fin
anci
al In
stitu
tions
fore
ign
exch
ange
gai
n/(lo
ss)
(5,1
54)
90,6
39
(5,1
54)
90,6
39
Res
truct
urin
g1 -
- -
- Sh
are
Purc
hase
s -
- -
- In
crea
se in
inve
stm
ents
in th
e In
tern
atio
nal F
inan
cial
Inst
itutio
ns
714,
159
20
0,87
1
714,
159
200,
871
Sale
s -
- -
- IM
F ge
nera
l rev
iew
Quo
ta P
aym
ents
-
- -
- Is
sues
-
- -
- Se
ttlem
ents
- -
- Tr
ansf
ers
into
Lev
el 3
-
- -
- Tr
ansf
ers
out o
f Lev
el 3
-
- -
- To
tal a
s at
30
June
46
,312
,169
43
,954
,514
46
,312
,169
43
,954
,514
Ch
ange
s in
unr
ealis
ed g
ains
/(los
ses)
reco
gnis
ed in
net
cos
t of
serv
ices
for t
he y
ear e
nded
30
June
2,
357,
655
4,40
2,98
2 2,
357,
655
4,40
2,98
2

136 The Treasury Annual Report 2019–20
65
8. Other Information 8.1. Aggregate Assets and Liabilities
2020 2019 $'000 $'000 Note 8.1A: Aggregate Assets and Liabilities Assets expected to be recovered in:
No more than 12 months 84,043 69,765 More than 12 months 164,184 39,463
Total assets 248,227 109,228 Liabilities expected to be settled in:
No more than 12 months 34,304 23,056 More than 12 months 169,594 45,992
Total liabilities 203,898 69,048 Assets expected to be recovered in:
No more than 12 months 8,191,918 2,400,155 More than 12 months 46,689,731 44,333,167
Total assets
54,881,649
46,733,322 Liabilities expected to be settled in:
No more than 12 months 1,341,930 731,290 More than 12 months 17,682,991 17,344,918
Total liabilities
19,024,921
18,076,208

137Part 4 Financial statements
66
9. Budgetary Reports and Explanation of Major Variances 9.1. Departmental Budgetary Reports
Statement of Comprehensive Income for the period ended 30 June 2020 Actual Budget estimate Original1 Variance2 2020 2020 2020 $'000 $'000 $'000 NET COST OF SERVICES Expenses
Employee benefits 152,138 147,557 4,581 Suppliers 57,411 57,845 (434) Grants 609 1,958 (1,349) Depreciation and amortisation 17,188 6,349 10,839 Write-down and impairment of assets 740 - 740 Finance costs 1,664 - 1,664 Act of grace payments 220 - 220 Foreign exchange losses 8 - 8
Total expenses 229,978 213,709 16,269 Own-source income Own-source revenue
Sale of goods and rendering of services 9,750 11,651 (1,901) Other revenues 6,016 772 5,244
Total own-source revenue 15,766 12,423 3,343 Gains
Gains 96 4,133 (4,037) Total gains 96 4,133 (4,037) Total own-source income 15,862 16,556 (694) Net cost of services (214,116) (197,153) (16,963)
Revenue from Government 206,298 190,804 15,494 Surplus / (Deficit) (7,818) (6,349) (1,469) OTHER COMPREHENSIVE INCOME Items not subject to subsequent reclassification to net cost of services
Changes in asset revaluation reserves - - - Total other comprehensive income - - - Total comprehensive income/(loss) attributable to the Australian Government (7,818) (6,349) (1,469)
1. The Treasury’s original budgeted financial statement that was first presented to Parliament in respect of the reporting period (i.e. from the Treasury’s 2019-20 Portfolio Budget Statements (PBS)). 2. Between the actual and original budgeted amounts for 2020. Explanations of major variances (that are greater than +/- 10% of the original budget for a line item and greater than +/- $1 million) are provided below.

138 The Treasury Annual Report 2019–20
67
Explanations of major variances Affected line items Grants expenditure is $1.3 million (69%) less than the original budget due to the reclassification of the International Financial Reporting Standards Foundation annual contribution of $1 million from departmental to administered at MYEFO 2019-20.
Grants
Depreciation and amortisation is $10.8 million (171%) more than the original budget as a result of the implementation of AASB 16, requiring recognition of depreciation on right of use assets, which was not in the original budget.
Depreciation and amortisation
Finance costs primarily relate to the recognition of interest on lease liabilities in accordance with AASB 16, which was not considered when the original budget was set.
Finance costs
Sale of goods and rendering of services is $1.9 million (16%) less than the original budget, primarily driven by the reduction in shared services provided by the Treasury to other agencies.
Sale of goods and rendering of services
Other revenues is $5.2 million (679%) more than the original budget due to the reclassification of services received free of charge from Other Gains to Other Revenue subsequent to the finalisation of the original budget. Services received free of charge were higher than expected as a result of Treasury's use of additional secondments this year compared to the original budget. The remaining total is materially consistent with the original budget estimate.
Other revenues
Other gains is $4.0 million (98%) less than the original budget as a result of the reclassification of services received free of charge from Other Gains to Other Revenue subsequent to the finalisation of the original budget.
Other gains

139Part 4 Financial statements
68
Statement of Financial Position as at 30 June 2020 Actual Budget estimate Original1 Variance2 2020 2020 2020 $'000 $'000 $'000 ASSETS Financial assets
Cash and cash equivalents 651 640 11 Trade and other receivables 80,052 63,385 16,667
Total financial assets 80,703 64,025 16,678 Non-financial assets
Buildings 137,650 16,526 121,124 Plant and equipment 11,447 13,700 (2,253) Intangibles 13,163 12,575 588 Prepayments 5,264 4,644 620
Total non-financial assets 167,524 47,445 120,079 Total assets 248,227 111,470 136,757 LIABILITIES Payables
Suppliers 10,775 11,326 (551) Other payables 2,920 4,709 (1,789)
Total payables 13,695 16,035 (2,340) Interest bearing liabilities
Leases 122,800 - 122,800 Total interest bearing liabilities 122,800 - 122,800 Provisions
Employee provisions 63,174 48,474 14,700 Provision for restoration 4,229 3,508 721
Total provisions 67,403 51,982 15,421 Total liabilities 203,898 68,017 135,881 Net assets 44,329 43,453 876 EQUITY
Asset revaluation reserve 12,676 12,676 - Contributed equity 97,890 93,200 4,690 Retained earnings (66,237) (62,423) (3,814)
Total equity 44,329 43,453 876 1. The Treasury’s original budgeted financial statement that was first presented to Parliament in respect of the reporting period (i.e. from the Treasury’s 2019-20 Portfolio Budget Statements (PBS)). 2. Between the actual and original budgeted amounts for 2020. Explanations of major variances (that are greater than +/- 10% of the original budget for a line item and greater than +/- $1 million) are provided below.

140 The Treasury Annual Report 2019–20
69
Explanations of major variances Affected line items Trade and other receivables is $16.7 million (26%) more the original budget, reflecting timing differences in receipts from customers and revenue receivable from Government relating to measures announced in the 2019-20 Budget.
Trade and other receivables
Buildings was $121.1 million (733%) more than the original budget, driven by the recognition of right of use assets from the adoption of AASB 16 that were not in the original budget.
Buildings
Plant and equipment is $2.3 million (16%) less than the original budget, reflecting more depreciation expense recorded in 2019-20 than estimated.
Plant and equipment
Other payables is $1.8 million (38%) less than the orignal budget, due to the timing of payments to suppliers.
Other payables
Leases is $122.8 million more than the original budget, driven by the recognition of lease liabilities from the adoption of AASB 16 that were not in the original budget.
Leases
Employee provisions is $14.7 million (30%) more than the original budget, explained by an increase in the present value of annual and long service leave balances, reflecting a decrease in the underlying discount rates applied to the long service leave provision since 30 June 2019.
Employee provisions

141Part 4 Financial statements
70
Stat
emen
t of C
hang
es in
Equ
ity
fo
r the
per
iod
ende
d 30
Jun
e 20
20
Re
tain
ed e
arni
ngs
Asse
t rev
alua
tion
surp
lus
Cont
ribut
ed e
quity
/cap
ital
Tota
l equ
ity
Ac
tual
Bu
dget
est
imat
e Ac
tual
Bu
dget
est
imat
e Ac
tual
Bu
dget
est
imat
e Ac
tual
B
udge
t est
imat
e
O
rigin
al1
Varia
nce2
O
rigin
al1
Varia
nce2
O
rigin
al1
Varia
nce2
O
rigin
al1
Varia
nce2
20
20
2020
20
20
2020
20
20
2020
20
20
2020
20
20
2020
20
20
2020
$'00
0 $'
000
$'00
0 $'
000
$'00
0 $'
000
$'00
0 $'
000
$'00
0 $'
000
$'00
0 $'
000
Ope
ning
bal
ance
as
at
1 Ju
ly
(58,
770)
(5
6,07
4)
(2,6
96)
12,6
76
12,6
76
- 86
,274
81
,532
4,
742
40
,180
38
,134
2,
046
Ad
just
men
ts to
op
enin
g ba
lanc
e 35
1
- 35
1
-
-
- -
351
-
351
Co
mpr
ehen
sive
in
com
e
- -
- Su
rplu
s (D
efic
it) fo
r th
e pe
riod
(7,8
18)
(6,3
49)
(1,4
69)
- -
- -
- -
(7,8
18)
(6,3
49)
(1,4
69)
Tota
l com
preh
ensi
ve
inco
me
(7,8
18)
(6,3
49)
(1,4
69)
- -
- -
- -
(7,8
18)
(6,3
49)
(1,4
69)
Tran
sact
ions
with
ow
ners
Co
ntrib
utio
ns b
y ow
ners
Eq
uity
inje
ctio
n ap
prop
riatio
n -
- -
- -
- 1,
456
1,
456
-
1,45
6
1,45
6
- D
epar
tmen
tal c
apita
l bu
dget
app
ropr
iatio
n -
- -
- -
- 10
,160
10
,212
(5
2)
10,1
60
10,2
12
(52)
To
tal t
rans
actio
ns w
ith
owne
rs
- -
- -
- -
11,6
16
11,6
68
(52)
11
,616
11
,668
(5
2)
Clos
ing
bala
nce
as a
t 30
Jun
e (6
6,23
7)
(62,
423)
(3
,814
) 12
,676
12
,676
-
97,8
90
93,2
00
4,69
0
44,3
29
43,4
53
876
1.
The
Tre
asur
y’s
orig
inal
bud
gete
d fin
anci
al s
tate
men
t tha
t was
firs
t pre
sent
ed to
Par
liam
ent i
n re
spec
t of t
he re
porti
ng p
erio
d (i.
e. fr
om th
e Tr
easu
ry’s
201
9-20
Po
rtfol
io B
udge
t Sta
tem
ents
(PBS
)).
2. B
etw
een
the
actu
al a
nd o
rigin
al b
udge
ted
amou
nts
for 2
020.
Exp
lana
tions
of m
ajor
var
ianc
es (t
hat a
re g
reat
er th
an +
/- 10
% o
f the
orig
inal
bud
get f
or a
line
ite
m a
nd g
reat
er th
an +
/- $1
milli
on) a
re p
rovi
ded
belo
w.
Expl
anat
ions
of m
ajor
var
ianc
es
Affe
cted
line
item
s In
crea
sed
defic
it of
$1.
5m (2
3%) r
elat
es d
irect
ly to
the
Stat
emen
t of C
ompr
ehen
sive
Inco
me
varia
nces
Su
rplu
s (D
efic
it) fo
r the
per
iod

142 The Treasury Annual Report 2019–20
71
Cash Flow Statement for the period ended 30 June 2020 Actual Budget estimate Original1 Variance2 2020 2020 2020 $'000 $'000 $'000 OPERATING ACTIVITIES Cash received
Appropriations 214,885 191,483 23,402 Sale of goods and rendering of services 6,783 11,651 (4,868) GST received 5,690 - 5,690 Other 2,227 772 1,455
Total cash received 229,585 203,906 25,679 Cash used
Employees 141,734 148,236 (6,502) Suppliers 47,988 53,712 (5,724) Grants 609 1,958 (1,349) Section 74 receipts transferred to OPA1 23,877 - 23,877 GST paid 5,659 - 5,659 Interest payments on lease liabilities 1,579 - 1,579
Total cash used 221,446 203,906 17,540 Net cash from/(used by) operating activities 8,139 - 8,139 INVESTING ACTIVITIES Cash used
Purchase of Buildings 5,974 - 5,974 Purchase of plant and equipment 2,321 11,668 (9,347) Purchase of intangibles 6,797 - 6,797
Total cash used 15,092 11,668 3,424 Net cash from/(used by) investing activities (15,092) (11,668) (3,424) FINANCING ACTIVITIES Cash received
Contributed equity - departmental capital budget 10,160 10,212 (52) Contributed equity - equity injections 1,942 1,456 486
Total cash received 12,102 11,668 434 Cash used
Principal payments of lease liabilities 7,270 - 7,270 Total cash used 7,270 - 7,270 Net cash from/(used by) financing activities 4,832 11,668 (6,836) Net increase/(decrease) in cash held (2,121) - (2,121) Cash at the beginning of the reporting period 2,772 640 2,132 Cash at the end of the reporting period 651 640 11
1. The Treasury’s original budgeted financial statement that was first presented to Parliament in respect of the reporting period (i.e. from the Treasury’s 2019-20 Portfolio Budget Statements (PBS)). 2. Between the actual and original budgeted amounts for 2020. Explanations of major variances (that are greater than +/- 10% of the original budget for a line item and greater than +/- $1 million) are provided below.

143Part 4 Financial statements
72
Explanations of major variances Affected line items The primary driver for the variance in operating activities is the inclusion of lease payments in the original budget for supplier payments - these were accounted for in accordance with AASB 16 and classified as cash used by financing activities for actual reporting purposes.
Net Cash from/(used by) operating activities
The original budget cash flow statement did not split the purchases of property, plant and equipment (PP&E) and intangibles between each asset class, but presented the purchases at an aggregate level and has been analysed as such. The net cash used during 2019-20 was $15.1 million, driven by: - $6.0 million invested in fitouts to new office premises in Melbourne and Sydney and the continued Treasury Building Block and Stack project; and - $9.1 million used for upgrades to Treasury's information technology systems and infrastructure and security upgrades.
Net Cash from/(used by) investing activities
The $6.8 million cash inflow variance from the original budget is primarly driven by the reclassification of the $7.2 million in cash used for principal lease payments from supplier expenses as a result of the adoption of AASB 16.
Net Cash from/(used by) financing activities

144 The Treasury Annual Report 2019–20
73
9.2. Administered Budgetary Reports
Statement of Comprehensive Income for the period ended 30 June 2020 Actual Budget estimate Original1 Variance2 2020 2020 2020 $'000 $'000 $'000 NET COST OF SERVICES Expenses
Grants 100,458,412 104,623,398 (4,164,986) Interest 37,577 109,823 (72,246) Medicare Guarantee Fund 37,961,055 36,567,354 1,393,701 NHFIC Operating funding 61,762 61,762 - Foreign exchange losses 548,488 40,774 507,714 Suppliers 158,365 1,069 157,296
Total expenses 139,225,659 141,404,180 (2,178,521) Income Revenue Non-taxation revenue
Sale of goods and rendering of services 649,062 649,257 (195) Interest 15,597 31,128 (15,531) Dividends 3,071,501 1,500,358 1,571,143 COAG revenue from government agencies 1,592,278 1,752,481 (160,203) Other 112,511 93,650 18,861
Total non-taxation revenue 5,440,949 4,026,874 1,414,075 Total revenue 5,440,949 4,026,874 1,414,075 Gains
Foreign exchange - 101,465 (101,465) Total gains - 101,465 (101,465) Total income 5,440,949 4,128,339 1,312,610 Net cost of (contribution by) services (133,784,710) (137,275,841) 3,491,131 Surplus/(Deficit) (133,784,710) (137,275,841) 3,491,131 OTHER COMPREHENSIVE INCOME Items not subject to subsequent reclassification to net cost of services
Changes in asset revaluation surplus 1,297,692 - 1,297,692 Total comprehensive income 1,297,692 - 1,297,692 Total comprehensive income/(loss) (132,487,018) (137,275,841) 4,788,823
1. Treasury’s original budgeted financial statement that was first presented to Parliament in respect of the reporting period (i.e. from the Treasury’s 2019-20 Portfolio Budget Statements (PBS)). 2. Between the actual and original budgeted amounts for 2020. Explanations of major variances (that are greater than +/- 10% of the original budget for a line item and greater than +/- $1 billion) are provided below.
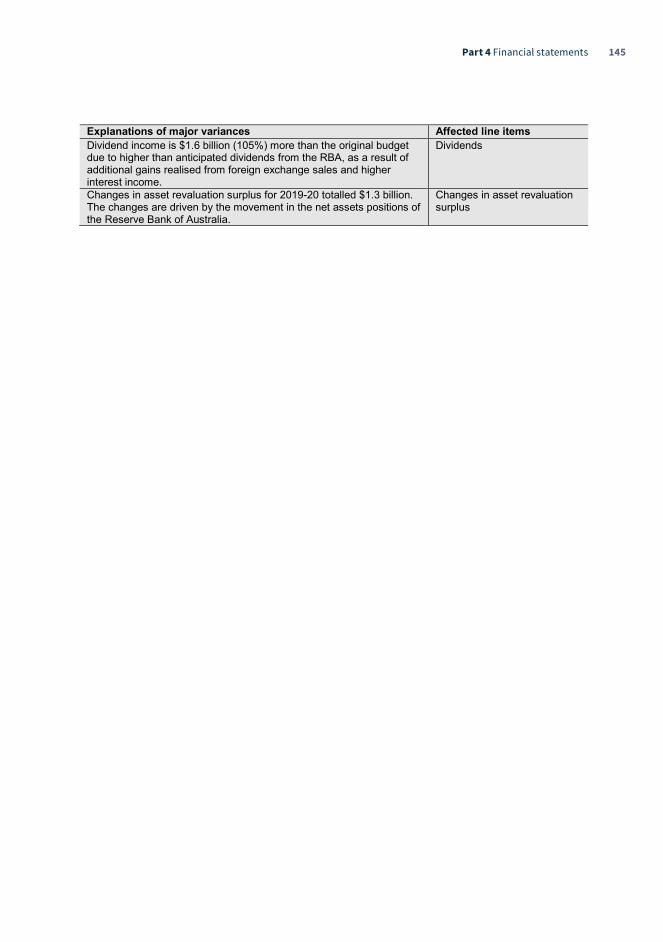
145Part 4 Financial statements
74
Explanations of major variances Affected line items Dividend income is $1.6 billion (105%) more than the original budget due to higher than anticipated dividends from the RBA, as a result of additional gains realised from foreign exchange sales and higher interest income.
Dividends
Changes in asset revaluation surplus for 2019-20 totalled $1.3 billion. The changes are driven by the movement in the net assets positions of the Reserve Bank of Australia.
Changes in asset revaluation surplus

146 The Treasury Annual Report 2019–20
75
Administered Schedule of Assets and Liabilities as at 30 June 2020 Actual Budget estimate Original1 Variance2 2020 2020 2020 $'000 $'000 $'000 ASSETS Financial assets
Cash and cash equivalents 449,817 365,000 84,817 Loans and other receivables 8,119,663 1,603,140 6,516,523 Investments 46,312,169 41,179,568 5,132,601
Total financial assets 54,881,649 43,147,708 11,733,941 Non-financial assets
Other - 336,575 (336,575) Total non-financial assets - 336,575 (336,575) Total assets administered on behalf of Government 54,881,649 43,484,283 11,397,366 LIABILITIES Payables
Grants 126,753 59,065 67,688 Other payables 6,862,715 11,491 6,851,224 Unearned income 3,658 10,328 (6,670)
Total payables 6,993,126 80,884 6,912,242 Interest bearing liabilities
Promissory notes 10,051,022 10,340,570 (289,548) Other - 6,013,598 (6,013,598)
Total interest bearing liabilities 10,051,022 16,354,168 (6,303,146) Provisions
Provisions 1,980,773 110,118 1,870,655 Total provisions 1,980,773 110,118 1,870,655 Total liabilities administered on behalf of
19,024,921 16,545,170 2,479,751 government Net assets 35,856,728 26,939,113 8,917,615
1. Treasury’s original budgeted financial statement that was first presented to Parliament in respect of the reporting period (i.e. from the Treasury’s 2019-20 Portfolio Budget Statements (PBS)). 2. Between the actual and original budgeted amounts for 2020. Explanations of major variances (that are greater than +/- 10% of the original budget for a line item and greater than +/- $1 billion) are provided below.

147Part 4 Financial statements
76
Explanations of major variances Affected line itemsLoans and other receivables is $6.5 billion (404%) more than the original budget primarily due to the recognition at 30 June 2020 of GST revenue allocation receivable of $5.2 billion.
Loans and other receivables
Investments increase of $5.1 billion (12%) is mainly driven by the change in the net assets position of the Reserve Bank of Australia, the conversion of retained earnings into shares for the investment in the International Financial Corporation, movements in the value of the IMF quota and other investments in international financial institutions as a result of changes in foreign exchange rates.
Investments
Liabilities of $6.0 billion had a reclassification from 'Other interest bearing liabilities' to 'Other payables' as a reporting change between Budget and the Financial Statements.
Liabilities - Other payables/Other interest bearing liabilities

148 The Treasury Annual Report 2019–20
Advertising and market research 149
Grants 151
Disability reporting 152
Information publication scheme 153
Work health and safety 154
Carer support 156
Ecologically sustainable development and environmental performance 157
Australia and the international financial institutions 158
Australia and the International Monetary Fund 158Australia and the World Bank Group 163
Consumer data right 166
Resource tables 167
List of Requirements 171
Abbreviations and Acronyms 177
Glossary 180
Part 5 – Appendices

149
Advertising and market researchTreasury is required to report on all payments over $13,800.00 (including GST) to advertising agencies, market research organisations, polling organisations, media advertising organisations and direct mail organisations.
In 2019-20, Treasury delivered two advertising campaigns, a second phase of the tax campaign and two streams of the COVID-19 Economic Response campaign (Stream 1: Economic Response and Stream 2: COVID-Safe Economy).
The second phase of the tax campaign was to inform Australians that reforms to the tax system were legislated and had become law.
The first stream of the COVID-19 Economic Response campaign supported the Government’s implementation of the economic response to COVID-19. It informed Australians and the business community on how the economic response package worked and the support available for businesses, individuals and families.
The COVID-Safe Economy stream of the campaign further supported the Government’s implementation of the 3-Step Roadmap to a COVID-Safe Economy. It encouraged the business community to develop COVID-Safe operational plans to keep employees and customers safe and help restart the economy. The campaign continued to inform Australians and the business community on how the economic response package worked and how it supported individuals and their families.
Campaign expenditure relating to advertising agencies, market research organisations, and media advertising organisations are outlined in the tables below.
Campaign compliance information is available at www.treasury.gov.au and in the reports on government advertising prepared by the Department of Finance and published at www.finance.gov.au/advertising.
Treasury was granted an exemption from compliance with the Guidelines on Information and Advertising Campaigns by non-corporate Commonwealth entities on the basis of extreme urgency for COVID-19 Economic Response campaign activity.
Other market research was undertaken as part of Treasury’s commitment to work effectively with stakeholders and inform policy responses.
Treasury did not make any payments to polling organisations or direct mailing organisations in 2019-20.
Table 18: Advertising Agencies (creative advertising agencies which have developed advertising campaigns
Provider Service Provided Cost ($)
BMF Advertising Pty Ltd Creative Services (Tax campaign) $324,268.11
Note: these figures include head hour and production costs.

150 The Treasury Annual Report 2019–20
Table 19: Market Research Organisations
Provider Service Provided Cost ($)
Cutthru Pty Ltd T/as Pollinate Market Research (Tax campaign) $94,050.00
Hall & Partners Pty Ltd Market Research (Tax campaign) $101,261.60
Hall & Partners Pty Ltd Market Research (Economic Response campaign) $231,264.00
Hall & Partners Pty Ltd Market Research (COVID-Safe campaign) $188,102.20
Cutthru Pty Ltd T/as Pollinate Market Research $176,220.00
Reed, James Alan T/as Resolve Strategic
Market Research (Economic Response campaign) $222,750.00
Note: Hall & Partners is the evaluation research agency for all Commonwealth Government advertising.
Table 20: Media Advertising (Universal McCann Australia – the master media agency for all Commonwealth Government advertising)
Provider Service Provided Cost ($)
Universal McCann Australia Campaign Advertising (Tax campaign) $7,919,901.81
Universal McCann Australia Campaign Advertising (Economic Response campaign) $8,457,684.99*
Universal McCann Australia Campaign Advertising (COVID-Safe campaign) $11,932,964.02
Universal McCann Australia Advertising for recruitment services $100,453.00
Universal McCann Australia Advertising for public notices Nil
Note: all figures include GST.
Note: the Universal McCann Australia advertising figure includes $480,768.25 for creative services for the Economic Response and $128,867.73 for the COVID-Safe campaigns.

151Part 5 Appendices
GrantsInformation on grants awarded by Treasury for 2019-20 is available on GrantConnect at www.grants.gov.au.

152 The Treasury Annual Report 2019–20
Disability reportingSince 1994, non-corporate Commonwealth entities have reported on their performance as policy adviser, purchaser, employer, regulator and provider under the Commonwealth Disability Strategy. In 2007–08, reporting on the employer role was transferred to the Australian Public Service Commission’s State of the Service reports and the APS Statistical Bulletin. These reports are available at www.apsc.gov.au. From 2010-11, entities have no longer been required to report on these functions.
The Commonwealth Disability Strategy has been overtaken by the National Disability Strategy 2010-2020, which sets out a ten-year national policy framework to improve the lives of people with disability, promote participation and create a more inclusive society. A high-level, two-yearly report submitted to the Council of Australian Governments will track progress against each of the six outcome areas of the strategy and present a picture of how people with disability are faring. The strategy and subsequent reports are available at www.dss.gov.au.

153Part 5 Appendices
Information publication schemeAgencies subject to the Freedom of Information Act 1982 (FOI Act) are required to publish information as part of the Information Publication Scheme. This requirement is in Part II of the FOI Act. Each agency must display a plan on its website showing what information it publishes in accordance with the Information Publication Scheme requirements.
The Information Publication Scheme plan is on the Treasury website at www.treasury.gov.au.

154 The Treasury Annual Report 2019–20
Work health and safety2019-20 presented many challenges to the health and wellbeing of Treasury employees. Treasury responded actively to these challenges in accordance with our overarching policy, the Work Health and Safety Management System, and a range of tailored specific initiatives to ensure our employees’ health and wellbeing.
Treasury responded to the emerging bushfire challenges in November 2019 by providing staff with updates on conditions, and the impact of smoke haze. This advice also included State and Territory Government health advice, bushfire alerts and status updates.
By early January 2020, the resources and advice available to staff increased in response to State and Territory Governments declaring a state of emergency, disaster or alert. The advice also provided guidance and information on air quality measures, and the support available for employees impacted by the fires or smoke hazards. These included flexible work arrangements, family and caring responsibilities, access to emergency leave provisions, leave arrangements for emergency service workers and Army Reservists, and access to the Employee Assistance Program (EAP).
A senior Crisis Management Team chaired by the Deputy Secretary, Corporate and Foreign Investment Group was stood up in accordance with our business continuity arrangements to monitor and act on issues arising, and drive the support and communications process with employees.
From early January 2020, daily updates were provided for all employees, including the results of testing of indoor air quality across our offices. Treasury also purchased portable air quality testing machines for each of our office locations in Canberra, Sydney and Melbourne.
The COVID-19 pandemic emerged in late January 2020, and in accordance with Treasury’s Pandemic Action Plan, a senior Crisis Management Team chaired by the Deputy Secretary, Corporate and Foreign Investment Group was stood up to manage Treasury’s response and ensure the wellbeing of our employees. The Crisis Management Team was expanded to include an SES officer, to represent each Group, and the three State Office Heads. The role of the Crisis Management Team was to ensure that all steps were taken in accordance with the legal obligations and directions of the Commonwealth, State and Territory health authorities to ensure the health and safety of Treasury employees in our workplaces.
Internet resources were established to provide employees with information and guidance in relation to health advice from the Department of Health and Safe Work Australia, and travel advice from the Department of Foreign Affairs and Trade. Protocols were established in relation to the management of suspected or actual cases within the workforce. These resources were further expanded to include information on physical distancing, remote working and ongoing support for employees from the Wellbeing Team and the Employee Assistance Program.
Signage to remind employees about physical distancing, good hygiene and how to stop the spread of COVID-19 were prominently displayed in our workplaces. Maximum occupancy level signage was also deployed in meeting rooms, offices, kitchens and breakout areas. Thirty-six free standing automated hand sanitiser stations were deployed across our workplaces.
Employees were surveyed in April 2020 to gain an insight into their experiences while working remotely. A resource pack, Working Well, Keeping Well, was developed and launched in response to the survey outcomes and to further enhance the support available to employees. Specific workshops for managers and SES employees — Leading a dispersed workforce — were run in June 2020.
Treasury’s COVID-safe Transition Plan was endorsed by the Executive Board in June 2020. The plan aligned with the Government’s 3-Step Roadmap to a COVID-safe Economy and set out the principles, objectives and
155Part 5 Appendices
actions Treasury would undertake to ensure an effective transition of the workforce back into our workplaces, while meeting the physical distancing measures in place. The plan is flexible, and acknowledges that our workplaces across the States and in Canberra may move at different rates, given the evolving COVID-19 health directions. The Executive Board oversees the implementation of the plan.
In accordance with the Work Health and Safety Act 2011, the Health and Safety Committee met quarterly in 2019-20. Treasury has 14 Health and Safety Representatives, 19 Workplace Harassment Contact Officers, 23 First Aid Officers and 66 Emergency Officers to assist in maintaining work health and safety standards.
In 2019-20, 38 incident reports were received. The majority of reports were complaints relating to the operation of our emergency evacuation warning system audible alarms. This was followed by slip, trips and falls, hits by moving objects, then overuse. There were no reportable incidents to Comcare. No investigations were conducted and no notices were given in 2019-20.
Treasury’s Comcare premium rate has remained consistently low over the past four years. Our premium rate is 0.56 per cent, which is below the APS average of 0.85 per cent. This low rate is attributed to Treasury’s Rehabilitation Management System which outlines our approach to injury and illness management and provides information to staff and managers about the support available to them.
In 2019-20, Treasury continued to invest in personal wellbeing through a range of initiatives such as resilience and good mental health in the workplace training; resilience coaching; involvement in the RUOK Roadshow event; APS values in practice training; flu vaccinations; health checks; defibrillator training; and allergy and anaphylaxis response training. We also participated in Movember; Give Life Challenge; Dignity Cup; lunchtime Treasury soccer competitions; the Canberra Fun Run; Ride to Work Day; and the 10,000 steps program. Participation in these initiatives assisted in building employee wellbeing and resilience through information, education, support and connection with others.
Treasury’s early intervention program provided support for 35 employees experiencing an illness or injury that may impact their work. This enabled them to remain at work or return to work as soon as practicable. A further 33 employees accessed reimbursement support for screen based eye wear.
Treasury continues to provide professional counselling and support for employees through the Employee Assistance Program. This service is available to all employees, their immediate family members and other people with whom they share a close relationship.
156 The Treasury Annual Report 2019–20
Carer supportTreasury supports carers and ensures they have the same rights, choices and opportunities as other Australians regardless of age, race, gender, disability, sexuality, religious or political beliefs, cultural or linguistic heritage and socio-economic status or locality.
During 2019-20, Treasury’s carer support framework has enabled practical and active support for employees in responding to bushfire and air quality issues, and in particular, the COVID-19 pandemic.
Treasury’s carer support framework includes:
� a non-discriminatory definition of family in the Treasury Enterprise Agreement 2018–2021 which recognises relatives by blood, marriage, strong traditional or ceremonial affinity and genuine domestic or household relationships
� flexible working arrangements to assist employees in balancing work and family responsibilities including, home-based work, flexible hours, purchased leave, part-time work and job-sharing
� carer’s rooms available to employees to assist them in their caring responsibilities in instances where care is temporarily and unexpectedly unavailable
� being an accredited Breastfeeding Friendly Workplace. Treasury supports employees who wish to breastfeed in the workplace and is committed to ensuring that work and breastfeeding can be combined
� access to accumulated personal leave to care for sick family and household members, or people for whom employees have caring responsibilities
� access to unpaid carer’s leave to care for or support family or household members, or if an unexpected family or household emergency arises
� access to the Employee Assistance Program for free, professional and confidential counselling for employees, their immediate family members and people with whom they are in a close relationship.
157Part 5 Appendices
Ecologically sustainable development and environmental performance Treasury remains committed to the principles of ecologically sustainable development consistent with relevant Commonwealth, State and Territory environmental legislation, regulations, policies and initiatives. The Treasury Environmental Management Plan sets out our environmental policies and performance action plans, to meet environmental best practice wherever practicable.
In 2019-20, we minimised our impact on the environment in the areas of energy efficiency, waste and water use by:
� installation of new energy efficient Heating, Ventilation and Air-conditioning (HVAC) plant and machinery by the building owner
� installation of new efficient hand dryers in bathrooms in new office fit-out as part of base building works by the building owner
� installation of new water efficient sensor tapware 4.5L/min, 6 star WELS rating in bathrooms in new office fit-out as part of base building works by the building owner
� reviewing the lighting control system and the introduction of LED lighting in new office fit-out
� reducing paper consumption by defaulting office printers to black-and-white and two-sided printing, and supporting the use of electronic document management and collaboration as well as digital and mobile technology solutions for staff (iPads and laptops)
� using energy saver mode for most office equipment when not in use across all office locations
� using technology such as teleconferencing and videoconferencing to facilitate meetings with interstate and overseas colleagues where appropriate
� purchasing five star energy rated electrical appliances (where available)
� participating in Earth Hour
� encouraging recycling by providing waste recycling stations, segregating waste into approved recycling streams (including waste to landfill, commingled waste and compost): waste management providers are engaged to recycle used paper waste and secure paper materials
� establishing a fit-out and furniture recycling strategy that reuses the department’s existing office fit-out infrastructure, including workstations; and the sourcing of redundant office fit-out and workstations from other government departments to reuse
� recycling of toner cartridges, fluorescent light tubes and batteries
� using water flow restriction controls and water efficient appliances in kitchens and bathrooms to minimise water use across the Treasury building tenancy.

158 The Treasury Annual Report 2019–20
Australia and the international financial institutionsProgram 1.2 outlined various payments made by Treasury to the Asian Development Bank, the Asian Infrastructure Investment Bank, the European Bank for Reconstruction and Development, the International Monetary Fund (IMF) and the World Bank Group (WBG). This appendix addresses the legislation that requires further reporting on the IMF and the WBG for 2019-20. In particular:
� Section 10 of the International Monetary Agreements Act 1947, which requires reporting on the operations of the Act and of the operations, insofar as they relate to Australia, of the Articles of Agreement of the IMF and the International Bank for Reconstruction and Development (IBRD) during each financial year
� Section 7 of the International Bank for Reconstruction and Development (General Capital Increase) Act 1989, which requires reporting on the operations of the Act during each financial year.
Treasury is responsible for managing the Australian Government’s shareholdings with the International Financial Institutions. The Department of Foreign Affairs and Trade (DFAT) has further interactions relating to the Government’s aid program (see DFAT annual report for information).
The IMF and the WBG publish annual reports on their operations and provide information at www.imf.org and www.worldbank.org.
Australia and the International Monetary Fund
MandateThe purposes of the IMF (set out in Article I of its Articles of Agreement) are to:
� promote international monetary cooperation
� facilitate the expansion and balanced growth of trade, contributing to high levels of employment and real income
� promote exchange rate stability and avoid competitive devaluation
� assist in the establishment of a multilateral system of payments and in the elimination of foreign exchange restrictions that hamper the growth of world trade
� make resources available to members to reduce the costs of balance of payments adjustments.
Australia’s representation at the International Monetary FundAustralia interacts with the IMF through:
� the IMF Board of Governors
� the International Monetary and Financial Committee (IMFC)
� the IMF Executive Board
� the IMF’s Article IV consultation on Australia’s economic developments and policy.

159Part 5 Appendices
Board of GovernorsThe Board of Governors is the highest authority within the IMF. It consists of one governor and one alternate governor for each of the 189 member countries. Australia is represented on the Board of Governors by the Treasurer of the Commonwealth of Australia. The Secretary to the Treasury is Australia’s Alternate Governor. Governors’ votes on IMF resolutions during 2019-20 are noted in Table 21.
Table 21: Australian Governor’s votes on IMF 2019-20 resolutions
Resolution title DateAustralian Governor’s
vote
2022-23 Annual meetings dates and venue 27 July 2019 Approved
Amendment to IMF By-laws Governing Age Limits 3 September 2019 Approved
Remuneration of Executive Directors and their Alternates 4 September 2019 Approved
Review of remuneration of Executive Directors and their Alternates
4 September 2019 Approved
Fifteenth and sixteenth General Review of Quotas 7 February 2020 Approved
Amendment to the statute of the administrative tribunal 23 June 2020 Approved
International Monetary and Financial CommitteeThe IMFC advises the Board of Governors on the functioning and performance of the international monetary and financial system, but does not have a decision-making role.
IMF Executive Board, Executive Director and constituency officeThe IMF Executive Board conducts the day-to-day business of the IMF and determines matters of policy under the overall authority of the Board of Governors.
Australia belongs to a constituency which, in 2019-20, also included Kiribati, the Republic of Korea, the Marshall Islands, the Federated States of Micronesia, Mongolia, the Republic of Nauru, New Zealand, Palau, Papua New Guinea, Samoa, Seychelles, Solomon Islands, Tuvalu and Vanuatu.
As at 30 June 2020, Australia held around 1.38 per cent of the total voting power at the IMF. The constituency as a whole held around 3.78 per cent.
By agreement between constituency members, the staffing of Australia’s constituency office rotates among constituency members. As at 30 June 2020, the constituency’s Executive Director position was held by Mr Nigel Ray of Australia.
Australia’s Article IV consultationIn accordance with Article IV of its Articles of Agreement, the IMF conducts regular consultations with the authorities of member countries on economic policies and conditions. The IMF’s 2019 Article IV consultation with Australia took place between 3 and 13 December 2019 and included consultation with stakeholders from across government, the private sector, and think tanks. The 2019 Article IV Report on Australia was released on 5 March 2020.

160 The Treasury Annual Report 2019–20
Australia’s quota in the International Monetary Fund and financial transactions
Australia’s quota in the International Monetary FundA member’s ‘quota’ is its allocated shareholding in the IMF, which broadly reflects its weight in the global economy. Australia’s quota at 30 June 2020 was 6,572.4 million Special Drawing Rights (SDR) (equivalent to approximately A$13,213.5 million at 30 June 2020). Part of Australia’s quota is held in reserve by the IMF in SDRs and gold. Part is held in Australia by the RBA in a combination of non-interest bearing promissory notes and cash amounts in Australian dollars.
Australia’s financial transactions with the International Monetary FundAustralia conducts a range of financial transactions to manage its obligations with the IMF. Transactions in 2019-20 were all completed in a timely and efficient manner. They are described in the following sections, on a cash basis.
Special Drawing Right charges, interest and assessment feeThe SDR is an international reserve asset created by the IMF to supplement the official reserves of member countries. Its value is based on a basket of five international currencies (the US dollar, the Japanese yen, the British pound sterling, the Chinese renminbi and the euro).
Australia’s cumulative allocation of SDRs at 30 June 2020 was around SDR 3.08 billion while our actual SDR holdings were around SDR 3.16 billion. Australia’s SDR allocation is held by the RBA, having been sold to the RBA by the Commonwealth in exchange for Australian dollars. The IMF levies charges on the SDRs that have been allocated to each member and pays interest on the SDRs that are held by each member.1 In 2019-20, the Australian Government paid charges of SDR 23,647,828 (approx. A$48.09 million) on net cumulative allocations. During this period the RBA received SDR 24,040,784 (approx. A$48.89 million) in interest from the IMF on Australia’s SDR holdings.
In addition, the IMF levies an annual assessment fee to cover the cost of operating the SDR department at the IMF. This is determined according to participants’ net cumulative SDR allocations. Australia’s annual assessment fee for the IMF financial year ending 30 April 2020 was SDR 40,971 (approx. A$86,638).
RemunerationRemuneration is interest earned on quota resources held by the IMF, excluding gold. In 2019-20, Australia received SDR 5,937,499 (approx. A$12.08 million) in remuneration.
1 Charges and interest payments are accrued daily and paid quarterly. The SDR interest rate is the primary rate from which other rates are derived and is based on a weighted average of representative interest rates on short term debt in the money markets of the SDR basket of currencies. The basic rate of charge is equal to the SDR interest rate, plus a margin. Additional burden sharing adjustments,forthefinancialconsequencesofprotractedarrears,isalsoapplied(whenapplicable)tothebasicrateofcharge.
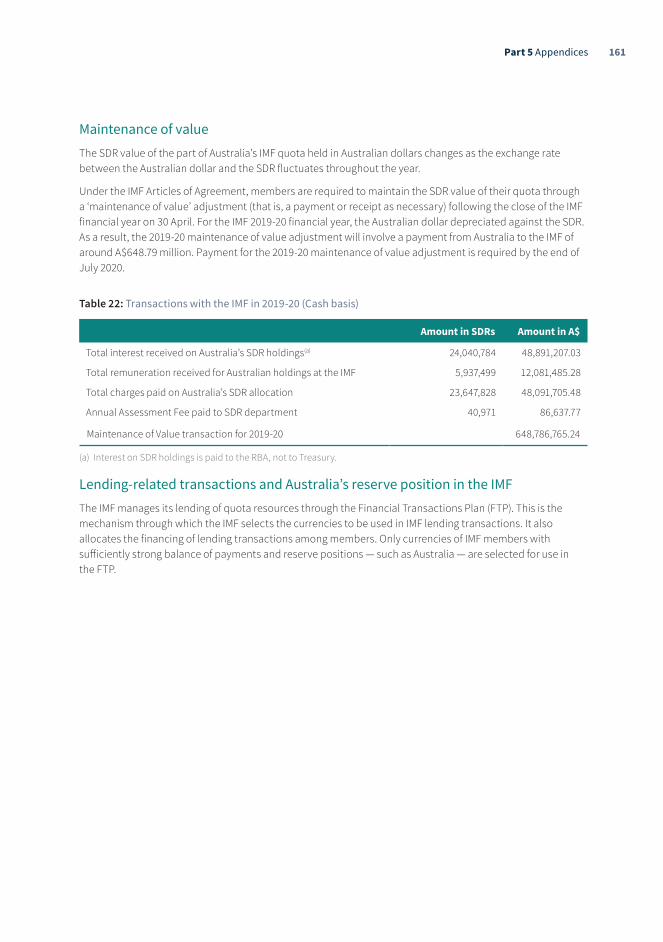
161Part 5 Appendices
Maintenance of valueThe SDR value of the part of Australia’s IMF quota held in Australian dollars changes as the exchange rate between the Australian dollar and the SDR fluctuates throughout the year.
Under the IMF Articles of Agreement, members are required to maintain the SDR value of their quota through a ‘maintenance of value’ adjustment (that is, a payment or receipt as necessary) following the close of the IMF financial year on 30 April. For the IMF 2019-20 financial year, the Australian dollar depreciated against the SDR. As a result, the 2019-20 maintenance of value adjustment will involve a payment from Australia to the IMF of around A$648.79 million. Payment for the 2019-20 maintenance of value adjustment is required by the end of July 2020.
Table 22: Transactions with the IMF in 2019-20 (Cash basis)
Amount in SDRs Amount in A$
Total interest received on Australia’s SDR holdings(a) 24,040,784 48,891,207.03
Total remuneration received for Australian holdings at the IMF 5,937,499 12,081,485.28
Total charges paid on Australia’s SDR allocation 23,647,828 48,091,705.48
Annual Assessment Fee paid to SDR department 40,971 86,637.77
Maintenance of Value transaction for 2019-20 648,786,765.24
(a) Interest on SDR holdings is paid to the RBA, not to Treasury.
Lending-related transactions and Australia’s reserve position in the IMFThe IMF manages its lending of quota resources through the Financial Transactions Plan (FTP). This is the mechanism through which the IMF selects the currencies to be used in IMF lending transactions. It also allocates the financing of lending transactions among members. Only currencies of IMF members with sufficiently strong balance of payments and reserve positions — such as Australia — are selected for use in the FTP.

162 The Treasury Annual Report 2019–20
Table 23 provides details of individual FTP transactions and the resulting reserve position at the IMF.
Table 23: Australia’s reserve tranche position in the IMF, 2019-20
Date DescriptionDebit
(SDRs)Debit
(A$) Credit
(SDRs)Credit
(A$)
Reserve tranche position as at 30 June 2019(a) 826,329,410 1,637,917,562
FTP payments
7-Jul-19 FTP Loan to Pakistan 75,000,000 148,511,910.66
16-Jul-19 FTP Loan to Argentina 75,000,000 148,185,322.54
18-Dec-19 FTP Loan to Barbados 35,000,000 70,400,579.30
30-Mar-20 FTP Loan to Jordan 32,930,000 74,150,801.07
7-Apr-20 FTP Loan to Morocco 52,000,000 116,329,794.97
21-Apr-20 FTP Loan to Bolivia 120,100,000 257,312,848.29
1-May-20 FTP Loan to Dominican Republic 214,400,000 446,998,190.32
FTP receipts
Total Repayments 0 0
Reserve tranche position as at 30 June 2020(a) 1,430,759,410 2,872,370,636.26
(a) Because Australia’s reserve tranche position is denominated in SDRs and AUD/SDR exchange rates vary during the year, when expressed in Australian dollars the closing position does not exactly equal the summation of the opening position and transactions during the year.
FTP transactions (and any transfers for administrative purposes) directly impact on Australia’s reserve position at the IMF. In 2019-20 the amount of Australia’s reserves held by the IMF increased from around SDR 826 million to around SDR 1,431 million.
Through the New Arrangements to Borrow, Australia and 39 other member countries have committed to lend additional resources to the IMF. The New Arrangements to Borrow constitutes a second line of funding defence to supplement IMF resources to forestall or cope with an impairment of the international monetary system. The New Arrangements to Borrow is used in circumstances in which the IMF needs to supplement its quota resources for lending purposes. The New Arrangements to Borrow is covered by general activation periods of up to six months, with each activation period subject to a specified maximum level of commitments. Australia has received New Arrangements to Borrow repayments following past New Arrangements to Borrow lending; however, the New Arrangements to Borrow is not currently active or being called upon.
In 2019-20, Australia received total New Arrangements to Borrow repayments of SDR 51,295,833 (approx. A$106.79 million).
Table 24: Australia’s NAB Transactions in 2019-20
DescriptionDebit
(SDRs)Debit
(A$) Credit
(SDRs)Credit
(A$)
Total NAB loans (payments) 0 0
Total NAB receipts (repayments) 51,295,833 106,789,938
Net NAB payments for 2019-20 51,295,833 106,789,938
The Australian Government earns interest on any money lent under the NAB2. In 2019-20, the Australian Government received interest payments on its NAB loans of SDR 1,111,608 (approx. A$2.26 million).
2 Interest is calculated using the SDR interest rate, accrued daily and paid quarterly.

163Part 5 Appendices
Australia and the World Bank Group
Australia’s shareholding and relations with the World Bank Group
MandateThe World Bank Group (WBG) is a multilateral development bank charged with providing financial services, through advice, direct loans, grants, and brokerage to support stable and inclusive growth within countries and across and between regions. It works closely with the IMF, which is responsible for ensuring the stability of the international monetary system.
The WBG’s twin goals are ending extreme poverty and building shared prosperity.
World Bank Strategic PrioritiesThe WBG is committed to collaborating with multilateral institutions, sovereigns and the private sector to mobilise financing and leverage knowledge to ensure assistance is harmonised and effective. It is also committed to working with the private sector and is implementing an overarching strategy to substantially increase the volume of private sector funds invested in developing and emerging market economies.
Institutions of the World Bank Group � International Bank for Reconstruction and Development (IBRD)
� International Development Association (IDA)
� International Finance Corporation (IFC)
� Multilateral Investment Guarantee Agency (MIGA)
� International Centre for Settlement of Investment Disputes (ICSID).
The IBRD and IDA make up the core of the World Bank. The IBRD lends to governments of middle-income and credit-worthy low-income countries, while IDA provides grants and interest-free or concessional loans to governments of poorer countries.
The IFC is the largest global development institution focused exclusively on the private sector. It helps developing countries achieve sustainable growth by financing, in association with private investors the establishment, improvement and expansion of productive private enterprises which will contribute to the development of its member countries.
The MIGA promotes foreign direct investment into developing countries by offering political risk insurance (guarantees) to investors and lenders. The ICSID provides international facilities for conciliation and arbitration of investment disputes.
Australia’s membership of the IBRD, IFC and MIGA requires the Australian Government to hold shares in these institutions. Australia’s shareholdings as at 30 June 2020 are set out in Table 25.

164 The Treasury Annual Report 2019–20
Table 25: Australian shareholdings at the World Bank Group as at 30 June 2020
IBRD IFC MIGA
Shares 31,592 360,864 3,019
Price per share (US$) 120,635 1,000 10,820
Value of total capital (US$ millions) 3,811.1 360.86 32.67
Value of paid-in capital (US$ millions) 233.35 360.86 6.20
Value of callable capital (US$ millions) 3,577.75 0.00 26.46
Value of total capital (A$ millions) 5,523.34 522.99 67.51
Australia’s shareholding and voting power is listed in Table 26:
Table 26: Australia’s shareholding and voting power in the World Bank Group
IBRD IDA IFC MIGA
Shareholding (per cent of total) 1.32 - 1.84 1.70
Voting power (per cent of total) 1.28 1.25 1.77 1.49
Note: Shareholdings and voting power as at 30 June 2020. Shareholding and voting power differ in IBRD, IFC and MIGA due to the allocation of basic votes across countries. At ICSID, the Administrative Council comprises a representative from each contracting state with equal voting power.
Each arm of the WBG has its own arrangement for allocating votes and shares among members. The Board of Governors and Executive Directors continue to work towards ensuring the WBG has adequate resources to complete its mission and that its shareholding reflects changes in the world economy.
In addition to the shareholdings managed by Treasury, the Department of Foreign Affairs and Trade contributes to replenishments to IDA and funds for joint activities through Australia’s country, regional and global programs. The DFAT annual report provides information on Australia’s aid program.
Australia’s cooperation with the World Bank GroupAustralia is actively involved in WBG strategy, supporting efforts to strengthen its governance and optimise its effectiveness. Membership also enables Australia to pursue economic development outcomes for our region as well as promote the benefits of an open global economy. The rationale for Australia’s active participation in the WBG and how it aligns closely with our national interests and aid priorities is highlighted in the Foreign Policy White Paper.
Australia has also been a strong voice calling for optimal use of the WBG’s balance sheet and crowding in private sector finances, both at the WBG and in the G20 forums.
Australia’s representation at the World Bank Group
Board of Governors
The highest decision-making body of the WBG is the Board of Governors, comprising one governor from each of the 189 member countries. In 2019-20, Australia’s Governor was the Treasurer, the Hon Josh Frydenberg MP. Australia’s Alternate Governor was the Assistant Treasurer, the Hon Michael Sukkar MP.

165Part 5 Appendices
Table 27 outlines the Australian Governors’ votes for the 2019-20 financial year.
Table 27: Australian Governors’ votes on World Bank Group resolutions in 2019-20
Institution Resolution title DateAustralian Governors’
vote
IBRD Remuneration of Executive Directors and their Alternates
4 September 2019 Approved
IBRD Review of Remuneration of Executive Directors and their Alternates
4 September 2019 Approved
IBRD Transfer from Surplus to Fund the IBRD Fund for Innovative Global Public Good Solutions
20 September 2019 Approved
IFC Membership of Bunei Darussalam 25 February 2020 Approved
IDA Additions to Resources: Nineteenth Replenishment
25 March 2020 Approved
IDA Membership of Bulgaria 22 May 2020 Approved
Executive Director and Constituency Office
The WBG’s Executive Boards (IBRD, IDA, IFC and MIGA) conduct the day-to-day business of the WBG and determine matters of policy under the overall authority of the Board of Governors.
Australia belongs to a constituency of countries from the Asia-Pacific region that includes: Cambodia, Kiribati, the Republic of Korea, Marshall Islands, Federated States of Micronesia, Mongolia, Nauru, New Zealand, Palau, Papua New Guinea, Samoa, Solomon Islands, Tuvalu and Vanuatu. The constituency is represented by one Executive Director on the Board of Executive Directors. By agreement, Australia and Korea rotate this role. In 2019-20, the Executive Director was Mr Kunil Hwang from Korea. Mr Gerry Antioch from Australia held the Alternate Executive Director position. Australia also has an adviser in the constituency office.

166 The Treasury Annual Report 2019–20
Consumer data rightThe Consumer Data Right program seeks to give individuals and businesses the right to safely access certain data about themselves held by businesses, and direct that access to this data be given to accredited, trusted third parties of their choice. The Consumer Data Right is to be an economy wide initiative rolled out on a sector-by-sector basis, starting in the banking sector (where it is known as Open Banking).
The Consumer Data Right requires the involvement of a number of government bodies, including Treasury, the Australian Competition and Consumer Commission (ACCC), the Office of the Australian Information Commissioner and the newly established Data Standards Body which resides in the Commonwealth Scientific and Industrial Research Organisation.
Treasury has continued to progress implementation of the Consumer Data Right through 2019-2020. The regime commenced from 1 July 2019, when three of the four major banks voluntarily made product reference data available for specific account types. On 12 August 2019, the Treasury Laws Amendment (Consumer Data Right) Act 2019 received Royal Assent, formally creating the legal basis for the Consumer Data Right. On 4 February 2020, the ACCC made the Competition and Consumer (Consumer Data Right) Rules 2020 to facilitate a minimum viable product for consumer data sharing, and the Data Standards Body made the supporting technical standards. From 1 July 2020, consumers have been able to direct the four major banks to share usage information relating to specific data sets with accredited third parties.
Data standards chairThe position of Data Standards Chair was created upon commencement of the Treasury Laws Amendment (Consumer Data Right) Act 2019 on 12 August 2019. The Treasurer appointed Mr Andrew Stevens as the Chair on 14 August 2019.
The Chair is an official of Treasury. The legislated functions and powers of the Chair are to make and review the Consumer Data Right’s Data Standards, and establish committees, advisory panels and consultative groups to assist with stakeholder consultation for the development of the Data Standards. For each new sector of the Consumer Data Right, the Chair is to develop data transfer, format and security standards. Standards are to be developed in accordance with the requirements of the Consumer Data Right rules, which are made by the ACCC. The Chair is supported by the Data Standards Body.
Over 2019-20, the Chair has issued three iterations of the Data Standards to support the February, July and November 2020 launch stages of the regime, together with supporting customer experience and general guidance material.
The Chair also established a Data Standards Advisory Committee, holding ten meetings during the period; and an Energy Data Standards Advisory Committee, holding six meetings during the period. Additionally, he established other consultative processes including a GitHub forum, various working groups and stakeholder workshops. The research agenda for the period explicitly included a focus on vulnerable consumers, which is intended to continue into 2020-21.

167Part 5 Appendices
Resource tablesTable 28: Summary resource statement
Actual available Payments Balance appropriation made remaining
2019-20 2019-20 2019-20 $’000 $’000 $’000 (a) (b) (a - b) Ordinary annual services1 Departmental
Departmental appropriation2 300,551 221,476 79,075Total 300,551 221,476 79,075
Administered expensesOutcome 1 122,549 113,906 8,643 Payment to Corporate entities - - - Total 122,549 113,906 8,643
Total ordinary annual services A 423,100 335,382 87,718 Other services3
Departmental non-operatingEquity injections 2,164 1,234 930 Total 2,164 1,234 930
Administered non-operatingAdministered assets and liabilities
Outcome 1 165,000 165,000 -Total 165,000 165,000 -
Total other services B 167,164 166,234 930 Total available annual
appropriations and payments (A+B) 590,264 501,616 Special appropriations
Asian Development Bank (Additional Subscription) Act 2009 25,467
Asian Infrastructure Investment Bank Act 2015 215,376 Federal Financial Relations Act 2009 93,086,036 International Monetary Agreements Act 1947 368,204 Public Governance, Performance and Accountability Act 2013 -
Total special appropriations C 93,695,083 Special accounts4
Opening balance 239,677 Appropriation receipts 47,648,721 Non-appropriation receipts to Special Accounts 2,534,278 Payments made 12,011,804 Transfers made to other entities 37,961,055
Total special account D 50,422,676 49,972,859 Total resourcing and payments (A+B+C+D)5 51,012,940 144,169,558
Less appropriation drawn from annual or special appropriations and/or Corporate entities through annual appropriations credited to special accounts
- -
Total net resourcing for the Treasury 51,012,940 144,169,558

168 The Treasury Annual Report 2019–20
1. Appropriation Act (No. 1) 2019-20 and Appropriation Act (No. 3) 2019-20. This may also include Prior Year departmental appropriation and section 74 relevant agency receipts.
2. Includes an amount of $10.212 million for the Departmental Capital Budget. For accounting purposes this amount has been designated as ‘contributions by owners’.
3. Appropriation Act (No. 2) 2019-20.
4. Does not include ‘Special Public Money’ held in accounts like Other Trust Monies account (OTM), Services for other Government and Non-agency Bodies accounts (SOG), or Services for Other Entities and Trust Moneys Special accounts (SOETM).
5. Total resourcing excludes the actual available appropriation for all Special Appropriations.
Note: Details of appropriations are disclosed in Note 6 of the Financial Statements.

169Part 5 Appendices
Table 29: Resourcing for Outcome 1
Outcome 1: Informed decisions on the development and implementation of policies to improve the wellbeing of the Australian people, including by achieving strong, sustainable economic growth, through the provision of advice to government and the efficient administration of federal financial relations.
Budget 2019-20
$’000 (a)
Actual expenses
2019-20 $’000
(b)
Variation 2019-20
$’000 (a - b)
Program 1.1: Department of the Treasury Departmental expenses
Departmental appropriations1 203,227 206,951 (3,724) Special accounts - - - Expenses not requiring appropriation 10,482 23,027 (12,545)
Administered expensesOrdinary annual services (Appropriation Bill No. 1) 86,169 121,769 (35,600)Special appropriation: PGPA Act 2013-s77 repayments 1,000 - 1,000 Special accounts 36,587,354 37,961,055 (1,393,701)Expense not requiring appropriations 38,264 6,735 31,529- Total for Program 1.1 36,906,496 38,319,537 (1,413,041)
Program 1.2: Payments to International FinancialInstitutions
Administered expensesSpecial appropriations 71,559 37,577 33,982Expenses not requiring appropriation 40,774 548,488 (507,714) Total for Program 1.2 112,333 586,065 (473,732)
Program 1.3: Support for Markets and BusinessAdministered expenses
Ordinary annual services (Appropriation Bill No. 1) 69 63 6Expenses not requiring appropriation - 93,385 (93,385)Total for Program 1.3 69 93,448 (93,379)
Program 1.4: General Revenue AssistanceAdministered expenses
Special appropriations 67,200,000 60,235,053 6,964,947 Special accounts 1,853,340 1,792,419 60,921Total for Program 1.4 69,053,340 62,027,472 7,025,868
Program 1.5: Assistance to the States for HealthcareServices
Administered expensesSpecial appropriations 22,534,601 22,560,368 (25,767)Total for Program 1.5 22,534,601 22,560,368 (25,767)
Program 1.6: Assistance to the States for Skills andWorkforce Development
Administered expensesSpecial appropriations 1,538,566 1,538,566 - Total for Program 1.6 1,538,566 1,538,566 -
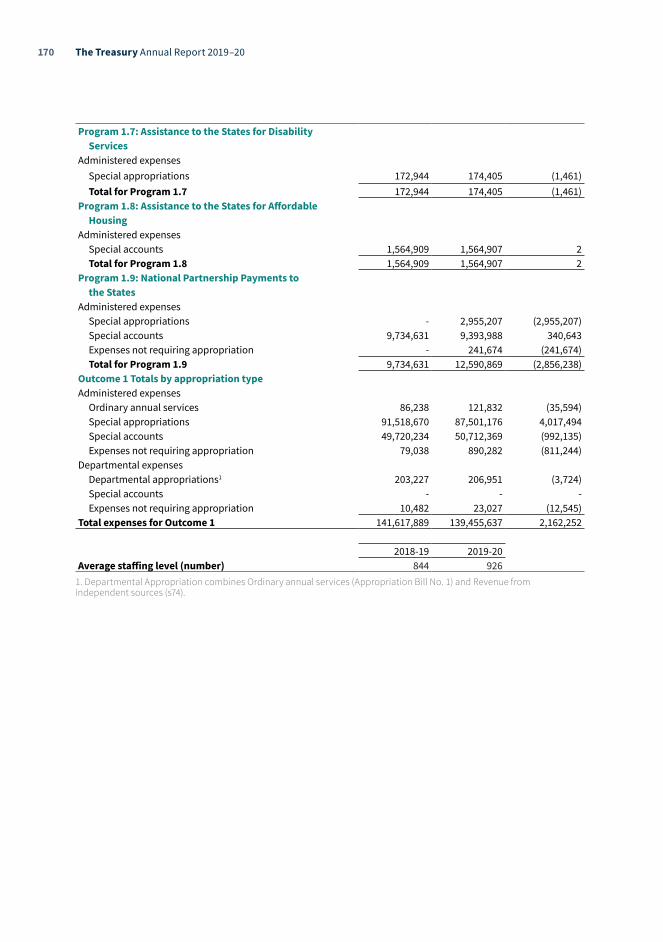
170 The Treasury Annual Report 2019–20
Program 1.7: Assistance to the States for DisabilityServices
Administered expensesSpecial appropriations 172,944 174,405 (1,461)Total for Program 1.7 172,944 174,405 (1,461)
Program 1.8: Assistance to the States for Affordable Housing
Administered expensesSpecial accounts 1,564,909 1,564,907 2Total for Program 1.8 1,564,909 1,564,907 2
Program 1.9: National Partnership Payments to the States
Administered expensesSpecial appropriations - 2,955,207 (2,955,207) Special accounts 9,734,631 9,393,988 340,643Expenses not requiring appropriation - 241,674 (241,674) Total for Program 1.9 9,734,631 12,590,869 (2,856,238)
Outcome 1 Totals by appropriation typeAdministered expenses
Ordinary annual services 86,238 121,832 (35,594)Special appropriations 91,518,670 87,501,176 4,017,494 Special accounts 49,720,234 50,712,369 (992,135)Expenses not requiring appropriation 79,038 890,282 (811,244)
Departmental expensesDepartmental appropriations1 203,227 206,951 (3,724) Special accounts - - - Expenses not requiring appropriation 10,482 23,027 (12,545)
Total expenses for Outcome 1 141,617,889 139,455,637 2,162,252
2018-19 2019-20 Average staffing level (number) 844 926
1. Departmental Appropriation combines Ordinary annual services (Appropriation Bill No. 1) and Revenue from independent sources (s74).

171Part 5 Appendices
List of RequirementsDescription Requirement Part of the Report
Letter of transmittal
A copy of the letter of transmittal signed and dated by the accountable authority on date final text approved, with statement that the report has been prepared in accordance with section 46 of the Act and any enabling legislation that specifies additional requirements in relation to the annual report.
Mandatory Letter of transmittal
Aids to access
Table of contents. Mandatory Table of contents
Alphabetical index. Mandatory Index
Glossary of abbreviations and acronyms. Mandatory Glossary
List of requirements. Mandatory List of requirements
Details of contact officer. Mandatory Introduction and guide to the report
Entity’s website address. Mandatory Introduction and guide to the report
Electronic address of report. Mandatory Introduction and guide to the report
Review by the accountable authority
A review by the accountable authority of the entity. Mandatory Secretary’s review
Overview of the entity
A description of the role and functions of the entity. Mandatory Departmental overview
A description of the organisational structure of the entity.
Mandatory Departmental overview
A description of the outcomes and programmes administered by the entity.
Mandatory Departmental overview
A description of the purposes of the entity as included in the corporate plan.
Mandatory Departmental overview
Name of the accountable authority or each member of the accountable authority.
Mandatory Departmental overview
Position title of the accountable authority or each member of the accountable authority.
Mandatory Departmental overview
Period as the accountable authority or member of the accountable authority within the reporting period.
Mandatory Departmental overview
An outline of the structure of the portfolio of the entity.
Portfolio departments - mandatory
Financial performance
Where the outcomes and programs administered by the entity differ from any Portfolio Budget Statement, Portfolio Additional Estimates Statement or other portfolio estimates statement that was prepared for the entity for the period, include details of variation and reasons for change.
If applicable, mandatory
Financial performance

172 The Treasury Annual Report 2019–20
Description Requirement Part of the Report
Report on the performance of the entity
Annual performance statements
Annual performance statements in accordance with paragraph 39(1)(b) of the Act and section 16F of the Rule.
Mandatory Annual performance statements
Report on financial performance
A discussion and analysis of the entity’s financial performance.
Mandatory Financial performance
A table summarising the total resources and total payments of the entity.
Mandatory Resource tables
If there may be significant changes in the financial results during or after the previous or current reporting period, information on those changes, including: the cause of any operating loss of the entity; how the entity has responded to the loss and the actions that have been taken in relation to the loss; and any matter or circumstances that it can reasonably be anticipated will have a significant impact on the entity’s future operation or financial results.
If applicable, mandatory
Resource tables
Management and accountability
Corporate governance
Information on compliance with section 10 (fraud systems).
Mandatory Corporate governance
A certification by the accountable authority that fraud risk assessments and fraud control plans have been prepared.
Mandatory Letter of transmittal
A certification by the accountable authority that appropriate mechanisms for preventing, detecting incidents of, investigating or otherwise dealing with, and recording or reporting fraud that meet the specific needs of the entity are in place.
Mandatory Letter of transmittal
A certification by the accountable authority that all reasonable measures have been taken to deal appropriately with fraud relating to the entity.
Mandatory Letter of transmittal
An outline of structures and processes in place for the entity to implement principles and objectives of corporate governance.
Mandatory Corporate governance
A statement of significant issues reported to the minister under paragraph 19(1)(e) of the act that relates to non-compliance with finance law and action taken to remedy non-compliance.
If applicable, mandatory
N/A
Audit committee
A direct electronic address of the charter determining the functions of the entity’s audit committee.
Mandatory Corporate governance

173Part 5 Appendices
Description Requirement Part of the Report
The name of each member of the entity’s audit committee.
Mandatory Corporate governance
The qualifications, knowledge, skills or experience of each member of the entity’s audit committee.
Mandatory Corporate governance
Information about the attendance of each member of the entity’s audit committee at committee meetings.
Mandatory Corporate governance
The remuneration of each member of the entity’s audit committee.
Mandatory Corporate governance
External scrutiny
Information on the most significant developments in external scrutiny and the entity’s response to the scrutiny.
Mandatory External scrutiny
Information on judicial decisions and decisions of administrative tribunals and by the Australian Information Commissioner that may have a significant effect on the operations of the entity.
If applicable, mandatory
External scrutiny
Information on any reports on operations of the entity by the Auditor-General (other than report under section 43 of the Act), a Parliamentary Committee, or the Commonwealth Ombudsman.
If applicable, mandatory
External scrutiny
Information on any capability reviews on the entity that were released during the period.
If applicable, mandatory
External scrutiny
Management of human resources
An assessment of the entity’s effectiveness in managing and developing employees to achieve entity objectives.
Mandatory Management of human resources
Statistics on the entity’s Australian Public Service employees on an ongoing and non-ongoing basis; including the following: • Statistics on staffing classification level; • Statistics on full-time employees; • Statistics on part-time employees; • Statistics on gender; • Statistics on staff location; • Statistics on employees who identify as
Indigenous.
Mandatory Management of human resources
Information on any enterprise agreements, individual flexibility arrangements, Australian workplace agreements, common law contracts and determinations under subsection 24(1) of the Public Service Act 1999.
Mandatory Management of human resources
Information on the number of Senior Executive Service and non-SES employees covered by agreements etc identified in paragraph 17AD(4)(c).
Mandatory Management of human resources
The salary ranges available for Australian Public Service employees by classification level.
Mandatory Management of human resources
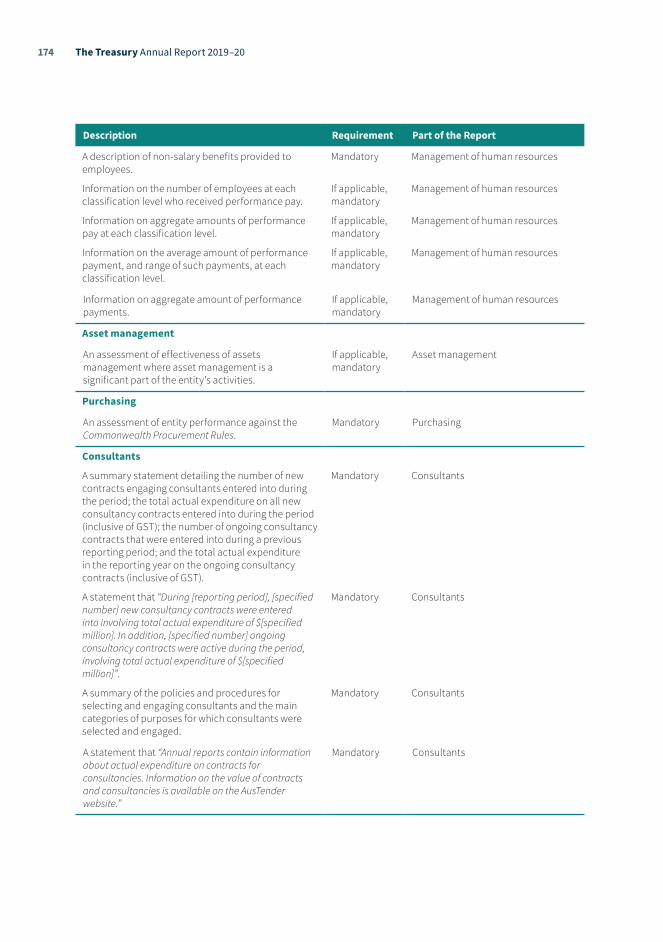
174 The Treasury Annual Report 2019–20
Description Requirement Part of the Report
A description of non-salary benefits provided to employees.
Mandatory Management of human resources
Information on the number of employees at each classification level who received performance pay.
If applicable, mandatory
Management of human resources
Information on aggregate amounts of performance pay at each classification level.
If applicable, mandatory
Management of human resources
Information on the average amount of performance payment, and range of such payments, at each classification level.
If applicable, mandatory
Management of human resources
Information on aggregate amount of performance payments.
If applicable, mandatory
Management of human resources
Asset management
An assessment of effectiveness of assets management where asset management is a significant part of the entity’s activities.
If applicable, mandatory
Asset management
Purchasing
An assessment of entity performance against the Commonwealth Procurement Rules.
Mandatory Purchasing
Consultants
A summary statement detailing the number of new contracts engaging consultants entered into during the period; the total actual expenditure on all new consultancy contracts entered into during the period (inclusive of GST); the number of ongoing consultancy contracts that were entered into during a previous reporting period; and the total actual expenditure in the reporting year on the ongoing consultancy contracts (inclusive of GST).
Mandatory Consultants
A statement that “During [reporting period], [specified number] new consultancy contracts were entered into involving total actual expenditure of $[specified million]. In addition, [specified number] ongoing consultancy contracts were active during the period, involving total actual expenditure of $[specified million]”.
Mandatory Consultants
A summary of the policies and procedures for selecting and engaging consultants and the main categories of purposes for which consultants were selected and engaged.
Mandatory Consultants
A statement that “Annual reports contain information about actual expenditure on contracts for consultancies. Information on the value of contracts and consultancies is available on the AusTender website.”
Mandatory Consultants

175Part 5 Appendices
Description Requirement Part of the Report
Australian National Audit Office access clauses
If an entity entered into a contract with a value of more than $100,000 (inclusive of GST) and the contract did not provide the Auditor-General with access to the contractor’s premises, the report must include the name of the contractor, purpose and value of the contract, and the reason why a clause allowing access was not included in the contract.
If applicable, mandatory
Purchasing
Exempt contracts
If an entity entered into a contract or there is a standing offer with a value greater than $10,000 (inclusive of GST) which has been exempted from being published in AusTender because it would disclose exempt matters under the FOI Act, the annual report must include a statement that the contract or standing offer has been exempted, and the value of the contract or standing offer, to the extent that doing so does not disclose the exempt matters.
If applicable, mandatory
Purchasing
Small business
A statement that “[Name of entity] supports small business participation in the Commonwealth Government procurement market. Small and Medium Enterprises and Small Enterprise participation statistics are available on the Department of Finance’s website.”
Mandatory Purchasing
An outline of the ways in which the procurement practices of the entity support small and medium enterprises.
Mandatory Purchasing
If the entity is considered by the department administered by the Minister for Finance as material in nature—a statement that “[Name of entity] recognises the importance of ensuring that small businesses are paid on time. The results of the Survey of Australian Government Payments to Small Business are available on the Treasury’s website.”
If applicable, mandatory
Purchasing
Financial statements
Inclusion of the annual financial statements in accordance with subsection 43(4) of the Act.
Mandatory Financial statements
Executive remuneration
Information about executive remuneration in accordance with Subdivision C of Division 3A of Part 2-3 of the Rule.
Mandatory Executive remuneration

176 The Treasury Annual Report 2019–20
Description Requirement Part of the Report
Other mandatory information
Advertising and market research
If the entity conducted advertising campaigns, a statement that “During [reporting period], the [name of entity] conducted the following advertising campaigns: [name of advertising campaigns undertaken]. Further information on those advertising campaigns is available at [address of entity’s website] and in the reports on Australian Government advertising prepared by the Department of Finance. Those reports are available on the Department of Finance’s website.”
If applicable, mandatory
Advertising and market research
If the entity did not conduct advertising campaigns, a statement to that effect.
If applicable, mandatory
Advertising and market research
Grants
A statement that “Information on grants awarded to [name of entity] during [reporting period] is available at [address of entity’s website].”
If applicable, mandatory
Grants
Disability reporting
Outline of mechanisms of disability reporting, including reference to website for further information.
Mandatory Disability reporting
Information Publication Scheme
Website reference to where the entity’s Information Publication Scheme statement pursuant to Part II of Freedom of Information Act 1982 can be found.
Mandatory Information Publication Scheme
Corrections
Correction of material errors in previous annual report.
If applicable, mandatory
N/A
Other information
Information required by other legislation. Mandatory Work health and safety
Ecologically sustainable development and environmental performance
Australia and the International Financial Institutions
Consumer data right
Carer support

177Part 5 Appendices
Abbreviations and AcronymsAASB Office of the Australian Accounting Standards Board
ABS Australian Bureau of Statistics
ACCC Australian Competition and Consumer Commission
ACL Australian Consumer Law
ADB Asian Development Bank
ADI Authorised Deposit-taking Institutions
AIIB Asian Infrastructure Investment Bank
ANAO Australian National Audit Office
AOFM Australian Office of Financial Management
APCA Australian Payments Clearing Association
APEC Asia-Pacific Economic Cooperation
APRA Australian Prudential Regulation Authority
APS Australian Public Service
APSC Australian Public Service Commission
ARPC Australian Reinsurance Pool Corporation
ASIC Australian Securities and Investments Commission
ASL Average staffing level
ASX Australian Securities Exchange Limited
ATO Australian Taxation Office
AUASB Office of the Auditing and Assurance Standards Board
CAF Legislative and Governance Forum on Consumer Affairs
CCA Competition and Consumer Act 2010
CFR Council of Financial Regulators
CGC Commonwealth Grants Commission
CMT Crisis Management Team
COAG Council of Australian Governments
COVID-19 2019 novel coronavirus
CPRs Commonwealth Procurement Rules
CRO Chief Risk Officer
CSEF Crowd-sourced equity funding
DFAT Department of Foreign Affairs and Trade
EAP Employee Assistance Program
EL Executive level
EMP Environmental Management Plan
FOI Act Freedom of Information Act 1982
FIMS2 Foreign Investment Management System Version 2

178 The Treasury Annual Report 2019–20
FRC Financial Reporting Council
FSB Financial Stability Board
FTE Full time equivalent
FTP Financial Transaction Plan
GDP Gross domestic product
GIH Global Infrastructure Hub
GST Goods and services tax
HSC Health and Safety Committee
HVAC Heating, Ventilation and Air-conditioning
IAGDP Indigenous Australian Government Development Program
IBRD International Bank for Reconstruction and Development
ICSID International Centre for Settlement of Investment Disputes
ICT Information and Communication Technology
IDA International Development Association
IFC International Finance Corporation
IFIs International Financial Institutions
IGT Inspector-General of Taxation
ILS Integrated Leadership System
IMF International Monetary Fund
IMFC International Monetary and Financial Committee
IPAA Institute of Public Administration Australia
IPS Information Publication Scheme
IWC Inclusive Workplace Committee
KMP Key Management Personnel
L&D Learning and Development
LED Light Emitting Diode
MIGA Multilateral Investment Guarantee Agency
MOPAN Multilateral Organisation Performance Assessment Network
MYEFO Mid-Year Economic and Fiscal Outlook
NCC National Competition Council
NDRC National Development and Reform Commission
NAB New Arrangements to Borrow
NIIS National Injury Insurance Scheme
OECD Organisation for Economic Co-operation and Development
OTC Over-the-counter
PBS Portfolio Budget Statements
PBO Parliamentary Budget Office
PC Productivity Commission

179Part 5 Appendices
PDS Performance Development System
PGPA Act Public Governance, Performance and Accountability Act 2013
PHIAC Private Health Insurance Administration Council
POSD People and Organisational Strategy Division
RAM Royal Australian Mint
RBA Reserve Bank of Australia
RIS Regulation Impact Statement
RMS Rehabilitation Management System
SDR Special Drawing Rights
SES Senior Executive Service
SMEs Small and Medium Enterprises
SPP Specific Purpose Payment
TES Tax Expenditure Statement
WBG World Bank Group
WELS Water Efficiency Labelling and Standards
WHS Act Work Health and Safety Act 2011
WRC Workplace Relations Committee

180 The Treasury Annual Report 2019–20
GlossaryAccountable authority instructions
Instructions issued to manage the affairs of an entity to promote the efficient, effective, economical and ethical use of Commonwealth resources.
Activities The actions/functions performed by agencies to deliver Government policies.
Administered item Items that are usually managed by an entity on behalf of the Government. Entities do not have control over these items, which are normally related to activities governed by eligibility rules and conditions established by legislation (for example, grants, subsidies and benefit payments).
Annual performance statements
Commonwealth entities report, through their annual performance statements, on the extent to which they have fulfilled the purposes they articulate at the beginning of a reporting year in their corporate plan. They must also report on performance criteria in the portfolio budget statements, portfolio additional estimates statements or other portfolio estimates statements.
Appropriation Public monies the Parliament authorises the Government to withdraw from the Consolidated Revenue Fund for a specified purpose.
APS employee A person engaged under section 22, or a person who is engaged as an Australian Public Service employee under section 72, of the Public Service Act 1999.
Budget Sets out the fiscal and economic outlook for Australia, and includes expenditure and revenue estimates for the current financial year, the budget year, and three forward financial years. It identifies the Government’s social and political priorities and how they will be achieved.
Clear read principle Under the outcomes arrangements, there is an essential clear link between the appropriation bills, the portfolio budget statements, the portfolio additional estimates statements, and annual reports of agencies. Information should be consistent across these and other budget documents, and, where possible, duplication of reporting within the portfolio budget statements should be avoided. This is called the clear read between the different documents.
Under this principle, the planned performance in the portfolio budget statements is to be provided on the same basis as actual performance in the annual reports covering the same period, to permit a clear read across planning and actual performance reporting documents. Agencies should take this into account in designing their performance reporting arrangements.
Consolidated Revenue Fund
The Consolidated Revenue Fund consists of all revenues and moneys raised or received by the executive government of the Commonwealth. The fund is self-executing in nature, which means that all money received by the Commonwealth automatically forms part of the fund.
Consultant A person or organisation providing professional, independent and expert advice or services. Typically the term is used to describe the application of expert skills to investigate or diagnose a defined issue or problem; carry out defined research, reviews or evaluations; or provide independent advice, information or creative solutions to assist an entity in management decision-making.
Contractor A person engaged by an agency, usually on a temporary basis. Treated as an employee of the agency for the purposes of program performance reporting.
Corporate governance
The process by which agencies are directed and controlled. It is generally understood to encompass authority, accountability, stewardship, leadership, direction and control.

181Part 5 Appendices
Corporate plan The primary planning document of a Commonwealth entity that sets out the objectives and strategies the entity intends to pursue in achieving its purposes over at least four reporting periods. A corporate plan explains:
• what an entity’s purposes are
• what it will do to achieve its purposes
• how it will know that it has achieved its purposes.
Departmental item Departmental items are usually appropriations managed by an entity, and over which the entity has control. That is, the entity’s accountable authority has discretion in delivering the activities and/or allocating resources. Typically, these items include the day-to-day operations and program support activities of an entity.
Enterprise agreement
An employment agreement made directly between an employer and employees.
Financial results The results shown in the financial statements of an agency.
Fraud Dishonestly obtaining a benefit, or causing a loss, by deception or other means. Accountable authorities of Commonwealth entities must take all reasonable measures to prevent, detect and deal with fraud in accordance with section 10 of the Public Governance, Performance and Accountability Rule 2014.
Full-time equivalent
The effective number of full-time employees in an entity, where
an FTE of 1.0 is the equivalent of one full-time person. Part-time employees are converted to full-time equivalents.
Grant An arrangement for the provision of financial assistance by the Commonwealth or on behalf of the Commonwealth: under which relevant money or other Consolidated Revenue Fund money is to be paid to a recipient other than the Commonwealth which is intended to assist the recipient achieve its goals to help to address one or more of the Government’s policy objectives and under which the recipient may be required to act in accordance with specified terms or conditions.
Materiality Takes into account the planned outcome and the relative significance of the resources consumed in contributing to the achievement of that outcome.
Mid-Year Economic and Fiscal Outlook
The Mid-Year Economic and Fiscal Outlook (MYEFO) provides an update of the Government’s budget estimates by examining expenses and revenues in the year to date, as well as provisions for new decisions that have been taken since the budget. The report provides updated information to allow the assessment of the Government’s fiscal performance against the fiscal strategy set out in its current fiscal strategy statement.
Non-ongoing APS employee
A person engaged as an Australian Public Service employee under subsection 22(2)(a) of the Public Service Act 1999.
Official Public Account
The Commonwealth’s central bank account. The Official Public Account is one of a group of linked bank accounts, referred to as the Official Public Account Group of Accounts. Official Public Accounts are maintained by the Reserve Bank of Australia.
Ongoing APS employee
A person engaged as an ongoing Australian Public Service employee under section 22(2)(a) of the Public Service Act 1999.
Operations Functions, services and processes performed in pursuing the objectives or discharging the functions of an entity.
Outcomes The results, impacts or consequences of a purpose or activity, as defined in the annual appropriation acts and the portfolio budget statements, by a Commonwealth entity and company.
Performance information
Evidence about performance that is collected and used systematically, which may relate to appropriateness, effectiveness and efficiency and the extent to which an outcome can be attributed to an intervention. While performance information may be quantitative (numerical) or qualitative (descriptive), it should be verifiable.

182 The Treasury Annual Report 2019–20
Portfolio Budget Statements
The portfolio budget statements inform parliamentarians and the public of the proposed allocation of resources to government outcomes. They also assist the Senate standing committees with their examination of the Government’s budget. Portfolio budget statements are tabled in Parliament on budget night and published as budget-related papers.
Programs Commonwealth programs deliver benefits, services or transfer payments to individuals, organisations or the community as a whole, and/or policy advice to inform government decisions. A program is comprised of activities or groups of activities, as defined in the annual appropriation acts and portfolio budget statements, by a Commonwealth entity and company.
Public Governance, Performance and Accountability Act 2013
The Public Governance, Performance and Accountability Act 2013 (PGPA Act) replaced the Financial Management and Accountability Act 1997 and the Commonwealth Authorities and Companies Act 1997 on 1 July 2014. As the primary piece of Commonwealth resource management legislation, the PGPA Act establishes a coherent system of governance and accountability for public resources, with an emphasis on planning, performance and reporting.
The PGPA Act applies to all Commonwealth entities and Commonwealth companies. A list of Commonwealth entities and companies can be found at: www.finance.gov.au/sites/default/files/pgpa_flipchart.pdf?v=2
Public service care agency
A public service care agency is defined in section 4 of the Carer Recognition Act 2010 to mean an agency as defined in the Public Service Act 1999 that is responsible for the development, implementation, provision or evaluation of policies, programs or services directed to carers or the persons for whom they care.
Risk management The systematic application of policies, procedures and practices to clearly identify, analyse, evaluate, treat and monitor risks associated with identified opportunities. Risk is broadly defined as the effect of uncertainty on objectives or the impacts of unforeseen events or undesirable outcomes.
Senate Estimates hearings
Senate standing committees hold hearings to scrutinise the appropriation bills and any explanatory documentation tabled to accompany them. Public servants are called as witnesses to hearings.
Specific Purpose Payments
Commonwealth payments to the States for specific purposes in order to pursue important national policy objectives in areas that may be administered by the States.

183Part 5 Appendices


