Download - Two DNA nanomachines map pH changes
Two DNA nanomachines map pH changesalong intersecting endocytic pathways insidethe same cellSouvik Modi1, Clement Nizak2, Sunaina Surana1, Saheli Halder1 and Yamuna Krishnan1*
DNA is a versatile scaffold for molecular sensing in living cells, and various cellular applications of DNA nanodevices havebeen demonstrated. However, the simultaneous use of different DNA nanodevices within the same living cell remains achallenge. Here, we show that two distinct DNA nanomachines can be used simultaneously to map pH gradients along twodifferent but intersecting cellular entry pathways. The two nanomachines, which are molecularly programmed to entercells via different pathways, can map pH changes within well-defined subcellular environments along both pathways insidethe same cell. We applied these nanomachines to probe the pH of early endosomes and the trans-Golgi network, in realtime. When delivered either sequentially or simultaneously, both nanomachines localized into and independently capturedthe pH of the organelles for which they were designed. The successful functioning of DNA nanodevices within livingsystems has important implications for sensing and therapies in a diverse range of contexts.
DNA has been molecularly chiselled to create a variety of intri-cate architectures on the nanoscale1. DNA nanoarchitecturesthat can be triggered chemically or physically to switch
between defined states (referred to as DNA nanomachines) havegreat potential for robotic and sensing applications on the nano-scale2,3, and subcellular compartments provide nanoscale environ-ments that offer rich possibilities for demonstrating thefunctionality of these nanoarchitectures4. It was recently demon-strated that a DNA nanomachine can function as a pH sensorinside endosomes in cellulo5 as well as in vivo6. Since then, a fewexciting applications of specific DNA nanostructures have beendemonstrated in cellulo6–9. However, achieving simultaneous func-tionality of multiple DNA nanomachines within the same cellremains a challenge, which, if realized, would open up possibilitiesof multiplexing DNA nanodevices in living systems. The precisepositioning of more than one DNA nanodevice within a subcellularenvironment and demonstration of their simultaneous functionalitytherein is therefore essential. Here, we apply the technology we term‘SimpHony’ (simultaneous pH mapping technology) to deploy twodifferently programmed DNA nanomachines along different cellu-lar endocytic pathways and map pH changes along both pathwayssimultaneously, within the same living cell.
Programming strategy to achieve SimpHonySimultaneous mapping of an analyte such as pH using fluorescenceresonance energy transfer (FRET)-based DNA nanomachinesrequires molecular programming strategies that position each nano-machine along a distinct pathway, as well as a combination of FRETpairs with minimal crosstalk. SimpHony also requires two pH-responsive DNA nanomachines with pH-sensitive regimes suitedto the lumenal pH of the relevant intracellular organelles beinginvestigated. We chose two well-characterized pathways: the furinretrograde endocytic pathway and the transferrin endocytic/recycling pathway. Furin resides predominantly in the trans-Golginetwork (TGN), with a small steady-state population at theplasma membrane, and is transported retrogradely via the early
endosomes/sorting endosomes (EE/SEs) and late endosomes(LEs) to the TGN in a Rab-9-dependent manner10,11. Transferrinbinds the transferrin receptor at the plasma membrane, reachesthe EE/SEs and then the perinuclear recycling endosome (RE)12.The transferrin and furin pathways merge in the EE and thensegregate thereafter into the RE and LE, respectively.
To track the furin pathway, we used a molecularly programmedDNA nanomachine called IFu (Fig. 1a). This adopts the sameworking principle as described previously5,6 and is programmedsuch that (i) the position of the acceptor is optimized to maximizethe observed FRET, (ii) the FRET pair uses Alexa 546 as a donorfluorophore, which allows compatibility of IFu pH measurementsin the presence of ITf fluorophores, and (iii) IFu incorporates an8 bp dsDNA sequence (shaded in grey in Fig. 1a) that functionsas a binding site for an engineered protein (grey cylinders) thatenables its localization to a given endocytic pathway, namely thefurin pathway. Because furin is a retrogradely transported mem-brane protein that lacks a natural ligand, we developed a methodto specifically attach and transport a DNA nanostructure to sucha trafficking protein. This uses a sequence-specific double-strandedDNA (dsDNA) binding protein (single-chain variable fragmentrecombinant antibody, or scFv)13, which is expressed as a chimerawith furin. This sequence-specific, dsDNA-binding protein wasobtained from a phage display screen of scFv recombinant anti-bodies against a dsDNA epitope. This scFv specifically binds adsDNA sequence d(AT)4 (Fig. 1c) with a dissociation constant KDof �80 nM (Fig. 1d). Thus an N-terminal fusion of the scFvdomain with furin, when expressed inside cells, will act as an artifi-cial receptor for a DNA nanostructure that incorporates a d(AT)4sequence and will traffic the latter along the retrograde furin endo-cytic pathway into the TGN (Fig. 1b).
To track the transferrin pathway, we engineered a two-strandedpH-sensitive DNA nanomachine, ITf (Fig. 1a). ITf uses intrastrandi-motif formation to undergo a pH-dependent conformationalchange and therefore functions as a FRET-based pH sensor.ITf has a pH-responsive C-rich segment, shown in purple in
1National Centre for Biological Sciences, TIFR, GKVK, Bellary Road, Bangalore 560065, India, 2Laboratoire Interdisciplinaire de Physique, UMR5588CNRS-Universite Grenoble I, Grenoble, France. *e-mail: [email protected]
ARTICLESPUBLISHED ONLINE: 26 MAY 2013 | DOI: 10.1038/NNANO.2013.92
NATURE NANOTECHNOLOGY | VOL 8 | JUNE 2013 | www.nature.com/naturenanotechnology 459
© 2013 Macmillan Publishers Limited. All rights reserved.
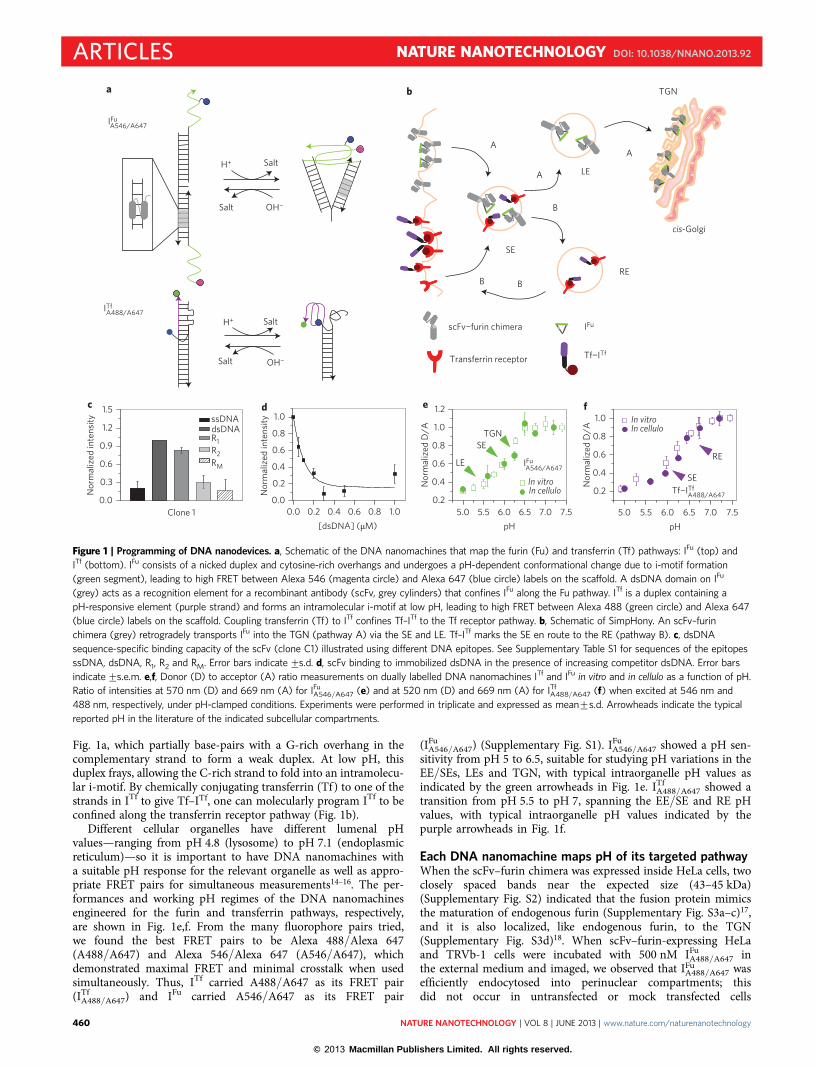
Fig. 1a, which partially base-pairs with a G-rich overhang in thecomplementary strand to form a weak duplex. At low pH, thisduplex frays, allowing the C-rich strand to fold into an intramolecu-lar i-motif. By chemically conjugating transferrin (Tf) to one of thestrands in ITf to give Tf–ITf, one can molecularly program ITf to beconfined along the transferrin receptor pathway (Fig. 1b).
Different cellular organelles have different lumenal pHvalues—ranging from pH 4.8 (lysosome) to pH 7.1 (endoplasmicreticulum)—so it is important to have DNA nanomachines witha suitable pH response for the relevant organelle as well as appro-priate FRET pairs for simultaneous measurements14–16. The per-formances and working pH regimes of the DNA nanomachinesengineered for the furin and transferrin pathways, respectively,are shown in Fig. 1e,f. From the many fluorophore pairs tried,we found the best FRET pairs to be Alexa 488/Alexa 647(A488/A647) and Alexa 546/Alexa 647 (A546/A647), whichdemonstrated maximal FRET and minimal crosstalk when usedsimultaneously. Thus, ITf carried A488/A647 as its FRET pair(ITf
A488/A647) and IFu carried A546/A647 as its FRET pair
(IFuA546/A647) (Supplementary Fig. S1). IFu
A546/A647 showed a pH sen-sitivity from pH 5 to 6.5, suitable for studying pH variations in theEE/SEs, LEs and TGN, with typical intraorganelle pH values asindicated by the green arrowheads in Fig. 1e. ITf
A488/A647 showed atransition from pH 5.5 to pH 7, spanning the EE/SE and RE pHvalues, with typical intraorganelle pH values indicated by thepurple arrowheads in Fig. 1f.
Each DNA nanomachine maps pH of its targeted pathwayWhen the scFv–furin chimera was expressed inside HeLa cells, twoclosely spaced bands near the expected size (43–45 kDa)(Supplementary Fig. S2) indicated that the fusion protein mimicsthe maturation of endogenous furin (Supplementary Fig. S3a–c)17,and it is also localized, like endogenous furin, to the TGN(Supplementary Fig. S3d)18. When scFv–furin-expressing HeLaand TRVb-1 cells were incubated with 500 nM IFu
A488/A647 inthe external medium and imaged, we observed that IFu
A488/A647 wasefficiently endocytosed into perinuclear compartments; thisdid not occur in untransfected or mock transfected cells
Salt
Salt
H+
H+
Salt
Salt OH−
OH−
IFu
a
A546/A647
b
ITfA488/A647
0.0
0.3
0.6
0.9
1.2
1.5
Nor
mal
ized
inte
nsity ssDNA
dsDNAR1R2RM
Clone 1
c d e f
0.0 0.2 0.4 0.6 0.8 1.00.0
0.2
0.4
0.6
0.8
1.0
Nor
mal
ized
inte
nsity
[dsDNA] (µM) 5.0 5.5 6.0 6.5 7.0 7.5
0.2
0.4
0.6
0.8
1.0
1.2N
orm
aliz
ed D
/A
pH
In vitroIn cellulo
IFuA546/A647
SE
LE
TGN
5.0 5.5 6.0 6.5 7.0 7.5
0.2
0.4
0.6
0.8
1.0
Nor
mal
ized
D/A
pH
In vitroIn cellulo
Tf−ITfA488/A647
RE
SE
cis-Golgi
SE
TGN
a
a
a
bRE
b
b
scFv−furin chimera
Transferrin receptor Tf−ITf
IFu
LE
A
A
A
B
BB
Figure 1 | Programming of DNA nanodevices. a, Schematic of the DNA nanomachines that map the furin (Fu) and transferrin (Tf) pathways: IFu (top) and
ITf (bottom). IFu consists of a nicked duplex and cytosine-rich overhangs and undergoes a pH-dependent conformational change due to i-motif formation
(green segment), leading to high FRET between Alexa 546 (magenta circle) and Alexa 647 (blue circle) labels on the scaffold. A dsDNA domain on IFu
(grey) acts as a recognition element for a recombinant antibody (scFv, grey cylinders) that confines IFu along the Fu pathway. ITf is a duplex containing a
pH-responsive element (purple strand) and forms an intramolecular i-motif at low pH, leading to high FRET between Alexa 488 (green circle) and Alexa 647
(blue circle) labels on the scaffold. Coupling transferrin (Tf) to ITf confines Tf–ITf to the Tf receptor pathway. b, Schematic of SimpHony. An scFv–furin
chimera (grey) retrogradely transports IFu into the TGN (pathway A) via the SE and LE. Tf–ITf marks the SE en route to the RE (pathway B). c, dsDNA
sequence-specific binding capacity of the scFv (clone C1) illustrated using different DNA epitopes. See Supplementary Table S1 for sequences of the epitopes
ssDNA, dsDNA, R1, R2 and RM. Error bars indicate+s.d. d, scFv binding to immobilized dsDNA in the presence of increasing competitor dsDNA. Error bars
indicate+s.e.m. e,f, Donor (D) to acceptor (A) ratio measurements on dually labelled DNA nanomachines ITf and IFu in vitro and in cellulo as a function of pH.
Ratio of intensities at 570 nm (D) and 669 nm (A) for IFuA546/A647 (e) and at 520 nm (D) and 669 nm (A) for ITf
A488/A647 (f) when excited at 546 nm and
488 nm, respectively, under pH-clamped conditions. Experiments were performed in triplicate and expressed as mean+s.d. Arrowheads indicate the typical
reported pH in the literature of the indicated subcellular compartments.
ARTICLES NATURE NANOTECHNOLOGY DOI: 10.1038/NNANO.2013.92
NATURE NANOTECHNOLOGY | VOL 8 | JUNE 2013 | www.nature.com/naturenanotechnology460
© 2013 Macmillan Publishers Limited. All rights reserved.
(Supplementary Fig. S4a–d). A competitive endocytic uptake assayrevealed that the N-terminal scFv domain of the scFv–furin actsas a highly specific, artificial receptor for a DNA scaffold containingthe 8 bp d(AT)4 tag, efficiently internalizing any DNA device incor-porating this sequence (Supplementary Fig. S4).
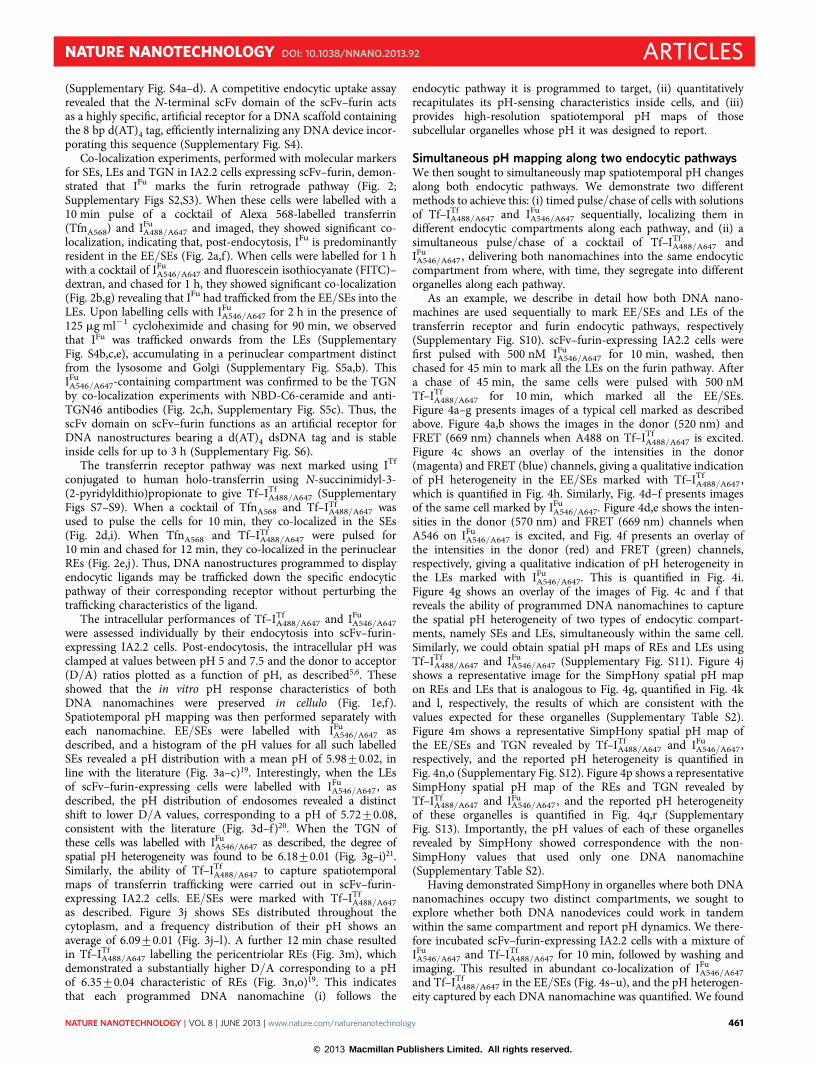
Co-localization experiments, performed with molecular markersfor SEs, LEs and TGN in IA2.2 cells expressing scFv–furin, demon-strated that IFu marks the furin retrograde pathway (Fig. 2;Supplementary Figs S2,S3). When these cells were labelled with a10 min pulse of a cocktail of Alexa 568-labelled transferrin(TfnA568) and IFu
A488/A647 and imaged, they showed significant co-localization, indicating that, post-endocytosis, IFu is predominantlyresident in the EE/SEs (Fig. 2a,f ). When cells were labelled for 1 hwith a cocktail of IFu
A546/A647 and fluorescein isothiocyanate (FITC)–dextran, and chased for 1 h, they showed significant co-localization(Fig. 2b,g) revealing that IFu had trafficked from the EE/SEs into theLEs. Upon labelling cells with IFu
A546/A647 for 2 h in the presence of125 mg ml21 cycloheximide and chasing for 90 min, we observedthat IFu was trafficked onwards from the LEs (SupplementaryFig. S4b,c,e), accumulating in a perinuclear compartment distinctfrom the lysosome and Golgi (Supplementary Fig. S5a,b). ThisIFu
A546/A647-containing compartment was confirmed to be the TGNby co-localization experiments with NBD-C6-ceramide and anti-TGN46 antibodies (Fig. 2c,h, Supplementary Fig. S5c). Thus, thescFv domain on scFv–furin functions as an artificial receptor forDNA nanostructures bearing a d(AT)4 dsDNA tag and is stableinside cells for up to 3 h (Supplementary Fig. S6).
The transferrin receptor pathway was next marked using ITf
conjugated to human holo-transferrin using N-succinimidyl-3-(2-pyridyldithio)propionate to give Tf–ITf
A488/A647 (SupplementaryFigs S7–S9). When a cocktail of TfnA568 and Tf–ITf
A488/A647 wasused to pulse the cells for 10 min, they co-localized in the SEs(Fig. 2d,i). When TfnA568 and Tf–ITf
A488/A647 were pulsed for10 min and chased for 12 min, they co-localized in the perinuclearREs (Fig. 2e,j). Thus, DNA nanostructures programmed to displayendocytic ligands may be trafficked down the specific endocyticpathway of their corresponding receptor without perturbing thetrafficking characteristics of the ligand.
The intracellular performances of Tf–ITfA488/A647 and IFu
A546/A647were assessed individually by their endocytosis into scFv–furin-expressing IA2.2 cells. Post-endocytosis, the intracellular pH wasclamped at values between pH 5 and 7.5 and the donor to acceptor(D/A) ratios plotted as a function of pH, as described5,6. Theseshowed that the in vitro pH response characteristics of bothDNA nanomachines were preserved in cellulo (Fig. 1e,f ).Spatiotemporal pH mapping was then performed separately witheach nanomachine. EE/SEs were labelled with IFu
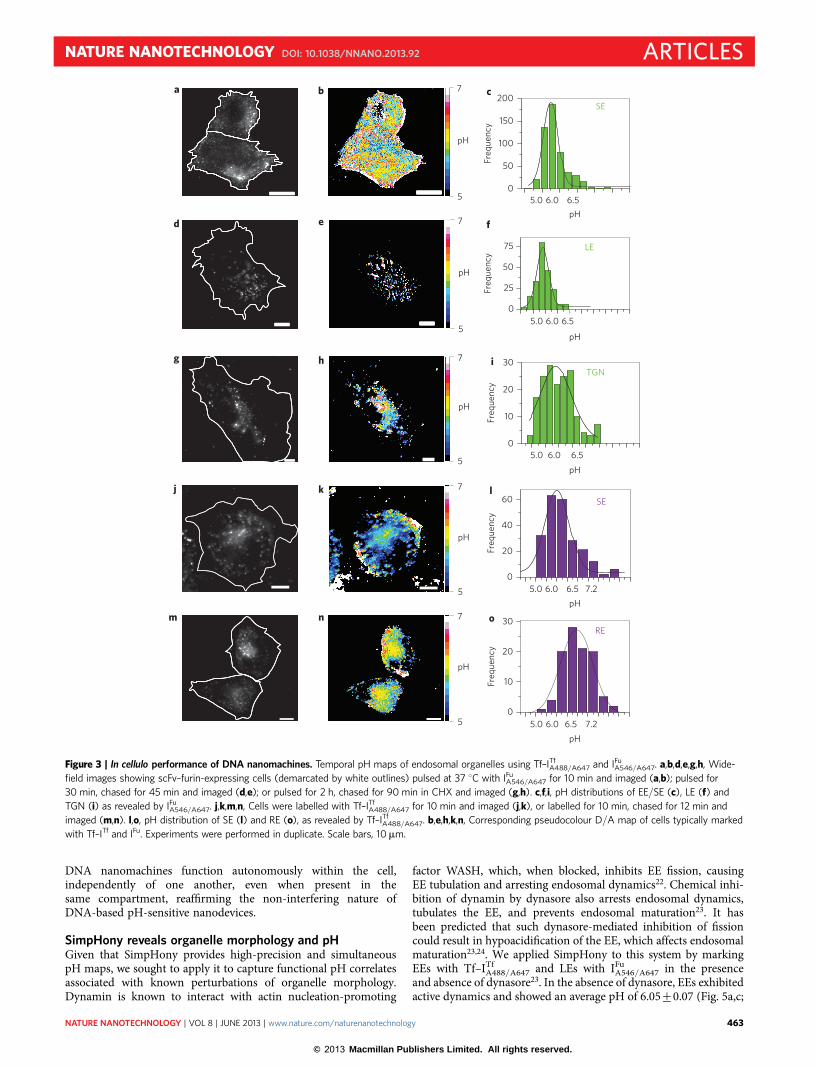
A546/A647 asdescribed, and a histogram of the pH values for all such labelledSEs revealed a pH distribution with a mean pH of 5.98+0.02, inline with the literature (Fig. 3a–c)19. Interestingly, when the LEsof scFv–furin-expressing cells were labelled with IFu
A546/A647, asdescribed, the pH distribution of endosomes revealed a distinctshift to lower D/A values, corresponding to a pH of 5.72+0.08,consistent with the literature (Fig. 3d–f)20. When the TGN ofthese cells was labelled with IFu
A546/A647 as described, the degree ofspatial pH heterogeneity was found to be 6.18+0.01 (Fig. 3g–i)21.Similarly, the ability of Tf–ITf
A488/A647 to capture spatiotemporalmaps of transferrin trafficking were carried out in scFv–furin-expressing IA2.2 cells. EE/SEs were marked with Tf–ITf
A488/A647as described. Figure 3j shows SEs distributed throughout thecytoplasm, and a frequency distribution of their pH shows anaverage of 6.09+0.01 (Fig. 3j–l). A further 12 min chase resultedin Tf–ITf
A488/A647 labelling the pericentriolar REs (Fig. 3m), whichdemonstrated a substantially higher D/A corresponding to a pHof 6.35+0.04 characteristic of REs (Fig. 3n,o)19. This indicatesthat each programmed DNA nanomachine (i) follows the
endocytic pathway it is programmed to target, (ii) quantitativelyrecapitulates its pH-sensing characteristics inside cells, and (iii)provides high-resolution spatiotemporal pH maps of thosesubcellular organelles whose pH it was designed to report.
Simultaneous pH mapping along two endocytic pathwaysWe then sought to simultaneously map spatiotemporal pH changesalong both endocytic pathways. We demonstrate two differentmethods to achieve this: (i) timed pulse/chase of cells with solutionsof Tf–ITf
A488/A647 and IFuA546/A647 sequentially, localizing them in
different endocytic compartments along each pathway, and (ii) asimultaneous pulse/chase of a cocktail of Tf–ITf
A488/A647 andIFu
A546/A647, delivering both nanomachines into the same endocyticcompartment from where, with time, they segregate into differentorganelles along each pathway.
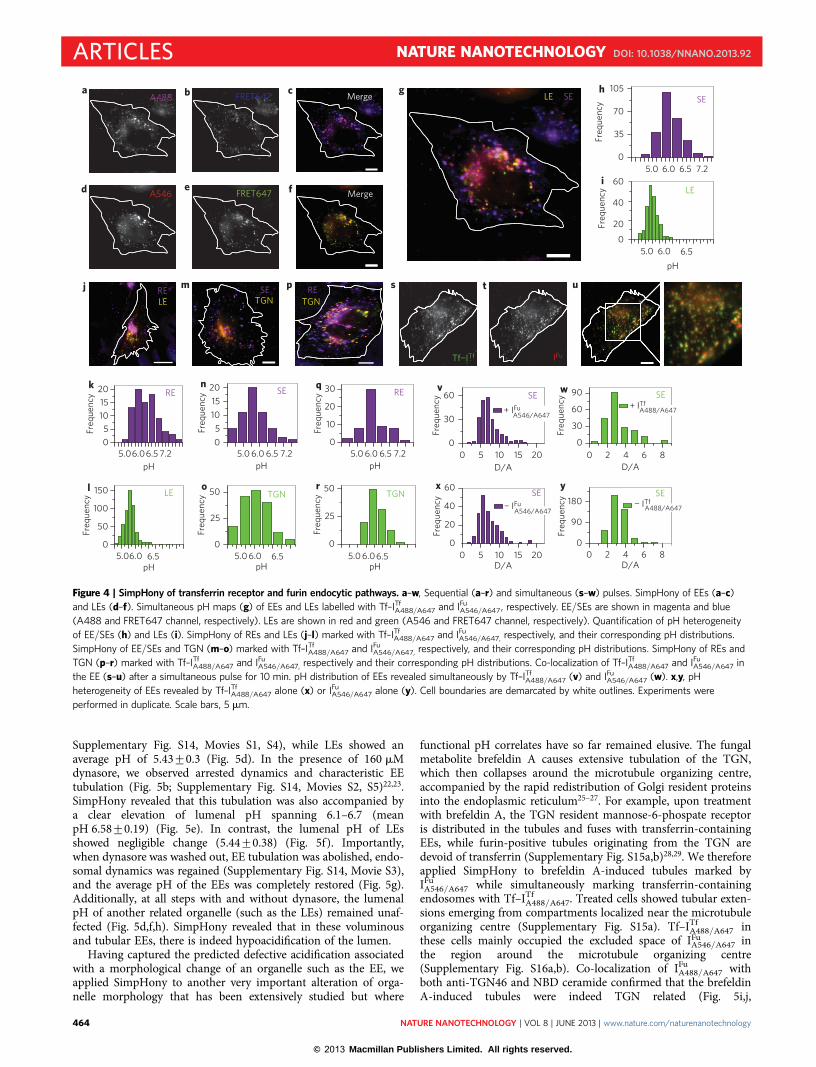
As an example, we describe in detail how both DNA nano-machines are used sequentially to mark EE/SEs and LEs of thetransferrin receptor and furin endocytic pathways, respectively(Supplementary Fig. S10). scFv–furin-expressing IA2.2 cells werefirst pulsed with 500 nM IFu
A546/A647 for 10 min, washed, thenchased for 45 min to mark all the LEs on the furin pathway. Aftera chase of 45 min, the same cells were pulsed with 500 nMTf–ITf
A488/A647 for 10 min, which marked all the EE/SEs.Figure 4a–g presents images of a typical cell marked as describedabove. Figure 4a,b shows the images in the donor (520 nm) andFRET (669 nm) channels when A488 on Tf–ITf
A488/A647 is excited.Figure 4c shows an overlay of the intensities in the donor(magenta) and FRET (blue) channels, giving a qualitative indicationof pH heterogeneity in the EE/SEs marked with Tf–ITf
A488/A647,which is quantified in Fig. 4h. Similarly, Fig. 4d–f presents imagesof the same cell marked by IFu
A546/A647. Figure 4d,e shows the inten-sities in the donor (570 nm) and FRET (669 nm) channels whenA546 on IFu
A546/A647 is excited, and Fig. 4f presents an overlay ofthe intensities in the donor (red) and FRET (green) channels,respectively, giving a qualitative indication of pH heterogeneity inthe LEs marked with IFu
A546/A647. This is quantified in Fig. 4i.Figure 4g shows an overlay of the images of Fig. 4c and f thatreveals the ability of programmed DNA nanomachines to capturethe spatial pH heterogeneity of two types of endocytic compart-ments, namely SEs and LEs, simultaneously within the same cell.Similarly, we could obtain spatial pH maps of REs and LEs usingTf–ITf
A488/A647 and IFuA546/A647 (Supplementary Fig. S11). Figure 4j
shows a representative image for the SimpHony spatial pH mapon REs and LEs that is analogous to Fig. 4g, quantified in Fig. 4kand l, respectively, the results of which are consistent with thevalues expected for these organelles (Supplementary Table S2).Figure 4m shows a representative SimpHony spatial pH map ofthe EE/SEs and TGN revealed by Tf–ITf
A488/A647 and IFuA546/A647,
respectively, and the reported pH heterogeneity is quantified inFig. 4n,o (Supplementary Fig. S12). Figure 4p shows a representativeSimpHony spatial pH map of the REs and TGN revealed byTf–ITf
A488/A647 and IFuA546/A647, and the reported pH heterogeneity
of these organelles is quantified in Fig. 4q,r (SupplementaryFig. S13). Importantly, the pH values of each of these organellesrevealed by SimpHony showed correspondence with the non-SimpHony values that used only one DNA nanomachine(Supplementary Table S2).
Having demonstrated SimpHony in organelles where both DNAnanomachines occupy two distinct compartments, we sought toexplore whether both DNA nanodevices could work in tandemwithin the same compartment and report pH dynamics. We there-fore incubated scFv–furin-expressing IA2.2 cells with a mixture ofIFu
A546/A647 and Tf–ITfA488/A647 for 10 min, followed by washing and
imaging. This resulted in abundant co-localization of IFuA546/A647
and Tf–ITfA488/A647 in the EE/SEs (Fig. 4s–u), and the pH heterogen-
eity captured by each DNA nanomachine was quantified. We found
NATURE NANOTECHNOLOGY DOI: 10.1038/NNANO.2013.92 ARTICLES
NATURE NANOTECHNOLOGY | VOL 8 | JUNE 2013 | www.nature.com/naturenanotechnology 461
© 2013 Macmillan Publishers Limited. All rights reserved.
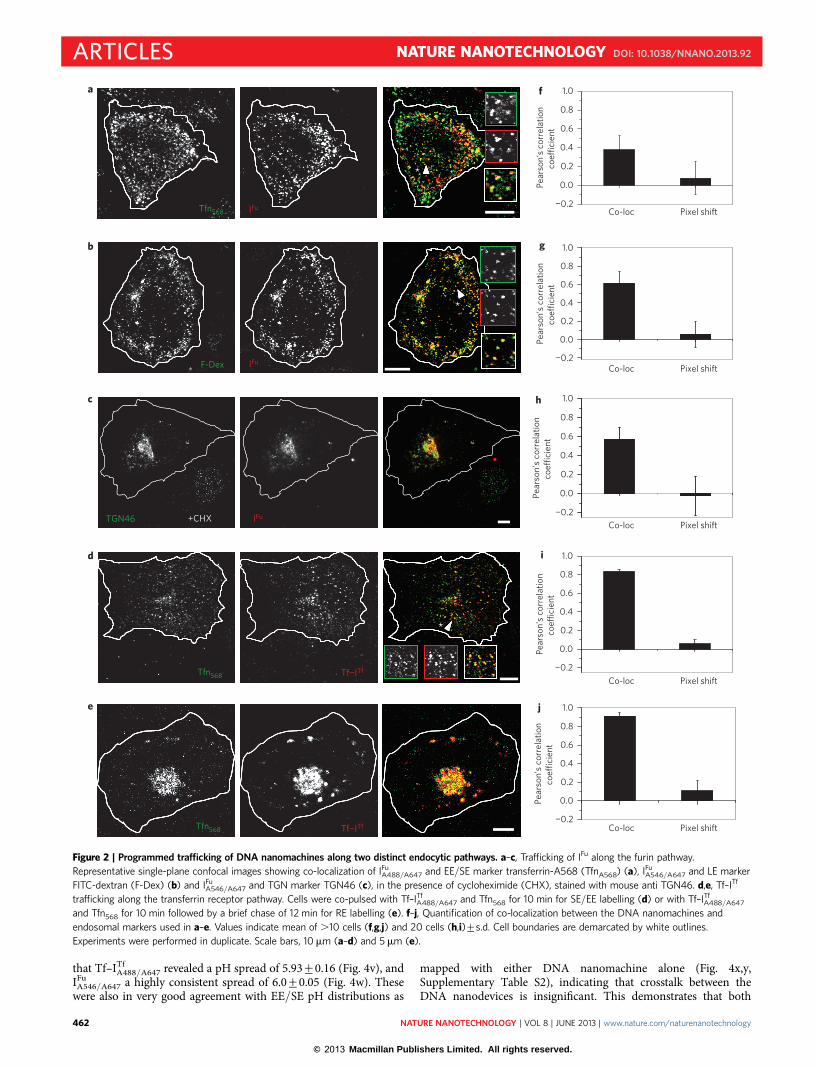
that Tf–ITfA488/A647 revealed a pH spread of 5.93+0.16 (Fig. 4v), and
IFuA546/A647 a highly consistent spread of 6.0+0.05 (Fig. 4w). These
were also in very good agreement with EE/SE pH distributions as
mapped with either DNA nanomachine alone (Fig. 4x,y,Supplementary Table S2), indicating that crosstalk between theDNA nanodevices is insignificant. This demonstrates that both
−0.2
0.0
0.2
0.4
0.6
0.8
1.0
−0.2
0.0
0.2
0.4
0.6
0.8
1.0g
−0.2
0.0
0.2
0.4
0.6
0.8
1.0
−0.2
0.0
0.2
0.4
0.6
0.8
1.0
−0.2
0.0
0.2
0.4
0.6
0.8
1.0
Co-loc Pixel shift
Co-loc Pixel shift
Co-loc Pixel shift
Co-loc Pixel shift
Co-loc Pixel shift
j
f
h
i
Pear
son’
s co
rrel
atio
nco
effici
ent
Pear
son’
s co
rrel
atio
nco
effici
ent
Pear
son’
s co
rrel
atio
nco
effici
ent
Pear
son’
s co
rrel
atio
nco
effici
ent
Pear
son’
s co
rrel
atio
nco
effici
ent
+CHX TGN46
Tfn568 Tf−ITf
Tf−ITf
*
*
Tfn568 IFu
a
b
c
d
e
*
F-Dex
Tfn568
IFu
IFu
Figure 2 | Programmed trafficking of DNA nanomachines along two distinct endocytic pathways. a–c, Trafficking of IFu along the furin pathway.
Representative single-plane confocal images showing co-localization of IFuA488/A647 and EE/SE marker transferrin-A568 (TfnA568) (a), IFu
A546/A647 and LE marker
FITC-dextran (F-Dex) (b) and IFuA546/A647 and TGN marker TGN46 (c), in the presence of cycloheximide (CHX), stained with mouse anti TGN46. d,e, Tf–ITf
trafficking along the transferrin receptor pathway. Cells were co-pulsed with Tf–ITfA488/A647 and Tfn568 for 10 min for SE/EE labelling (d) or with Tf–ITf
A488/A647
and Tfn568 for 10 min followed by a brief chase of 12 min for RE labelling (e). f–j, Quantification of co-localization between the DNA nanomachines and
endosomal markers used in a–e. Values indicate mean of .10 cells (f,g,j) and 20 cells (h,i)+s.d. Cell boundaries are demarcated by white outlines.
Experiments were performed in duplicate. Scale bars, 10 mm (a–d) and 5 mm (e).
ARTICLES NATURE NANOTECHNOLOGY DOI: 10.1038/NNANO.2013.92
NATURE NANOTECHNOLOGY | VOL 8 | JUNE 2013 | www.nature.com/naturenanotechnology462
© 2013 Macmillan Publishers Limited. All rights reserved.
DNA nanomachines function autonomously within the cell,independently of one another, even when present in thesame compartment, reaffirming the non-interfering nature ofDNA-based pH-sensitive nanodevices.
SimpHony reveals organelle morphology and pHGiven that SimpHony provides high-precision and simultaneouspH maps, we sought to apply it to capture functional pH correlatesassociated with known perturbations of organelle morphology.Dynamin is known to interact with actin nucleation-promoting
factor WASH, which, when blocked, inhibits EE fission, causingEE tubulation and arresting endosomal dynamics22. Chemical inhi-bition of dynamin by dynasore also arrests endosomal dynamics,tubulates the EE, and prevents endosomal maturation23. It hasbeen predicted that such dynasore-mediated inhibition of fissioncould result in hypoacidification of the EE, which affects endosomalmaturation23,24. We applied SimpHony to this system by markingEEs with Tf–ITf
A488/A647 and LEs with IFuA546/A647 in the presence
and absence of dynasore23. In the absence of dynasore, EEs exhibitedactive dynamics and showed an average pH of 6.05+0.07 (Fig. 5a,c;
0
10
20
30
Freq
uenc
y
0
25
50
75
Freq
uenc
y
0
50
100
150
200
Freq
uenc
y
5.0 6.0 6.5
a b c
d e f
g h i
j k l
m n o
7
5
pH
7
5
pH
7
5
pH
7
5
pH
7
5
pH
0
10
20
30
Freq
uenc
y
pH
0
20
40
60
5.0 6.0 6.5
5.0 6.0 6.5
5.0 6.0 6.5 7.2
5.0 6.0 6.5 7.2pH
pH
pH
pH
Freq
uenc
y
LE
SE
SE
RE
TGN
Figure 3 | In cellulo performance of DNA nanomachines. Temporal pH maps of endosomal organelles using Tf–ITfA488/A647 and IFu
A546/A647. a,b,d,e,g,h, Wide-
field images showing scFv–furin-expressing cells (demarcated by white outlines) pulsed at 37 8C with IFuA546/A647 for 10 min and imaged (a,b); pulsed for
30 min, chased for 45 min and imaged (d,e); or pulsed for 2 h, chased for 90 min in CHX and imaged (g,h). c,f,i, pH distributions of EE/SE (c), LE (f) and
TGN (i) as revealed by IFuA546/A647. j,k,m,n, Cells were labelled with Tf–ITf
A488/A647 for 10 min and imaged (j,k), or labelled for 10 min, chased for 12 min and
imaged (m,n). l,o, pH distribution of SE (l) and RE (o), as revealed by Tf–ITfA488/A647. b,e,h,k,n, Corresponding pseudocolour D/A map of cells typically marked
with Tf–ITf and IFu. Experiments were performed in duplicate. Scale bars, 10mm.
NATURE NANOTECHNOLOGY DOI: 10.1038/NNANO.2013.92 ARTICLES
NATURE NANOTECHNOLOGY | VOL 8 | JUNE 2013 | www.nature.com/naturenanotechnology 463
© 2013 Macmillan Publishers Limited. All rights reserved.
Supplementary Fig. S14, Movies S1, S4), while LEs showed anaverage pH of 5.43+0.3 (Fig. 5d). In the presence of 160 mMdynasore, we observed arrested dynamics and characteristic EEtubulation (Fig. 5b; Supplementary Fig. S14, Movies S2, S5)22,23.SimpHony revealed that this tubulation was also accompanied bya clear elevation of lumenal pH spanning 6.1–6.7 (meanpH 6.58+0.19) (Fig. 5e). In contrast, the lumenal pH of LEsshowed negligible change (5.44+0.38) (Fig. 5f). Importantly,when dynasore was washed out, EE tubulation was abolished, endo-somal dynamics was regained (Supplementary Fig. S14, Movie S3),and the average pH of the EEs was completely restored (Fig. 5g).Additionally, at all steps with and without dynasore, the lumenalpH of another related organelle (such as the LEs) remained unaf-fected (Fig. 5d,f,h). SimpHony revealed that in these voluminousand tubular EEs, there is indeed hypoacidification of the lumen.
Having captured the predicted defective acidification associatedwith a morphological change of an organelle such as the EE, weapplied SimpHony to another very important alteration of orga-nelle morphology that has been extensively studied but where
functional pH correlates have so far remained elusive. The fungalmetabolite brefeldin A causes extensive tubulation of the TGN,which then collapses around the microtubule organizing centre,accompanied by the rapid redistribution of Golgi resident proteinsinto the endoplasmic reticulum25–27. For example, upon treatmentwith brefeldin A, the TGN resident mannose-6-phospate receptoris distributed in the tubules and fuses with transferrin-containingEEs, while furin-positive tubules originating from the TGN aredevoid of transferrin (Supplementary Fig. S15a,b)28,29. We thereforeapplied SimpHony to brefeldin A-induced tubules marked byIFu
A546/A647 while simultaneously marking transferrin-containingendosomes with Tf–ITf
A488/A647. Treated cells showed tubular exten-sions emerging from compartments localized near the microtubuleorganizing centre (Supplementary Fig. S15a). Tf–ITf
A488/A647 inthese cells mainly occupied the excluded space of IFu
A546/A647 inthe region around the microtubule organizing centre(Supplementary Fig. S16a,b). Co-localization of IFu
A488/A647 withboth anti-TGN46 and NBD ceramide confirmed that the brefeldinA-induced tubules were indeed TGN related (Fig. 5i,j,
A488 FRET647
A546 FRET647
RELE
SETGN
RETGN
SELEa
d
j m p s t u
e f
b c g
0
10
20
30
Freq
uenc
y
0
25
50
Freq
uenc
y
05
1015
20
Freq
uenc
y
0
25
50
Freq
uenc
y
0
50
100
150
Freq
uenc
y
pH
05
1015
20
Freq
uenc
y
k
l
RE
LE
n
o
q
r
SE
TGN
RE
TGN
0 5 10 15 200
30
60
Freq
uenc
y
0 5 10 15 200
20
40
60
Freq
uenc
y
Freq
uenc
yFr
eque
ncy
D/A
0 2 4 6 80
30
60
90+ ITf
0 2 4 6 80
90
180 − ITf
D/A
v w
y
SE SE
xSE SE
0
35
70
105
5.0 6.0
5.0 6.0
6.5 7.2
5.06.06.5 7.2 5.0 6.0 6.5 7.2 5.0 6.0 6.5 7.2
Freq
uenc
y
0
20
40
60
Freq
uenc
y
6.5
5.06.0 6.5pH
5.0 6.0 6.5pH
pH D/A D/ApH pH
5.0 6.06.5
pH
h
iLE
SE
Tf−ITf IFu
Merge
Merge
A546/A647+ IFu
− IFuA546/A647 A488/A647
A488/A647
Figure 4 | SimpHony of transferrin receptor and furin endocytic pathways. a–w, Sequential (a–r) and simultaneous (s–w) pulses. SimpHony of EEs (a–c)
and LEs (d–f). Simultaneous pH maps (g) of EEs and LEs labelled with Tf–ITfA488/A647 and IFu
A546/A647, respectively. EE/SEs are shown in magenta and blue
(A488 and FRET647 channel, respectively). LEs are shown in red and green (A546 and FRET647 channel, respectively). Quantification of pH heterogeneity
of EE/SEs (h) and LEs (i). SimpHony of REs and LEs (j–l) marked with Tf–ITfA488/A647 and IFu
A546/A647, respectively, and their corresponding pH distributions.
SimpHony of EE/SEs and TGN (m–o) marked with Tf–ITfA488/A647 and IFu
A546/A647, respectively, and their corresponding pH distributions. SimpHony of REs and
TGN (p–r) marked with Tf–ITfA488/A647 and IFu
A546/A647, respectively and their corresponding pH distributions. Co-localization of Tf–ITfA488/A647 and IFu
A546/A647 in
the EE (s–u) after a simultaneous pulse for 10 min. pH distribution of EEs revealed simultaneously by Tf–ITfA488/A647 (v) and IFu
A546/A647 (w). x,y, pH
heterogeneity of EEs revealed by Tf–ITfA488/A647 alone (x) or IFu
A546/A647 alone (y). Cell boundaries are demarcated by white outlines. Experiments were
performed in duplicate. Scale bars, 5 mm.
ARTICLES NATURE NANOTECHNOLOGY DOI: 10.1038/NNANO.2013.92
NATURE NANOTECHNOLOGY | VOL 8 | JUNE 2013 | www.nature.com/naturenanotechnology464
© 2013 Macmillan Publishers Limited. All rights reserved.
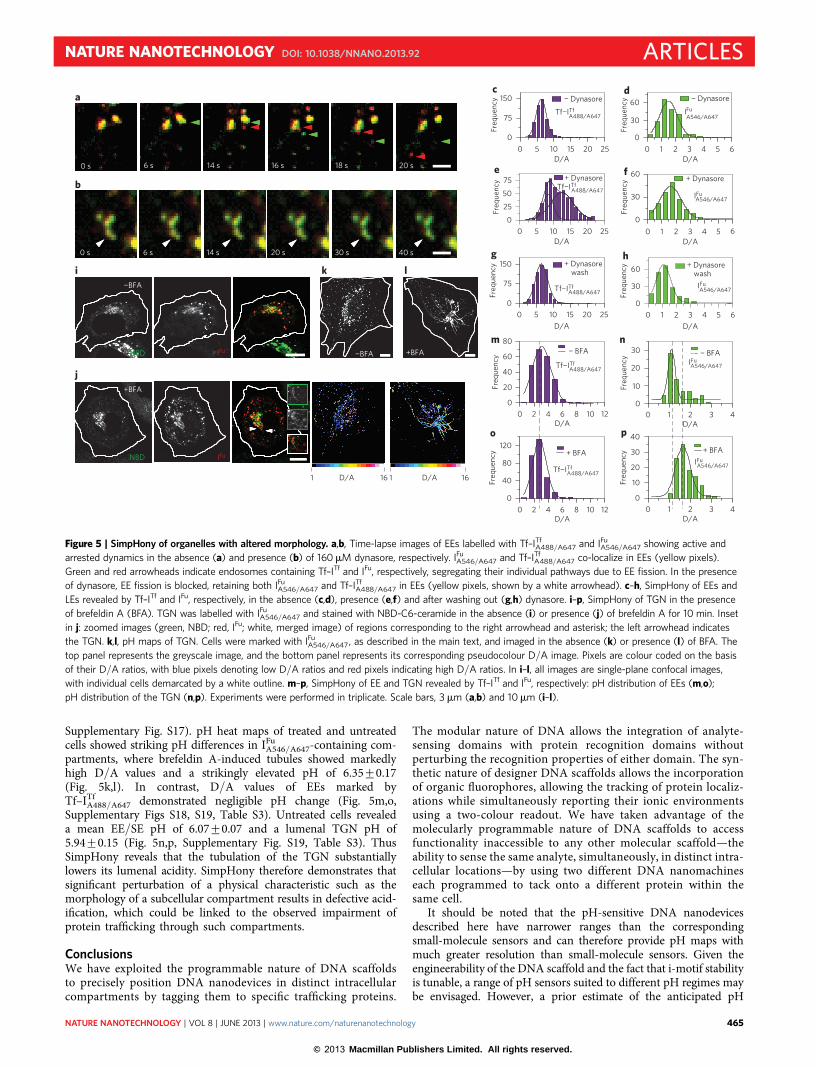
Supplementary Fig. S17). pH heat maps of treated and untreatedcells showed striking pH differences in IFu
A546/A647-containing com-partments, where brefeldin A-induced tubules showed markedlyhigh D/A values and a strikingly elevated pH of 6.35+0.17(Fig. 5k,l). In contrast, D/A values of EEs marked byTf–ITf
A488/A647 demonstrated negligible pH change (Fig. 5m,o,Supplementary Figs S18, S19, Table S3). Untreated cells revealeda mean EE/SE pH of 6.07+0.07 and a lumenal TGN pH of5.94+0.15 (Fig. 5n,p, Supplementary Fig. S19, Table S3). ThusSimpHony reveals that the tubulation of the TGN substantiallylowers its lumenal acidity. SimpHony therefore demonstrates thatsignificant perturbation of a physical characteristic such as themorphology of a subcellular compartment results in defective acid-ification, which could be linked to the observed impairment ofprotein trafficking through such compartments.
ConclusionsWe have exploited the programmable nature of DNA scaffoldsto precisely position DNA nanodevices in distinct intracellularcompartments by tagging them to specific trafficking proteins.
The modular nature of DNA allows the integration of analyte-sensing domains with protein recognition domains withoutperturbing the recognition properties of either domain. The syn-thetic nature of designer DNA scaffolds allows the incorporationof organic fluorophores, allowing the tracking of protein localiz-ations while simultaneously reporting their ionic environmentsusing a two-colour readout. We have taken advantage of themolecularly programmable nature of DNA scaffolds to accessfunctionality inaccessible to any other molecular scaffold—theability to sense the same analyte, simultaneously, in distinct intra-cellular locations—by using two different DNA nanomachineseach programmed to tack onto a different protein within thesame cell.
It should be noted that the pH-sensitive DNA nanodevicesdescribed here have narrower ranges than the correspondingsmall-molecule sensors and can therefore provide pH maps withmuch greater resolution than small-molecule sensors. Given theengineerability of the DNA scaffold and the fact that i-motif stabilityis tunable, a range of pH sensors suited to different pH regimes maybe envisaged. However, a prior estimate of the anticipated pH
a
b
i
j
k l
c d
fe
g
m
o p
n
h
−BFA +BFA
−BFA
NBD IFu
+BFA
NBD IFu
*
0 s
0 s
6 s
6 s
14 s
14 s
16 s
20 s
18 s
30 s
20 s
40 s
161 D/AD/A1 16
0
75
150
Freq
uenc
y − Dynasore
0
25
50
75
Freq
uenc
y + DynasoreTf−ITf
A488/A647
0 5 10 15 20 250
75
150
D/A
Freq
uenc
y + Dynasore wash
Tf−ITfA488/A647
60
0
30
Freq
uenc
y
IFuA546/A647
− Dynasore
0
30
60
IFuA546/A647
Freq
uenc
y + Dynasore
0 1 2 3 4 5 6
0 5 10 15 20 25 0 1 2 3 4 5 6
0 5 10 15 20 25 0 1 2 3 4 5 6
0
30
60
IFuA546/A647
D/A
D/A D/A
D/A D/A
Freq
uenc
y + Dynasore wash
0
20
40
60
80
Tf−ITfA488/A647
Tf−ITfA488/A647
− BFA
Freq
uenc
y
0 2 4 6 8 10 120
40
80
120 + BFA
Freq
uenc
y
D/A
0 2 4 6 8 10 12D/A
20
30 − BFAIFuA546/A647
IFuA546/A647
0
10Freq
uenc
y
0 1 2 3 40
10
20
30
40
+ BFA
Freq
uenc
y
D/A
0 1 2 3 4D/A
Tf−ITfA488/A647
Figure 5 | SimpHony of organelles with altered morphology. a,b, Time-lapse images of EEs labelled with Tf–ITfA488/A647 and IFu
A546/A647 showing active and
arrested dynamics in the absence (a) and presence (b) of 160mM dynasore, respectively. IFuA546/A647 and Tf–ITf
A488/A647 co-localize in EEs (yellow pixels).
Green and red arrowheads indicate endosomes containing Tf–ITf and IFu, respectively, segregating their individual pathways due to EE fission. In the presence
of dynasore, EE fission is blocked, retaining both IFuA546/A647 and Tf–ITf
A488/A647 in EEs (yellow pixels, shown by a white arrowhead). c–h, SimpHony of EEs and
LEs revealed by Tf–ITf and IFu, respectively, in the absence (c,d), presence (e,f) and after washing out (g,h) dynasore. i–p, SimpHony of TGN in the presence
of brefeldin A (BFA). TGN was labelled with IFuA546/A647 and stained with NBD-C6-ceramide in the absence (i) or presence (j) of brefeldin A for 10 min. Inset
in j: zoomed images (green, NBD; red, IFu; white, merged image) of regions corresponding to the right arrowhead and asterisk; the left arrowhead indicates
the TGN. k,l, pH maps of TGN. Cells were marked with IFuA546/A647, as described in the main text, and imaged in the absence (k) or presence (l) of BFA. The
top panel represents the greyscale image, and the bottom panel represents its corresponding pseudocolour D/A image. Pixels are colour coded on the basis
of their D/A ratios, with blue pixels denoting low D/A ratios and red pixels indicating high D/A ratios. In i–l, all images are single-plane confocal images,
with individual cells demarcated by a white outline. m–p, SimpHony of EE and TGN revealed by Tf–ITf and IFu, respectively: pH distribution of EEs (m,o);
pH distribution of the TGN (n,p). Experiments were performed in triplicate. Scale bars, 3 mm (a,b) and 10mm (i–l).
NATURE NANOTECHNOLOGY DOI: 10.1038/NNANO.2013.92 ARTICLES
NATURE NANOTECHNOLOGY | VOL 8 | JUNE 2013 | www.nature.com/naturenanotechnology 465
© 2013 Macmillan Publishers Limited. All rights reserved.
regime would be required before the deployment of variousI-switches in cellulo. Furthermore, before obtaining the functionalcorrelates offered by SimpHony for receptor trafficking pathways,it is essential to first characterize the pathways of interest using con-ventional methods. However, SimpHony might also provide usefulclues regarding the compartment environment in cases that are lessstraightforward to identify.
SimpHony is applicable to a variety of compartment mixingproblems, and also cellular fusion/fission problems in biology.Importantly, measures of in vivo/intracellular chemistry using thistargeting technology are generalizable to the chemical diversitythat can already be sensed by DNA to access functionally richerchemical maps of cells. Organelle targeting and simultaneouschemical mapping technology using DNA nanodevices thus offerssubstantial potential for the integration of small-moleculetriggers originating from subcellular environments withinbiological networks.
MethodsMaterials. All the unlabelled oligonucleotides used were obtained from EurofinsGenomics, and labelled oligonucleotides (high-performance liquidchromatography-purified and lyophilized) were obtained from IBA, GmbH. In andIn′ (5 mM) were mixed in equimolar ratios in 20 mM potassium phosphate buffer ofthe desired pH containing 100 mM KCl. The resultant solution was heated to 90 8Cfor 5 min, cooled to room temperature at 5 8C/15 min and equilibrated at 4 8Covernight. Solutions of I-switch at different pH values were made by diluting 1 ml of5 mM stock samples into 99 ml of 1× clamping buffer of the desired pH. Allsamples were vortexed and equilibrated for 30 min at room temperature. Theexperiments were performed in a wide-field microscope (Nikon Eclipse Ti-U).An in vitro pH calibration curve was obtained by plotting the ratio of the donorintensity (D) at 520 nm and the acceptor intensity (A) at 669 nm (for A488/A647),and for 570 nm and 670 nm, respectively, for the A546/A647 pair, as afunction of pH.
Determination of binding constants. The affinity and specificity of the scFv wereanalysed by enzyme-linked immunosorbent assay after purifying the scFv. Astreptavidin-coated 96-well plate was incubated with dsDNA epitope for screening,in 5× SSCT (75 mM sodium citrate, 750 mM NaCl, 0.05% Tween-20), for 1.5 h,to immobilize the dsDNA onto the streptavidin-coated 96-well plate. Forcompetition experiments, dsDNA immobilized onto the streptavidin-coated 96-wellplate was incubated with a mixture of competing nucleic acid, purified scFv(200–300 nM) and anti myc-tag antibody (1 in 1,000 dilution) for 1.5 h at roomtemperature. The wells were then washed in a 1 litre PBST (1× PBS, 0.1%Tween-20) bath before the addition of the secondary antibody conjugatedto horseradish peroxidase. Bound scFvs were detected by the addition of3,3′ ,5,5′-tetramethyl benzidine/H2O2, and the optical density (OD) at450 nm was recorded and normalized with respect to the well with noadded competitor.
Cell culture and labelling with endocytic markers. HeLa cells were cultured inDulbecco’s modified eagle’s medium/F-12 (1:1) (Invitrogen) containing 10%heat-inactivated fetal bovine serum (FBS) (Invitrogen), 100 mg ml21 streptomycinand 100 U ml21 penicillin (Invitrogen). The IA2.2 cell line is a Chinese hamsterovary (CHO) cell line that lacks endogenous transferrin receptors but stablyexpresses the human transferrin and folate receptors. These cells were cultured inHam’s-F12 Complete media (HF-12, Himedia) containing 10% heat-inactivatedFBS, 100 mg ml21 streptomycin and 100 U ml21 penicillin with 200 mg ml21
G418 and 100 mg ml21 hygromycin to ensure maintenance of the transferrin andfolate receptors. For transient transfections, cells were plated at .50% density ontoa coverslip-bottomed 35 mm dish and 150 ng of scFv–furin construct wasintroduced using the Lipofectamine 2,000 reagent system (Invitrogen), followingthe manufacturer’s instructions. Cells were imaged 24 h after transfection. ForI-switch labelling, IFu
A488/A647 was diluted in labelling media to a final concentrationof 500 nM, and Tf-conjugated switch (Tf–ITf
A488/A647) was diluted in M1 andincubated for different times at 37 8C. For labelling LEs, cells were incubated withIFu
A488/A647 and 2 mg ml21 FITC dextran in labelling media at 37 8C for 1 h followedby a chase for 1 h. SEs were labelled by 100 mg ml21 Alexa 568-labelled humanholo-transferrin after incubating IA2.2 cells at 37 8C for 10 min in M1, while a briefchase of 12 min marked REs. Wide-field and confocal images were collected usinga Nikon inverted microscope and an Olympus Fluoview 1,000 confocalmicroscope, respectively. Donor and acceptor images were overlaid andendosomes showing co-localization were further quantified using ImageJver. 1.46.
Received 13 November 2012; accepted 22 April 2013;published online 26 May 2013
References1. Seeman, N. C. DNA in a material world. Nature 421, 427–431 (2003).2. Bath, J. & Turberfield, A. J. DNA nanomachines. Nature Nanotech.
2, 275–284 (2007).3. Krishnan, Y. & Bathe, M. Designer nucleic acids to probe and program the cell.
Trends Cell Biol. 22, 624–633 (2012).4. McMahon, D. Chemical messengers in development: a hypothesis. Science
185, 1012–1021 (1974).5. Modi, S. et. al. A DNA nanomachine that maps spatial and temporal pH changes
inside living cells. Nature Nanotech. 4, 325–330 (2009).6. Surana, S., Bhat, J. M., Koushika, S. P. & Krishnan, Y. An autonomous DNA
nanomachine maps spatiotemporal pH changes in a multicellular livingorganism. Nature Commun. 2, 340 (2011).
7. Douglas, S. M., Bachelet, I. & Church, G. M. A logic-gated nanorobotfor targeted transport of molecular payloads. Science 335,831–834 (2012).
8. Lee, H. et al. Molecularly self-assembled nucleic acid nanoparticlesfor targeted in vivo siRNA delivery. Nature Nanotech. 7,389–393 (2012).
9. Bhatia, D., Surana, S., Chakraborty, S., Koushika, S. P. & Krishnan, Y. A syntheticicosahedral DNA-based host–cargo complex for functional in vivo imaging.Nature Commun. 2, 339 (2011).
10. Mallet, W. G. & Maxfield, F. R. Chimeric forms of furin and TGN38are transported with the plasma membrane in the trans-Golginetwork via distinct endosomal pathways. J. Cell Biol. 146,345–359 (1999).
11. Chia, P. Z. C., Gasnereau, I., Lieu, Z. Z. & Gleeson, P. A. Rab9-dependentretrograde transport and endosomal sorting of the endopeptidase furin.J. Cell Sci. 124, 2401–2413 (2011).
12. Presley, J. F. et al. The End2 mutation in CHO cells slows the exit oftransferrin receptors from the recycling compartment but bulk membranerecycling is unaffected. J. Cell Biol. 122, 1231–1241 (1993).
13. McCafferty, J., Griffiths, A. D., Winter, G. & Chiswell, D. J. Phage antibodies:filamentous phage displaying antibody variable domains. Nature 348,552–554 (1990).
14. Geisow, M. J., D’Arcy Hart, P. & Young, M. R. Temporal changes oflysosome and phagosome pH during phagolysosome formation inmacrophages: studies by fluorescence spectroscopy. J. Cell Biol. 89,645–652 (1981).
15. Llopis, J., McCaffery, J. M., Miyawaki, A., Farquhar, M. G. & Tsien, R. Y.Measurement of cytosolic, mitochondrial, and golgi pH in single livingcells with green fluorescent proteins. Proc. Natl Acad. Sci. USA 95,6803–6808 (1998).
16. Kim, J. H. et al. Noninvasive measurement of the pH of the endoplasmicreticulum at rest and during calcium release. Proc. Natl Acad. Sci. USA 95,2997–3002 (1998).
17. Molloy, S. S., Thomas, L., VanSlyke, J. K., Stenberg, P. E. & Thomas, G.Intracellular trafficking and activation of the furin proprotein convertase:localization to the TGN and recycling from the cell surface. EMBO J. 13,18–33 (1994).
18. Molloy, S. S., Anderson, E. D., Jean, F. & Thomas, G. Bi-cycling the furinpathway: from TGN localization to pathogen activation and embryogenesis.Trends Cell Biol. 9, 28–35 (1999).
19. Presley, J. F., Mayor, S., McGraw, T. E., Dunn, K. W. & Maxfield, F. R.Bafilomycin A1 treatment retards transferrin receptor recycling more thanbulk membrane recycling. J. Biol. Chem. 272, 13929–13936 (1997).
20. Yamashiro, D. J. & Maxfield, F. R. Acidification of morphologically distinctendosomes in mutant and wild-type Chinese hamster ovary cells.J. Cell Biol. 105, 2723–2733 (1987).
21. Maeda, Y., Ide, T., Koike, M., Uchiyama, Y. & Kinoshita, T. GPHR is a novelanion channel critical for acidification and functions of the Golgi apparatus.Nature Cell Biol. 10, 1135–1145 (2008).
22. Derivery, E. et al. The Arp2/3 Activator WASH controls the fissionof endosomes through a large multiprotein complex. Dev. Cell 17,712–723 (2009).
23. Mesaki, K., Tanabe, K., Obayashi, M., Oe, N. & Takei, K. Fission of tubularendosomes triggers endosomal acidification and movement. PLoS ONE 6,e19764 (2011).
24. Macia, E. et al. Dynasore, a cell-permeable inhibitor of dynamin. Dev. Cell 10,839–850 (2006).
25. Reaves, B. & Banting, G. Perturbation of the morphology of the trans-Golginetwork following Brefeldin A treatment: redistribution of a TGN-specificintegral membrane protein, TGN38. J. Cell Biol. 116, 85–94 (1992).
26. Sciaky, N. et al. Golgi tubule traffic and the effects of brefeldin A visualized inliving cells. J. Cell Biol. 139, 1137–1155 (1997).
27. Strous, G. J. et al. Brefeldin A induces a microtubule-dependent fusion ofgalactosyltransferase-containing vesicles with the rough endoplasmic reticulum.Biol. Cell 71, 25–31 (1991).
ARTICLES NATURE NANOTECHNOLOGY DOI: 10.1038/NNANO.2013.92
NATURE NANOTECHNOLOGY | VOL 8 | JUNE 2013 | www.nature.com/naturenanotechnology466
© 2013 Macmillan Publishers Limited. All rights reserved.
28. Waguri, S. et al. Visualization of TGN to endosome trafficking throughfluorescently labeled MPR and AP-1 in living cells. Mol. Biol. Cell 14,142–155 (2003).
29. Maeda, Y., Beznoussenko, G. V., Van Lint, J., Mironov, A. A. & Malhotra, V.Recruitment of protein kinase D to the trans-Golgi network via the firstcysteine-rich domain. EMBO J. 20, 5982–5990 (2001).
AcknowledgementsThe authors thank S. Mayor, D. Lilley, A. Sarin, G.V. Shivashankar and W. Shih forcritical input, and the Central Imaging and Flow Facility at NCBS for imaging. The authorsalso thank S. Mayor for scFv libraries and the IA2.2 cell line, and J. Bonifacino andM. Marks for the Tac-furin chimera plasmids. S.M., S.S. and S.H. thank the CSIR forresearch fellowships. C.N. thanks NCBS for generous support of this collaboration.Y.K. thanks the Wellcome Trust–DBT India Alliance and the Innovative YoungBiotechnologist Award for funding.
Author contributionsS.M. and Y.K. conceived and designed the experiments. C.N. contributed phage displayexpertise. S.M. performed the in vitro and in cellulo experiments. S.S. optimized the IFu usedherein, and S.H. addressed scFv–furin stability. S.M. and Y.K. analysed the data.S.M., S.S. and Y.K. co-wrote the paper and all authors commented on the manuscript.
Additional informationSupplementary information is available in the online version of the paper. Reprints andpermissions information is available online at www.nature.com/reprints. Correspondence andrequests for materials should be addressed to Y.K.
Competing financial interestsThe authors declare no competing financial interests.
NATURE NANOTECHNOLOGY DOI: 10.1038/NNANO.2013.92 ARTICLES
NATURE NANOTECHNOLOGY | VOL 8 | JUNE 2013 | www.nature.com/naturenanotechnology 467
© 2013 Macmillan Publishers Limited. All rights reserved.


