Ultra High Strength Steel Sandwich
(UHSS-S)
Lars Wikström
Shawn Miller
Tag Hammam
Paul Janiak
Adam Häggqvist
Samuel Hammarberg
2016-08-10
Hållbar produktionsteknik
FFI Fordonsstrategisk Forskning och Innovation | www.vinnova.se/ffi 2
Contents
1 Abstract ......................................................................................................... 3
2 Exklusiv sammanfattning ............................................................................ 4
3 Background .................................................................................................. 5
4 Purpose, question and method ................................................................... 6
4.1 Sintered core .................................................................................................................... 6
4.2 Bonding ............................................................................................................................ 7
4.3 Press hardening ............................................................................................................. 30
4.4 FE simulation.................................................................................................................. 43
5 Objective ..................................................................................................... 52
6 Result and objective completion .............................................................. 53
6.1 Sintered core .................................................................................................................. 53
6.2 Bonding .......................................................................................................................... 53
6.3 Press hardening ............................................................................................................. 80
6.4 FE simulation.................................................................................................................. 88
7 Distribution och publication .................................................................... 100
7.1 Knowledge and result distribution ................................................................................ 100
7.2 Publications .................................................................................................................. 100
8 Conclusion and continued research ...................................................... 100
9 Participation partners and contacts ....................................................... 100
10 Reference .................................................................................................. 101

FFI Fordonsstrategisk Forskning och Innovation | www.vinnova.se/ffi 3
1 Abstract This project is aimed at developing competitive light weight steel solutions for the car body by reducing the
density of the blank material without any major change in the elastic stiffness. The low density steel blank is
a laminate (sandwich) with outer layers of ultra-high strength steel and low density core created by sintered
metal powder.
The project has been divided into 5 steps, sintering, bonding, press hardening, deformation testing and
simulation.
Sintering:
Several different alloy has been tested and the best seems to be an austenitic stainless steel quality. The
sintered core turn out to be fragile due to the porosity.
Bonding:
In this case the goal has been to do the bonding before (at the sintering process) or during the press
hardening process. Attaching the core to the outer sheets during to sintering process was not a success due
to the long time in a high temperature which made the grain grow on the outer sheets which made the
material more brittle. The other way, melting the brazing foil in the furnace at the same time as the blanks
gets heated up for press hardening worked well. Two brazing foils were found for uncoated outer sheets,
Metglas MBF62 and Vitrobraze VZ2170. For AlSi and Zn coated no working brazing foil were found.
Press hardening:
Joining the previous stages together the final manufacturing step is the press hardening.
The press hardening process works well with the sintered core and the brazing foil because it is floating
when the forming takes place. When doing parts with more complex geometry, there will be limitation for the
sintered core but patches might be used locally.
Deformation testing:
After the press hardening deformation tests followed. Unfortunately both the core and the brazing turned out
to be too weak to hold the press hardened outer sheets together. If using a softer steel as outer sheets the
results would be different but not as good regarding weight saving.
Simulation:
The focus has been modelling the defamation behavior. Three ways has been evaluated.
1. Shell elements
2. Solid elements
3. Shell elements (outer sheets) and Solid elements (core)
For modeling of the interface between core and outer sheets a tie-break contact in LS-DYNA has been used
to virtually reproduce the cohesive behavior. This will probably make option 3 above the best option.
Due to the brittleness of the sintered core it has been difficult to do material characterization.
The conclusion is that there is a good possibility to make a sandwich structure to be used for press
hardening. Using a sintered core and brazing as bonding can still be a weight saver if the part only works in
the elastic zone with small deformations. However for parts used in crash and high deformation, sintered
core and Ni based brazing is probably not a possible solution due to the low strength compared to the press
hardened steel.
FFI Fordonsstrategisk Forskning och Innovation | www.vinnova.se/ffi 4
2 Exklusiv sammanfattning
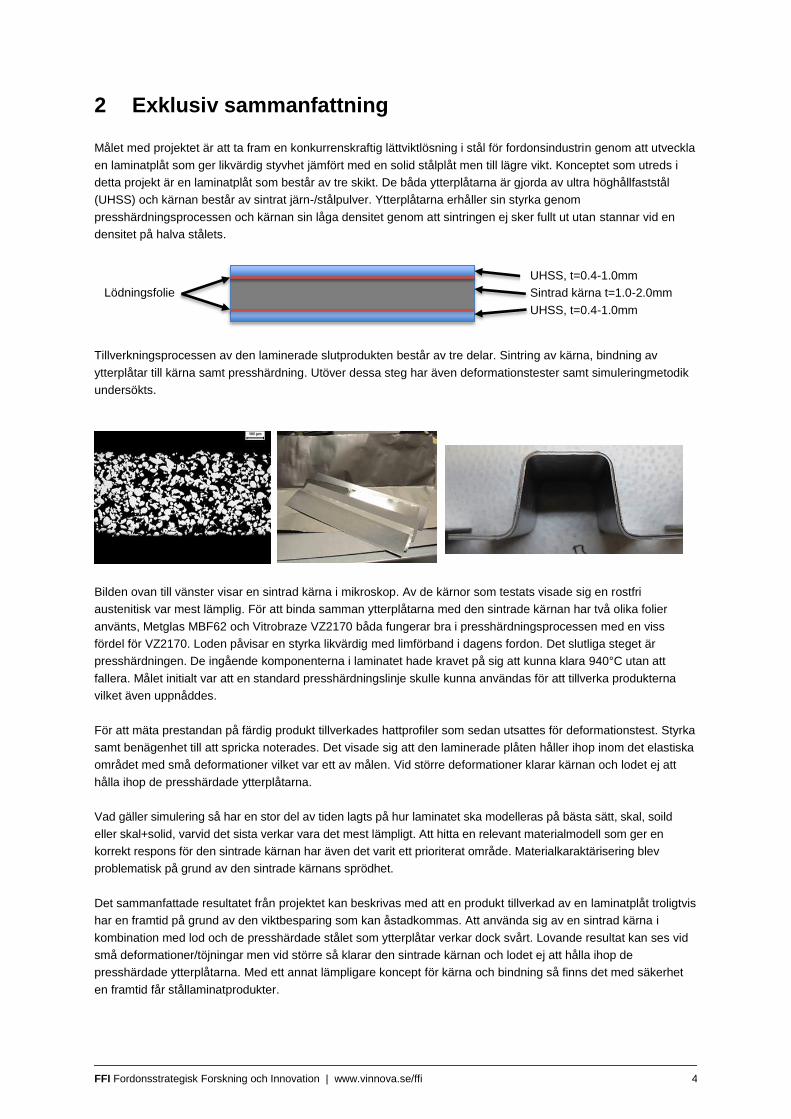
Målet med projektet är att ta fram en konkurrenskraftig lättviktlösning i stål för fordonsindustrin genom att utveckla
en laminatplåt som ger likvärdig styvhet jämfört med en solid stålplåt men till lägre vikt. Konceptet som utreds i
detta projekt är en laminatplåt som består av tre skikt. De båda ytterplåtarna är gjorda av ultra höghållfaststål
(UHSS) och kärnan består av sintrat järn-/stålpulver. Ytterplåtarna erhåller sin styrka genom
presshärdningsprocessen och kärnan sin låga densitet genom att sintringen ej sker fullt ut utan stannar vid en
densitet på halva stålets.
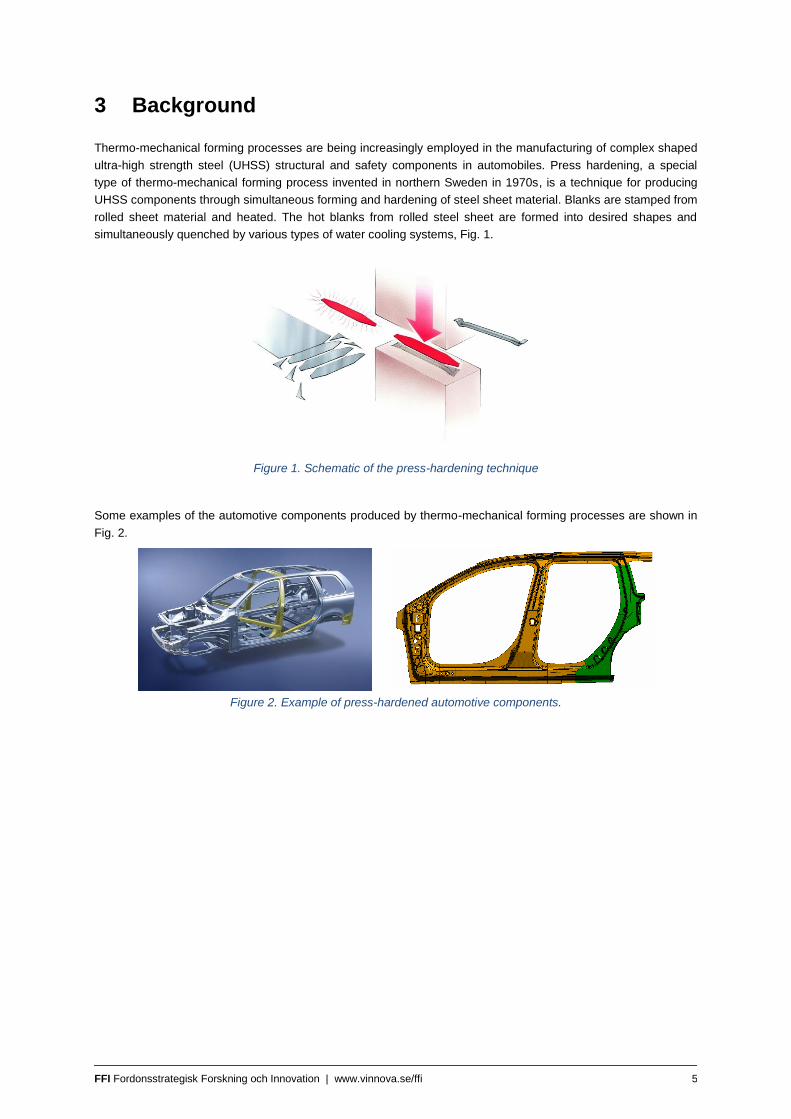
Tillverkningsprocessen av den laminerade slutprodukten består av tre delar. Sintring av kärna, bindning av
ytterplåtar till kärna samt presshärdning. Utöver dessa steg har även deformationstester samt simuleringmetodik
undersökts.
Bilden ovan till vänster visar en sintrad kärna i mikroskop. Av de kärnor som testats visade sig en rostfri
austenitisk var mest lämplig. För att binda samman ytterplåtarna med den sintrade kärnan har två olika folier
använts, Metglas MBF62 och Vitrobraze VZ2170 båda fungerar bra i presshärdningsprocessen med en viss
fördel för VZ2170. Loden påvisar en styrka likvärdig med limförband i dagens fordon. Det slutliga steget är
presshärdningen. De ingående komponenterna i laminatet hade kravet på sig att kunna klara 940°C utan att
fallera. Målet initialt var att en standard presshärdningslinje skulle kunna användas för att tillverka produkterna
vilket även uppnåddes.
För att mäta prestandan på färdig produkt tillverkades hattprofiler som sedan utsattes för deformationstest. Styrka
samt benägenhet till att spricka noterades. Det visade sig att den laminerade plåten håller ihop inom det elastiska
området med små deformationer vilket var ett av målen. Vid större deformationer klarar kärnan och lodet ej att
hålla ihop de presshärdade ytterplåtarna.
Vad gäller simulering så har en stor del av tiden lagts på hur laminatet ska modelleras på bästa sätt, skal, soild
eller skal+solid, varvid det sista verkar vara det mest lämpligt. Att hitta en relevant materialmodell som ger en
korrekt respons för den sintrade kärnan har även det varit ett prioriterat område. Materialkaraktärisering blev
problematisk på grund av den sintrade kärnans sprödhet.
Det sammanfattade resultatet från projektet kan beskrivas med att en produkt tillverkad av en laminatplåt troligtvis
har en framtid på grund av den viktbesparing som kan åstadkommas. Att använda sig av en sintrad kärna i
kombination med lod och de presshärdade stålet som ytterplåtar verkar dock svårt. Lovande resultat kan ses vid
små deformationer/töjningar men vid större så klarar den sintrade kärnan och lodet ej att hålla ihop de
presshärdade ytterplåtarna. Med ett annat lämpligare koncept för kärna och bindning så finns det med säkerhet
en framtid får stållaminatprodukter.
Lödningsfolie
UHSS, t=0.4-1.0mm
Sintrad kärna t=1.0-2.0mm
UHSS, t=0.4-1.0mm
FFI Fordonsstrategisk Forskning och Innovation | www.vinnova.se/ffi 5
3 Background
Thermo-mechanical forming processes are being increasingly employed in the manufacturing of complex shaped
ultra-high strength steel (UHSS) structural and safety components in automobiles. Press hardening, a special
type of thermo-mechanical forming process invented in northern Sweden in 1970s, is a technique for producing
UHSS components through simultaneous forming and hardening of steel sheet material. Blanks are stamped from
rolled sheet material and heated. The hot blanks from rolled steel sheet are formed into desired shapes and
simultaneously quenched by various types of water cooling systems, Fig. 1.
Figure 1. Schematic of the press-hardening technique
Some examples of the automotive components produced by thermo-mechanical forming processes are shown in
Fig. 2.
Figure 2. Example of press-hardened automotive components.

FFI Fordonsstrategisk Forskning och Innovation | www.vinnova.se/ffi 6
4 Purpose, question and method
The proposed research is highly interdisciplinary and will require a thorough understanding of the thermo-
mechanical effects for creating a low density steel material on thin steel sheets. Some of the salient research
tasks to be carried out during this project include:
Development of material models, simulation methodologies and methods for material characterization of sandwich materials.
Development of process methods to create a low density metallic core on thin steel sheets.
Development of a new hot stamping process for generating and forming a new metallic sandwich material.
Since the project is divided into four different topics sintering, bounding, press hardening and simulation each
topic will have their own section regarding method will be handled individually and followed by a summery.
4.1 Sintered core
4.1.1 Cast core
Low alloyed steel is required from a cost standpoint with Ni and Cu being out of the question both from cost and
recyclability standpoint. Several minor elements were tested and with target metals shown to be Si and P as
alloying elements that provide best strength and ductility. Content ranges from 2 - 6% of each.
The metal is mixed with over 30% organics to create a slurry able to be cast into sheets up to 2mm thickness.
Sheets must then be sintered at 1120°C or higher in order to both burn out the organic material as well as create
the bond between the particles giving the sheets its final mechanical properties. The combination of low density
metal (by volume) with organic that is removed via sintering, allows for final density of the steel structure to be
roughly 50% porous. The image below shows a sintered cross-section of one sheet.
Figure 3. Fe + 2,7% Si. Sintered 1150°C for 45min in 90/10 N2/H2.
Possibilities extend to allow additional weight savings if patterns were introduced to the manufacturing method to
remove unnecessary material. This concept could alternatively be used in order to add mass and strengthen
critical areas.
4.1.2 Casting + Rolling
Secondary processes such as rolling was implemented to the as cast sheet prior to sintering. The intention is to
increase surface area between the sintered core and the steel sheet therefore creating a better bond. Secondly,
the closing of the surface pores prevents the braze alloy from leaving the surface and penetrating the core rather
than bonding to the steel sheet.
FFI Fordonsstrategisk Forskning och Innovation | www.vinnova.se/ffi 7
Densification is the last feature of the rolling process. It creates a better inter-particular bond but at the same time,
the density increase decreases the weight savings potential.
4.1.3 Outer sheets
Outer sheet thickness is in the range of 0.4-1.0mm. Since the process is to quench material boron steel will be
used following the standard material 22MnB5.
Two different types are currently of interest, uncoated (known as 22MnB5) and AlSi coated (known as Arcelor
Usibor 1500P) which is a coated 22MnB5. The main market for press hardened part are for AlSi coated since it
has some passive corrosion resistance and don’t get any scale during the press hardening process which
eliminates the use of shot blasting which is an additional cost and might deform the part.
4.2 Bonding
A large number of different bonding methods were considered, e.g. explosive welding, resistance welding,
brazing/welding with nano-foil and conventional brazing. However, the ultimate bonding process should be
performed in line, and this might be possible with brazing during the austenitization step of the boron sheet steel.
Therefore, the research effort was focused on to develop a brazing process that could be performed during the
austenitization step of the boron sheet steel.
Boron sheet steel for the automotive industry is either aluminized zinc-coated or uncoated and therefore different
brazing methods need to be developed. This project was therefore divided into three parts, Part 1 – Brazing boron
sheet steel to boron sheet steel and Part II - Brazing aluminized sheet steel to aluminized sheet steel, Part III-
Brazing zinc-coated sheet steel to zinc-coated sheet steel.
4.2.1 Part 1 – Brazing boron steel to boron steel
In this study experimental brazing was done to analyze the possibility of joining two USIBOR strips in a lap joint.
4.2.1.1Test material
The austenitization temperature of boron steel is in the range of 920 °C to 950 °C, and therefore the melting
temperature of the brazing foils should be below that.
Two alloys manufactured by Metglas and one alloy produced by Vitrobraze with melting temperatures close to the
austenitization temperature of boron steel were selected,
see Table 1 and Table 2.
Table 1. Chemical composition of the amorphous brazing foils used in the experiments
Alloy AWS
&
ASM
Nominal composition, wt % Melting Temp
°C
Braze
Temp.
Cr Fe Si C B P Mo Ni Solid Liq. °C
MBF 60 AWS
BNi-6
- - - 0.1 - 11 - Bal 883 921 950
MBF 62 21 < 1 0.5 - 0.5 8.0 1.0 Bal 878 990 1020
VZ2170 21 X X X 880 925

FFI Fordonsstrategisk Forskning och Innovation | www.vinnova.se/ffi 8
Table 2. Alloy, thickness and width of the amorphous brazing foils used in the
experiments
Width (mm) Thickness (µm)
MBF 60 77 25
MBF 62 216 38
MBF 60 51 38
MBF 62 45 51
VZ2170 108 50
4.2.1.2 Preparation, setup and calibration
Braze joints and heat treatments were produced using a tube furnace with a maximum temperature of 1200° C
and with a continuous gas flow of nitrogen at 3,7 L/minutes to mimic what is known as controlled atmosphere
brazing (CAB) which is used today in aluminum brazing as well as steel brazing.
Joint preparation and fixturing
Strips of USIBOR were cut into lengths and burrs were ground down to ensure good fitting between sheets in the
area to be joined. The substrates were then cleaned, first using acetone and then with ethanol.
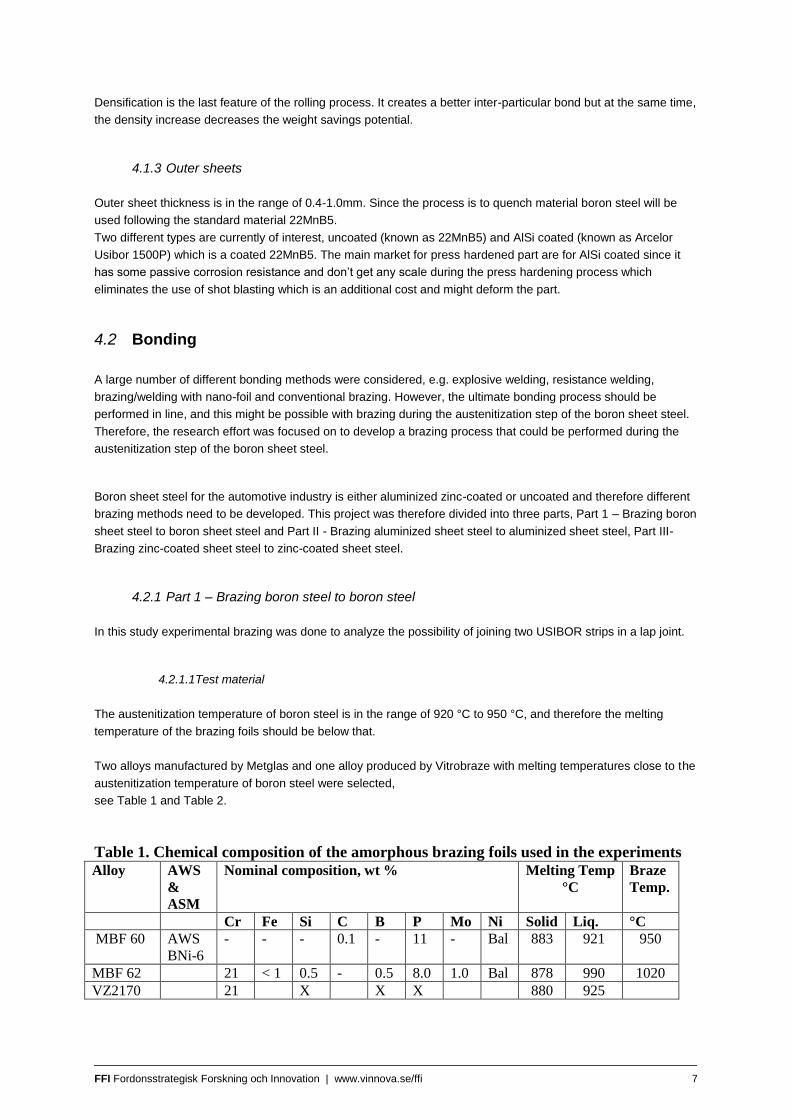
The setup was placed in a fixture made out of sintered SiO2 and a steel weight of 252 g was placed on the joint
area to apply pressure during brazing see Figure 4. This was then lowered into a furnace boat on top of a fixture
with a thermocouple type-S see Figure 5 and Figure 5 and could be slid in and out of the tube furnace see Figure
6.
4.2.1.3 Evaluation methods
Tensile test, single lap joint
Tensile test was performed to evaluate the shear strength of the joint. The shear strength is estimated under the
assumption the shear stress is distributed even over the entire joint area.
Figure 4. Fixture with samples and weight placed on joint area.
Figure 5.Thermocouple placed in the boat.
FFI Fordonsstrategisk Forskning och Innovation | www.vinnova.se/ffi 9
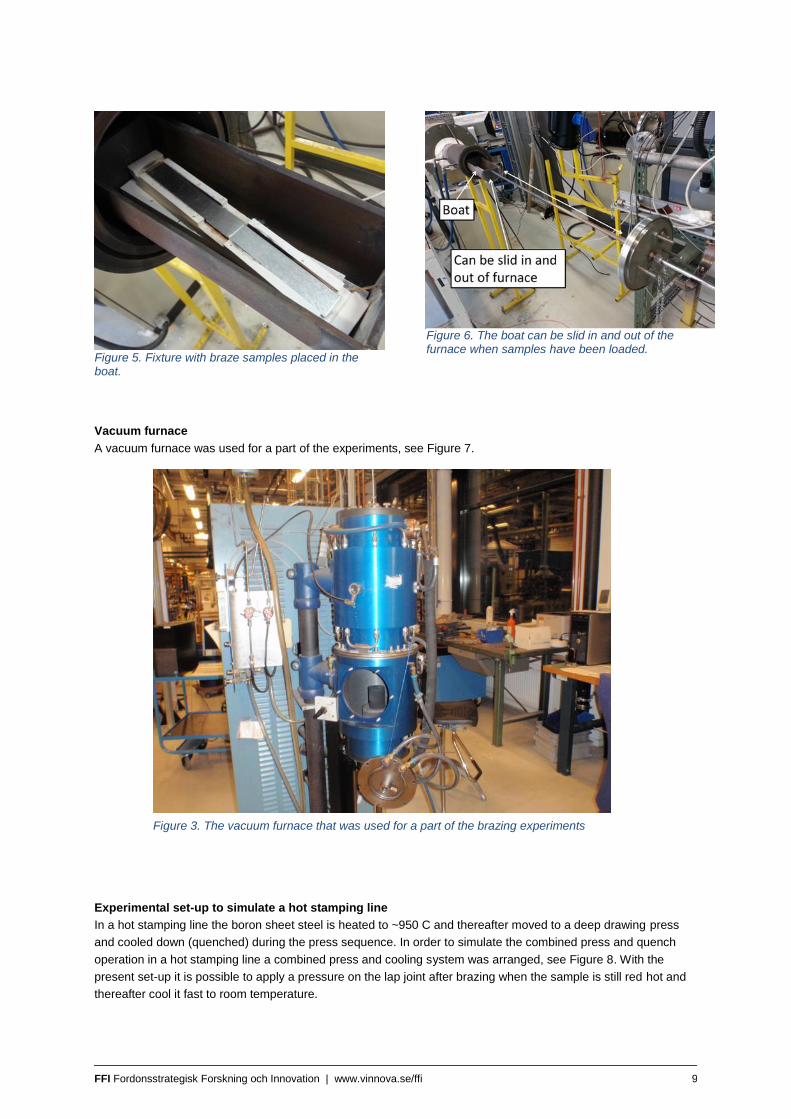
Vacuum furnace
A vacuum furnace was used for a part of the experiments, see Figure 7.
Experimental set-up to simulate a hot stamping line
In a hot stamping line the boron sheet steel is heated to ~950 C and thereafter moved to a deep drawing press
and cooled down (quenched) during the press sequence. In order to simulate the combined press and quench
operation in a hot stamping line a combined press and cooling system was arranged, see Figure 8. With the
present set-up it is possible to apply a pressure on the lap joint after brazing when the sample is still red hot and
thereafter cool it fast to room temperature.
Figure 3. The vacuum furnace that was used for a part of the brazing experiments
Figure 5. Fixture with braze samples placed in the boat.
Figure 6. The boat can be slid in and out of the furnace when samples have been loaded.

FFI Fordonsstrategisk Forskning och Innovation | www.vinnova.se/ffi 10
A surface pressure of 5 -6 MPa was applied on the lap joint in some experiments after heating when the joint was
still red hot, and thereafter the samples were water-quenched.
4.2.1.4 Evaluation methods
Tensile test was performed to evaluate the shear strength of the joint. The shear strength is estimated under the
assumption the shear stress is distributed even over the entire joint area.
Figure 4. The combined press and cooling system for simulation of a hot stamping line.
Figure 5. Size of joint.
FFI Fordonsstrategisk Forskning och Innovation | www.vinnova.se/ffi 11
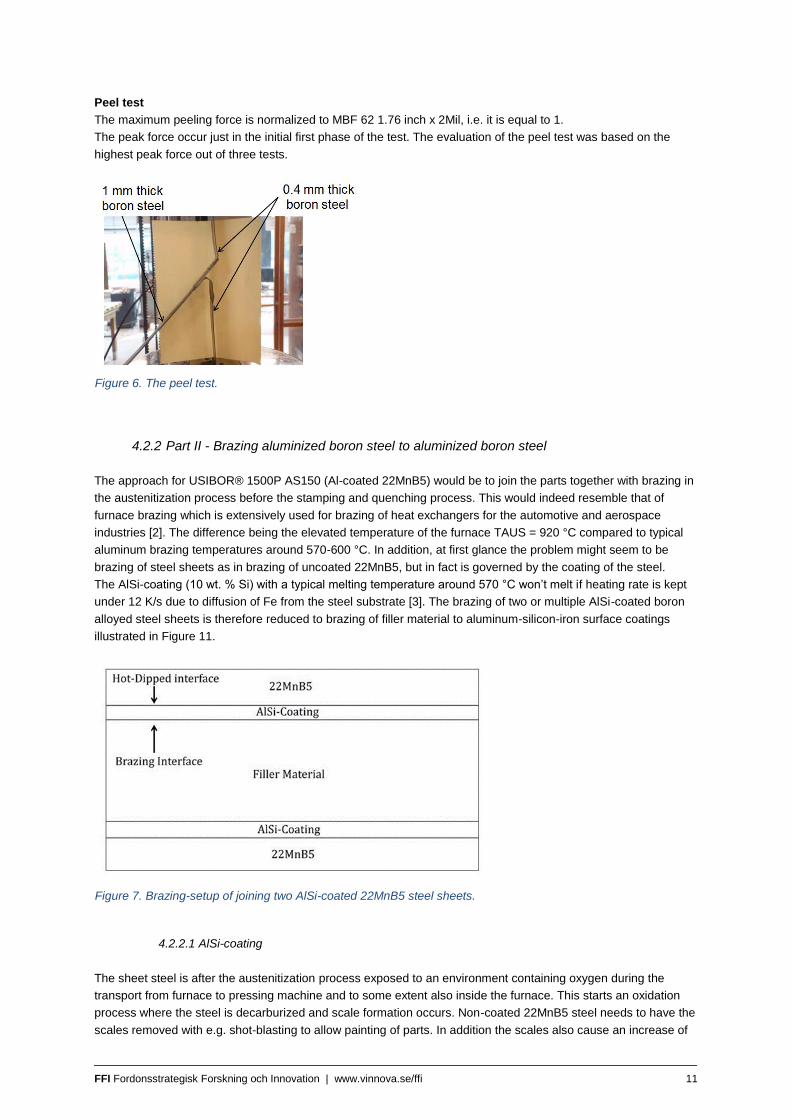
Peel test
The maximum peeling force is normalized to MBF 62 1.76 inch x 2Mil, i.e. it is equal to 1.
The peak force occur just in the initial first phase of the test. The evaluation of the peel test was based on the
highest peak force out of three tests.
4.2.2 Part II - Brazing aluminized boron steel to aluminized boron steel
The approach for USIBOR® 1500P AS150 (Al-coated 22MnB5) would be to join the parts together with brazing in
the austenitization process before the stamping and quenching process. This would indeed resemble that of
furnace brazing which is extensively used for brazing of heat exchangers for the automotive and aerospace
industries [2]. The difference being the elevated temperature of the furnace TAUS = 920 °C compared to typical
aluminum brazing temperatures around 570-600 °C. In addition, at first glance the problem might seem to be
brazing of steel sheets as in brazing of uncoated 22MnB5, but in fact is governed by the coating of the steel.
The AlSi-coating (10 wt. % Si) with a typical melting temperature around 570 °C won’t melt if heating rate is kept
under 12 K/s due to diffusion of Fe from the steel substrate [3]. The brazing of two or multiple AlSi-coated boron
alloyed steel sheets is therefore reduced to brazing of filler material to aluminum-silicon-iron surface coatings
illustrated in Figure 11.
4.2.2.1 AlSi-coating
The sheet steel is after the austenitization process exposed to an environment containing oxygen during the
transport from furnace to pressing machine and to some extent also inside the furnace. This starts an oxidation
process where the steel is decarburized and scale formation occurs. Non-coated 22MnB5 steel needs to have the
scales removed with e.g. shot-blasting to allow painting of parts. In addition the scales also cause an increase of
Figure 6. The peel test.
Figure 7. Brazing-setup of joining two AlSi-coated 22MnB5 steel sheets.
FFI Fordonsstrategisk Forskning och Innovation | www.vinnova.se/ffi 12
abrasive wear on pressing dies. By using a heat resistant coating layer on top of the steel this can be reduced or
avoided.
In addition to preventing scale formation during oxidation coatings are typically also applied to have corrosion
resistant mechanics. The most used coatings are a Zn-based galvanizing coating and an AlSi coating offering
both corrosion resistance and protections towards oxidation, where the AlSi protective coating sees the most
widespread usage [9].
Contrary to Zn-based coatings, AlSi coatings are not suitable for use in the indirect process of hot stamping as the
coating is not as formable as the boron steel and would break during deep drawing [9]. The fewer steps in the
direct process make this the more preferred and used coating, unless there is a need for cathodic-protection. The
appliance of the AlSi-layer is done by hot-dipping and manufacturers supply different thicknesses (9-35 μm) with a
typical Si content of 10 %, Fe 3 % and the rest Al [15].
As in the case of the Zn-based coating the AlSi also forms new phases during the heating to austenitization
temperature due to Fe-diffusion in the interface between sheet metal and coating. Apart from the cool-down rate,
mentioned earlier, being a crucial parameter the rate at which the furnace heats the steel blank is limited by the
AlSi-coating. A heating rate exceeding 12 K/s will melt the coating as AlSi has a melting temperature well below
the austenitization of steel, but by keeping it under the limit, Fe-diffusion will continually raise the melting point [3].
Already after the hot-dipping has been done an Al-rich intermetallic phase is formed in the region at the interface
between steel and coating, as shown in Figure 12, containing mainly Al8Fe2Si [16]. These Al-rich phases have
low fracture toughness and can cause cracks in the coating during pressing, which would reduce corrosion
resistance and weldability as well as increasing abrasive wear on tools. When the austenitization temperature is
reached, Figure 13 middle image, the Al-coating is completely transformed into intermetallic phases of the type
Al5Fe2 and Al2Fe3Si3 and with continued dwell-time at, TAUS = 920 °C, further transformation into AlFe occurs.
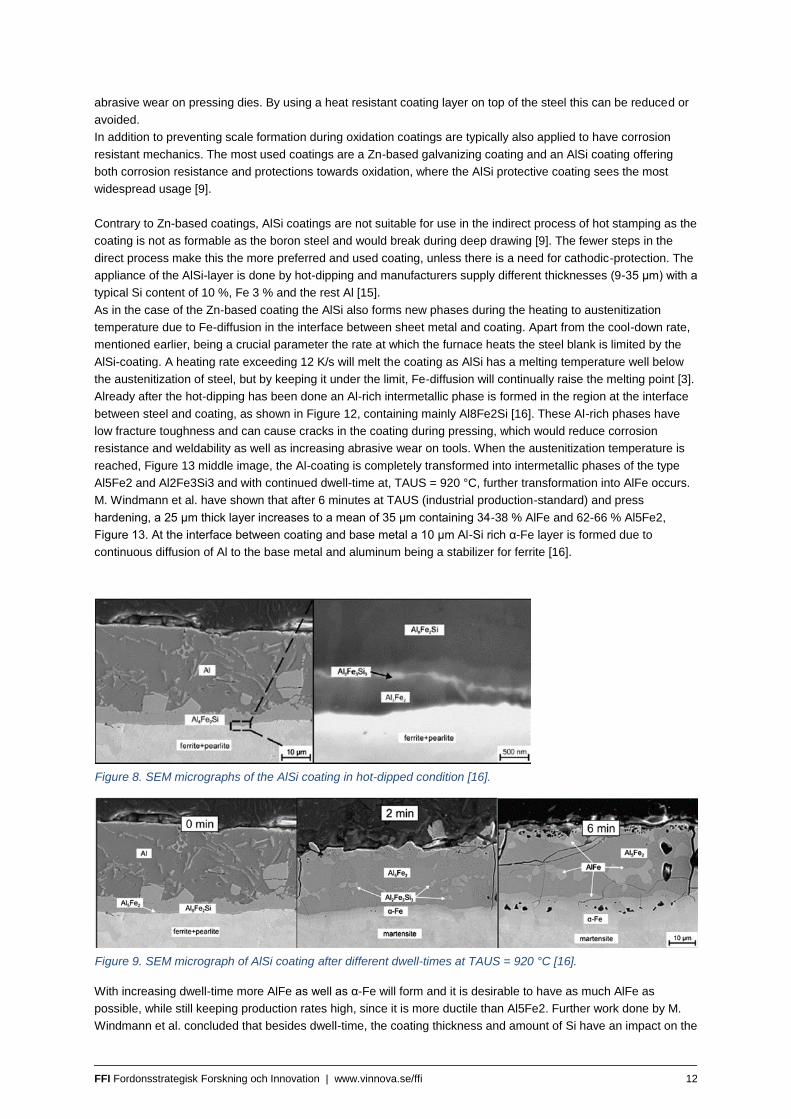
M. Windmann et al. have shown that after 6 minutes at TAUS (industrial production-standard) and press
hardening, a 25 μm thick layer increases to a mean of 35 μm containing 34-38 % AlFe and 62-66 % Al5Fe2,
Figure 13. At the interface between coating and base metal a 10 μm Al-Si rich α-Fe layer is formed due to
continuous diffusion of Al to the base metal and aluminum being a stabilizer for ferrite [16].
With increasing dwell-time more AlFe as well as α-Fe will form and it is desirable to have as much AlFe as
possible, while still keeping production rates high, since it is more ductile than Al5Fe2. Further work done by M.
Windmann et al. concluded that besides dwell-time, the coating thickness and amount of Si have an impact on the
Figure 8. SEM micrographs of the AlSi coating in hot-dipped condition [16].
Figure 9. SEM micrograph of AlSi coating after different dwell-times at TAUS = 920 °C [16].

FFI Fordonsstrategisk Forskning och Innovation | www.vinnova.se/ffi 13
magnitude of AlFe in the coating layer. Thinner coating thicknesses lead to shorter diffusion paths and thus
promote AlFe transformation, while lowering silicon amount will provoke transformation of hard and brittle Al-rich
intermetallic phases [15].
On the surface of the coating an Al2O3 oxide-layer is formed which provide protection towards scale formation
when the blanks are exposed to an oxygen rich atmosphere and give good corrosion resistance by inhibiting
further oxidation.
4.2.2.2 Brazing
Different materials are used as fillers during brazing depending on the base material and the mechanical
properties the joint needs to for fill. What they all have in common is that their liquidus temperature is lower than
the solidus temperature of the base material and when molten, the filler metal wets the surface between the
metals to be joined via capillary action. This brings the materials within 4 Å of each other and inter-atomic
attraction is the bonding force [2].
Both soldering and brazing works in this exact same manner and contrary to welding do not imply melting of the
base material but only the filler is melted. The difference between brazing and soldering is defined by the
temperature used to melt the filler material. The method is called brazing when conducted at a temperature above
425 °C and soldering at temperatures below [17].
The oxide-layer produced at the surface of the coating protecting against scale formation on the coated 22MnB5
steel becomes an issue during brazing. The high melting temperature of Al2O3 (> 2000 °C) [18] prohibits wetting
of the surface and has to be removed by either mechanical means or by the use of a flux.
4.2.2.3 Flux
The main objective of a flux (chemical compound) is to dissolve the accelerated formation of oxide layers that
forms when metals are heated to high temperatures and to cover the brazing joint preventing any new oxides
from forming. There are numerous different types of fluxes that have different work-temperature, heating-times
and other specific properties needed for brazing of all kinds of alloys [19].
For brazing aluminum there are two types of fluxes, corrosive and non-corrosive. Corrosive fluxes consist of
Potassium chloride and when used provide good results during brazing in both mechanical properties of the joint
and in appearance. They do however have a drawback in electrolytic-corrosion from left over residue after
brazing. This requires a complicated cleaning process, rinsing the products in hot water is simply not enough.
Non-corrosive fluxes on the other hand do not require the extra cleaning process, but do however leave a gritty
surface finish. One of the more popular fluxes is NOCOLOK® due to its melting temperature being close to that of
aluminum-silicon filler materials [20]
NOCOLOK® flux consists of a mixture of potassium fluoroaluminates, namely KAlF4 (70–80 %), K2AlF5·H2O and
K2AlF5 (20-30 %). It is characterized by a melting point between 565 °C and 572 °C and is non-hygroscopic as
well as earlier mentioned non-corrosive [21].
During the braze-cycle at 490 °C the flux chemically reacts as in Eq. 1 which gives the flux melting temperature
range as described above (565 – 572°C). During brazing some of the KAlF4 evaporates and can react with the
furnace atmosphere if it is moist and form hydrogen fluoride according to Eq. 2 which is toxic [21]. Therefor a
need for low oxygen atmosphere is a need, typically nitrogen is used. Good ventilation could also be required. An
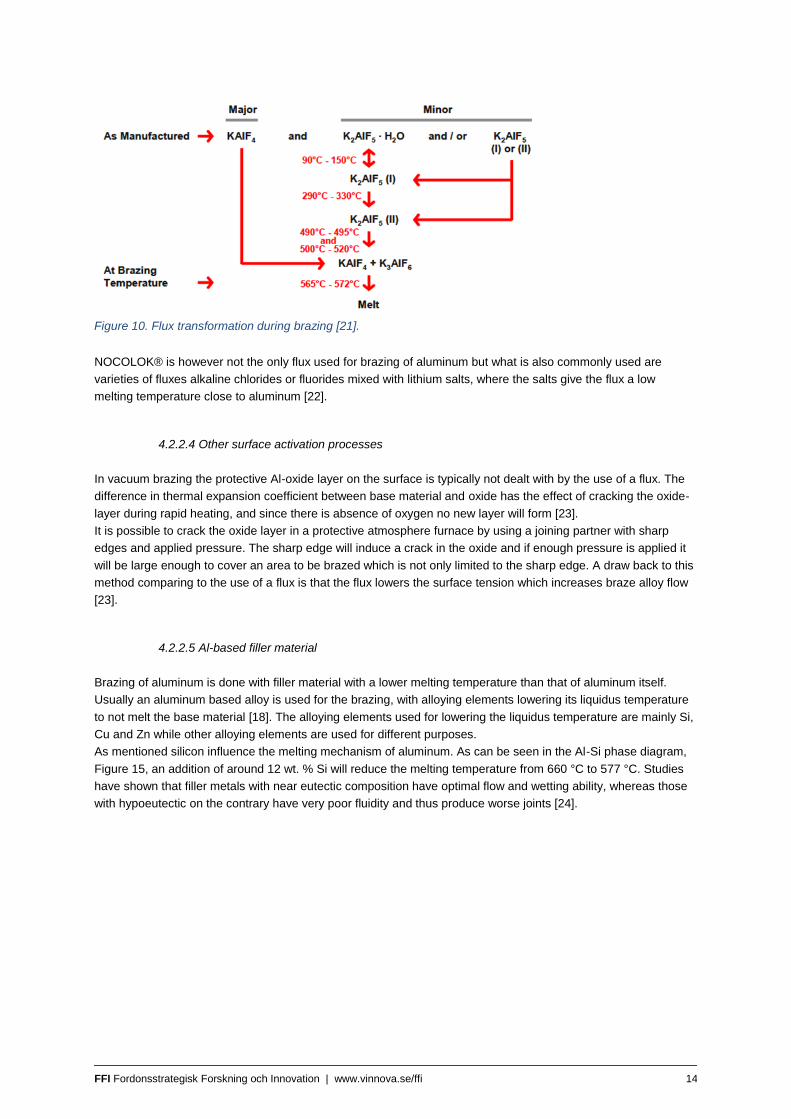
outline of the flux transformation is shown in Figure 14.
2𝐾2𝐴𝑙𝐹5 → 𝐾𝐴𝑙𝐹4 + 𝐾3𝐴𝑙𝐹6 (1)
3𝐾𝐴𝑙𝐹4 + 3𝐻20 → 𝐾3𝐴𝑙𝐹6 + 𝐴𝑙2𝑂3 + 6𝐻𝐹 (2)
FFI Fordonsstrategisk Forskning och Innovation | www.vinnova.se/ffi 14
NOCOLOK® is however not the only flux used for brazing of aluminum but what is also commonly used are
varieties of fluxes alkaline chlorides or fluorides mixed with lithium salts, where the salts give the flux a low
melting temperature close to aluminum [22].
4.2.2.4 Other surface activation processes
In vacuum brazing the protective Al-oxide layer on the surface is typically not dealt with by the use of a flux. The
difference in thermal expansion coefficient between base material and oxide has the effect of cracking the oxide-
layer during rapid heating, and since there is absence of oxygen no new layer will form [23].
It is possible to crack the oxide layer in a protective atmosphere furnace by using a joining partner with sharp
edges and applied pressure. The sharp edge will induce a crack in the oxide and if enough pressure is applied it
will be large enough to cover an area to be brazed which is not only limited to the sharp edge. A draw back to this
method comparing to the use of a flux is that the flux lowers the surface tension which increases braze alloy flow
[23].
4.2.2.5 Al-based filler material
Brazing of aluminum is done with filler material with a lower melting temperature than that of aluminum itself.
Usually an aluminum based alloy is used for the brazing, with alloying elements lowering its liquidus temperature
to not melt the base material [18]. The alloying elements used for lowering the liquidus temperature are mainly Si,
Cu and Zn while other alloying elements are used for different purposes.
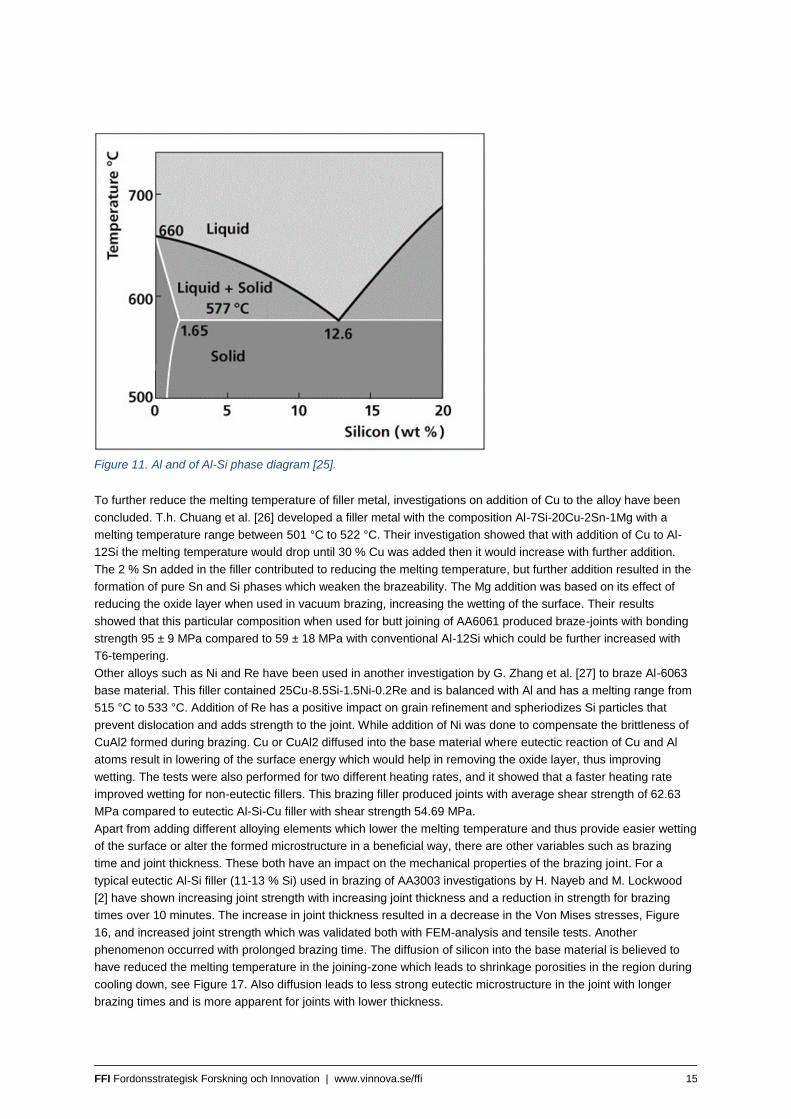
As mentioned silicon influence the melting mechanism of aluminum. As can be seen in the Al-Si phase diagram,
Figure 15, an addition of around 12 wt. % Si will reduce the melting temperature from 660 °C to 577 °C. Studies
have shown that filler metals with near eutectic composition have optimal flow and wetting ability, whereas those
with hypoeutectic on the contrary have very poor fluidity and thus produce worse joints [24].
Figure 10. Flux transformation during brazing [21].
FFI Fordonsstrategisk Forskning och Innovation | www.vinnova.se/ffi 15
To further reduce the melting temperature of filler metal, investigations on addition of Cu to the alloy have been
concluded. T.h. Chuang et al. [26] developed a filler metal with the composition Al-7Si-20Cu-2Sn-1Mg with a
melting temperature range between 501 °C to 522 °C. Their investigation showed that with addition of Cu to Al-
12Si the melting temperature would drop until 30 % Cu was added then it would increase with further addition.
The 2 % Sn added in the filler contributed to reducing the melting temperature, but further addition resulted in the
formation of pure Sn and Si phases which weaken the brazeability. The Mg addition was based on its effect of
reducing the oxide layer when used in vacuum brazing, increasing the wetting of the surface. Their results
showed that this particular composition when used for butt joining of AA6061 produced braze-joints with bonding
strength 95 ± 9 MPa compared to 59 ± 18 MPa with conventional Al-12Si which could be further increased with
T6-tempering.
Other alloys such as Ni and Re have been used in another investigation by G. Zhang et al. [27] to braze Al-6063
base material. This filler contained 25Cu-8.5Si-1.5Ni-0.2Re and is balanced with Al and has a melting range from
515 °C to 533 °C. Addition of Re has a positive impact on grain refinement and spheriodizes Si particles that
prevent dislocation and adds strength to the joint. While addition of Ni was done to compensate the brittleness of
CuAl2 formed during brazing. Cu or CuAl2 diffused into the base material where eutectic reaction of Cu and Al
atoms result in lowering of the surface energy which would help in removing the oxide layer, thus improving
wetting. The tests were also performed for two different heating rates, and it showed that a faster heating rate
improved wetting for non-eutectic fillers. This brazing filler produced joints with average shear strength of 62.63
MPa compared to eutectic Al-Si-Cu filler with shear strength 54.69 MPa.
Apart from adding different alloying elements which lower the melting temperature and thus provide easier wetting
of the surface or alter the formed microstructure in a beneficial way, there are other variables such as brazing
time and joint thickness. These both have an impact on the mechanical properties of the brazing joint. For a
typical eutectic Al-Si filler (11-13 % Si) used in brazing of AA3003 investigations by H. Nayeb and M. Lockwood
[2] have shown increasing joint strength with increasing joint thickness and a reduction in strength for brazing
times over 10 minutes. The increase in joint thickness resulted in a decrease in the Von Mises stresses, Figure
16, and increased joint strength which was validated both with FEM-analysis and tensile tests. Another
phenomenon occurred with prolonged brazing time. The diffusion of silicon into the base material is believed to
have reduced the melting temperature in the joining-zone which leads to shrinkage porosities in the region during
cooling down, see Figure 17. Also diffusion leads to less strong eutectic microstructure in the joint with longer
brazing times and is more apparent for joints with lower thickness.
Figure 11. Al and of Al-Si phase diagram [25].

FFI Fordonsstrategisk Forskning och Innovation | www.vinnova.se/ffi 16
4.2.3 Experimental
In this study experimental brazing was done to analyze the possibility of joining two USIBOR® 1500P AS150
blanks in a lap joint as an attempt to investigate the joining possibility of above mentioned material to a core and
its usage in a sandwich structure. Further the strength of the coating after various heat treatments was tested
both in shear and tensile pull off load using adhesive.
4.2.3.1 Material
For this study the following material was used:
• 22MnB5 steel (boron alloyed steel), see Table 3
• USIBOR® 1500P AS150, (aluminized 22MnB5 press hardening steel), thickness 1.15 mm, see
Table 4.
Table3. Average chemical composition of 22MnB5 [%] (N, 2003).
C Si Mn Cr P S B Al Ti
22MnB5 0,225 0,25 1,25 0,155 <0,025 <0,008 0,0035 >0,015 0,035
Figure 12. Variation of Von Mises stress in the joint region vs. joint thickness [2].
Figure 13. Shrinkage cavities from a joint with brazing period 40 minutes [2].
FFI Fordonsstrategisk Forskning och Innovation | www.vinnova.se/ffi 17
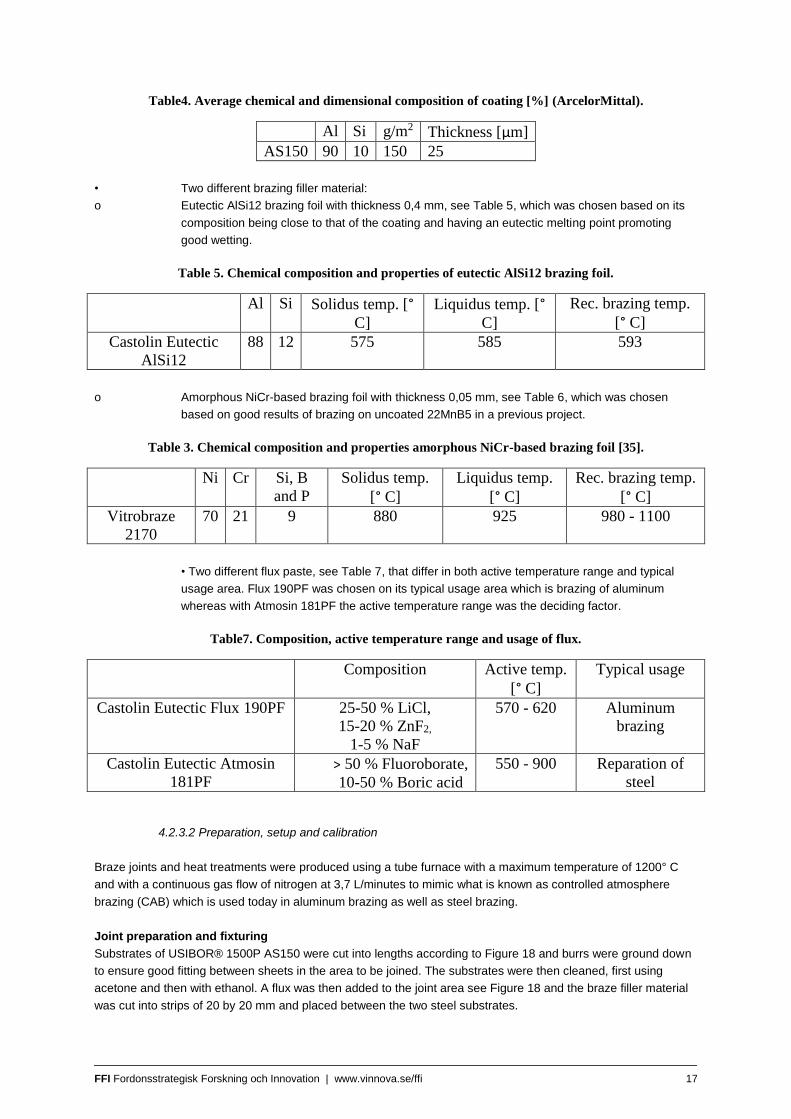
Table4. Average chemical and dimensional composition of coating [%] (ArcelorMittal).
Al Si g/m2 Thickness [μm]
AS150 90 10 150 25
• Two different brazing filler material:
o Eutectic AlSi12 brazing foil with thickness 0,4 mm, see Table 5, which was chosen based on its
composition being close to that of the coating and having an eutectic melting point promoting
good wetting.
Table 5. Chemical composition and properties of eutectic AlSi12 brazing foil.
Al Si Solidus temp. [° C]
Liquidus temp. [° C]
Rec. brazing temp.
[° C]
Castolin Eutectic
AlSi12
88 12 575 585 593
o Amorphous NiCr-based brazing foil with thickness 0,05 mm, see Table 6, which was chosen
based on good results of brazing on uncoated 22MnB5 in a previous project.
Table 3. Chemical composition and properties amorphous NiCr-based brazing foil [35].
Ni Cr Si, B
and P
Solidus temp.
[° C]
Liquidus temp.
[° C]
Rec. brazing temp.
[° C]
Vitrobraze
2170
70 21 9 880 925 980 - 1100
• Two different flux paste, see Table 7, that differ in both active temperature range and typical
usage area. Flux 190PF was chosen on its typical usage area which is brazing of aluminum
whereas with Atmosin 181PF the active temperature range was the deciding factor.
Table7. Composition, active temperature range and usage of flux.
Composition Active temp.
[° C]
Typical usage
Castolin Eutectic Flux 190PF 25-50 % LiCl,
15-20 % ZnF2,
1-5 % NaF
570 - 620 Aluminum
brazing
Castolin Eutectic Atmosin
181PF > 50 % Fluoroborate,
10-50 % Boric acid
550 - 900 Reparation of
steel
4.2.3.2 Preparation, setup and calibration
Braze joints and heat treatments were produced using a tube furnace with a maximum temperature of 1200° C
and with a continuous gas flow of nitrogen at 3,7 L/minutes to mimic what is known as controlled atmosphere
brazing (CAB) which is used today in aluminum brazing as well as steel brazing.
Joint preparation and fixturing
Substrates of USIBOR® 1500P AS150 were cut into lengths according to Figure 18 and burrs were ground down
to ensure good fitting between sheets in the area to be joined. The substrates were then cleaned, first using
acetone and then with ethanol. A flux was then added to the joint area see Figure 18 and the braze filler material
was cut into strips of 20 by 20 mm and placed between the two steel substrates.

FFI Fordonsstrategisk Forskning och Innovation | www.vinnova.se/ffi 18
The setup can then be placed in a fixture made out of sintered SiO2 and a steel weight of 252 g is placed on the
joint area to apply pressure during brazing see Figure xx. This is then lowered into a furnace boat on top of a
fixture with a thermocouple type-S.
Heat cycles
Calibration of the thermocouple type-S placed beneath the fixture holding the test-samples was calibrated using a
second thermocouple type-S which was resistance spot welded (RSW) directly onto a 1,15 mm thick USIBOR®
1500P AS150 test piece. This piece was in turn resistance spot welded (RSW) to another USIBOR® 1500P
AS150 piece with 20 mm overlap, as in Figure 18 to resemble the brazing setup.
The calibration was performed with the tube furnace set to two different temperatures, 800 and 950° C to validate
to accuracy of the internal thermocouple of the furnace itself and also to see the difference in measurement of the
welded onto substrate and beneath substrate thermocouples. The difference in measurement being particularly
important as the thermocouple placed beneath samples is used as the measuring device during brazing and heat
treatment cycles.
When the furnace thermocouple showed the preset temperature it was left for at least 30 minutes to make sure
the heat zone was even. The boat with calibration sample and thermocouples was then slid into the furnace and
when both thermocouples reached the furnace temperature it was pulled out. The sample with RSW
thermocouple was quickly water quenched while the boat, fixture and steel weight were only cooled by the
surrounding air. The process was then repeated when everything but the water quenched sample had an
elevated temperature to simulate rapid testing where one sample is removed and another one is directly loaded
into the still warm boat, this to simulate production flow in a high volume press hardening furnace. The heating
curves of both thermocouples are shown in Figure 23 and Figure 24.
Figure 15. Thermocouples on and below sample with furnace temperature 800° C.
Figure 14. Lap joint of braze attempts.
FFI Fordonsstrategisk Forskning och Innovation | www.vinnova.se/ffi 19
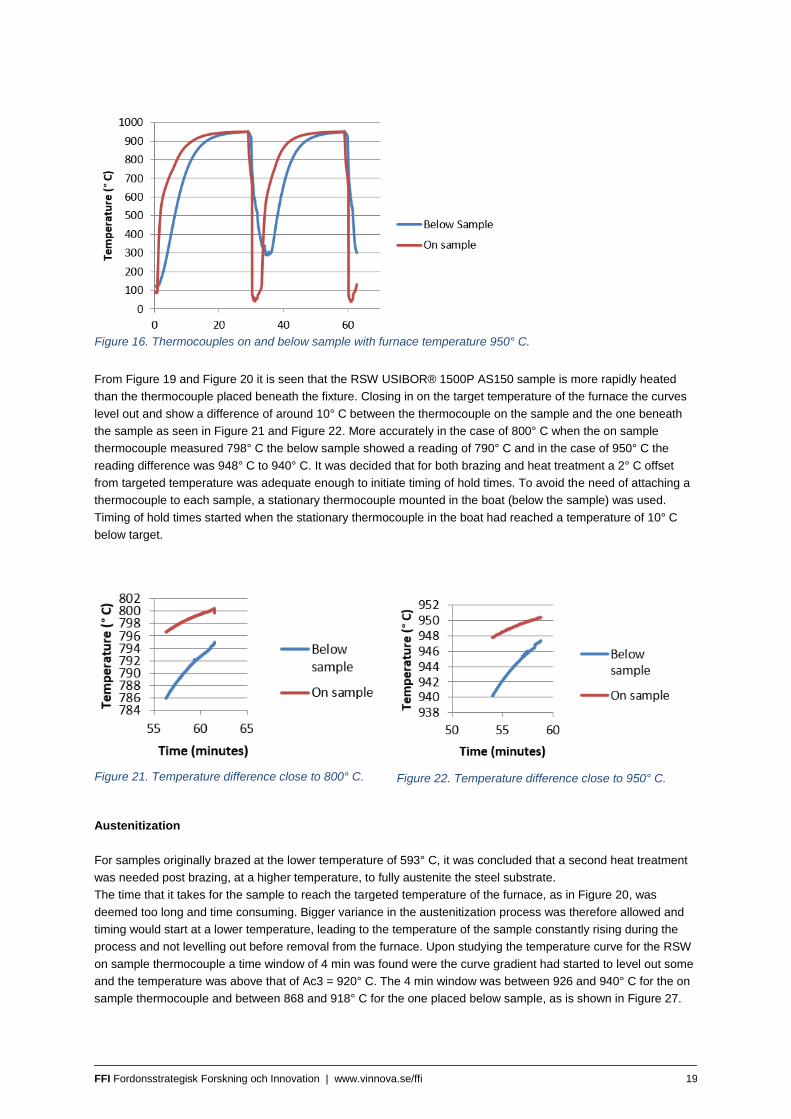
From Figure 19 and Figure 20 it is seen that the RSW USIBOR® 1500P AS150 sample is more rapidly heated
than the thermocouple placed beneath the fixture. Closing in on the target temperature of the furnace the curves
level out and show a difference of around 10° C between the thermocouple on the sample and the one beneath
the sample as seen in Figure 21 and Figure 22. More accurately in the case of 800° C when the on sample
thermocouple measured 798° C the below sample showed a reading of 790° C and in the case of 950° C the
reading difference was 948° C to 940° C. It was decided that for both brazing and heat treatment a 2° C offset
from targeted temperature was adequate enough to initiate timing of hold times. To avoid the need of attaching a
thermocouple to each sample, a stationary thermocouple mounted in the boat (below the sample) was used.
Timing of hold times started when the stationary thermocouple in the boat had reached a temperature of 10° C
below target.
Austenitization
For samples originally brazed at the lower temperature of 593° C, it was concluded that a second heat treatment
was needed post brazing, at a higher temperature, to fully austenite the steel substrate.
The time that it takes for the sample to reach the targeted temperature of the furnace, as in Figure 20, was
deemed too long and time consuming. Bigger variance in the austenitization process was therefore allowed and
timing would start at a lower temperature, leading to the temperature of the sample constantly rising during the
process and not levelling out before removal from the furnace. Upon studying the temperature curve for the RSW
on sample thermocouple a time window of 4 min was found were the curve gradient had started to level out some
and the temperature was above that of Ac3 = 920° C. The 4 min window was between 926 and 940° C for the on
sample thermocouple and between 868 and 918° C for the one placed below sample, as is shown in Figure 27.
Figure 16. Thermocouples on and below sample with furnace temperature 950° C.
Figure 21. Temperature difference close to 800° C. Figure 22. Temperature difference close to 950° C.
FFI Fordonsstrategisk Forskning och Innovation | www.vinnova.se/ffi 20
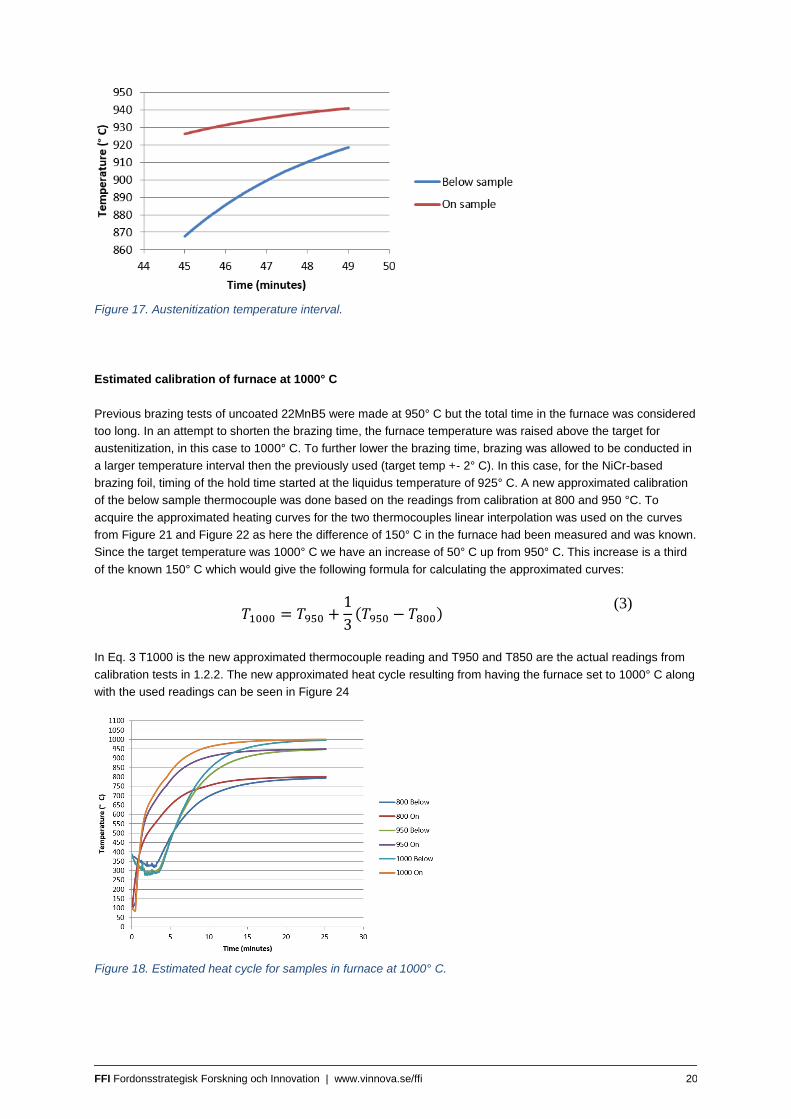
Estimated calibration of furnace at 1000° C
Previous brazing tests of uncoated 22MnB5 were made at 950° C but the total time in the furnace was considered
too long. In an attempt to shorten the brazing time, the furnace temperature was raised above the target for
austenitization, in this case to 1000° C. To further lower the brazing time, brazing was allowed to be conducted in
a larger temperature interval then the previously used (target temp +- 2° C). In this case, for the NiCr-based
brazing foil, timing of the hold time started at the liquidus temperature of 925° C. A new approximated calibration
of the below sample thermocouple was done based on the readings from calibration at 800 and 950 °C. To
acquire the approximated heating curves for the two thermocouples linear interpolation was used on the curves
from Figure 21 and Figure 22 as here the difference of 150° C in the furnace had been measured and was known.
Since the target temperature was 1000° C we have an increase of 50° C up from 950° C. This increase is a third
of the known 150° C which would give the following formula for calculating the approximated curves:
𝑇1000 = 𝑇950 +1
3(𝑇950 − 𝑇800)
(3)
In Eq. 3 T1000 is the new approximated thermocouple reading and T950 and T850 are the actual readings from
calibration tests in 1.2.2. The new approximated heat cycle resulting from having the furnace set to 1000° C along
with the used readings can be seen in Figure 24
Figure 18. Estimated heat cycle for samples in furnace at 1000° C.
Figure 17. Austenitization temperature interval.
FFI Fordonsstrategisk Forskning och Innovation | www.vinnova.se/ffi 21
4.2.4 Brazing
Attempts were made to produce braze joints with different combinations of temperature, hold times, filler material
and fluxes. During brazing the tube furnace had a continuous gas flow of 3,7 L/minutes of nitrogen. Temperatures
for each test were logged using the thermocouple type-S placed beneath the sample. Hold times were also based
on the same thermocouple. The prepared samples of steel substrates with flux and filler material were placed in
the fixture which was loaded into the boat. The weight was placed on the joint area and everything slid into the
furnace, and when the desired hold time at a specific temperature had been achieved the sample removed and
air cooled.
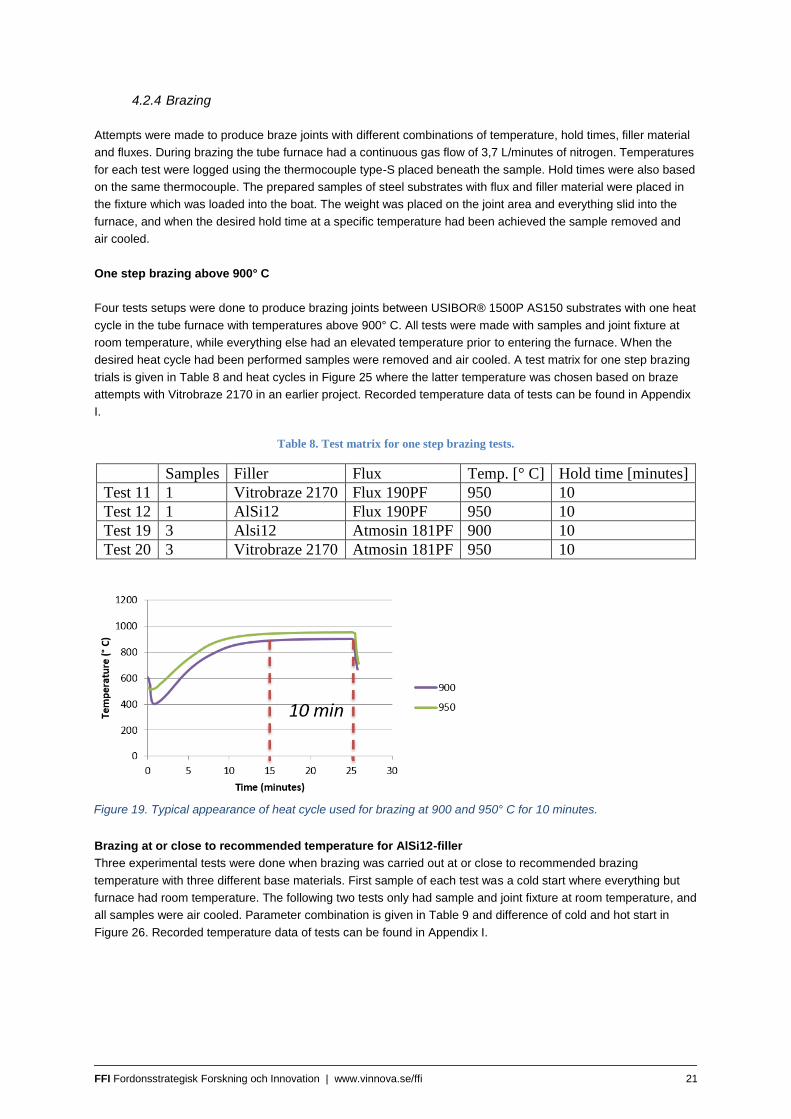
One step brazing above 900° C
Four tests setups were done to produce brazing joints between USIBOR® 1500P AS150 substrates with one heat
cycle in the tube furnace with temperatures above 900° C. All tests were made with samples and joint fixture at
room temperature, while everything else had an elevated temperature prior to entering the furnace. When the
desired heat cycle had been performed samples were removed and air cooled. A test matrix for one step brazing
trials is given in Table 8 and heat cycles in Figure 25 where the latter temperature was chosen based on braze
attempts with Vitrobraze 2170 in an earlier project. Recorded temperature data of tests can be found in Appendix
I.
Table 8. Test matrix for one step brazing tests.
Samples Filler Flux Temp. [° C] Hold time [minutes]
Test 11 1 Vitrobraze 2170 Flux 190PF 950 10
Test 12 1 AlSi12 Flux 190PF 950 10
Test 19 3 Alsi12 Atmosin 181PF 900 10
Test 20 3 Vitrobraze 2170 Atmosin 181PF 950 10
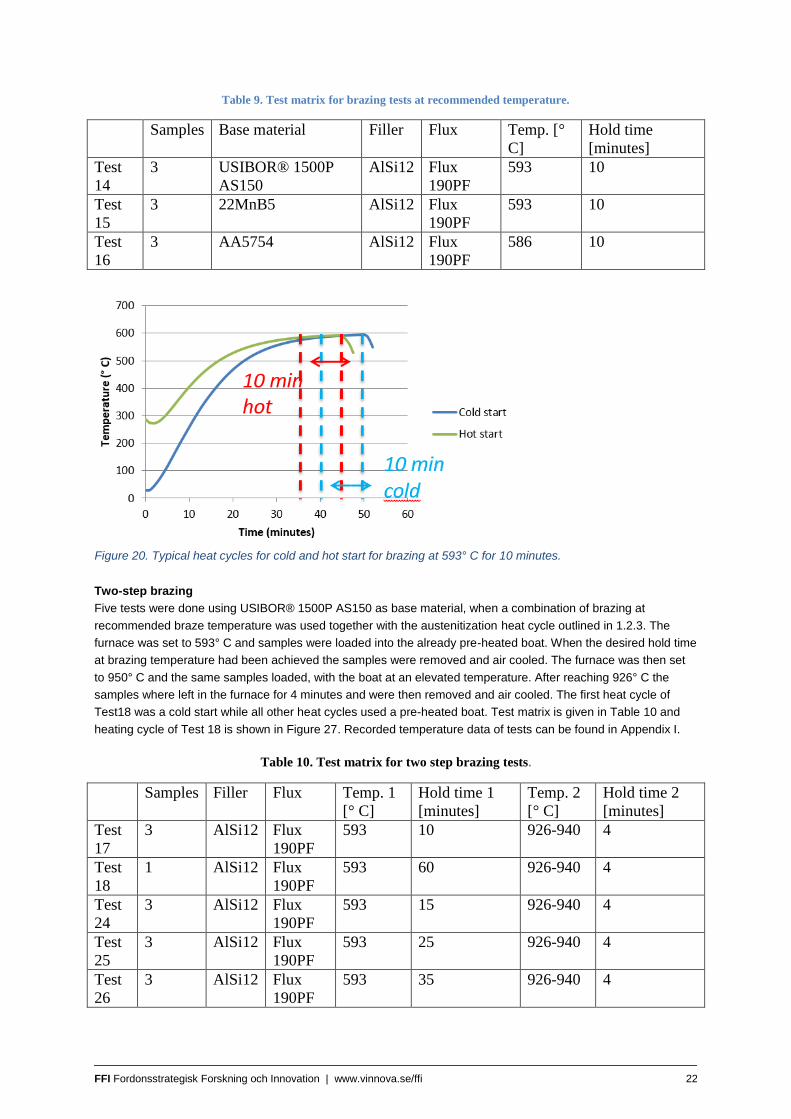
Brazing at or close to recommended temperature for AlSi12-filler
Three experimental tests were done when brazing was carried out at or close to recommended brazing
temperature with three different base materials. First sample of each test was a cold start where everything but
furnace had room temperature. The following two tests only had sample and joint fixture at room temperature, and
all samples were air cooled. Parameter combination is given in Table 9 and difference of cold and hot start in
Figure 26. Recorded temperature data of tests can be found in Appendix I.
Figure 19. Typical appearance of heat cycle used for brazing at 900 and 950° C for 10 minutes.
FFI Fordonsstrategisk Forskning och Innovation | www.vinnova.se/ffi 22
Table 9. Test matrix for brazing tests at recommended temperature.
Samples Base material Filler Flux Temp. [°
C]
Hold time
[minutes]
Test
14
3 USIBOR® 1500P
AS150
AlSi12 Flux
190PF
593 10
Test
15
3 22MnB5 AlSi12 Flux
190PF
593 10
Test
16
3 AA5754 AlSi12 Flux
190PF
586 10
Two-step brazing
Five tests were done using USIBOR® 1500P AS150 as base material, when a combination of brazing at
recommended braze temperature was used together with the austenitization heat cycle outlined in 1.2.3. The
furnace was set to 593° C and samples were loaded into the already pre-heated boat. When the desired hold time
at brazing temperature had been achieved the samples were removed and air cooled. The furnace was then set
to 950° C and the same samples loaded, with the boat at an elevated temperature. After reaching 926° C the
samples where left in the furnace for 4 minutes and were then removed and air cooled. The first heat cycle of
Test18 was a cold start while all other heat cycles used a pre-heated boat. Test matrix is given in Table 10 and
heating cycle of Test 18 is shown in Figure 27. Recorded temperature data of tests can be found in Appendix I.
Table 10. Test matrix for two step brazing tests.
Samples Filler Flux Temp. 1
[° C]
Hold time 1
[minutes]
Temp. 2
[° C]
Hold time 2
[minutes]
Test
17
3 AlSi12 Flux
190PF
593 10 926-940 4
Test
18
1 AlSi12 Flux
190PF
593 60 926-940 4
Test
24
3 AlSi12 Flux
190PF
593 15 926-940 4
Test
25
3 AlSi12 Flux
190PF
593 25 926-940 4
Test
26
3 AlSi12 Flux
190PF
593 35 926-940 4
Figure 20. Typical heat cycles for cold and hot start for brazing at 593° C for 10 minutes.

FFI Fordonsstrategisk Forskning och Innovation | www.vinnova.se/ffi 23
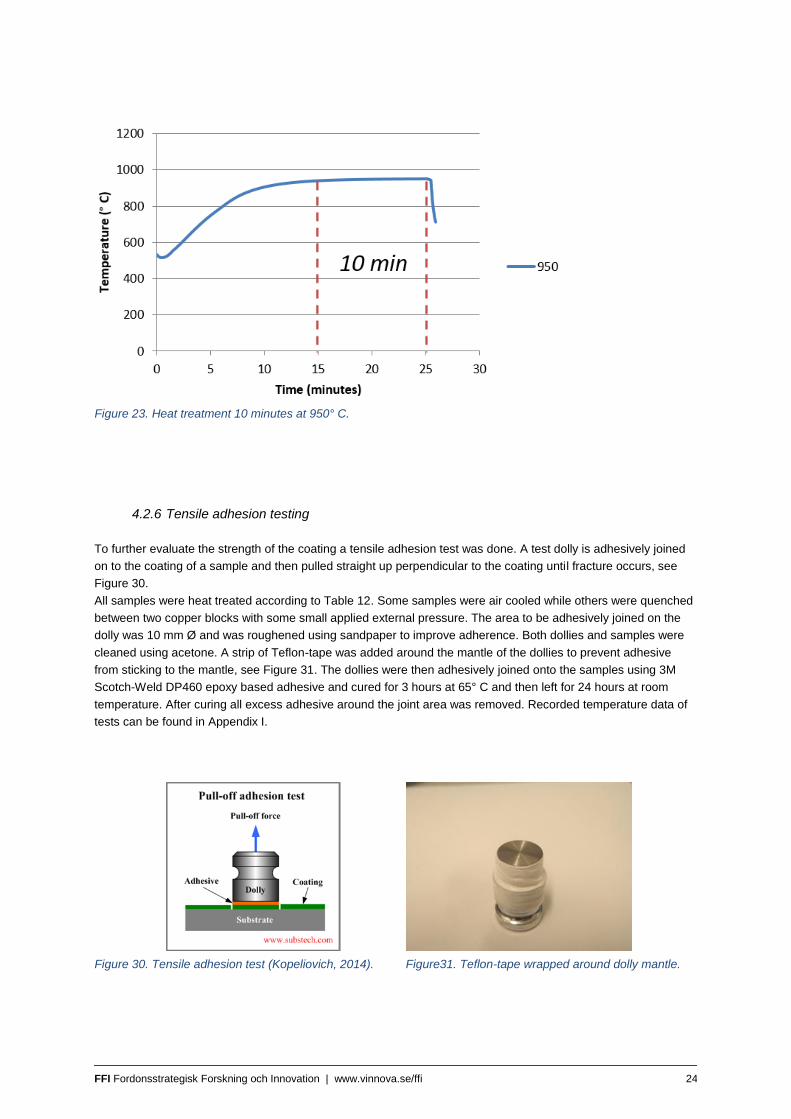
4.2.5 Adhesive joint
To evaluate the adherence of the AlSi-coating to the steel substrate after heat treatment samples joined with
adhesive were prepared. Three samples were first heat treated at 950° C for 10 minutes as in Figure 29 using a
pre-heated boat. After removal and air cooling the samples were cleaned using acetone and an adhesive was
applied on a 20 by 20 mm area to form a joint as in the brazing attempts see Figure 28. The adhesive used was
3M Scotch-Weld DP460, which is an epoxy based adhesive. After the appliance of adhesive, samples were left to
cure at least 24 hours at room temperature, based on recommendations from 3M. Table 11 shows test
parameters. Recorded temperature data of tests can be found in Appendix I.
Table 11. Test matrix for adhesive joint testing.
Samples Temp. [° C]
Hold time
[minutes]
Adhesive Cure
temp. [° C]
Cure
time [h]
Adhesive
joint
3 950 10 3M Scotch-
Weld DP460
~20 >24
Figure 21. Heating cycle of Test 18 where T2 shows hold time 1.
Figure 22. Adhesive joint preparation.
FFI Fordonsstrategisk Forskning och Innovation | www.vinnova.se/ffi 24
4.2.6 Tensile adhesion testing
To further evaluate the strength of the coating a tensile adhesion test was done. A test dolly is adhesively joined
on to the coating of a sample and then pulled straight up perpendicular to the coating until fracture occurs, see
Figure 30.
All samples were heat treated according to Table 12. Some samples were air cooled while others were quenched
between two copper blocks with some small applied external pressure. The area to be adhesively joined on the
dolly was 10 mm Ø and was roughened using sandpaper to improve adherence. Both dollies and samples were
cleaned using acetone. A strip of Teflon-tape was added around the mantle of the dollies to prevent adhesive
from sticking to the mantle, see Figure 31. The dollies were then adhesively joined onto the samples using 3M
Scotch-Weld DP460 epoxy based adhesive and cured for 3 hours at 65° C and then left for 24 hours at room
temperature. After curing all excess adhesive around the joint area was removed. Recorded temperature data of
tests can be found in Appendix I.
Figure 23. Heat treatment 10 minutes at 950° C.
Figure 30. Tensile adhesion test (Kopeliovich, 2014). Figure31. Teflon-tape wrapped around dolly mantle.

FFI Fordonsstrategisk Forskning och Innovation | www.vinnova.se/ffi 25
Table12. Heat treatments of samples used for tensile adhesion testing.
Samples Temp. 1 [°
C]
Hold time 1
[minutes]
Temp. 2 [°
C]
Hold time 2
[minutes]
Cooling
T1 2 593 15 926-940 4 Air
cooled
T2 2 593 25 926-940 4 Air
cooled
T3 2 593 35 926-940 4 Air
cooled
T4 2 593 15 926-940 4 Cu-
Blocks
T5 2 593 35 926-940 4 Cu-
Blocks
T6 1 950 10 - - Air
cooled
T7 1 950 10 - - Cu-
blocks
4.2.7 Evaluation
Heat rate
The maximum heat-rate is 12 ° C/s above 600° C in order to avoid melting of the AlSi-coating [3]. The fastest
measured heating rate occurs when the furnace is set to 950° C and as a check to determine the maximum heat-
rate of this study the on sample thermocouple readings were approximated with three polynomials of 2nd degree,
shown in Figure 32. The curve fittings were made using the method of least square.
Figure 24. Polynomial fitting of 950° C RSW on sample thermocouple see Figure 24.

FFI Fordonsstrategisk Forskning och Innovation | www.vinnova.se/ffi 26
The heating rate above 600° C is the limiting factor during heat treatment and thus the polynomials of interest are
those connected to parts 2 and 3 of the curve in Figure 36. As can be seen the gradient of part 2 exceed that of
part 3, which is why only part 2 will be investigated. The derivative of polynomial 2 will serve as a heat-rate in °
C/s, Eq. 4, and can be calculated for three steps where the temperature is 600, 700 and 800 ° C at x1 = 2086,5s
x2 = 2173,5 x3 = 2288,5s in Eq. 5, 6 and 7:
𝑦 = −0,0026𝑥 + 6,6803 (4)
𝑦1 = −0,0026 ∙ 2086,5 + 6,6803 (5)
𝑦2 = −0,0026 ∙ 2173,5 + 6,6803 (6)
𝑦3 = −0,0026 ∙ 2288,5 + 6,6803 (7)
The resulting heat-rate at the three specific temperatures is thus y1 = 1.2254 ° C/s, y2 = 1.0292 ° C/s and y3 =
0.7302 ° C/s and is well below the maximum heat-rate of 12 ° C/s.
4.2.8 Braze joints
Shear stress measurements
The evaluation of produced braze joints was done by measuring the shear stress required to cause fracture using
two different tensile testers, Instron 5566 and 4505. The samples were clamped using an extra piece of base
material with the same thickness in each clamping-tool to direct the force straight through the joint, see Figure 33.
In the tensile tests, the pulling speed was set to 5 mm/min and used throughout all tests. After fracture had
occurred the area of the joint was measured and combined with the acquired ultimate-force to calculate the shear
strength of the joint see Eq. 8.
𝜏 =𝐹
𝐴
(8)
Figure 25. Shear strength testing of joint.

FFI Fordonsstrategisk Forskning och Innovation | www.vinnova.se/ffi 27
Light Optical Microscopy and Scanning Electron Microscopy
To further evaluate the braze joints and the coating resulting from the various heat treatments used, cross
sections were cut both in and far from the joint, as shown in Figure 34. The samples were then first polished and
then etched for 1 min using 10% NaOH and evaluated using a Light Optical Microscope (LOM), Leica DM IRM.
LOM was used to acquire knowledge about joint geometry, eventual cracks and pores and locations of different
phases.
Samples were also evaluated using a Scanning Electron Microscope (SEM), Leo 1530 Gemini. Again cross
sections were cut both in and far from the joint. Only polishing was done before evaluation, no etching. The SEM
evaluation was done to gather information about the chemical composition of phases identified using LOM, which
could be compared to literature and also to investigate were fracture occurs. This was done using Energy
Dispersive Spectroscopy-analysis (EDS) with line scanning, mapping and point analysis.
4.2.9 Adhesive joints
For the adhesive joints the same evaluation procedure as with braze joints was used. Where the shear stress
required for fracture was measured, also LOM and SEM were used to evaluate the coating after heat treatment.
Lastly SEM was used to evaluate the fracture cross section.
4.2.10 Tensile adhesion
To measure the coating adherence the standard ISO 4624:2002 “Paints and varnishes -- Pull-off test for
adhesion” was adopted. To measure the force needed to either remove the coating from substrate or cause
fracture in the adhesive a manual hydraulic tensile adhesion tester for measuring of bonding strength, PAT model
GM01/6.3kN, was used, as shown in Figure 35. As it was calibrated for dollies with a Ø 20 mm the readings were
adjusted with a factor of 4 to match the Ø 10 mm used in testing.
Figure 26. LOM and SEM cross section preparation.

FFI Fordonsstrategisk Forskning och Innovation | www.vinnova.se/ffi 28
4.2.11 Part III - Brazing zinc-coated sheet steel to zinc-coated sheet steel
The Zn-based coatings offer cathodic corrosion protection, which is desirable for automotive parts, and is typically
applied via hot-dipping or electrolytic deposition. A major drawback however, is that they can only be used in the
indirect hot stamping process. If not cold-drawn before final pressing at austenitization temperature zinc
adsorption at grain boundaries will occur, leading to cracks in the product [10]. In addition to only being suitable
for the indirect process the final products also need to be sand blasted or shot peened in order to remove the Zn-
oxide layer and promote good paintability [9]. However, investigations have been performed on the
implementation of Zn-coatings in the direct hot stamping process [11].
During hot stamping heating rates and temperature exceed those used during normal galvannealing of steels and
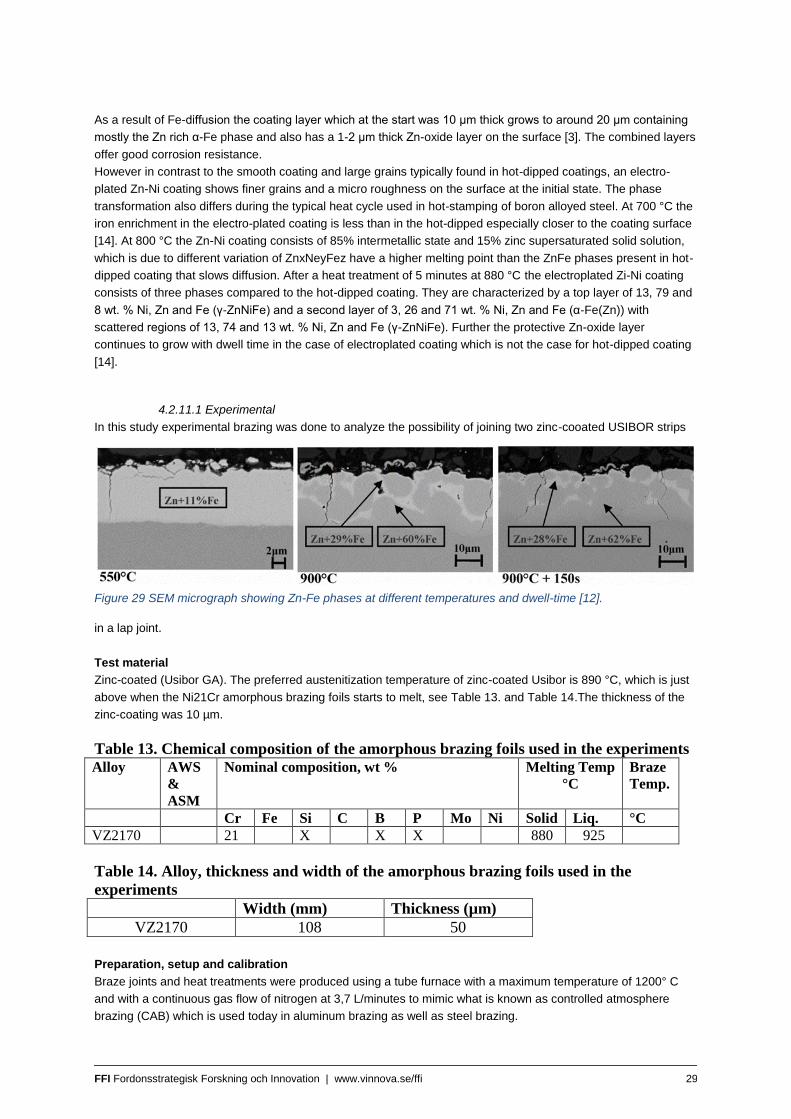
different intermetallic phases of Zn-Fe form by diffusion. Tests conducted by R. Autengruber et al. [12] on hot-
dipped Zn-coated 22MnB5 steels showed that some Zn-Fe phases occurred in a temperature range above their
normal stability zone (Zn-Fe equilibrium phase diagram, Figure 36 during the austenitization process. This was
shown to be due to the increased heating rate prohibiting thermodynamic equilibrium. At elevated temperatures
diffusion is more rapid than at room temperature. At 550 °C the coating contains 11 % Fe while at 900 °C two
phases have formed with 29 % Fe (τ-Zn-Fe) and 60 % Fe (α-Fe), where the amount of zinc-ferrite increases with
dwell-time, Figure 88.
Figure 27. Manual hydraulic tensile adhesion tester, PAT model GM01/6.3kN.
Figure 28 Zn-Fe phase diagram [13].
FFI Fordonsstrategisk Forskning och Innovation | www.vinnova.se/ffi 29
As a result of Fe-diffusion the coating layer which at the start was 10 μm thick grows to around 20 μm containing
mostly the Zn rich α-Fe phase and also has a 1-2 μm thick Zn-oxide layer on the surface [3]. The combined layers
offer good corrosion resistance.
However in contrast to the smooth coating and large grains typically found in hot-dipped coatings, an electro-
plated Zn-Ni coating shows finer grains and a micro roughness on the surface at the initial state. The phase
transformation also differs during the typical heat cycle used in hot-stamping of boron alloyed steel. At 700 °C the
iron enrichment in the electro-plated coating is less than in the hot-dipped especially closer to the coating surface
[14]. At 800 °C the Zn-Ni coating consists of 85% intermetallic state and 15% zinc supersaturated solid solution,
which is due to different variation of ZnxNeyFez have a higher melting point than the ZnFe phases present in hot-
dipped coating that slows diffusion. After a heat treatment of 5 minutes at 880 °C the electroplated Zi-Ni coating
consists of three phases compared to the hot-dipped coating. They are characterized by a top layer of 13, 79 and
8 wt. % Ni, Zn and Fe (γ-ZnNiFe) and a second layer of 3, 26 and 71 wt. % Ni, Zn and Fe (α-Fe(Zn)) with
scattered regions of 13, 74 and 13 wt. % Ni, Zn and Fe (γ-ZnNiFe). Further the protective Zn-oxide layer
continues to grow with dwell time in the case of electroplated coating which is not the case for hot-dipped coating
[14].
4.2.11.1 Experimental
In this study experimental brazing was done to analyze the possibility of joining two zinc-cooated USIBOR strips
in a lap joint.
Test material
Zinc-coated (Usibor GA). The preferred austenitization temperature of zinc-coated Usibor is 890 °C, which is just
above when the Ni21Cr amorphous brazing foils starts to melt, see Table 13. and Table 14.The thickness of the
zinc-coating was 10 µm.
Table 13. Chemical composition of the amorphous brazing foils used in the experiments
Alloy AWS
&
ASM
Nominal composition, wt % Melting Temp
°C
Braze
Temp.
Cr Fe Si C B P Mo Ni Solid Liq. °C
VZ2170 21 X X X 880 925
Table 14. Alloy, thickness and width of the amorphous brazing foils used in the
experiments
Width (mm) Thickness (µm)
VZ2170 108 50
Preparation, setup and calibration
Braze joints and heat treatments were produced using a tube furnace with a maximum temperature of 1200° C
and with a continuous gas flow of nitrogen at 3,7 L/minutes to mimic what is known as controlled atmosphere
brazing (CAB) which is used today in aluminum brazing as well as steel brazing.
Figure 29 SEM micrograph showing Zn-Fe phases at different temperatures and dwell-time [12].

FFI Fordonsstrategisk Forskning och Innovation | www.vinnova.se/ffi 30
Joint preparation and fixturing
Strips of USIBOR were cut into lengths according and burrs were ground down to ensure good fitting between
sheets in the area to be joined. The substrates were then cleaned, first using acetone and then with ethanol.
The setup was placed in a fixture made out of sintered SiO2 and a steel weight of 252 g was placed on the joint
area to apply pressure during brazing see Figure 19. This was then lowered into a furnace boat on top of a fixture
with a thermocouple type-S.
4.3 Press hardening
All tests has been at Gestamp test facility in Luleå, Sweden. Common press hardening method has been used.
4.3.1 Hot forge sintering
Initially two tests were made using the method hot forge sintering. As powder, common shot blasting powder were
used. The powder had the grain average grain size 0.3mm (0.2-0.6)
4.3.1.1 Manufacturing of samples
Since the furnace used didn’t have the ability to run a protective atmosphere the powder was wrapped inside a
stainless steel foil to avoid oxide on the grain surface which would decrease the strength in the joining between
the grains.
Figure 30 Chemical composition of shot blasting powder.
Figure 31. Shot blasting powder average grain size 0.3mm

FFI Fordonsstrategisk Forskning och Innovation | www.vinnova.se/ffi 31
Two different process setups were tested:
Table 15. Process parameters.
4.3.2 Test #1 with sintered core without brazing foil
Two uncoated 0.4mm thick 22MnB5 steel sheets were used as outer sheets and a 1.2mm thick sintered core.
Sintered core specification: grain size 75µm, Fe and 0.3% C, 40% density of solid steel, heat treated
30min@1150°C. No brazing foil used. The main issue is to check the formability of the sintered core to know if it
is possible to hot form.
4.3.2.1 Manufacturing of samples
Hat profiles with a length of 100mm were manufactured
Figure 41 Package in furnace. Figure 40 Powder package
Sample #1 Sample #2
Furnace temperature: 940°C 940°C
Time in furnace: 17min 10min
Pressure: 10MPa 20MPa
Cooling time*: 30s 120s
* The tool used has no external cooling, only the mass of the steel dies
Figure 42 Three layer Figure 43 Packed inside stainless steel foil to avoid oxide.
FFI Fordonsstrategisk Forskning och Innovation | www.vinnova.se/ffi 32
4.3.3 Test #2 with sintered core with brazing foil
Main target is to test how brazing foil works in the presshardening process. Two different brazing foils from
Metglas has been evaluated. As outer sheets both uncoated t=0.4mm and AlSi coated (Usibor) t=0.5mm has
been tested. Core used is a 1.2mm thick sintered core.
Sintered core specification: grain size 75µm, Fe and 0.3% C, 40% density of solid steel, heat treated
30min@1150°C. Brazing foils tested: MBF-60 and MBF-62 with a thickness of 1.5 MIL (0.04mm).
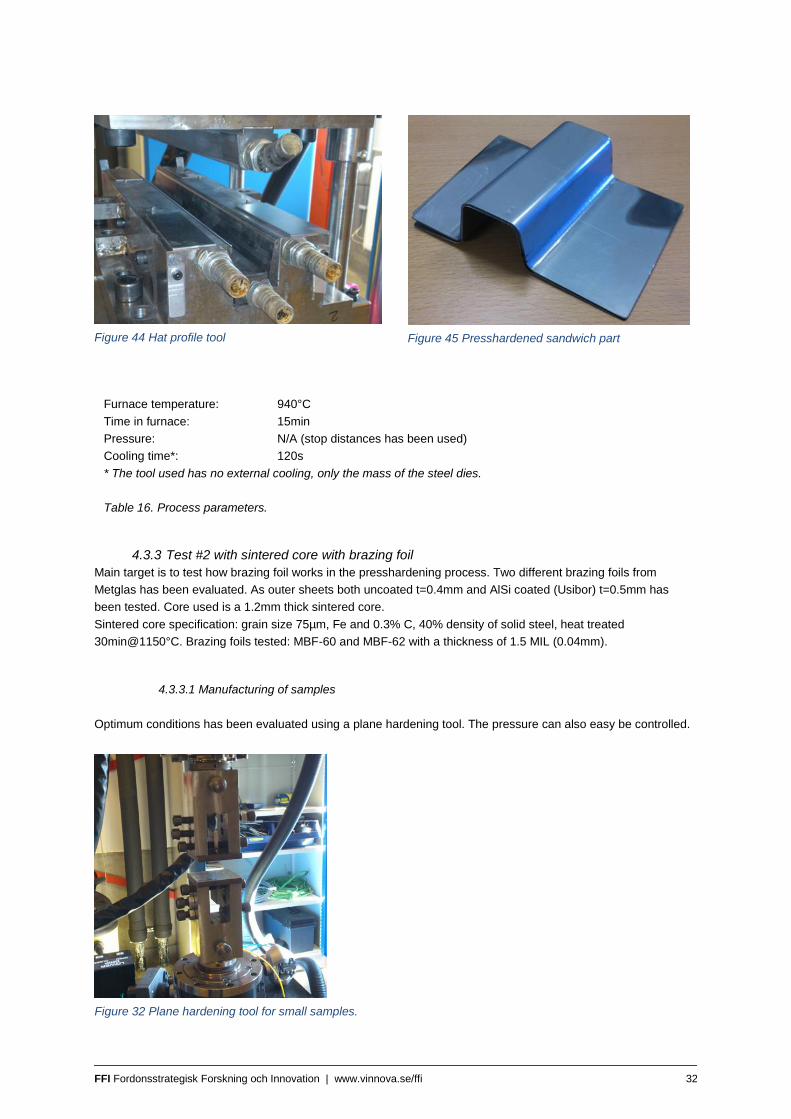
4.3.3.1 Manufacturing of samples
Optimum conditions has been evaluated using a plane hardening tool. The pressure can also easy be controlled.
Figure 44 Hat profile tool Figure 45 Presshardened sandwich part
Figure 32 Plane hardening tool for small samples.
Furnace temperature: 940°C
Time in furnace: 15min
Pressure: N/A (stop distances has been used)
Cooling time*: 120s
* The tool used has no external cooling, only the mass of the steel dies.
Table 16. Process parameters.

FFI Fordonsstrategisk Forskning och Innovation | www.vinnova.se/ffi 33
Table 18. Brazing foils from Metglas. 60 and 62 has been tested.
4.3.4 Test #3 outer sheets with brazing foil without core
The performance of the part will be connected to the strength of bond between the layers made by the brazing
foil. To evaluate the shear strength, solid sheets of uncoated boron steel were plane hardened together with a
brazing foil in between. 0.4mm in thickness is too thin to make shear tests with therefore 1.0mm was used
instead. To prevent the influence of bending a specific setup of the sample were used, as explained in the figure
x. Brazing foil used is MBF-62, 1.5 MIL.
Figure 47Presshardened sample Figure 48 Opened package
Furnace temperature: 940°C
Time in furnace: 10min
Pressure: 10MPa
Cooling time*: 60s
* The tool used has no external cooling, only the mass of the steel dies.
Table 17. Process parameters.
FFI Fordonsstrategisk Forskning och Innovation | www.vinnova.se/ffi 34
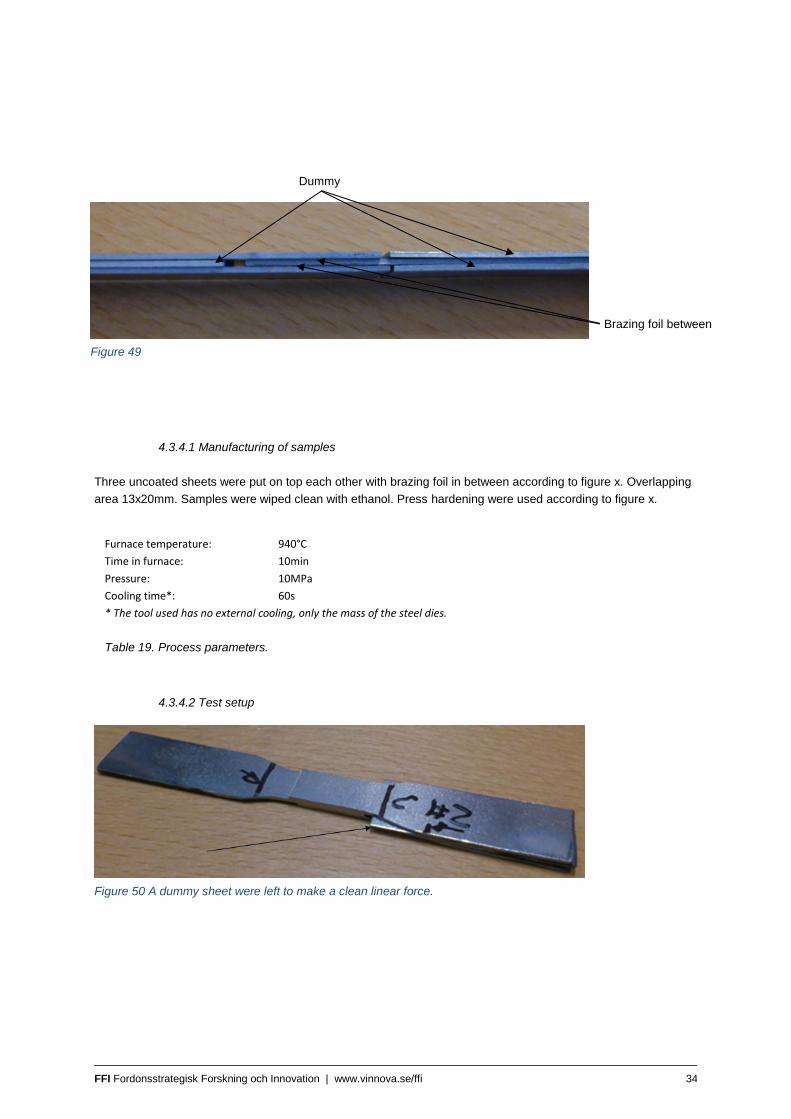
4.3.4.1 Manufacturing of samples
Three uncoated sheets were put on top each other with brazing foil in between according to figure x. Overlapping
area 13x20mm. Samples were wiped clean with ethanol. Press hardening were used according to figure x.
4.3.4.2 Test setup
Figure 50 A dummy sheet were left to make a clean linear force.
Furnace temperature: 940°C
Time in furnace: 10min
Pressure: 10MPa
Cooling time*: 60s
* The tool used has no external cooling, only the mass of the steel dies.
Table 19. Process parameters.
Figure 49
Dummy
Brazing foil between

FFI Fordonsstrategisk Forskning och Innovation | www.vinnova.se/ffi 35
4.3.5 Test #4 Samples for 3-point bending
One way to determine the strength of the material is to make 3-point bending tests. By doing it this way it is
possible to evaluate the bonding to the sintered core.
4.3.5.1 Manufacturing of samples
Same way as in 4.3.3.1
4.3.5.2 Test setup
To do the 3-point bending test the setup on the figure below were used.
Figure 51 Shear test setup
Figure 52. 3-point bending setup, c-c 75mm between supports (free to rotate), load device d=20mm
FFI Fordonsstrategisk Forskning och Innovation | www.vinnova.se/ffi 36
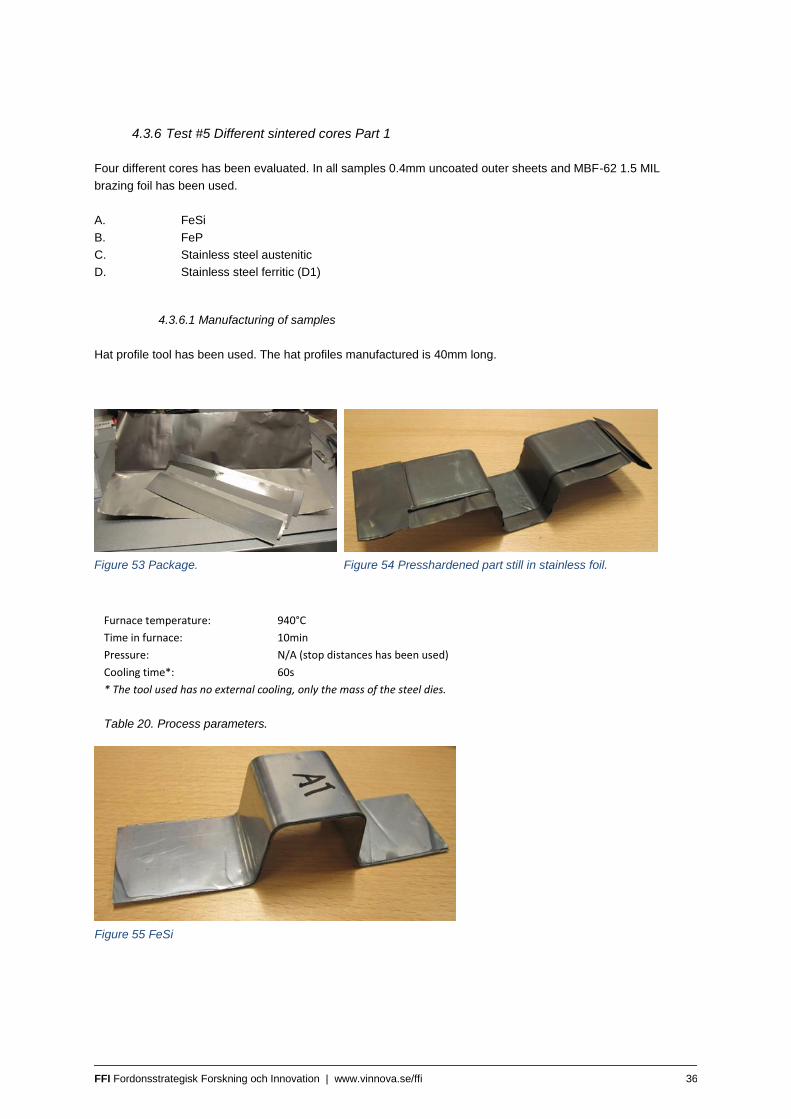
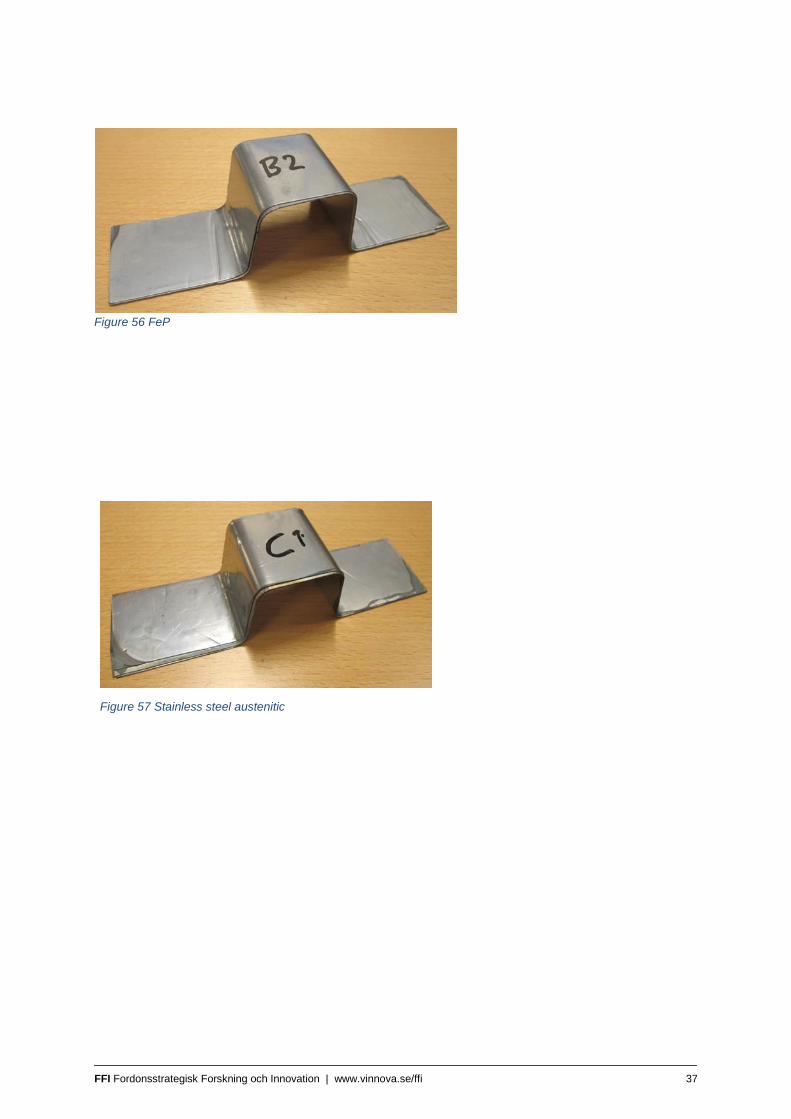
4.3.6 Test #5 Different sintered cores Part 1
Four different cores has been evaluated. In all samples 0.4mm uncoated outer sheets and MBF-62 1.5 MIL
brazing foil has been used.
A. FeSi
B. FeP
C. Stainless steel austenitic
D. Stainless steel ferritic (D1)
4.3.6.1 Manufacturing of samples
Hat profile tool has been used. The hat profiles manufactured is 40mm long.
Furnace temperature: 940°C
Time in furnace: 10min
Pressure: N/A (stop distances has been used)
Cooling time*: 60s
* The tool used has no external cooling, only the mass of the steel dies.
Table 20. Process parameters.
Figure 53 Package. Figure 54 Presshardened part still in stainless foil.
Figure 55 FeSi
FFI Fordonsstrategisk Forskning och Innovation | www.vinnova.se/ffi 37
Figure 56 FeP
Figure 57 Stainless steel austenitic
FFI Fordonsstrategisk Forskning och Innovation | www.vinnova.se/ffi 38
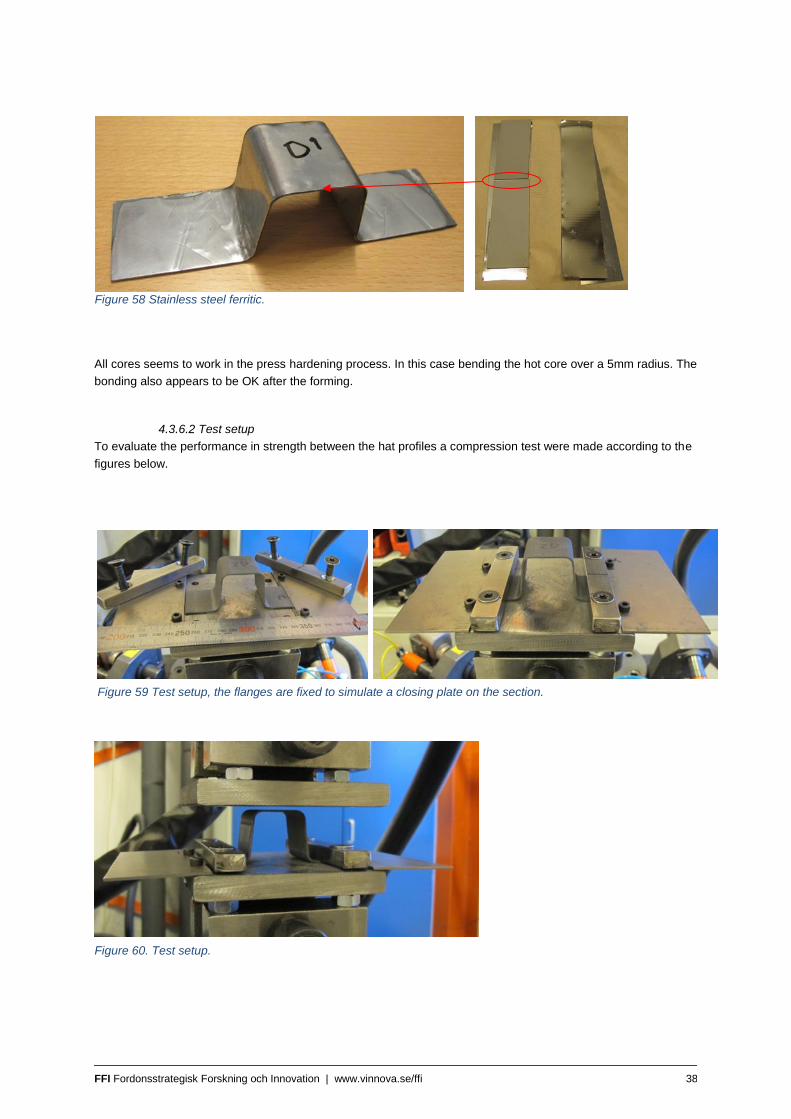
All cores seems to work in the press hardening process. In this case bending the hot core over a 5mm radius. The
bonding also appears to be OK after the forming.
4.3.6.2 Test setup
To evaluate the performance in strength between the hat profiles a compression test were made according to the
figures below.
Figure 58 Stainless steel ferritic.
Figure 59 Test setup, the flanges are fixed to simulate a closing plate on the section.
Figure 60. Test setup.

FFI Fordonsstrategisk Forskning och Innovation | www.vinnova.se/ffi 39
4.3.7 Test #5 Different sintered cores Part 2.
Nine different sandwiches has been evaluated. The sintered core has been joined to either one of the outer
sheets or both outer sheets as specified below.
Both sides of the core sintered to the outer sheets
A. Fe - 2 layers of rolled Fe, -75μm tape in between 2 Gestamp supports, 1 piece 50×200mm. B. Fe2.6%Si +0.4%P. 1 piece 50×200mm. C. Fe2.6%Si +0.4%P with BNi7 brazing paste in between 2 supports/powder in amount 3 gr per each plate,
1 piece 50×200mm. D. Fe2.6%Si +0.4%P+solid Fe Gestamp support with 2 layers. 1 piece 50×200mm.
One side of the core sintered to the outer sheets
E. Fe + solid Fe Gestamp support - 2 pieces 50×200mm. F. Fe + 0.6%P+solid Fe Gestamp support - 2 pieces 50×200mm. G. Fe + 2.6%Si + 0.4%P+solid Fe Gestamp support - 2 pieces 50×200mm. H. Fe + 2.6%Si +0.6%P+solid Fe Gestamp support - 2 pieces 50×200mm. I. Fe + 5%Mo + 0.4%P+solid Fe Gestamp support - 2 pieces 50×200mm.
Outer sheets: 0.6mm uncoated 22MnB5
Brazing foil: Vitrobraze VZ2170
4.3.7.1 Manufacturing of samples
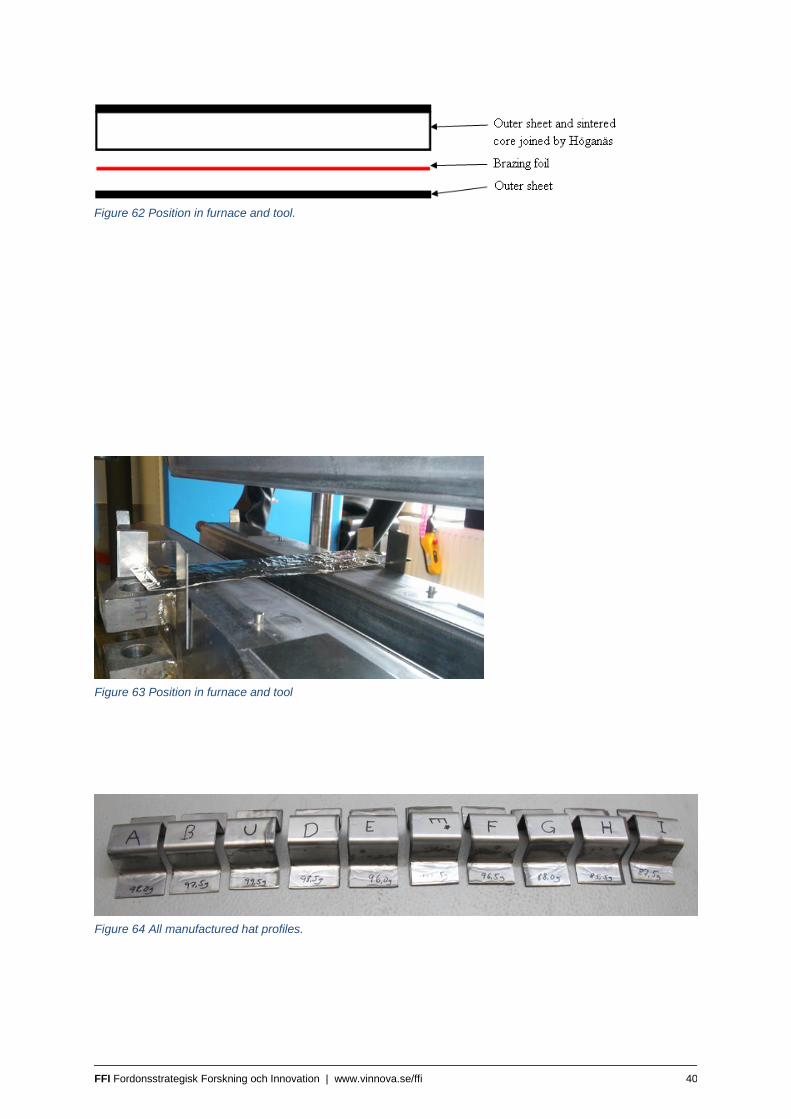
Hat profile tool has been used. The hat profiles manufactured is 50mm long.
The position of the brazing foil has been according to the pictures below both in furnace and press.
Figure 61 Sandwiches wrapped in stainless foil..
Furnace temperature: 940°C
Time in furnace: 10min
Pressure: N/A (stop distances has been used)
Cooling time*: 120s
* The tool used has no external cooling, only the mass of the steel dies.
Table 21. Process parameters.
FFI Fordonsstrategisk Forskning och Innovation | www.vinnova.se/ffi 40
Figure 62 Position in furnace and tool.
Figure 63 Position in furnace and tool
Figure 64 All manufactured hat profiles.
FFI Fordonsstrategisk Forskning och Innovation | www.vinnova.se/ffi 41
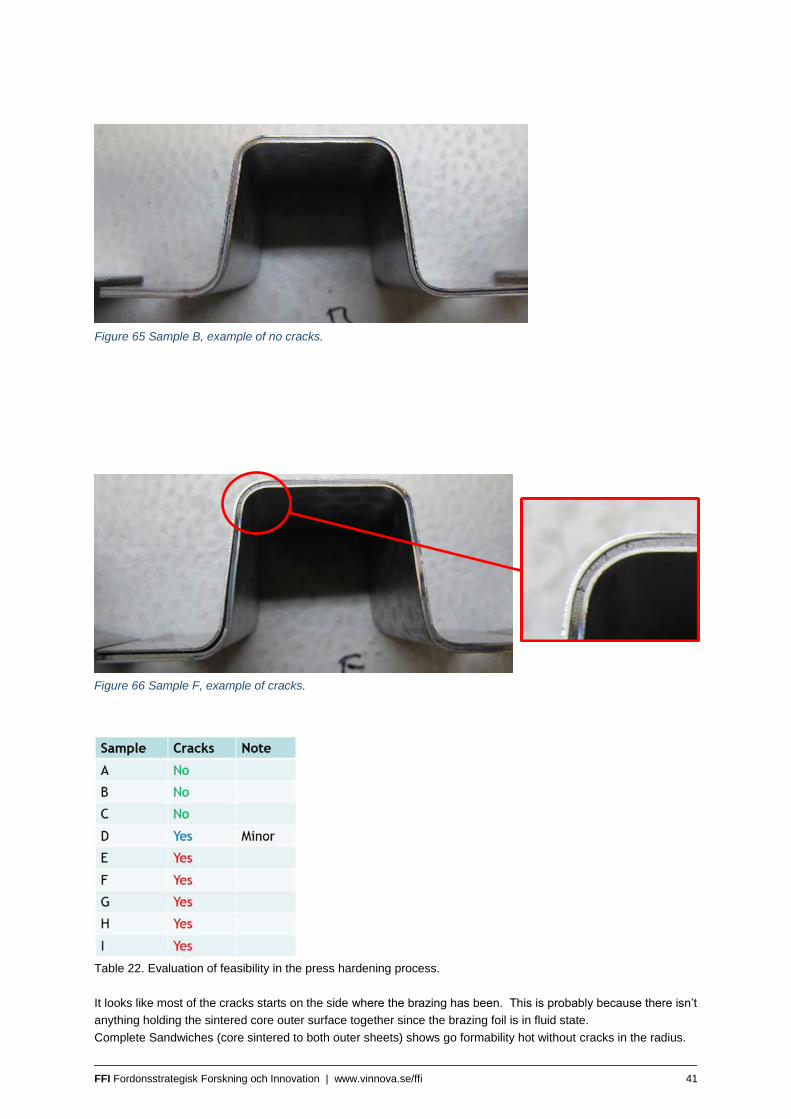
Table 22. Evaluation of feasibility in the press hardening process.
It looks like most of the cracks starts on the side where the brazing has been. This is probably because there isn’t
anything holding the sintered core outer surface together since the brazing foil is in fluid state.
Complete Sandwiches (core sintered to both outer sheets) shows go formability hot without cracks in the radius.
Figure 65 Sample B, example of no cracks.
Figure 66 Sample F, example of cracks.
FFI Fordonsstrategisk Forskning och Innovation | www.vinnova.se/ffi 42
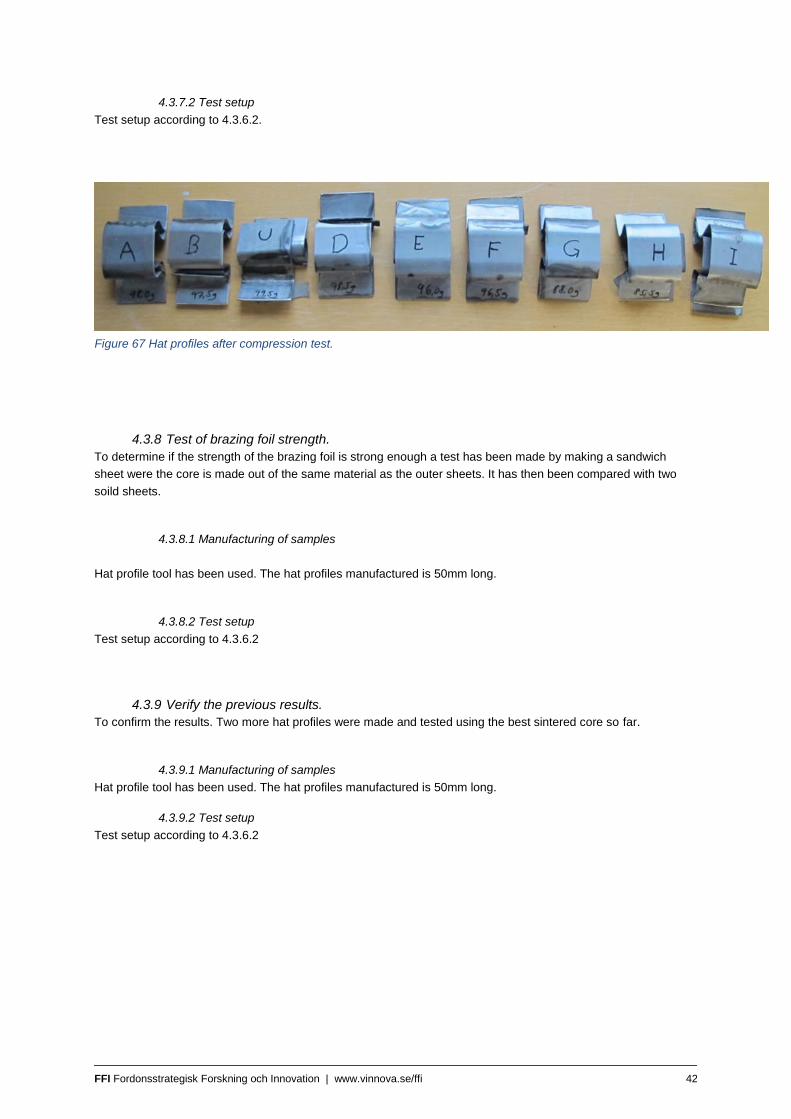
4.3.7.2 Test setup
Test setup according to 4.3.6.2.
4.3.8 Test of brazing foil strength.
To determine if the strength of the brazing foil is strong enough a test has been made by making a sandwich
sheet were the core is made out of the same material as the outer sheets. It has then been compared with two
soild sheets.
4.3.8.1 Manufacturing of samples
Hat profile tool has been used. The hat profiles manufactured is 50mm long.
4.3.8.2 Test setup
Test setup according to 4.3.6.2
4.3.9 Verify the previous results.
To confirm the results. Two more hat profiles were made and tested using the best sintered core so far.
4.3.9.1 Manufacturing of samples
Hat profile tool has been used. The hat profiles manufactured is 50mm long.
4.3.9.2 Test setup
Test setup according to 4.3.6.2
Figure 67 Hat profiles after compression test.

FFI Fordonsstrategisk Forskning och Innovation | www.vinnova.se/ffi 43
4.4 FE simulation
As a part of the research project Modeling and analysis of steel laminates with a core based on a porous steel
material a Ph.D. research project is conducted at Luleå Univeristy of Technology (LTU). The purpose of the Ph.D.
research project is to find a material model suited for modeling and analyzing a steel laminate with a core of
porous medium.
Initially, LTU's part of the project can be divided into two areas. 1) The first area concerns modeling of the porous
material itself, selecting a proper material model which will represent the porous medium in an acceptable manner
during variable loading and deformation. 2) The second area concerns modeling of the interface between the core
and the surrounding face plates, to properly predict delamination between the core and the face plates.
Initially a literature study is conducted, where methods of modeling porous material is investigated by reviewing
previous work done on the subject. The application in the articles indicates if a material model is of interest or not.
After the material model is chosen proper input data must be generated for the model to correctly represent the
porous material. Generation of input data is done through various methods, varying from tabulated data to
implementing constitutive models into a software like MATLAB to generate desired data. Validation of any
constitutive model is necessary, experimental data will be used in this research project (experiment have not been
conducted yet).
4.4.1 Literature study
A literature study has been conducted where a variety of constitutive models, for modeling porous media, have
been considered. Initially, a constitutive model, *MAT_BILKHU/DUBOIS_FOAM (MAT_075) from LS-DYNA's
library, is chosen [L1]. A motivating factor for the selection is few input parameters, reducing the possible
combinations when calibrating the material model, to fit experiments. In the work conducted by Bartl et al. [L2],
the constitutive model is applied, for capturing the behavior of low density foams in a crash box structure. Results
agree with experiments in an acceptable manner.
The constitutive model requires a set of input data, according to [L1], to predict the behavior of a porous material.
A part of the input data set required are two curves: 1) Pressure vs Volumetric strain and 2) Uniaxial stress vs
Volumetric strain. These curves are partly generated using the elasto-plastic stress-strain relationship suggested
by Thanasis et al. [L3] together with data found in [L4], and partly by assumptions and boundary conditions
suggested by the supervisors and the author of this report. These curves will be presented further in the coming
section.
FFI Fordonsstrategisk Forskning och Innovation | www.vinnova.se/ffi 44
4.4.2 Constitutive model and input data
As a starting point the LS-DYNA material model *MAT_BILKHU/DUBOIS_FOAM [L1] was chosen. Motivations for
the choice is its simplicity with respect to input data, requiring tabulated data and two stress-strain curves: 1)
Pressure vs Volumetric strain and 2) Uniaxial stress vs Volumetric strain. The indata curves are created through
the theories presented in by Thanasis et al. [L3].
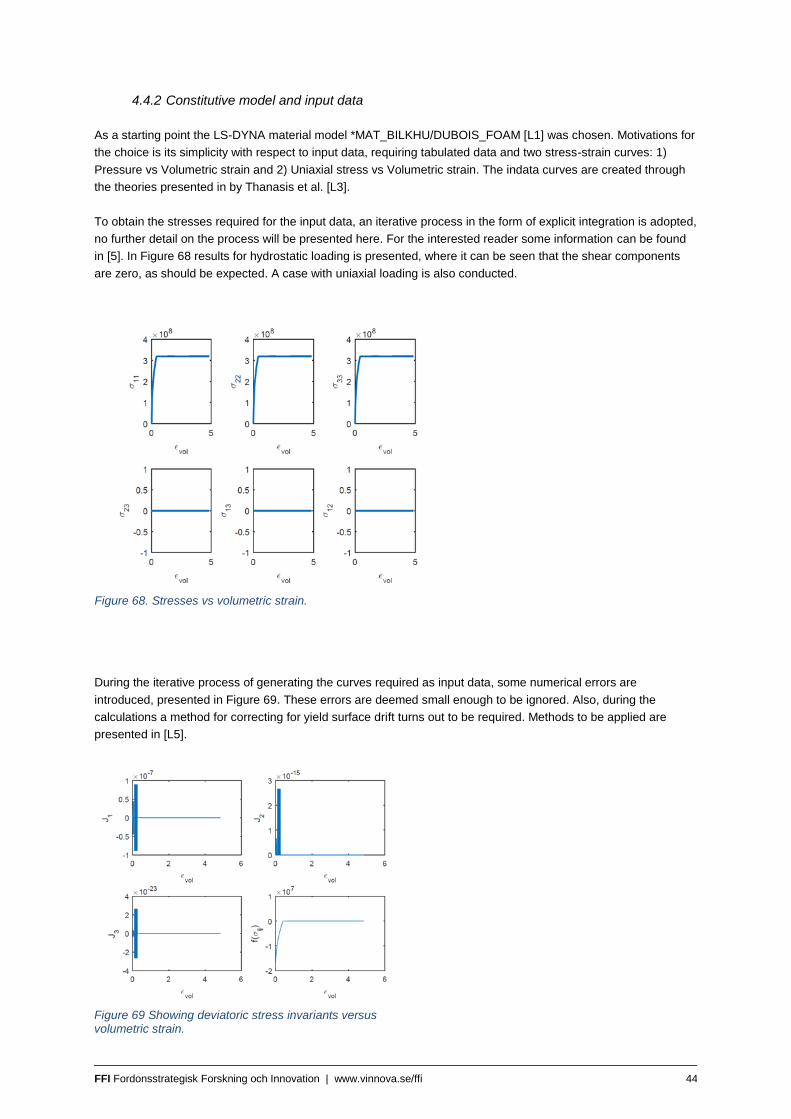
To obtain the stresses required for the input data, an iterative process in the form of explicit integration is adopted,
no further detail on the process will be presented here. For the interested reader some information can be found
in [5]. In Figure 68 results for hydrostatic loading is presented, where it can be seen that the shear components
are zero, as should be expected. A case with uniaxial loading is also conducted.
During the iterative process of generating the curves required as input data, some numerical errors are
introduced, presented in Figure 69. These errors are deemed small enough to be ignored. Also, during the
calculations a method for correcting for yield surface drift turns out to be required. Methods to be applied are
presented in [L5].
Figure 68. Stresses vs volumetric strain.
Figure 69 Showing deviatoric stress invariants versus volumetric strain.
FFI Fordonsstrategisk Forskning och Innovation | www.vinnova.se/ffi 45
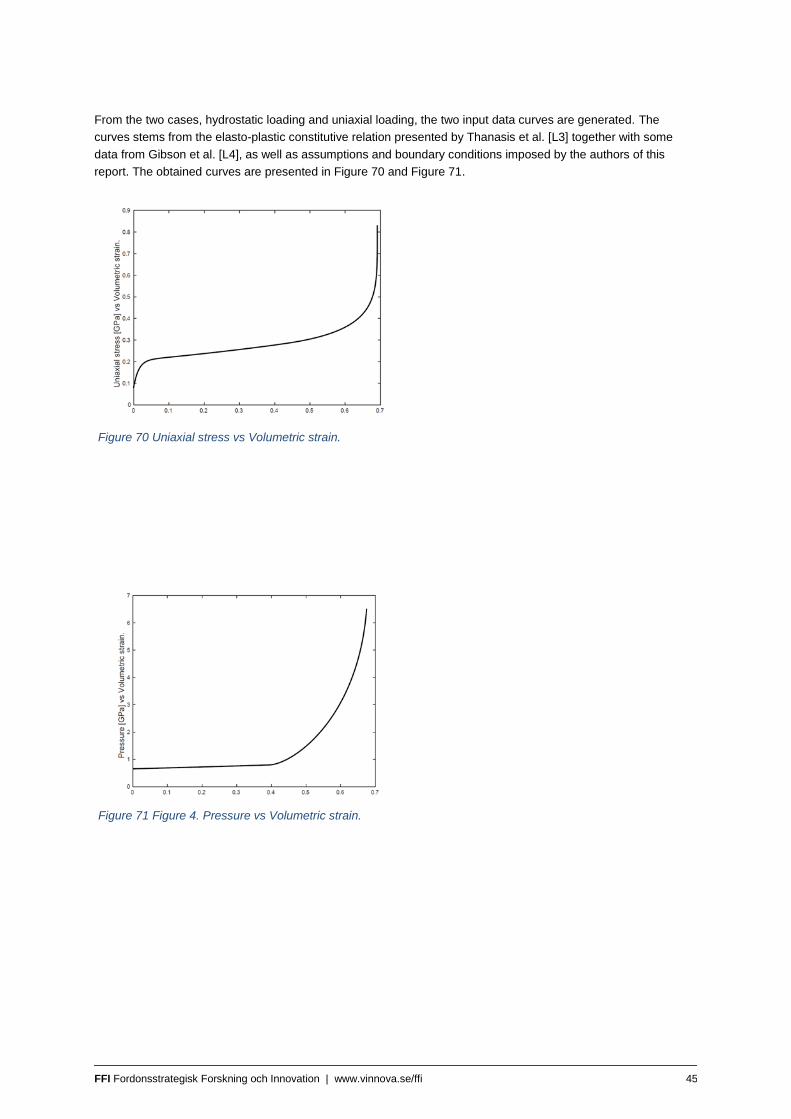
From the two cases, hydrostatic loading and uniaxial loading, the two input data curves are generated. The
curves stems from the elasto-plastic constitutive relation presented by Thanasis et al. [L3] together with some
data from Gibson et al. [L4], as well as assumptions and boundary conditions imposed by the authors of this
report. The obtained curves are presented in Figure 70 and Figure 71.
Figure 71 Figure 4. Pressure vs Volumetric strain.
Figure 70 Uniaxial stress vs Volumetric strain.
FFI Fordonsstrategisk Forskning och Innovation | www.vinnova.se/ffi 46
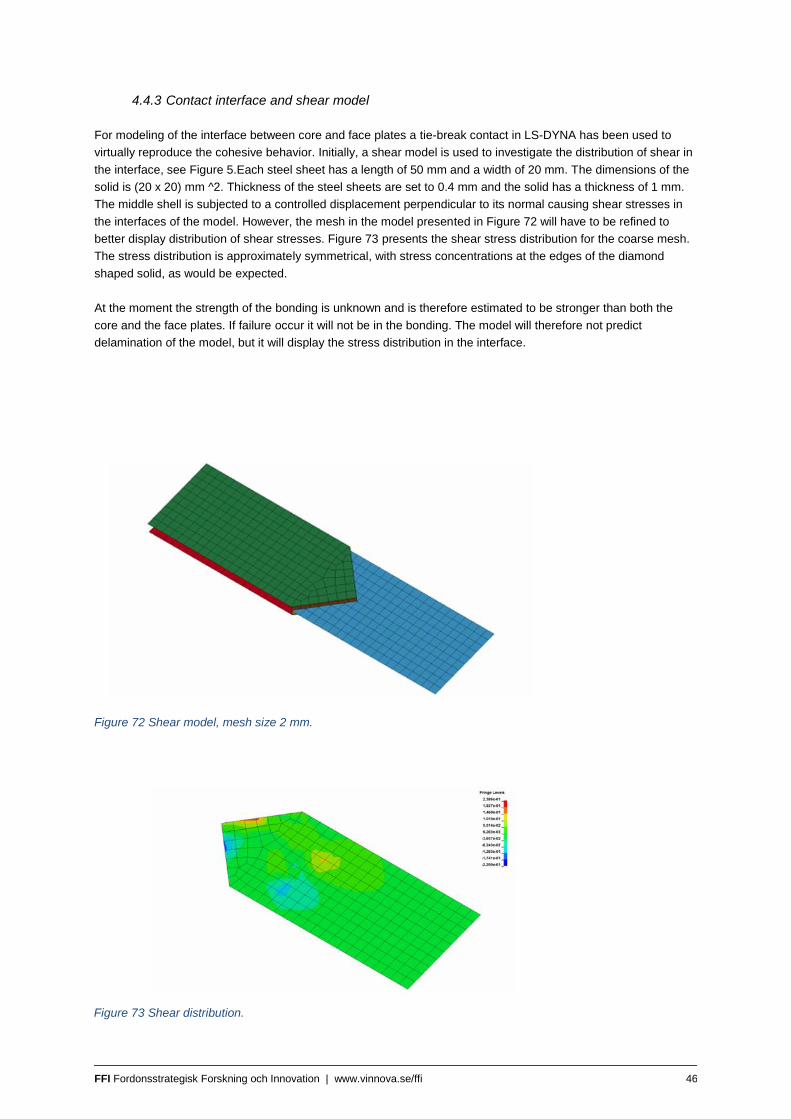
4.4.3 Contact interface and shear model
For modeling of the interface between core and face plates a tie-break contact in LS-DYNA has been used to
virtually reproduce the cohesive behavior. Initially, a shear model is used to investigate the distribution of shear in
the interface, see Figure 5.Each steel sheet has a length of 50 mm and a width of 20 mm. The dimensions of the
solid is (20 x 20) mm ^2. Thickness of the steel sheets are set to 0.4 mm and the solid has a thickness of 1 mm.
The middle shell is subjected to a controlled displacement perpendicular to its normal causing shear stresses in
the interfaces of the model. However, the mesh in the model presented in Figure 72 will have to be refined to
better display distribution of shear stresses. Figure 73 presents the shear stress distribution for the coarse mesh.
The stress distribution is approximately symmetrical, with stress concentrations at the edges of the diamond
shaped solid, as would be expected.
At the moment the strength of the bonding is unknown and is therefore estimated to be stronger than both the
core and the face plates. If failure occur it will not be in the bonding. The model will therefore not predict
delamination of the model, but it will display the stress distribution in the interface.
Figure 72 Shear model, mesh size 2 mm.
Figure 73 Shear distribution.
FFI Fordonsstrategisk Forskning och Innovation | www.vinnova.se/ffi 47
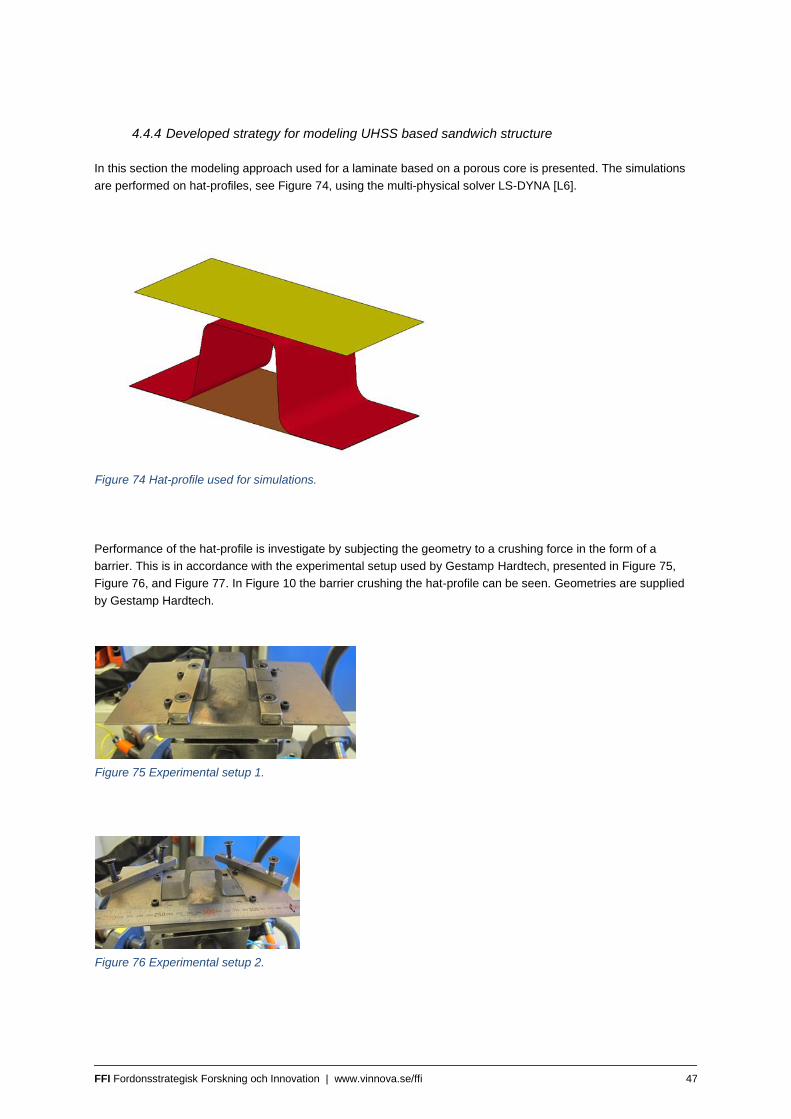
4.4.4 Developed strategy for modeling UHSS based sandwich structure
In this section the modeling approach used for a laminate based on a porous core is presented. The simulations
are performed on hat-profiles, see Figure 74, using the multi-physical solver LS-DYNA [L6].
Performance of the hat-profile is investigate by subjecting the geometry to a crushing force in the form of a
barrier. This is in accordance with the experimental setup used by Gestamp Hardtech, presented in Figure 75,
Figure 76, and Figure 77. In Figure 10 the barrier crushing the hat-profile can be seen. Geometries are supplied
by Gestamp Hardtech.
Figure 74 Hat-profile used for simulations.
Figure 75 Experimental setup 1.
Figure 76 Experimental setup 2.

FFI Fordonsstrategisk Forskning och Innovation | www.vinnova.se/ffi 48
Since performance of a laminate with face plates made of UHSS, and a core of sintered porous steel, is to be
investigated and compared to the performance of a hat-profile solely consisting of UHSS, two different modeling
methods are required. The first modeling method represents the hat-profiles solely consisting of UHSS, where
shell elements with a thickness of 2 millimeters is used, resulting in a total mass of 0.120 kg, this is presented in
Figure 78. The second modeling method represents a laminate, consisting of a core of 1.2 millimeters thick,
enclosed by face plates, each 0.4 millimeters thick. The mass of the laminate with a solid core is 0.120 kg as, as
compared to 0.085 kg with a porous core, having a relative density of 0.5. The width of the hat-profile is presented
in Figure 76. Solid elements, in four layers, are applied to model the core, and shell elements represent the face
plates. This is presented in Figure 79.
Figure 77 Experimental setup 3.
Figure 78 Hat-profile - method with only shell elements.
Figure 79 Hat-profile - method with shell and solid elements.
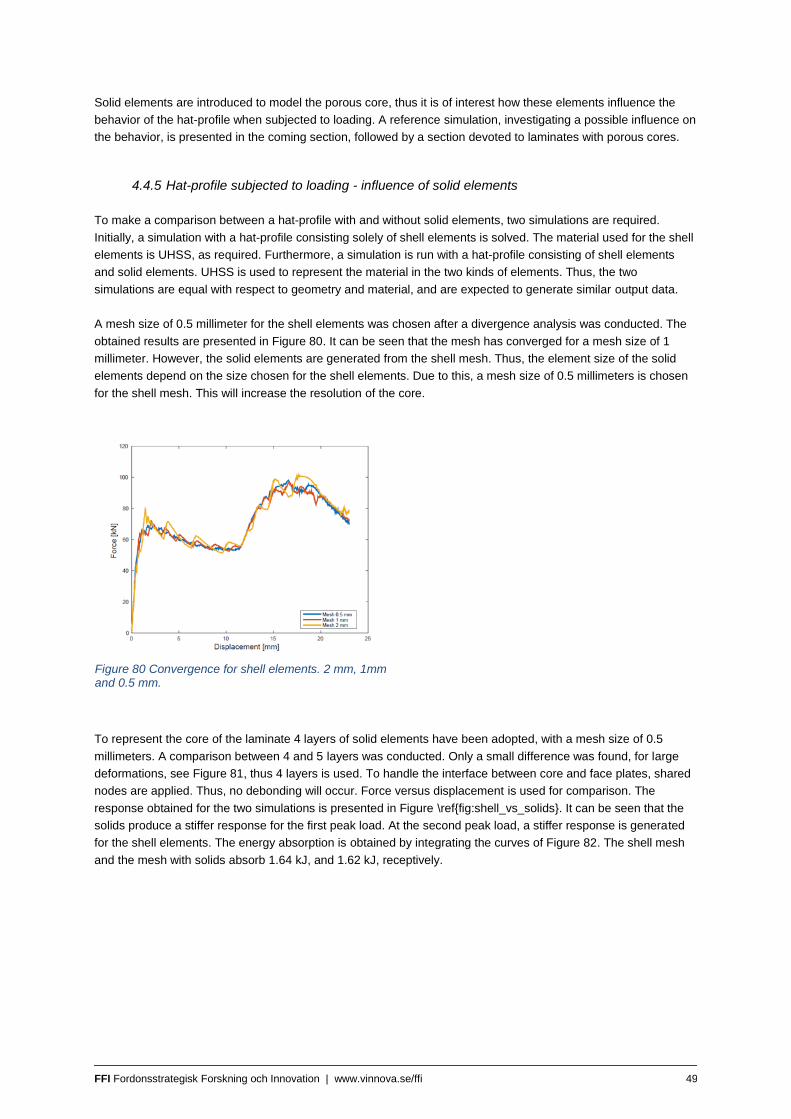
FFI Fordonsstrategisk Forskning och Innovation | www.vinnova.se/ffi 49
Solid elements are introduced to model the porous core, thus it is of interest how these elements influence the
behavior of the hat-profile when subjected to loading. A reference simulation, investigating a possible influence on
the behavior, is presented in the coming section, followed by a section devoted to laminates with porous cores.
4.4.5 Hat-profile subjected to loading - influence of solid elements
To make a comparison between a hat-profile with and without solid elements, two simulations are required.
Initially, a simulation with a hat-profile consisting solely of shell elements is solved. The material used for the shell
elements is UHSS, as required. Furthermore, a simulation is run with a hat-profile consisting of shell elements
and solid elements. UHSS is used to represent the material in the two kinds of elements. Thus, the two
simulations are equal with respect to geometry and material, and are expected to generate similar output data.
A mesh size of 0.5 millimeter for the shell elements was chosen after a divergence analysis was conducted. The
obtained results are presented in Figure 80. It can be seen that the mesh has converged for a mesh size of 1
millimeter. However, the solid elements are generated from the shell mesh. Thus, the element size of the solid
elements depend on the size chosen for the shell elements. Due to this, a mesh size of 0.5 millimeters is chosen
for the shell mesh. This will increase the resolution of the core.
To represent the core of the laminate 4 layers of solid elements have been adopted, with a mesh size of 0.5
millimeters. A comparison between 4 and 5 layers was conducted. Only a small difference was found, for large
deformations, see Figure 81, thus 4 layers is used. To handle the interface between core and face plates, shared
nodes are applied. Thus, no debonding will occur. Force versus displacement is used for comparison. The
response obtained for the two simulations is presented in Figure \ref{fig:shell_vs_solids}. It can be seen that the
solids produce a stiffer response for the first peak load. At the second peak load, a stiffer response is generated
for the shell elements. The energy absorption is obtained by integrating the curves of Figure 82. The shell mesh
and the mesh with solids absorb 1.64 kJ, and 1.62 kJ, receptively.
Figure 80 Convergence for shell elements. 2 mm, 1mm and 0.5 mm.
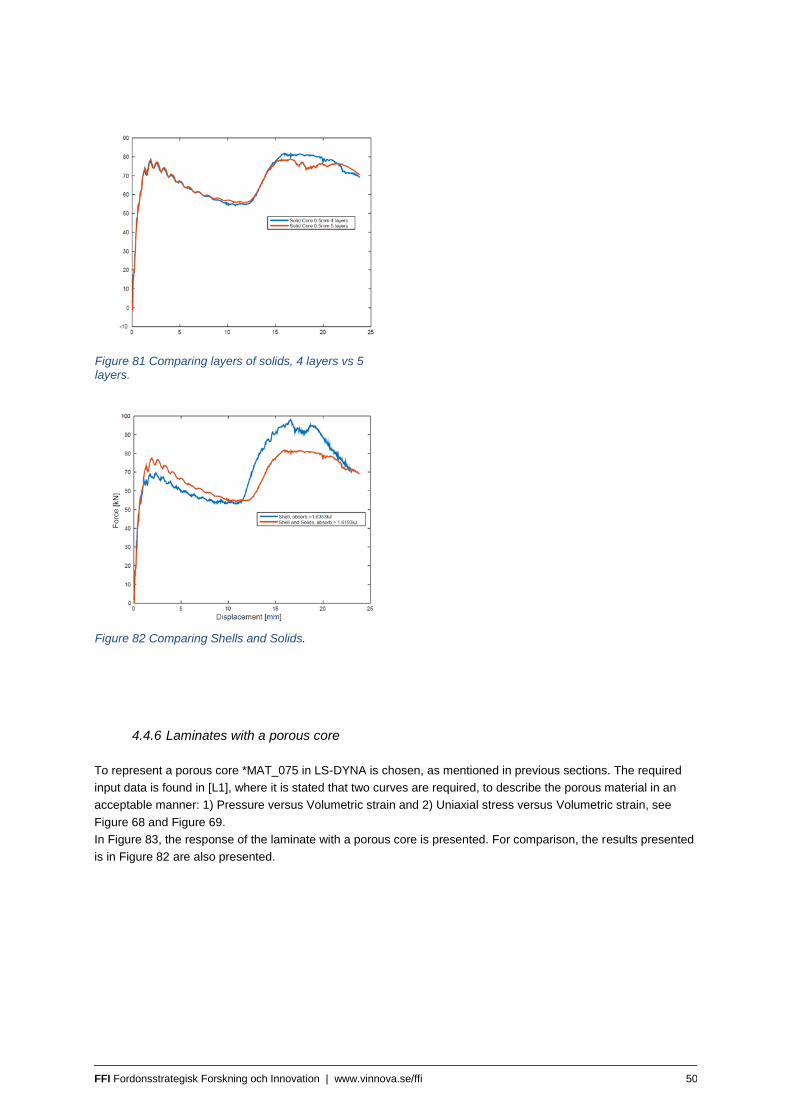
FFI Fordonsstrategisk Forskning och Innovation | www.vinnova.se/ffi 50
4.4.6 Laminates with a porous core
To represent a porous core *MAT_075 in LS-DYNA is chosen, as mentioned in previous sections. The required
input data is found in [L1], where it is stated that two curves are required, to describe the porous material in an
acceptable manner: 1) Pressure versus Volumetric strain and 2) Uniaxial stress versus Volumetric strain, see
Figure 68 and Figure 69.
In Figure 83, the response of the laminate with a porous core is presented. For comparison, the results presented
is in Figure 82 are also presented.
Figure 81 Comparing layers of solids, 4 layers vs 5 layers.
Figure 82 Comparing Shells and Solids.
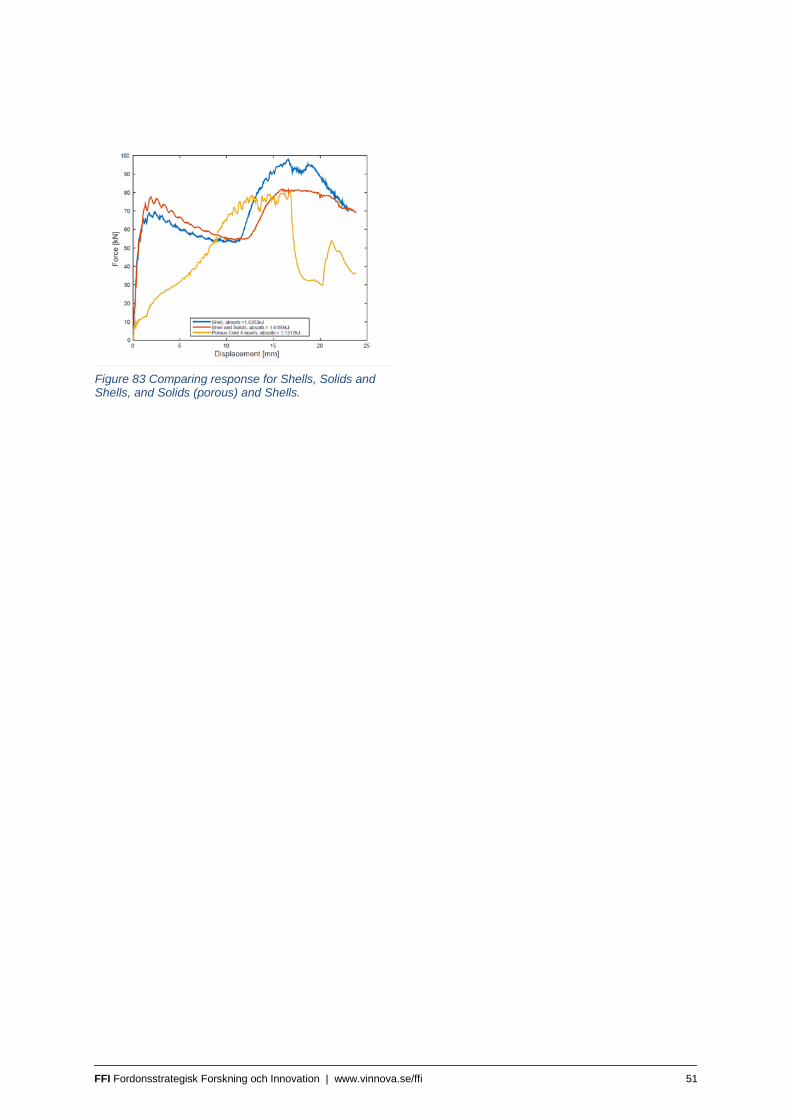
FFI Fordonsstrategisk Forskning och Innovation | www.vinnova.se/ffi 51
Figure 83 Comparing response for Shells, Solids and Shells, and Solids (porous) and Shells.

FFI Fordonsstrategisk Forskning och Innovation | www.vinnova.se/ffi 52
5 Objective
The proposed research is aimed at developing competitive steel solutions for the car body by reducing the density
of the blank material without any major change in the elastic stiffness.
The low density steel blank is a laminate (sandwich) with outer layers of ultra-high strength steel and low density
core created by sintered metal powder in variable thickness.
Finite element (FE) models and testing methods for steel laminates are a necessary condition for efficient product
development. FE methods will be developed in this project to support thermo-mechanical forming and crash
analysis used for product development in the automotive industry. The specific aims with the project can be
summarized in three main targets:
1. Development of powder technology to create a low density core on thin boron steel blank. 2. Develop and optimizing a joining method to create a bounding between the top layer of the laminate and
the low density core in the hot stamping process 3. Develop simulation methodology for forming- and crash analysis of hot stamped steel sandwich.
Point 1,2 has been done although no “large” BIW part has been manufactured due to the low strength of the core and the joint between the outer sheets and the core. Regarding simulation, a methodology for crash has been done but not for forming.

FFI Fordonsstrategisk Forskning och Innovation | www.vinnova.se/ffi 53
6 Result and objective completion
A full investigation on how to make a sandwich blank that can be used in press hardening has been done.
Although in the end the strength turned out to be too low for crash applications. The limits is the core material and
the brazing foil. There is still though a possibility to use this type of sandwich on parts that only are used for
stiffness and works in the elastic zone.
Since the project is divided into four different topics sintering, bounding, press hardening and simulation each
topic will have their own section regarding method will be handled individually and followed by a summery.
6.1 Sintered core
6.1.1 Cast Core
Results from the testing suggested issues with strength. This is likely a result of a combination between low bond
strength between powder particles as well as bonding between the sintered core and steel sheet (with and without
brazing).
6.1.2 Cast + Rolling
Rolling improved all of the aforementioned properties as expected. Densification only affected the surface
properties while leaving a low density region through the center cross-section of the sheet core. The result of this
left the bond strength of the sheet to be superior to the sheet strength therefore splitting the sheet through the low
density region. Only possible improvements to this are further densification to the material and closer to full
density. The concept would then rely on pattern to remove the weight. This would also suggest a new approach to
manufacturing the sheets entirely in order to reach higher density with pattern included.
6.2 Bonding
A large number of different bonding methods were considered, e.g. explosive welding, resistance welding,
brazing/welding with nano-foil and conventional brazing. However, the ultimate bonding process should be
performed in line, and this might be possible with brazing during the austenitization step of the boron sheet steel.
Therefore, the research effort was focused on to develop a brazing process that could be performed during the
austenitization step of the boron sheet steel.
Boron sheet steel for the automotive industry is either aluminized zinc-coated or uncoated and therefore different
brazing methods need to be developed. This project was therefore divided into three parts, Part 1 – Brazing boron
sheet steel to boron sheet steel and Part II - Brazing aluminized sheet steel to aluminized sheet steel, Part III-
Brazing zinc-coated sheet steel to zinc-coated sheet steel.
6.2.1 Part 1 – Brazing boron steel to boron steel
6.2.1.1 Brazing foil MBF 62 compared with Vitrobraze VZ217
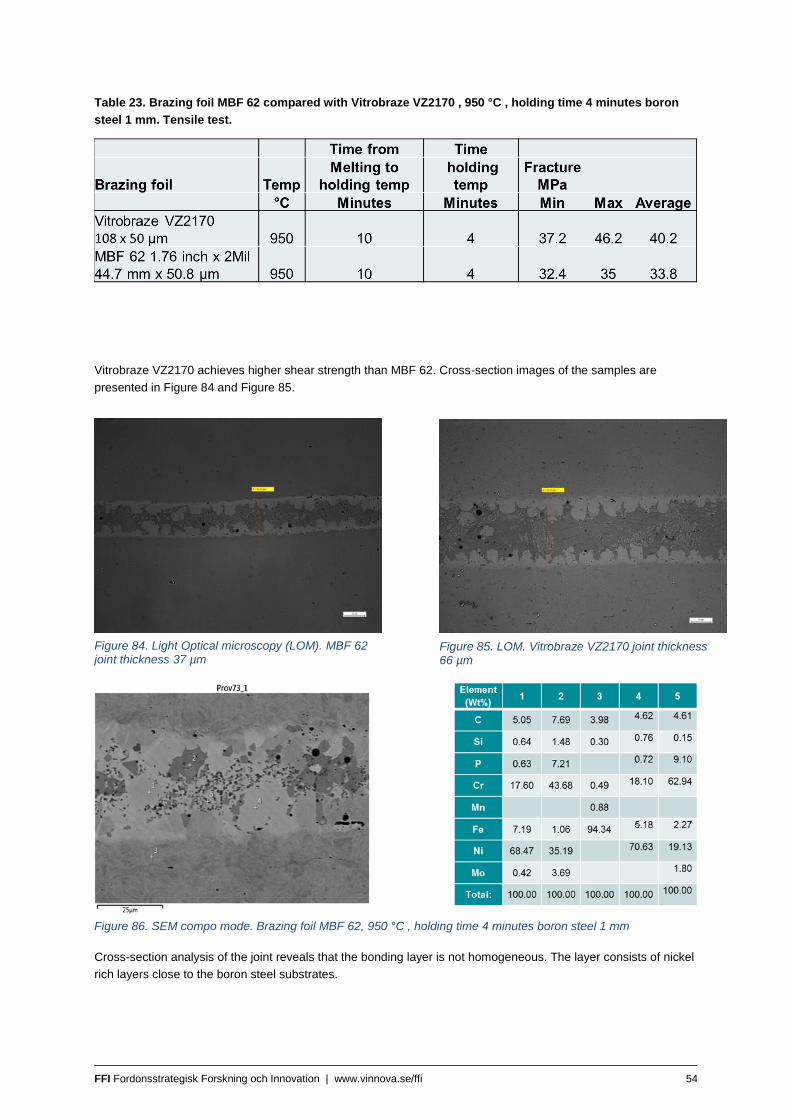
FFI Fordonsstrategisk Forskning och Innovation | www.vinnova.se/ffi 54
Table 23. Brazing foil MBF 62 compared with Vitrobraze VZ2170 , 950 °C , holding time 4 minutes boron
steel 1 mm. Tensile test.
Vitrobraze VZ2170 achieves higher shear strength than MBF 62. Cross-section images of the samples are
presented in Figure 84 and Figure 85.
Cross-section analysis of the joint reveals that the bonding layer is not homogeneous. The layer consists of nickel
rich layers close to the boron steel substrates.
Figure 84. Light Optical microscopy (LOM). MBF 62 joint thickness 37 µm
Figure 85. LOM. Vitrobraze VZ2170 joint thickness 66 µm
Figure 86. SEM compo mode. Brazing foil MBF 62, 950 °C , holding time 4 minutes boron steel 1 mm
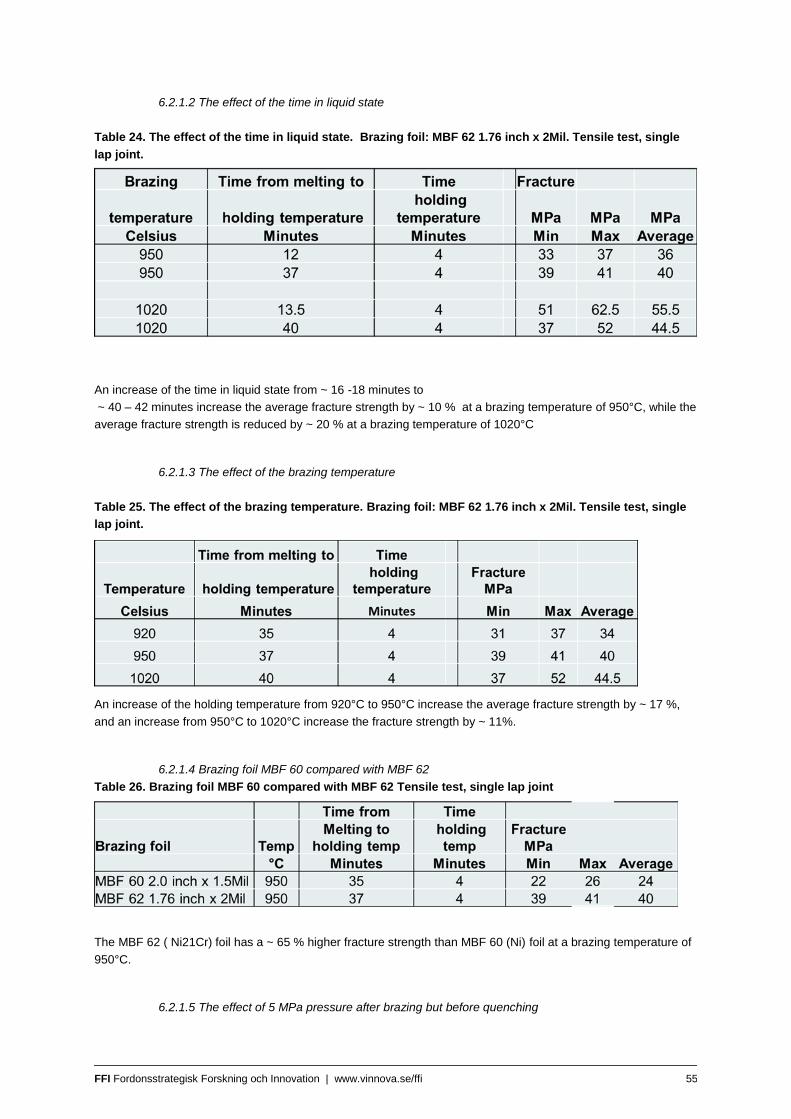
FFI Fordonsstrategisk Forskning och Innovation | www.vinnova.se/ffi 55
6.2.1.2 The effect of the time in liquid state
Table 24. The effect of the time in liquid state. Brazing foil: MBF 62 1.76 inch x 2Mil. Tensile test, single
lap joint.
An increase of the time in liquid state from ~ 16 -18 minutes to
~ 40 – 42 minutes increase the average fracture strength by ~ 10 % at a brazing temperature of 950°C, while the
average fracture strength is reduced by ~ 20 % at a brazing temperature of 1020°C
6.2.1.3 The effect of the brazing temperature
Table 25. The effect of the brazing temperature. Brazing foil: MBF 62 1.76 inch x 2Mil. Tensile test, single
lap joint.
An increase of the holding temperature from 920°C to 950°C increase the average fracture strength by ~ 17 %,
and an increase from 950°C to 1020°C increase the fracture strength by ~ 11%.
6.2.1.4 Brazing foil MBF 60 compared with MBF 62
Table 26. Brazing foil MBF 60 compared with MBF 62 Tensile test, single lap joint
The MBF 62 ( Ni21Cr) foil has a ~ 65 % higher fracture strength than MBF 60 (Ni) foil at a brazing temperature of
950°C.
6.2.1.5 The effect of 5 MPa pressure after brazing but before quenching

FFI Fordonsstrategisk Forskning och Innovation | www.vinnova.se/ffi 56
Table 27. The effect of applying a pressure of 5 MPa after brazing but before quenching in water Tensile
test, single lap joint
The applied pressure did not result in a thing brazing layer and thus the positive effect of applying the pressure
was not seen.
Reasons:
Brazing alloy solidifies before pressure is applied
Too low pressure.
6.2.1.6 The effect of the brazing alloy and foil thickness evaluated by peel test
Table 28. The effect of the brazing alloy and thickness of the foil evaluated by peel test
Brazing alloy
Brazing
temp Holding time Peeling force
C minutes Maximum
Normalized
MBF 60 3 inch x 1 Mil 920 4 0.24
MBF 62 8.5 inch x 1.5 Mil 920 4 0.35
MBF 60 2 inch x 1.5 Mil 920 4 0.40
MBF 62 1.76 inch x 2Mil 920 4 1
The highest shear strength is obtained for MBF 62 at a foil thickness of 2 Mil (50.8 µm), followed by MBF 60 at a
foil thickness of 1.5 Mil (38.1 µm)
6.2.1.7 The effect of brazing holding time evaluated by peel test
Table 29. The effect of brazing holding time evaluated by peel test
Brazing alloy
Brazing
temp Holding time Peeling force
C minutes Maximum
Normalized
MBF 62 1.76 inch x 2Mil 950 4 1
MBF 62 1.76 inch x 2Mil 950 20 1.05
Increased holding time at 950°C from 4 to 20 minutes increased the peeling force with 5%.
6.2.1.8 The effect of core material evaluated by peel test
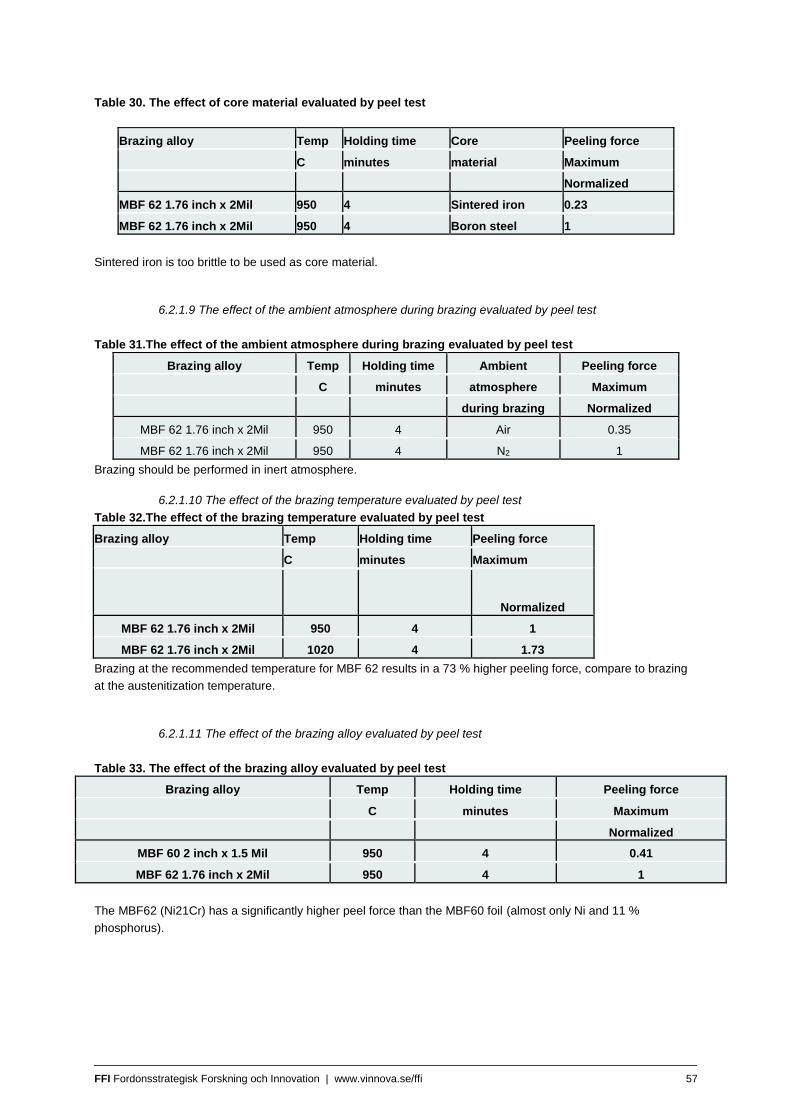
FFI Fordonsstrategisk Forskning och Innovation | www.vinnova.se/ffi 57
Table 30. The effect of core material evaluated by peel test
Brazing alloy Temp Holding time Core Peeling force
C minutes material Maximum
Normalized
MBF 62 1.76 inch x 2Mil 950 4 Sintered iron 0.23
MBF 62 1.76 inch x 2Mil 950 4 Boron steel 1
Sintered iron is too brittle to be used as core material.
6.2.1.9 The effect of the ambient atmosphere during brazing evaluated by peel test
Table 31.The effect of the ambient atmosphere during brazing evaluated by peel test
Brazing alloy Temp Holding time Ambient Peeling force
C minutes atmosphere Maximum
during brazing Normalized
MBF 62 1.76 inch x 2Mil 950 4 Air 0.35
MBF 62 1.76 inch x 2Mil 950 4 N2 1
Brazing should be performed in inert atmosphere.
6.2.1.10 The effect of the brazing temperature evaluated by peel test
Table 32.The effect of the brazing temperature evaluated by peel test
Brazing alloy Temp Holding time Peeling force
C minutes Maximum
Normalized
MBF 62 1.76 inch x 2Mil 950 4 1
MBF 62 1.76 inch x 2Mil 1020 4 1.73
Brazing at the recommended temperature for MBF 62 results in a 73 % higher peeling force, compare to brazing
at the austenitization temperature.
6.2.1.11 The effect of the brazing alloy evaluated by peel test
Table 33. The effect of the brazing alloy evaluated by peel test
Brazing alloy Temp Holding time Peeling force
C minutes Maximum
Normalized
MBF 60 2 inch x 1.5 Mil 950 4 0.41
MBF 62 1.76 inch x 2Mil 950 4 1
The MBF62 (Ni21Cr) has a significantly higher peel force than the MBF60 foil (almost only Ni and 11 %
phosphorus).

FFI Fordonsstrategisk Forskning och Innovation | www.vinnova.se/ffi 58
6.2.1.12 Measured joint thickness
Measured thickness of the joint for the MBF 62 was in the range of 30 µm to 60 µm, while the measured thickness
of the joint for the MBF 60 was 7 µm. The brazing foil thickness was 50.8 µm and 38.1 µm respectively. This
might be due to that the MBF 60 brazing alloy has a wider and lower melting range compared to the MBF 62
alloy. MBF 62 is almost always only ”partially melted” in the performed experiments.
6.2.1.13 Discussions
Brazing of uncoated boron sheet steel was performed with amorphous Ni/Cr brazing foils at a temperature equal
to the austenitization temperature for boron steel. Brazing was conducted in a tube furnace with inert gas flowing
through the furnace during the brazing process without adding flux.
The best result was achieved with a ~50 µm thick Ni/21Cr brazing foil in inert (nitrogen) atmosphere, out of which
Vitrobraze VZ2170 (Ni21Cr), was better than Metglas MBF 62, due to a lower melting temperature of the brazing
foil. The melting temperature was in the range of 880°C to 925°C for VZ2170 and 880°C to 990°C for Metglas
MBF 62. Measured shear strength of single lap joints brazed with Vitrobraze VZ2170 (Ni21Cr) at a brazing
temperature of 950°C and a holding time of 4 minutes was in the range of 36 MPa to 46 MPa.
6.2.2 Part II - Brazing aluminized boron steel to aluminized boron steel
In this section the results from tensile tests are presented.
6.2.2.1 One step brazing above 900°
The material combination for braze attempts using both NiCr-based and AlSi12 foil as filler metal in combination
with Flux 190PF (aluminum-flux) directly at 950° C for 10 minutes did not yield very good results. The sample with
Vitrobraze 2170 (NiCr-foil) did not produce any joint between the substrates as they were separated when
removed from the fixture, no wetting, and although the sample with AlSi12-filler produced a joint it could however
be peeled by hand, and as such no tensile test was performed.
Using the other flux (Atmosin 181PF) with a higher active temperature range provided different results. For the
AlSi12-filler brazed at 900° C for 10 minutes one specimen broke prior to testing, when removed from the fixture
while all three samples using Vitrobraze 2170 at 950° C for 10 minutes could be removed without issues.
However performance was low with shear strength of around avg. 1,1 and 2,0 MPa for the two material
combinations. It was decided that the poor performance of the joints did not validate LOM or SEM analysis.
Figure 87. Avg. shear stress (incl. min and max) using flux with high active temperature range and two different filler material.
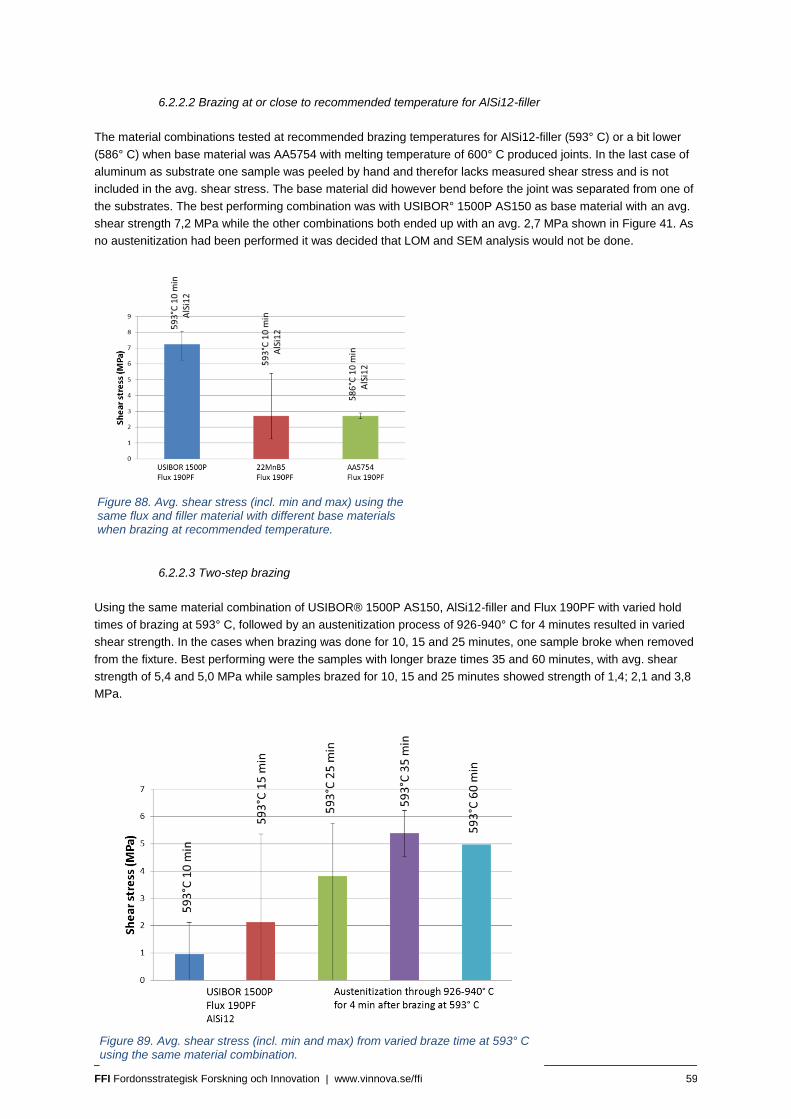
FFI Fordonsstrategisk Forskning och Innovation | www.vinnova.se/ffi 59
6.2.2.2 Brazing at or close to recommended temperature for AlSi12-filler
The material combinations tested at recommended brazing temperatures for AlSi12-filler (593° C) or a bit lower
(586° C) when base material was AA5754 with melting temperature of 600° C produced joints. In the last case of
aluminum as substrate one sample was peeled by hand and therefor lacks measured shear stress and is not
included in the avg. shear stress. The base material did however bend before the joint was separated from one of
the substrates. The best performing combination was with USIBOR° 1500P AS150 as base material with an avg.
shear strength 7,2 MPa while the other combinations both ended up with an avg. 2,7 MPa shown in Figure 41. As
no austenitization had been performed it was decided that LOM and SEM analysis would not be done.
6.2.2.3 Two-step brazing
Using the same material combination of USIBOR® 1500P AS150, AlSi12-filler and Flux 190PF with varied hold
times of brazing at 593° C, followed by an austenitization process of 926-940° C for 4 minutes resulted in varied
shear strength. In the cases when brazing was done for 10, 15 and 25 minutes, one sample broke when removed
from the fixture. Best performing were the samples with longer braze times 35 and 60 minutes, with avg. shear
strength of 5,4 and 5,0 MPa while samples brazed for 10, 15 and 25 minutes showed strength of 1,4; 2,1 and 3,8
MPa.
Figure 88. Avg. shear stress (incl. min and max) using the same flux and filler material with different base materials when brazing at recommended temperature.
Figure 89. Avg. shear stress (incl. min and max) from varied braze time at 593° C using the same material combination.

FFI Fordonsstrategisk Forskning och Innovation | www.vinnova.se/ffi 60
Inspection of the fracture surface shows that the fracture occurs somewhere in the interface between joint and
substrate, i.e. the joint does not break, but delaminates from one of the substrates. The joints that broke when
removed from fixture all show similar failure, which could be due to oxide formation when removed from protective
atmosphere but has yet to be explained.
6.2.2.4 Brazing with reduced aluminum coating thickness
A single test was performed where the aluminum coating thickness partly had been reduced on the samples.
Brazing with amorphous Ni21Cr brazing foils at 950 °C/ 10 minutes resulted in shear strength of 16 MPa, which is
still too low but it indicates that the strength can be improved. it might be possible to braze aluminized boron sheet
steels if the present coating thickness of 25 µm is reduced.
6.2.2.5 Adhesive joint
Joints prepared with adhesive after following a heat treatment of 950° C for 10 minutes instead of brazing that
were tensile tested showed some spread in the performance. With highest shear stress at 22,65 MPa and the
lowest at 10,51 MPa, showing that the heat treatment produces variance in the coating strength of samples, see
Figure 92. All fractures occur at the interface between joint and substrate, i.e. in the AlSi coating of substrate, see
Figure 93 and the fracture surface shows variation within the coating which very well might be different AlFeSi-
phases due to iron diffusion during the heat treatment, see Figure 94.
Figure 90 Fracture surface of joint brazed for 35 minutes at 593° C then heated through 926-940° C for 4 minutes.
Figure 92 Avg. shear stress (incl. min and max) for adhesive joints prepared on USIBOR® 1500P AS150 substrates heat treated at 950° C for 10 minutes.
Figure 91. Typical joint breakage when removed from fixture.

FFI Fordonsstrategisk Forskning och Innovation | www.vinnova.se/ffi 61
6.2.2.6 Tensile adhesion testing
The tensile adhesion tests that were performed provided scattered results with a lot of variance between different
heat treatments and cool down procedure. The adherence appears to have increased for two –step heat
treatments (varied hold time at 593° C followed by heating through 926-940° C for 4 minutes) when they are
pressed between copper blocks to increase cool-down rate. For samples heated directly to 950° C it seems as if
the opposite is instead occurring where the air cooled samples show best results. Previous tests with uncoated
samples using the same adhesive and following the outlined steps in 1.5 showed results were fracture would
occur in the adhesive when tensile stresses of above 40 MPa could be measured. Knowing the strength of the
adhesive and looking at the fracture surface of tests, which was the same for all tests, it is shown that fracture
occurs in the AlSi coating of samples, see Figure 96.
Figure 93 Fracture surface of adhesive joints. Figure 94 Variation which could be different AlFeSi-phases in the coating on the fracture surface.
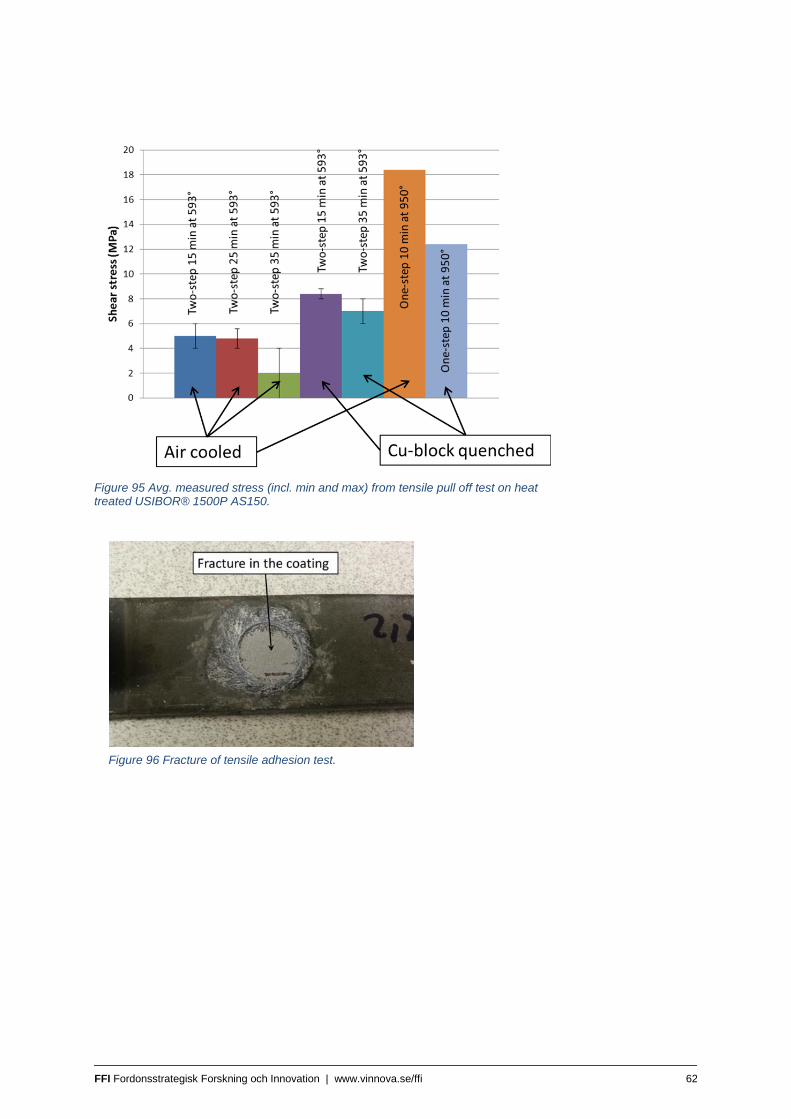
FFI Fordonsstrategisk Forskning och Innovation | www.vinnova.se/ffi 62
Figure 95 Avg. measured stress (incl. min and max) from tensile pull off test on heat treated USIBOR® 1500P AS150.
Figure 96 Fracture of tensile adhesion test.

FFI Fordonsstrategisk Forskning och Innovation | www.vinnova.se/ffi 63
6.2.2.7 LOM analysis
In this section the images and results from Light Optical Microscopy (LOM) investigations are presented which
were done on coating of samples heat treated for 10 minutes at 950° C and on both coating and joint prior and
after austenitization of two-step brazing for 15, 25 and 25 minutes.
Coatings
As the two-step brazing with AlSi12-filler included austenitization and produced the best result, LOM analysis was
done on cross sections of samples from two-step brazing for 15, 25 and 35 minutes both for the joint and also for
the coating far away from the joint. For comparison a coating cross-section of two-step brazing for 35 minutes
prior to the second heat treatment step (austenitization) was also prepared. In Figure 97 and Figure 98 the
coating of 35 minutes two-step brazing prior and after austenitization can be seen. At the interface between
substrate and coating a visible change has occurred and a band like layer has appeared, also at the top of the
coating there seems as if a more homogenous phase has taken form.
The coatings that have been brazed for 15, 25 and 35 minutes at 593° C and then austenized for 4 minutes show
the same band like layer at the interface between substrate and coating (Figure 98, Figure 99 and Figure 100).
However there seems to be a difference in the homogeneity at the top of the coating, where samples brazed for
25 and 35 minutes look more similar than those only brazed for 15 minutes.
Figure 97 Coating of two-step brazing for 35 minutes prior to austenitization.
Figure 98. Coating of two-step brazing for 35 minutes after austenitization.
Figure 99 Coating of two-step brazing for 15 minutes after austenitization.
Figure 100 Coating of two-step brazing for 25 minutes after austenitization.
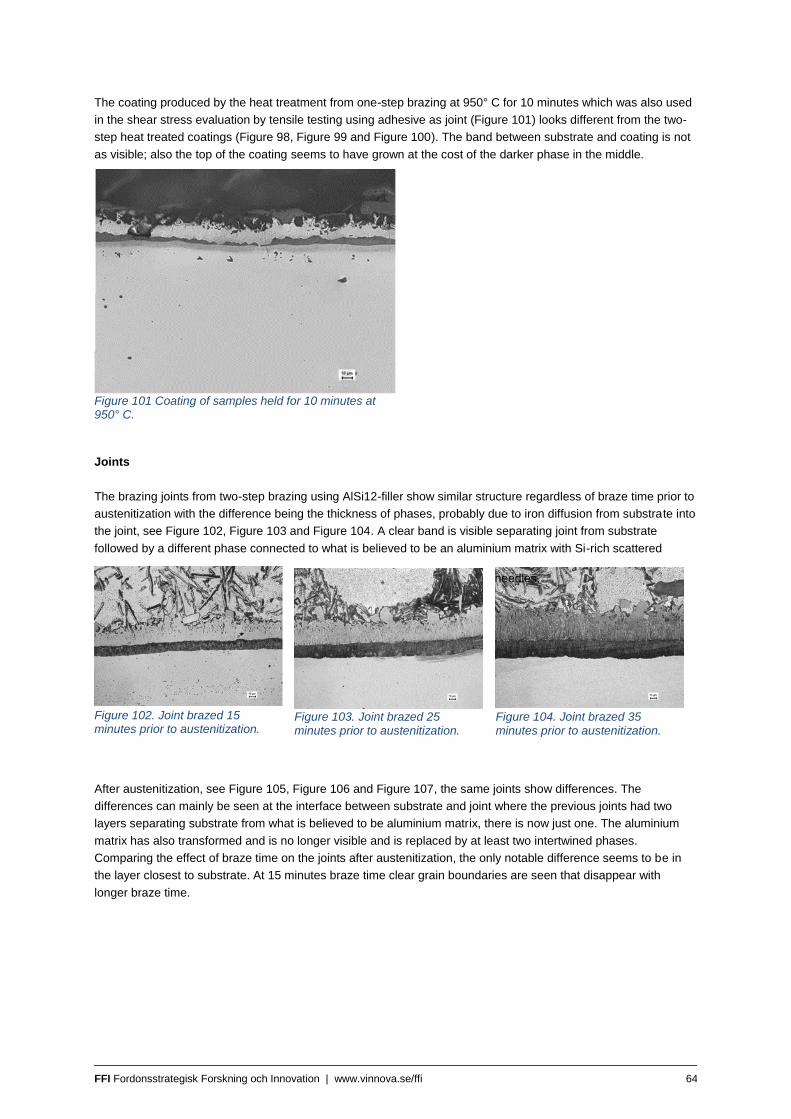
FFI Fordonsstrategisk Forskning och Innovation | www.vinnova.se/ffi 64
Figure 104. Joint brazed 35 minutes prior to austenitization.
The coating produced by the heat treatment from one-step brazing at 950° C for 10 minutes which was also used
in the shear stress evaluation by tensile testing using adhesive as joint (Figure 101) looks different from the two-
step heat treated coatings (Figure 98, Figure 99 and Figure 100). The band between substrate and coating is not
as visible; also the top of the coating seems to have grown at the cost of the darker phase in the middle.
Joints
The brazing joints from two-step brazing using AlSi12-filler show similar structure regardless of braze time prior to
austenitization with the difference being the thickness of phases, probably due to iron diffusion from substrate into
the joint, see Figure 102, Figure 103 and Figure 104. A clear band is visible separating joint from substrate
followed by a different phase connected to what is believed to be an aluminium matrix with Si-rich scattered
needles.
After austenitization, see Figure 105, Figure 106 and Figure 107, the same joints show differences. The
differences can mainly be seen at the interface between substrate and joint where the previous joints had two
layers separating substrate from what is believed to be aluminium matrix, there is now just one. The aluminium
matrix has also transformed and is no longer visible and is replaced by at least two intertwined phases.
Comparing the effect of braze time on the joints after austenitization, the only notable difference seems to be in
the layer closest to substrate. At 15 minutes braze time clear grain boundaries are seen that disappear with
longer braze time.
Figure 101 Coating of samples held for 10 minutes at 950° C.
Figure 102. Joint brazed 15 minutes prior to austenitization.
Figure 103. Joint brazed 25 minutes prior to austenitization.

FFI Fordonsstrategisk Forskning och Innovation | www.vinnova.se/ffi 65
Regarding joint thickness there is no clear correlation between braze time and subsequent austenitization as the
shortest braze time without austenitization had the largest thickness of around 289 μm which after austenitization
was reduced by almost a third. In the case of 25 and 35 minutes braze times the behavior was opposite; with an
increased thickness after being heated above 920° C. The thickness grew from around 214,5 to 273 μm.
Prior to austenitization prolonged braze times above 15 minutes show an increase in pores and cracks illustrated
in Figure 108, Figure 110 and Figure 112. However, after being heat treated at temperatures above 920° C the
opposite is visible where all joints have cracks and pores see Figure 109, Figure 111 and Figure 113; but joints
brazed for 35 minutes have the most joints formed in between cracks.
Figure 105 Joint brazed 15 minutes after austenitization.
Figure 106 Joint brazed 15 minutes after austenitization.
Figure 107 Joint brazed 15 minutes after austenitization.
Figure 108 Joint brazed 15 minutes prior to austenitization.
Figure 109 Joint brazed 15 minutes after austenitization.
Figure 110 Joint brazed 25 minutes prior to austenitization.
Figure 111 Joint brazed 25 minutes after austenitization.
Figure 112 Joint brazed 35 minutes prior to austenitization.
Figure 113 Joint brazed 35 minutes after austenitization.
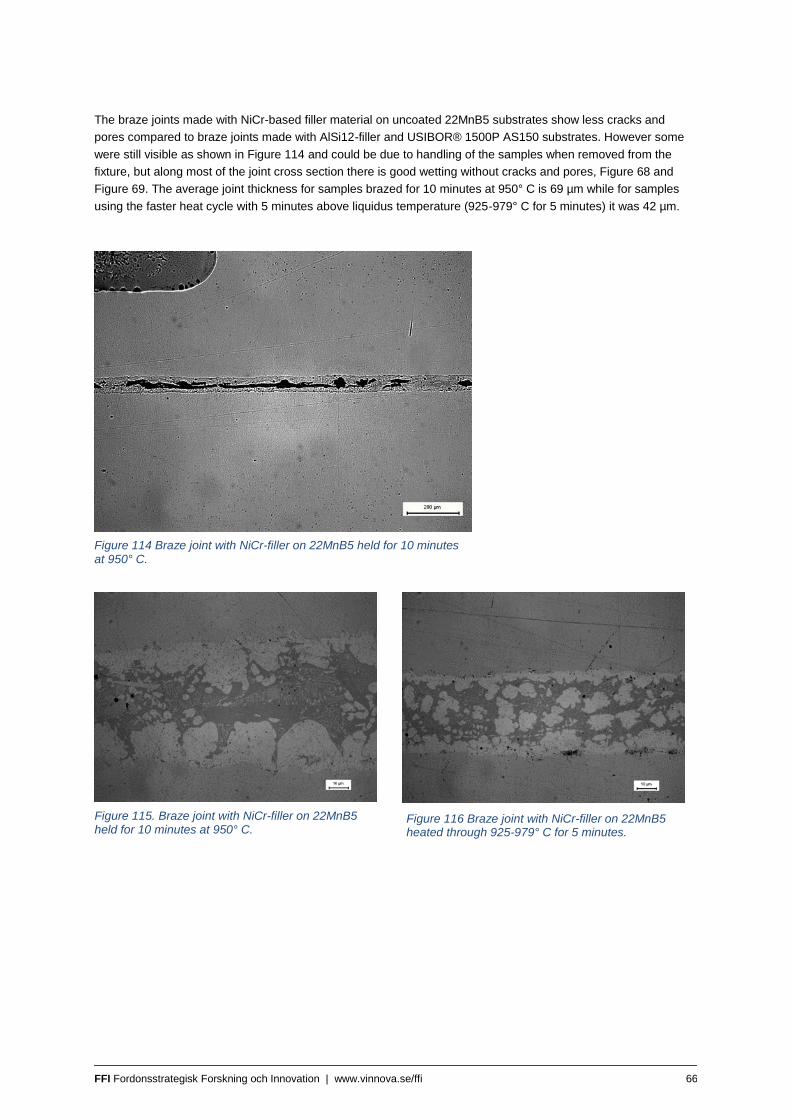
FFI Fordonsstrategisk Forskning och Innovation | www.vinnova.se/ffi 66
The braze joints made with NiCr-based filler material on uncoated 22MnB5 substrates show less cracks and
pores compared to braze joints made with AlSi12-filler and USIBOR® 1500P AS150 substrates. However some
were still visible as shown in Figure 114 and could be due to handling of the samples when removed from the
fixture, but along most of the joint cross section there is good wetting without cracks and pores, Figure 68 and
Figure 69. The average joint thickness for samples brazed for 10 minutes at 950° C is 69 µm while for samples
using the faster heat cycle with 5 minutes above liquidus temperature (925-979° C for 5 minutes) it was 42 µm.
Figure 114 Braze joint with NiCr-filler on 22MnB5 held for 10 minutes at 950° C.
Figure 115. Braze joint with NiCr-filler on 22MnB5 held for 10 minutes at 950° C.
Figure 116 Braze joint with NiCr-filler on 22MnB5 heated through 925-979° C for 5 minutes.

FFI Fordonsstrategisk Forskning och Innovation | www.vinnova.se/ffi 67
6.2.2.8 SEM analysis
In this sections results from SEM analysis will be presented with images and chemical composition of different
phases found. Samples investigated are: coating used for adhesive shear testing, coating from as received
conventional press hardening, coating from best braze-attempts, joints of best braze attempts both prior and after
austenitization and fracture of both best braze joints as well as adhesive shear test.
Coatings
By using EDS-analysis at different points of an electron image or by doing a line-scan one can get a grasp about
which elements are present and compare the coatings resulting from different heat treatments. However, as an
EDS-analysis is not very accurate compared to EBSD crystallographic analysis or X-ray diffraction analysis the
atomic percent acquired by EDS is compared with known phases from literature that one can expect to find in
AlSi-coating of USIBOR® 1500P AS150 after heat treatments above 900° C [16].
The samples heat treated at 950° C for 10 minutes that were used in one step brazing showed a composition of
three phases, where the top most layer was identified as the AlFe phase with a chemical composition of Al 47,5;
Fe 46,0 and Si 6,5 (at.%). Below the top layer a thinner layer could be identified as having a composition of Al
63,70; Fe 35,0 and Si 1,2 (at.%) which is close to that of Al5Fe2. Followed again by the AlFe phase but with less
thickness compared to the top layer (6 µm compared to 8 µm). This is followed by a continuous decrease of Al-
and increase of Fe-content which would typically be Al-rich α-Fe with Al 22,6; Fe 71,7 and Si 5,7 (at.%). This layer
stretches for 28 µm until it reaches the base material, and the total coating thickness after the heat cycle is 45 µm.
A SEM image of the coating with location of phases is shown in Figure 117 and EDS-result along the coating
depth is shown in Appendix II.
Figure 117 SEM image of AlSi-coating held at 950° C for 10 minutes.

FFI Fordonsstrategisk Forskning och Innovation | www.vinnova.se/ffi 68
The coating as a result of two-step brazing where samples where held at 593° C for 35 minutes and then heated
through 926-940° C for 4 minutes produced a coating with three distinct phases. The top most layer has a
composition of Al 43,9; Fe 46,5 and Si 9,6 (at.%) and is close to that of the phase AlFe with a thickness of 9 µm.
This is followed by a phase which could be Al5Fe2 with a composition of Al 64,9; Fe 34,0 and Si 1,1 (at.%) and
has a thickness of 11 µm. Next the AlFe phase is present again but with a lower Si-content and less thickness of
3 µm. From here to the base material (17 µm) Fe-content increases at the cost of Al-content and Al-rich α-Fe
composition was identified with Al 22,2; Fe 73,5 and Si 4,3. The total coating thickness is 42 µm. In Figure 118 a
SEM image of the coating is shown along with the location of the three phases, also EDS-result along the coating
depth can be seen in Appendix II.
As reference AlSi-coating of conventionally press hardened USIBOR® 1500P AS150 was also investigated using
SEM with EDS-analysis in order to compare the result of heat cycles used in brazing attempts against what would
be a more typical phase composition from the hot stamping process. The top layer has a composition of Al 67,8;
Fe 27,9 and Si 4,3 (at.%) which is close to that of Al5Fe2 and is 8 µm thick followed by a 4 µm thick layer that
probably is of the phase AlFe with composition Al 45,7; Fe 40,8 and Si 13,5 (at.%). Next another layer of Al5Fe2
was identified which is 13 µm thick before a zone, 5 µm, of Al-rich α-Fe with composition Al 15,6; Fe 78,3 and Si
6,2 (at.%) is encountered. This gives a total coating thickness of 30 µm. Phases and locations are shown Figure
72 and an EDS-Line scan containing composition along coating depth can be seen in Appendix II.
Figure 118. SEM image of AlSi-coating first held at 593° C for 35 minutes then heated through 926-940° C for 4 minutes.
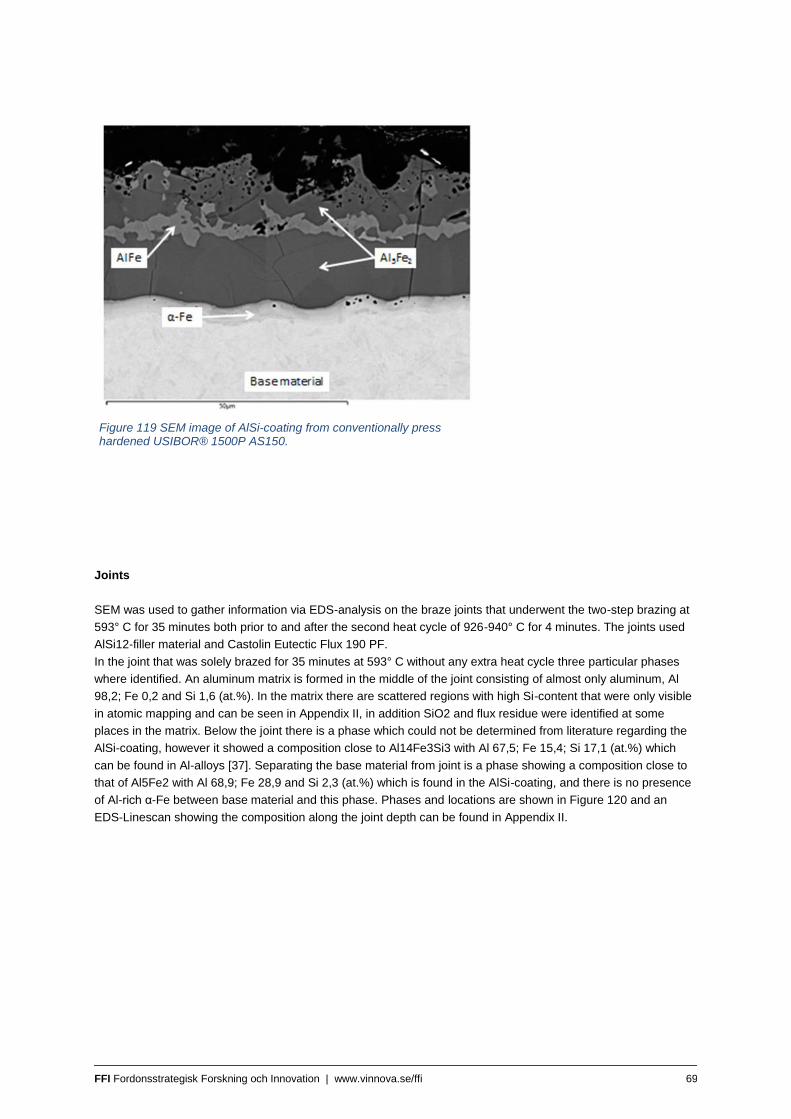
FFI Fordonsstrategisk Forskning och Innovation | www.vinnova.se/ffi 69
Joints
SEM was used to gather information via EDS-analysis on the braze joints that underwent the two-step brazing at
593° C for 35 minutes both prior to and after the second heat cycle of 926-940° C for 4 minutes. The joints used
AlSi12-filler material and Castolin Eutectic Flux 190 PF.
In the joint that was solely brazed for 35 minutes at 593° C without any extra heat cycle three particular phases
where identified. An aluminum matrix is formed in the middle of the joint consisting of almost only aluminum, Al
98,2; Fe 0,2 and Si 1,6 (at.%). In the matrix there are scattered regions with high Si-content that were only visible
in atomic mapping and can be seen in Appendix II, in addition SiO2 and flux residue were identified at some
places in the matrix. Below the joint there is a phase which could not be determined from literature regarding the
AlSi-coating, however it showed a composition close to Al14Fe3Si3 with Al 67,5; Fe 15,4; Si 17,1 (at.%) which
can be found in Al-alloys [37]. Separating the base material from joint is a phase showing a composition close to
that of Al5Fe2 with Al 68,9; Fe 28,9 and Si 2,3 (at.%) which is found in the AlSi-coating, and there is no presence
of Al-rich α-Fe between base material and this phase. Phases and locations are shown in Figure 120 and an
EDS-Linescan showing the composition along the joint depth can be found in Appendix II.
Figure 119 SEM image of AlSi-coating from conventionally press hardened USIBOR® 1500P AS150.
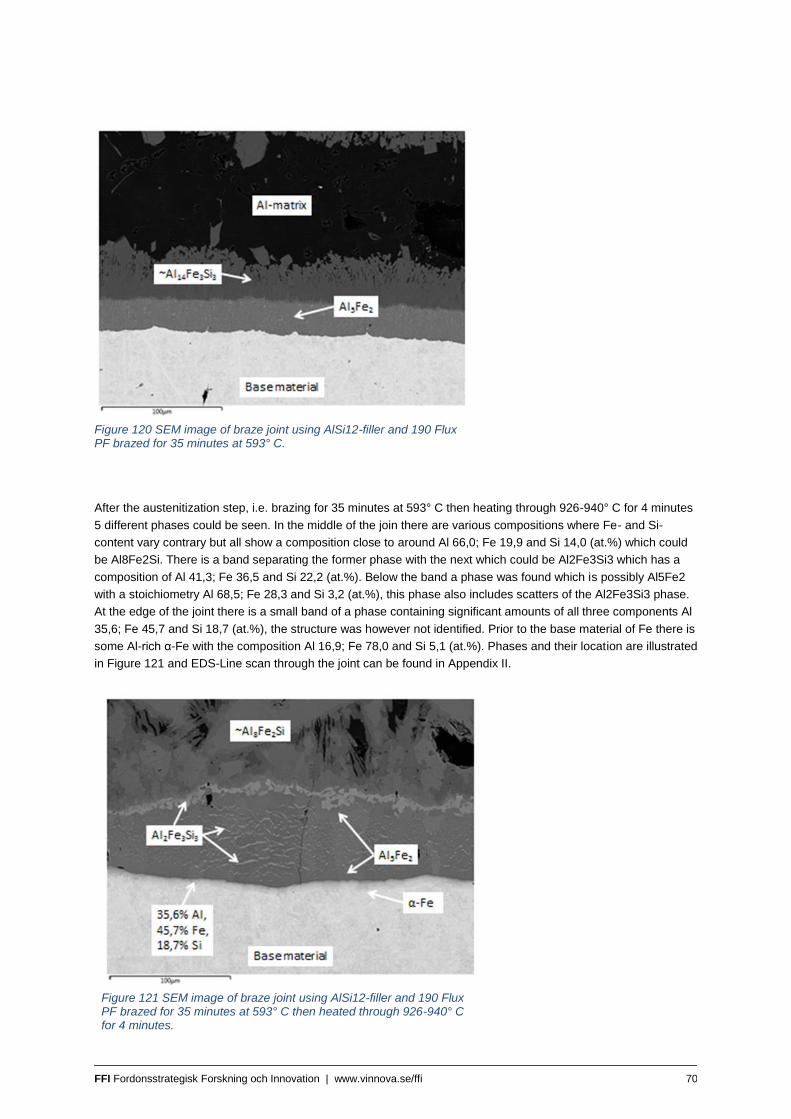
FFI Fordonsstrategisk Forskning och Innovation | www.vinnova.se/ffi 70
After the austenitization step, i.e. brazing for 35 minutes at 593° C then heating through 926-940° C for 4 minutes
5 different phases could be seen. In the middle of the join there are various compositions where Fe- and Si-
content vary contrary but all show a composition close to around Al 66,0; Fe 19,9 and Si 14,0 (at.%) which could
be Al8Fe2Si. There is a band separating the former phase with the next which could be Al2Fe3Si3 which has a
composition of Al 41,3; Fe 36,5 and Si 22,2 (at.%). Below the band a phase was found which is possibly Al5Fe2
with a stoichiometry Al 68,5; Fe 28,3 and Si 3,2 (at.%), this phase also includes scatters of the Al2Fe3Si3 phase.
At the edge of the joint there is a small band of a phase containing significant amounts of all three components Al
35,6; Fe 45,7 and Si 18,7 (at.%), the structure was however not identified. Prior to the base material of Fe there is
some Al-rich α-Fe with the composition Al 16,9; Fe 78,0 and Si 5,1 (at.%). Phases and their location are illustrated
in Figure 121 and EDS-Line scan through the joint can be found in Appendix II.
Figure 120 SEM image of braze joint using AlSi12-filler and 190 Flux PF brazed for 35 minutes at 593° C.
Figure 121 SEM image of braze joint using AlSi12-filler and 190 Flux PF brazed for 35 minutes at 593° C then heated through 926-940° C for 4 minutes.
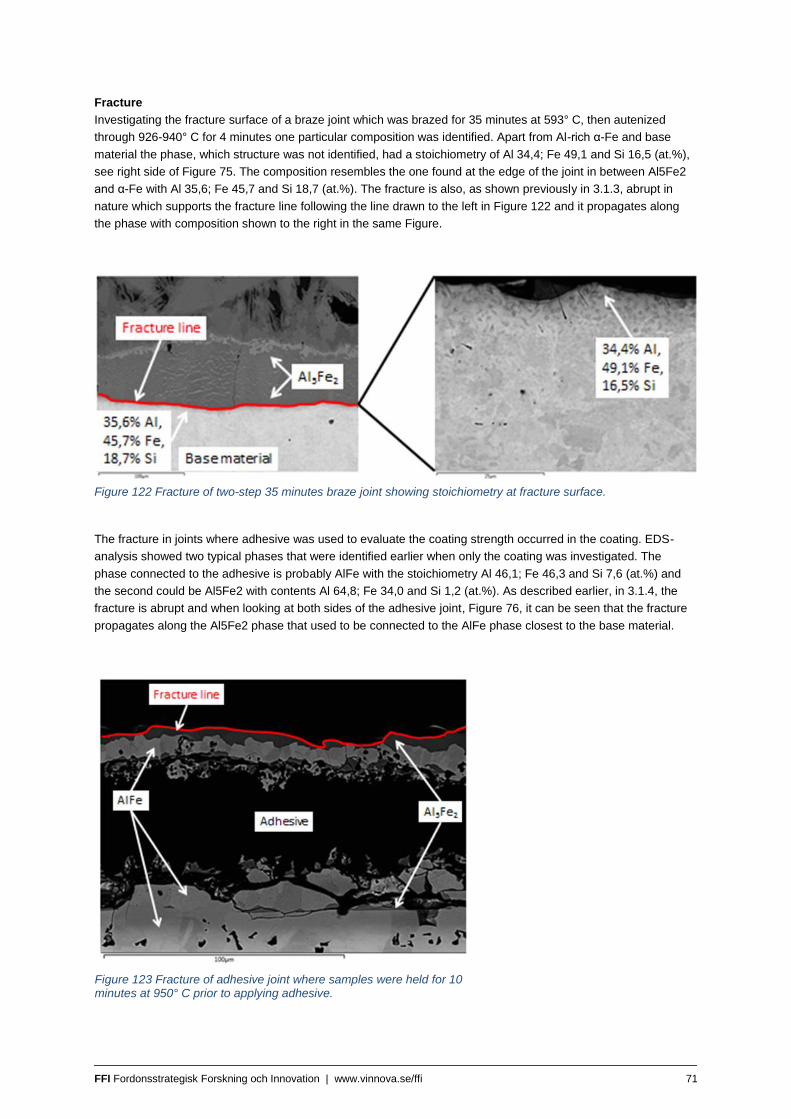
FFI Fordonsstrategisk Forskning och Innovation | www.vinnova.se/ffi 71
Fracture
Investigating the fracture surface of a braze joint which was brazed for 35 minutes at 593° C, then autenized
through 926-940° C for 4 minutes one particular composition was identified. Apart from Al-rich α-Fe and base
material the phase, which structure was not identified, had a stoichiometry of Al 34,4; Fe 49,1 and Si 16,5 (at.%),
see right side of Figure 75. The composition resembles the one found at the edge of the joint in between Al5Fe2
and α-Fe with Al 35,6; Fe 45,7 and Si 18,7 (at.%). The fracture is also, as shown previously in 3.1.3, abrupt in
nature which supports the fracture line following the line drawn to the left in Figure 122 and it propagates along
the phase with composition shown to the right in the same Figure.
The fracture in joints where adhesive was used to evaluate the coating strength occurred in the coating. EDS-
analysis showed two typical phases that were identified earlier when only the coating was investigated. The
phase connected to the adhesive is probably AlFe with the stoichiometry Al 46,1; Fe 46,3 and Si 7,6 (at.%) and
the second could be Al5Fe2 with contents Al 64,8; Fe 34,0 and Si 1,2 (at.%). As described earlier, in 3.1.4, the
fracture is abrupt and when looking at both sides of the adhesive joint, Figure 76, it can be seen that the fracture
propagates along the Al5Fe2 phase that used to be connected to the AlFe phase closest to the base material.
Figure 123 Fracture of adhesive joint where samples were held for 10 minutes at 950° C prior to applying adhesive.
Figure 122 Fracture of two-step 35 minutes braze joint showing stoichiometry at fracture surface.
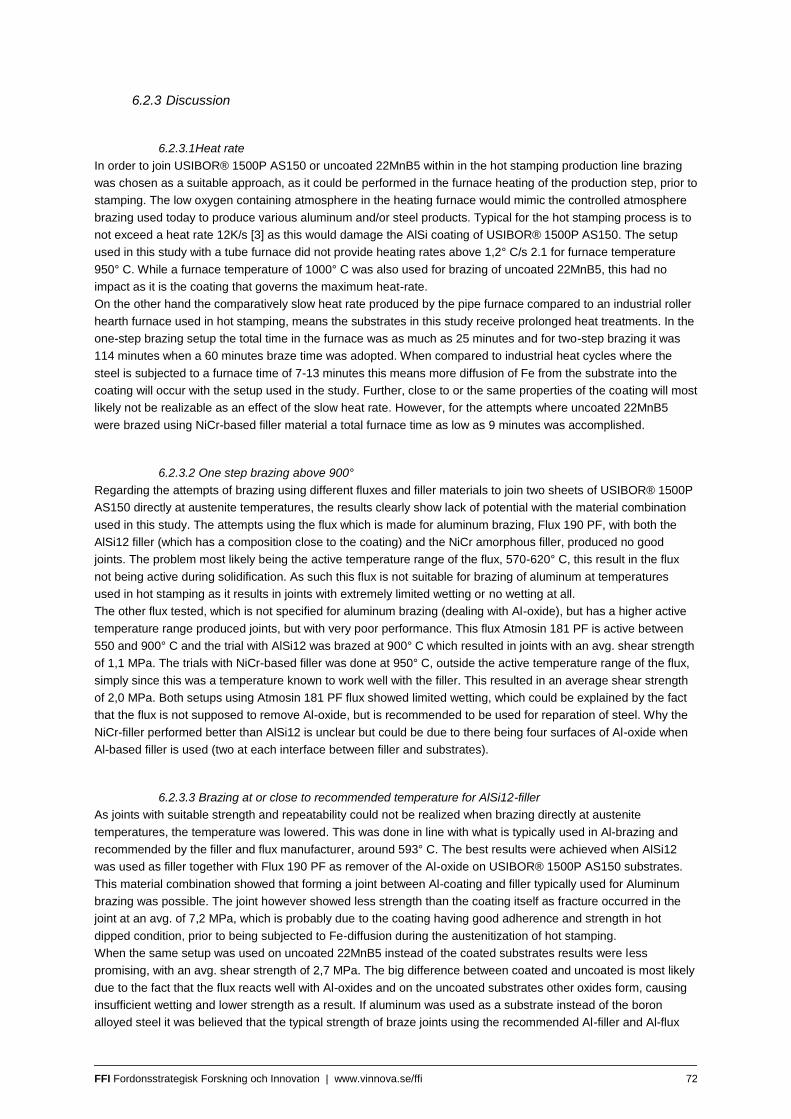
FFI Fordonsstrategisk Forskning och Innovation | www.vinnova.se/ffi 72
6.2.3 Discussion
6.2.3.1Heat rate
In order to join USIBOR® 1500P AS150 or uncoated 22MnB5 within in the hot stamping production line brazing
was chosen as a suitable approach, as it could be performed in the furnace heating of the production step, prior to
stamping. The low oxygen containing atmosphere in the heating furnace would mimic the controlled atmosphere
brazing used today to produce various aluminum and/or steel products. Typical for the hot stamping process is to
not exceed a heat rate 12K/s [3] as this would damage the AlSi coating of USIBOR® 1500P AS150. The setup
used in this study with a tube furnace did not provide heating rates above 1,2° C/s 2.1 for furnace temperature
950° C. While a furnace temperature of 1000° C was also used for brazing of uncoated 22MnB5, this had no
impact as it is the coating that governs the maximum heat-rate.
On the other hand the comparatively slow heat rate produced by the pipe furnace compared to an industrial roller
hearth furnace used in hot stamping, means the substrates in this study receive prolonged heat treatments. In the
one-step brazing setup the total time in the furnace was as much as 25 minutes and for two-step brazing it was
114 minutes when a 60 minutes braze time was adopted. When compared to industrial heat cycles where the
steel is subjected to a furnace time of 7-13 minutes this means more diffusion of Fe from the substrate into the
coating will occur with the setup used in the study. Further, close to or the same properties of the coating will most
likely not be realizable as an effect of the slow heat rate. However, for the attempts where uncoated 22MnB5
were brazed using NiCr-based filler material a total furnace time as low as 9 minutes was accomplished.
6.2.3.2 One step brazing above 900°
Regarding the attempts of brazing using different fluxes and filler materials to join two sheets of USIBOR® 1500P
AS150 directly at austenite temperatures, the results clearly show lack of potential with the material combination
used in this study. The attempts using the flux which is made for aluminum brazing, Flux 190 PF, with both the
AlSi12 filler (which has a composition close to the coating) and the NiCr amorphous filler, produced no good
joints. The problem most likely being the active temperature range of the flux, 570-620° C, this result in the flux
not being active during solidification. As such this flux is not suitable for brazing of aluminum at temperatures
used in hot stamping as it results in joints with extremely limited wetting or no wetting at all.
The other flux tested, which is not specified for aluminum brazing (dealing with Al-oxide), but has a higher active
temperature range produced joints, but with very poor performance. This flux Atmosin 181 PF is active between
550 and 900° C and the trial with AlSi12 was brazed at 900° C which resulted in joints with an avg. shear strength
of 1,1 MPa. The trials with NiCr-based filler was done at 950° C, outside the active temperature range of the flux,
simply since this was a temperature known to work well with the filler. This resulted in an average shear strength
of 2,0 MPa. Both setups using Atmosin 181 PF flux showed limited wetting, which could be explained by the fact
that the flux is not supposed to remove Al-oxide, but is recommended to be used for reparation of steel. Why the
NiCr-filler performed better than AlSi12 is unclear but could be due to there being four surfaces of Al-oxide when
Al-based filler is used (two at each interface between filler and substrates).
6.2.3.3 Brazing at or close to recommended temperature for AlSi12-filler
As joints with suitable strength and repeatability could not be realized when brazing directly at austenite
temperatures, the temperature was lowered. This was done in line with what is typically used in Al-brazing and
recommended by the filler and flux manufacturer, around 593° C. The best results were achieved when AlSi12
was used as filler together with Flux 190 PF as remover of the Al-oxide on USIBOR® 1500P AS150 substrates.
This material combination showed that forming a joint between Al-coating and filler typically used for Aluminum
brazing was possible. The joint however showed less strength than the coating itself as fracture occurred in the
joint at an avg. of 7,2 MPa, which is probably due to the coating having good adherence and strength in hot
dipped condition, prior to being subjected to Fe-diffusion during the austenitization of hot stamping.
When the same setup was used on uncoated 22MnB5 instead of the coated substrates results were less
promising, with an avg. shear strength of 2,7 MPa. The big difference between coated and uncoated is most likely
due to the fact that the flux reacts well with Al-oxides and on the uncoated substrates other oxides form, causing
insufficient wetting and lower strength as a result. If aluminum was used as a substrate instead of the boron
alloyed steel it was believed that the typical strength of braze joints using the recommended Al-filler and Al-flux
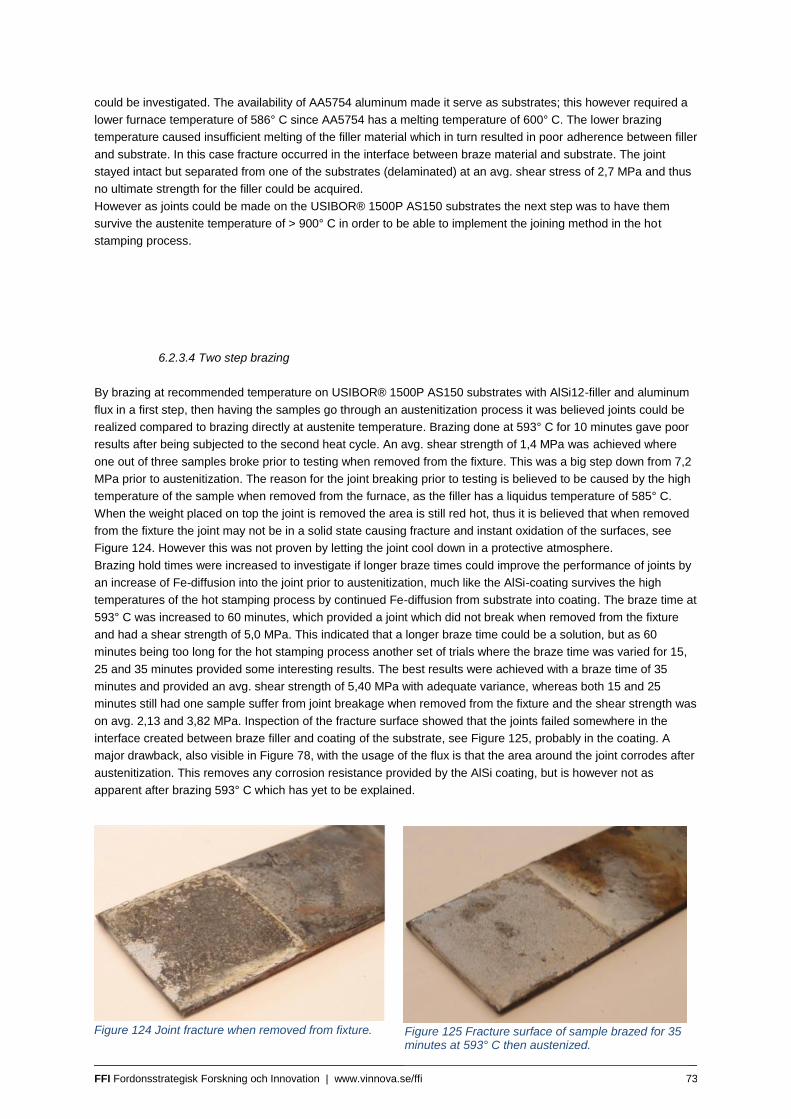
FFI Fordonsstrategisk Forskning och Innovation | www.vinnova.se/ffi 73
could be investigated. The availability of AA5754 aluminum made it serve as substrates; this however required a
lower furnace temperature of 586° C since AA5754 has a melting temperature of 600° C. The lower brazing
temperature caused insufficient melting of the filler material which in turn resulted in poor adherence between filler
and substrate. In this case fracture occurred in the interface between braze material and substrate. The joint
stayed intact but separated from one of the substrates (delaminated) at an avg. shear stress of 2,7 MPa and thus
no ultimate strength for the filler could be acquired.
However as joints could be made on the USIBOR® 1500P AS150 substrates the next step was to have them
survive the austenite temperature of > 900° C in order to be able to implement the joining method in the hot
stamping process.
6.2.3.4 Two step brazing
By brazing at recommended temperature on USIBOR® 1500P AS150 substrates with AlSi12-filler and aluminum
flux in a first step, then having the samples go through an austenitization process it was believed joints could be
realized compared to brazing directly at austenite temperature. Brazing done at 593° C for 10 minutes gave poor
results after being subjected to the second heat cycle. An avg. shear strength of 1,4 MPa was achieved where
one out of three samples broke prior to testing when removed from the fixture. This was a big step down from 7,2
MPa prior to austenitization. The reason for the joint breaking prior to testing is believed to be caused by the high
temperature of the sample when removed from the furnace, as the filler has a liquidus temperature of 585° C.
When the weight placed on top the joint is removed the area is still red hot, thus it is believed that when removed
from the fixture the joint may not be in a solid state causing fracture and instant oxidation of the surfaces, see
Figure 124. However this was not proven by letting the joint cool down in a protective atmosphere.
Brazing hold times were increased to investigate if longer braze times could improve the performance of joints by
an increase of Fe-diffusion into the joint prior to austenitization, much like the AlSi-coating survives the high
temperatures of the hot stamping process by continued Fe-diffusion from substrate into coating. The braze time at
593° C was increased to 60 minutes, which provided a joint which did not break when removed from the fixture
and had a shear strength of 5,0 MPa. This indicated that a longer braze time could be a solution, but as 60
minutes being too long for the hot stamping process another set of trials where the braze time was varied for 15,
25 and 35 minutes provided some interesting results. The best results were achieved with a braze time of 35
minutes and provided an avg. shear strength of 5,40 MPa with adequate variance, whereas both 15 and 25
minutes still had one sample suffer from joint breakage when removed from the fixture and the shear strength was
on avg. 2,13 and 3,82 MPa. Inspection of the fracture surface showed that the joints failed somewhere in the
interface created between braze filler and coating of the substrate, see Figure 125, probably in the coating. A
major drawback, also visible in Figure 78, with the usage of the flux is that the area around the joint corrodes after
austenitization. This removes any corrosion resistance provided by the AlSi coating, but is however not as
apparent after brazing 593° C which has yet to be explained.
Figure 124 Joint fracture when removed from fixture. Figure 125 Fracture surface of sample brazed for 35 minutes at 593° C then austenized.
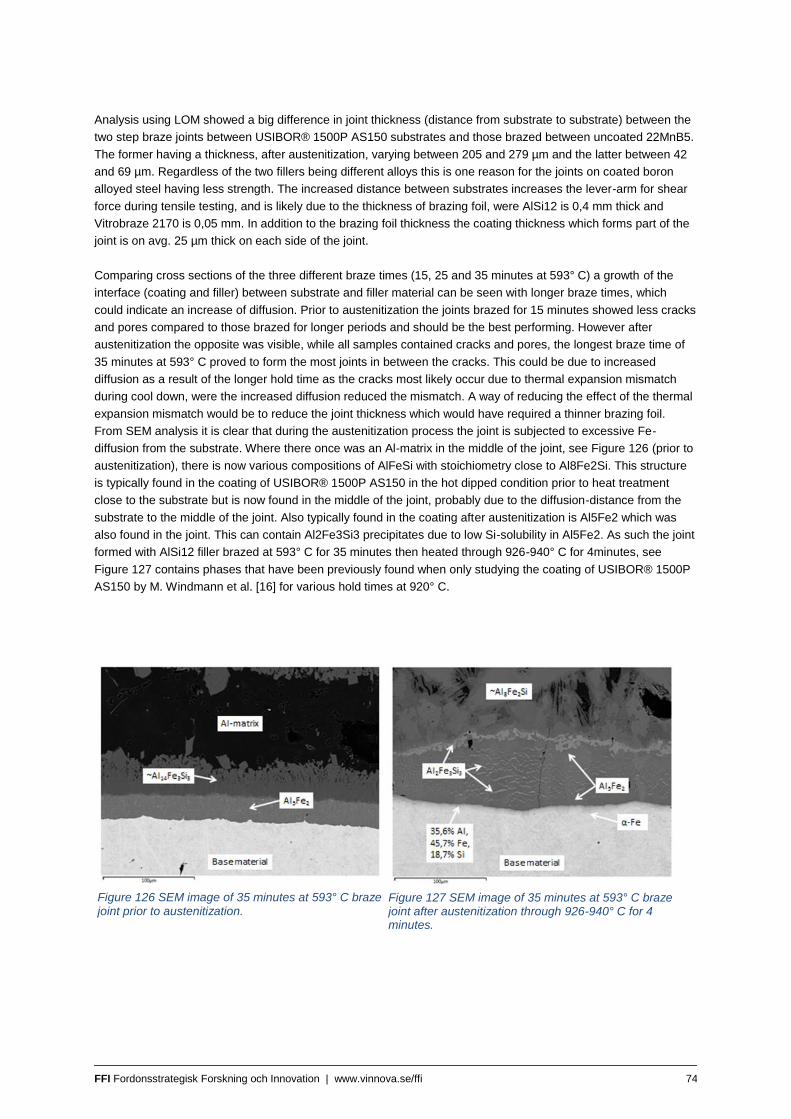
FFI Fordonsstrategisk Forskning och Innovation | www.vinnova.se/ffi 74
Analysis using LOM showed a big difference in joint thickness (distance from substrate to substrate) between the
two step braze joints between USIBOR® 1500P AS150 substrates and those brazed between uncoated 22MnB5.
The former having a thickness, after austenitization, varying between 205 and 279 µm and the latter between 42
and 69 µm. Regardless of the two fillers being different alloys this is one reason for the joints on coated boron
alloyed steel having less strength. The increased distance between substrates increases the lever-arm for shear
force during tensile testing, and is likely due to the thickness of brazing foil, were AlSi12 is 0,4 mm thick and
Vitrobraze 2170 is 0,05 mm. In addition to the brazing foil thickness the coating thickness which forms part of the
joint is on avg. 25 µm thick on each side of the joint.
Comparing cross sections of the three different braze times (15, 25 and 35 minutes at 593° C) a growth of the
interface (coating and filler) between substrate and filler material can be seen with longer braze times, which
could indicate an increase of diffusion. Prior to austenitization the joints brazed for 15 minutes showed less cracks
and pores compared to those brazed for longer periods and should be the best performing. However after
austenitization the opposite was visible, while all samples contained cracks and pores, the longest braze time of
35 minutes at 593° C proved to form the most joints in between the cracks. This could be due to increased
diffusion as a result of the longer hold time as the cracks most likely occur due to thermal expansion mismatch
during cool down, were the increased diffusion reduced the mismatch. A way of reducing the effect of the thermal
expansion mismatch would be to reduce the joint thickness which would have required a thinner brazing foil.
From SEM analysis it is clear that during the austenitization process the joint is subjected to excessive Fe-
diffusion from the substrate. Where there once was an Al-matrix in the middle of the joint, see Figure 126 (prior to
austenitization), there is now various compositions of AlFeSi with stoichiometry close to Al8Fe2Si. This structure
is typically found in the coating of USIBOR® 1500P AS150 in the hot dipped condition prior to heat treatment
close to the substrate but is now found in the middle of the joint, probably due to the diffusion-distance from the
substrate to the middle of the joint. Also typically found in the coating after austenitization is Al5Fe2 which was
also found in the joint. This can contain Al2Fe3Si3 precipitates due to low Si-solubility in Al5Fe2. As such the joint
formed with AlSi12 filler brazed at 593° C for 35 minutes then heated through 926-940° C for 4minutes, see
Figure 127 contains phases that have been previously found when only studying the coating of USIBOR® 1500P
AS150 by M. Windmann et al. [16] for various hold times at 920° C.
Figure 126 SEM image of 35 minutes at 593° C braze joint prior to austenitization.
Figure 127 SEM image of 35 minutes at 593° C braze joint after austenitization through 926-940° C for 4 minutes.
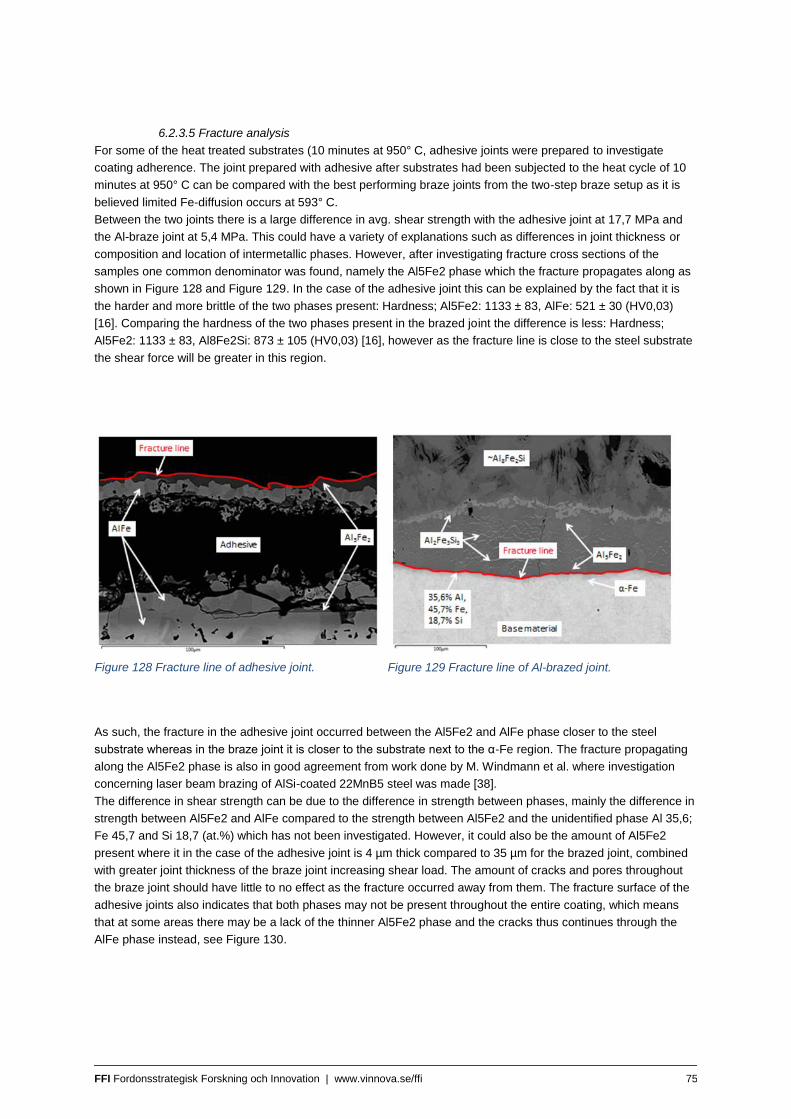
FFI Fordonsstrategisk Forskning och Innovation | www.vinnova.se/ffi 75
6.2.3.5 Fracture analysis
For some of the heat treated substrates (10 minutes at 950° C, adhesive joints were prepared to investigate
coating adherence. The joint prepared with adhesive after substrates had been subjected to the heat cycle of 10
minutes at 950° C can be compared with the best performing braze joints from the two-step braze setup as it is
believed limited Fe-diffusion occurs at 593° C.
Between the two joints there is a large difference in avg. shear strength with the adhesive joint at 17,7 MPa and
the Al-braze joint at 5,4 MPa. This could have a variety of explanations such as differences in joint thickness or
composition and location of intermetallic phases. However, after investigating fracture cross sections of the
samples one common denominator was found, namely the Al5Fe2 phase which the fracture propagates along as
shown in Figure 128 and Figure 129. In the case of the adhesive joint this can be explained by the fact that it is
the harder and more brittle of the two phases present: Hardness; Al5Fe2: 1133 ± 83, AlFe: 521 ± 30 (HV0,03)
[16]. Comparing the hardness of the two phases present in the brazed joint the difference is less: Hardness;
Al5Fe2: 1133 ± 83, Al8Fe2Si: 873 ± 105 (HV0,03) [16], however as the fracture line is close to the steel substrate
the shear force will be greater in this region.
As such, the fracture in the adhesive joint occurred between the Al5Fe2 and AlFe phase closer to the steel
substrate whereas in the braze joint it is closer to the substrate next to the α-Fe region. The fracture propagating
along the Al5Fe2 phase is also in good agreement from work done by M. Windmann et al. where investigation
concerning laser beam brazing of AlSi-coated 22MnB5 steel was made [38].
The difference in shear strength can be due to the difference in strength between phases, mainly the difference in
strength between Al5Fe2 and AlFe compared to the strength between Al5Fe2 and the unidentified phase Al 35,6;
Fe 45,7 and Si 18,7 (at.%) which has not been investigated. However, it could also be the amount of Al5Fe2
present where it in the case of the adhesive joint is 4 µm thick compared to 35 µm for the brazed joint, combined
with greater joint thickness of the braze joint increasing shear load. The amount of cracks and pores throughout
the braze joint should have little to no effect as the fracture occurred away from them. The fracture surface of the
adhesive joints also indicates that both phases may not be present throughout the entire coating, which means
that at some areas there may be a lack of the thinner Al5Fe2 phase and the cracks thus continues through the
AlFe phase instead, see Figure 130.
Figure 128 Fracture line of adhesive joint. Figure 129 Fracture line of Al-brazed joint.
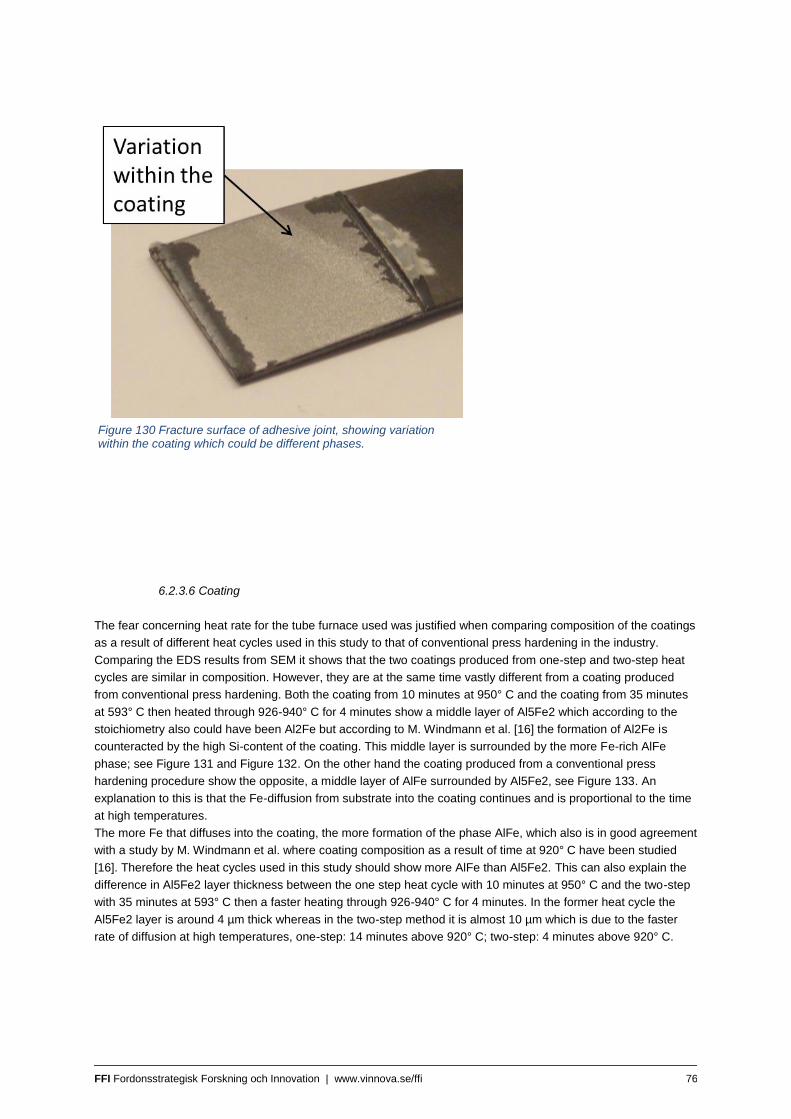
FFI Fordonsstrategisk Forskning och Innovation | www.vinnova.se/ffi 76
6.2.3.6 Coating
The fear concerning heat rate for the tube furnace used was justified when comparing composition of the coatings
as a result of different heat cycles used in this study to that of conventional press hardening in the industry.
Comparing the EDS results from SEM it shows that the two coatings produced from one-step and two-step heat
cycles are similar in composition. However, they are at the same time vastly different from a coating produced
from conventional press hardening. Both the coating from 10 minutes at 950° C and the coating from 35 minutes
at 593° C then heated through 926-940° C for 4 minutes show a middle layer of Al5Fe2 which according to the
stoichiometry also could have been Al2Fe but according to M. Windmann et al. [16] the formation of Al2Fe is
counteracted by the high Si-content of the coating. This middle layer is surrounded by the more Fe-rich AlFe
phase; see Figure 131 and Figure 132. On the other hand the coating produced from a conventional press
hardening procedure show the opposite, a middle layer of AlFe surrounded by Al5Fe2, see Figure 133. An
explanation to this is that the Fe-diffusion from substrate into the coating continues and is proportional to the time
at high temperatures.
The more Fe that diffuses into the coating, the more formation of the phase AlFe, which also is in good agreement
with a study by M. Windmann et al. where coating composition as a result of time at 920° C have been studied
[16]. Therefore the heat cycles used in this study should show more AlFe than Al5Fe2. This can also explain the
difference in Al5Fe2 layer thickness between the one step heat cycle with 10 minutes at 950° C and the two-step
with 35 minutes at 593° C then a faster heating through 926-940° C for 4 minutes. In the former heat cycle the
Al5Fe2 layer is around 4 µm thick whereas in the two-step method it is almost 10 µm which is due to the faster
rate of diffusion at high temperatures, one-step: 14 minutes above 920° C; two-step: 4 minutes above 920° C.
Figure 130 Fracture surface of adhesive joint, showing variation within the coating which could be different phases.

FFI Fordonsstrategisk Forskning och Innovation | www.vinnova.se/ffi 77
The interface between coating and substrate where Al-diffusion has created Al-rich α-Fe is a lot deeper in the
coatings from this study compared to the conventionally press hardened coating, and the total diffusion depth
from top of coating down to substrate is; one-step: 45, two-step: 42, conventionally press hardened: 30 (µm). This
is also matches well with the work by M. Windmann et al. [16] and is connected to the time at a high temperature.
Tensile adhesion tests were also conducted to see if there was any variety in the strength (adherence) of the
coatings produced. The worst performing was the coatings from two-step heat cycle where samples heat treated
for 15 and 25 minutes at the lower temperature fractured at avg. around 5 MPa, and the 35 minutes at an avg. 2
MPa. The coating from one-step heat cycle at 950° C performed better but fractured at 18,4 MPa. This indicated
that what was discussed earlier, regarding the amount of Al5Fe2 in the fracture of joints might have an impact on
the strength. But from an earlier project it is known that the conventionally press hardened coating does not
fracture until stress levels of up to 40 MPa have been reached, and it contains more Al5Fe2. As an attempt to see
if the press hardening would have an impact on coating strength, samples were heat treated, both by the one-
and two-step brazing cycle then quenched between copper blocks. This gave contradictory results where the
coating strength of two-step heat cycles improved while it for one-step regressed and as such no conclusion
regarding the quenched samples could be drawn. However heat treatments used in this study provided coating
with far less performance than that of conventionally press hardened USIBOR® 1500P AS150, with the two step
heat-cycle being the worst performing.
Figure 133 Coating from conventional press hardening.
Figure 131 Coating from 10 minutes at 950° C. Figure 132 Coating from 35 minutes at 593° C then austenitization.
FFI Fordonsstrategisk Forskning och Innovation | www.vinnova.se/ffi 78
6.2.4 Conclusions
In this study an investigation was carried out concerning the ability to braze AlSi-coated and uncoated 22MnB5
steel in a controlled atmosphere furnace. Performance was evaluated in shear strength using tensile testing with
lap joints and adhesion pull-off testing. Chemical composition of phases appearing the joint and surface coating
was identified using SEM with EDS-analysis and compared with literature. The following conclusions can be
drawn:
• Braze joints could not be made between USIBOR® 1500P AS150 substrates using Al- or NiCr-
based filler material in combination with flux for Al-brazing or steel reparation if a one-step
brazing approach at austenite temperature is adopted.
• Joints with a shear strength 5,4 MPa, c was obtained with a two-step brazing approach using Al-
filler and Al-brazing flux. This requires; first: brazing at recommended temperature, 593° C, for 35
minutes; second: heating up to austenite temperature (926-940° C) and held for 4 minutes.
• The coating of USIBOR® 1500P AS150 substrates resulting from the one step and two step heat
cycles show different structure compared to conventionally press hardened USIBOR® 1500P
AS150. Coatings resulting from brazing heat treatments consist of more AlFe than Al5Fe2 While
the opposite is true for conventional coatings. This is connected to the amount of Fe-diffusion
from substrate into the coating which depends on time at elevated temperature. Concluding that
heat cycles used are longer than those used in hot stamping.
• The fracture occurred along the Al5Fe2 phase inside the coating for both braze and adhesive
joints between USIBOR® 1500P AS150 sheets
• The strength of the coating was evaluated using tensile adhesion test. This showed that the two
step heat cycle resulted in the poorest coating strength at avg. 5,44 MPa while the one step heat
cycle had strength of avg. 15,4 MPa. Both far from conventionally press hardened coating that
has shown strength above 40 MPa.
• The total time in furnace could be reduced by 16 minutes giving a total furnace time of 9 minutes
for brazing of uncoated 22MnB5 while sustaining the same shear strength. This was done by
using a higher furnace temperature (1000° C) and a constantly increasing temperature of the
samples during brazing.

FFI Fordonsstrategisk Forskning och Innovation | www.vinnova.se/ffi 79
6.2.5 Part III - Brazing zinc-coated sheet steel to zinc-coated sheet steel
Brazing experiments were performed in inert atmosphere at temperature from 890 ºC up to 950 ºC, and the
holding time was 10 minutes. One test was performed for each temperature. Brazing at 890 ºC was not enough to
melt the brazing foil, but a weak bond was achieved at 896 ºC. Increased temperature increased the shear
strength up to a brazing temperature of ~925 ºC, while brazing at 950 ºC resulted in a reduced shear strength
compared to braze at ~925 ºC, see Figure 89. The shear strength at a brazing temperature of ~925 ºC was 38
MPa.
6.2.5.1 Discussion
Brazing of zinc-coated Usibor with NiCr21amorphous brazing foil in inert atmosphere seems possible. The shear
strength at a brazing temperature of ~925 ºC was 38 MPa. However, the austenitization temperature for zinc-
coated boron steel used today is 890 ºC, and therefore further work is needed to verify if it is possible to go up to
925 ºC.
6.2.5.2 Conclusions
Based on the performed experiments it is possible to braze zinc-coated Usibor with NiCr21amorphous brazing foil
in inert atmosphere. The shear strength at a brazing temperature of ~925 ºC was 38 MPa.
Figure 134.Brazing of zinc-coated Usibor with NiCr21amorphous brazing foil.
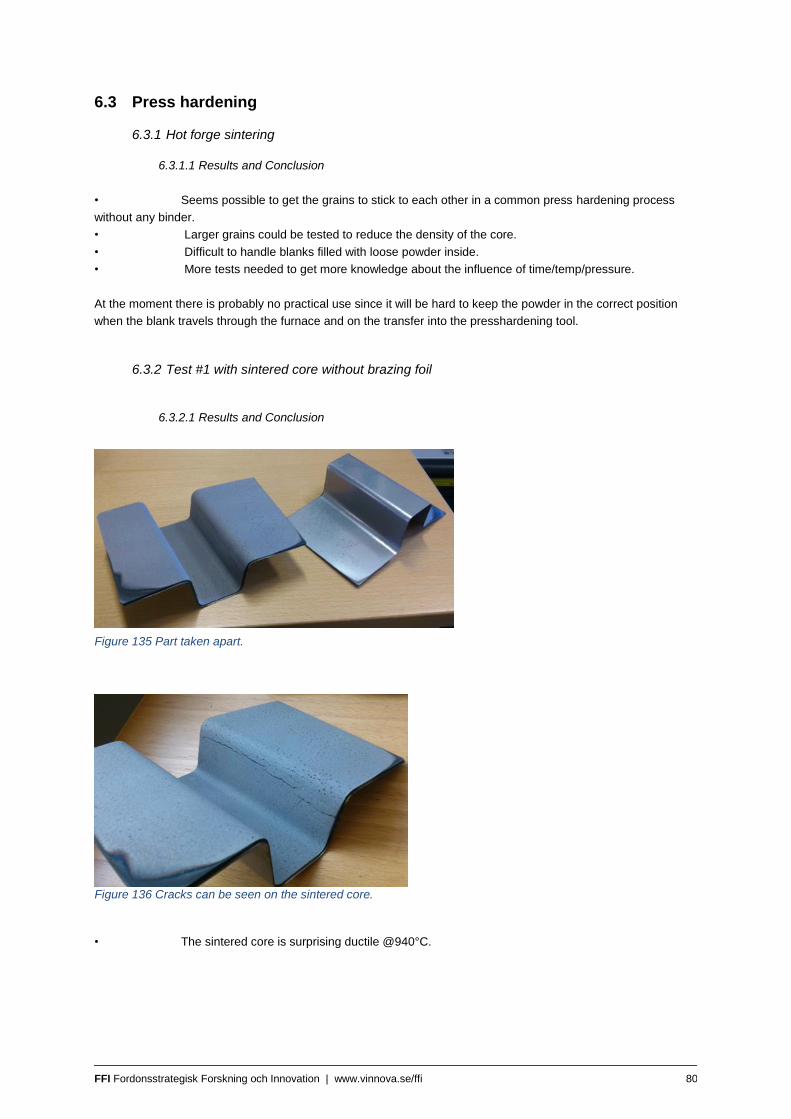
FFI Fordonsstrategisk Forskning och Innovation | www.vinnova.se/ffi 80
6.3 Press hardening
6.3.1 Hot forge sintering
6.3.1.1 Results and Conclusion
• Seems possible to get the grains to stick to each other in a common press hardening process
without any binder.
• Larger grains could be tested to reduce the density of the core.
• Difficult to handle blanks filled with loose powder inside.
• More tests needed to get more knowledge about the influence of time/temp/pressure.
At the moment there is probably no practical use since it will be hard to keep the powder in the correct position
when the blank travels through the furnace and on the transfer into the presshardening tool.
6.3.2 Test #1 with sintered core without brazing foil
6.3.2.1 Results and Conclusion
• The sintered core is surprising ductile @940°C.
Figure 136 Cracks can be seen on the sintered core.
Figure 135 Part taken apart.
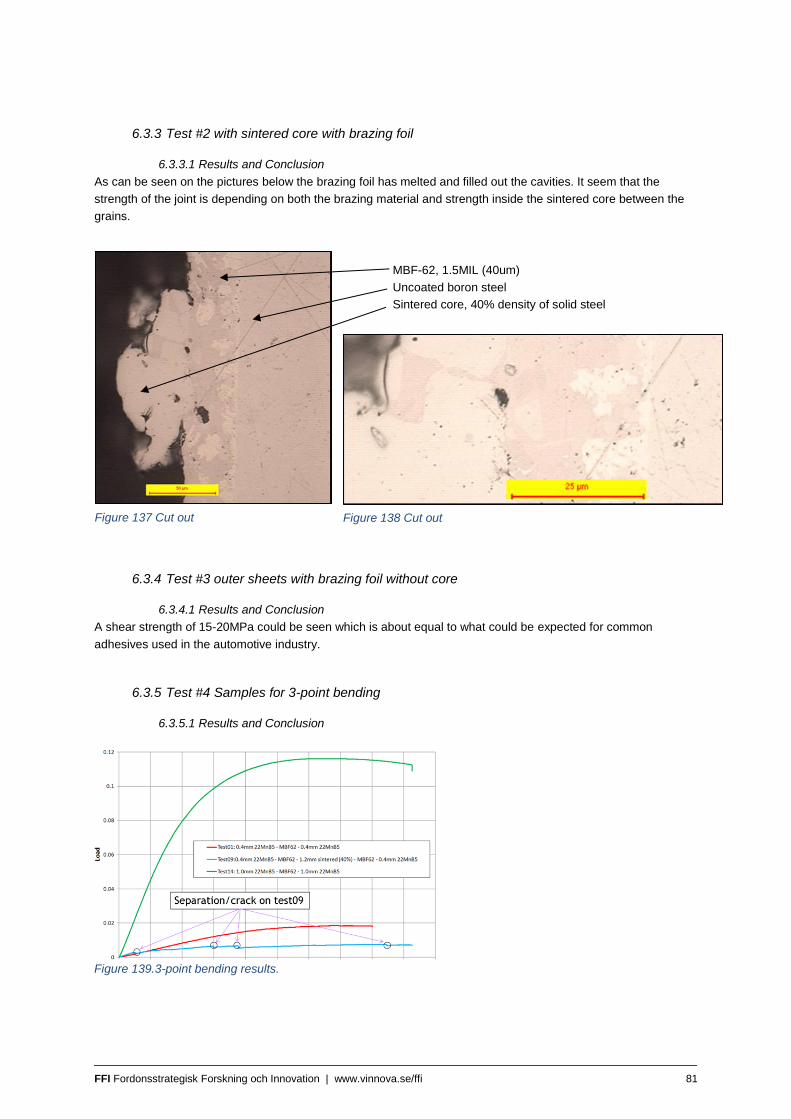
FFI Fordonsstrategisk Forskning och Innovation | www.vinnova.se/ffi 81
6.3.3 Test #2 with sintered core with brazing foil
6.3.3.1 Results and Conclusion
As can be seen on the pictures below the brazing foil has melted and filled out the cavities. It seem that the
strength of the joint is depending on both the brazing material and strength inside the sintered core between the
grains.
6.3.4 Test #3 outer sheets with brazing foil without core
6.3.4.1 Results and Conclusion
A shear strength of 15-20MPa could be seen which is about equal to what could be expected for common
adhesives used in the automotive industry.
6.3.5 Test #4 Samples for 3-point bending
6.3.5.1 Results and Conclusion
Figure 137 Cut out Figure 138 Cut out
MBF-62, 1.5MIL (40um)
Uncoated boron steel
Sintered core, 40% density of solid steel
Figure 139.3-point bending results.

FFI Fordonsstrategisk Forskning och Innovation | www.vinnova.se/ffi 82
• Brazing foil MBF62 works well with the presshardening process.
• The sintered material is either too brittle for the brazing to stick or the mating surface is to small
due to the 40% porosity material tested.
• Sintered core is currently (40% porosity) to brittle for mechanical testing (Sintered core
specification: grain size 75µm, Fe and 0.3% C, 40% density of solid steel, heat treated
30min@1150°C).
Figure140. 3-point bending Test01 after test.
Figure 331.3-point bending Test09 after test.

FFI Fordonsstrategisk Forskning och Innovation | www.vinnova.se/ffi 83
6.3.6 Different sintered cores Part 1
6.3.6.1 Results and Conclusion
As can be seen on the results below, the stainless steel austenitic works best.
Figure 143. FeSi
Figure 142 Test resultat

FFI Fordonsstrategisk Forskning och Innovation | www.vinnova.se/ffi 84
Figure 145 Stainless steel austenitic
Figure 146 Stainless steel ferritic
Figure 144. .FeP

FFI Fordonsstrategisk Forskning och Innovation | www.vinnova.se/ffi 85
6.3.7 Test #5 Different sintered cores Part 2.
6.3.7.1 Results and Conclusion.
Figure 147 Hat profiles after compression test.
Figure 148 Test results. Not same length on the hat profiles as in test #5.

FFI Fordonsstrategisk Forskning och Innovation | www.vinnova.se/ffi 86
Delamination is found within the sintered core and between the brazing and the sintered core. Where the outer
sheets has been cracked probably is a caused by grain growth due to long time at high temperature in the
sintering process.
6.3.8 Test of brazing foil strength
6.3.8.1 Results and Conclusion.
As can be seen below the brazing foil Vitrobraze VZ2170 is not strong enough to hold the press hardened sheets
together.The stiffness seems to be OK up to about 1mm intrusion, after that the delamination appears.
Figure 149 Evaluation of cracks after compression test.
Figure 150 Hat profile test.

FFI Fordonsstrategisk Forskning och Innovation | www.vinnova.se/ffi 87
6.3.9 Additional hat profile test.
6.3.9.1 Results and Conclusion.
The results are about the same as for the previous tests.
Figure 151 Hat profile test.

FFI Fordonsstrategisk Forskning och Innovation | www.vinnova.se/ffi 88
6.4 FE simulation
6.4.1 Experiments and Results
In previous sections experiments were been carried out on hat-profiles made of solid steel sheets and laminates
with cores of sintered steel powder. From these experiments it was found that the core of the laminate, consisting
of sintered steel powder, exhibits brittle behavior/failure, reducing its ability to absorb energy during crash loading.
Thus, the material was deemed unsuitable to be used in laminate configurations for crash applications.
Despite the sintered powder displaying brittle behavior, an attempt to characterize the material and to calibrate
the material model was made. The intention was to recreate the input curves for the material model, presented in
Figure 70 and Figure 71. Due to the complexity of loading specimens in hydrostatic pressure, only uniaxial
loading (compression) is applied.
The sintered material, based on FeSi with a relative density of approximately 0.5, is produced in thin layers, with a
maximum thickness of 1.6 millimeters. This made it necessary to stack layers of the material on top of each other
to create a specimen with a height approximately equal to its side lengths. Squares with a side length of 12.5 mm
was chosen, see Figure 152, since tools with such dimensions were available in the workshop at LTU. A
specimen was also created using stamped circles. However, this geometry was only used once since DSP, Digital
Speckle Photography, was to be used, and the plane surface of the cubic specimens was preferred.
In total, seven specimens were loaded until failure: 6 squares and 1 cylinder. The thickness of each sheet varied
between 0.50 and 0.60 millimeters. The number of layers were chosen so the height would be approximately
equal to the side length, thus forming cubes.
In the first run the cylindrical specimen was loaded, due to its face being curved, which must be taken into
consideration when considering the strain-fields obtained from the DSP, this geometry was only used once. The
second run was on a cubic specimen, and a Teflon spray was applied on its top and bottom to reduce friction
between tools and specimen, which would reduce barrel effects. However, when studying the film from the
experiment it seemed to have little impact. Furthermore, the spray seemed to be absorbed by the material, and
was abandoned in favor of a paste. The paste was easier to apply, and seemed to do a better job of reducing the
friction. This paste was used for the remaining tests.
A total of five runs were performed with the paste on the top and bottom of the experiment to reduce friction. The
third and fourth run were performed, and generate similar force-displacement response. Only at the stage of
failure did the response differ, see Figure 153 and Figure 154, where a constant tangent can be seen until failure.
To investigate whether this tangent is associated with elasticity or not, a fifth specimen was prepared. On the fifth
run the specimen was loaded until 6 kN, see Figure 153 and Figure 155, and then unloaded and loaded again
until failure. Initially, the response was equal to that of run 3 and 4, when the strain reached a value of 0.075 it
started to deviate away from run 3 and 4. Furthermore, the failure load was lower than run 3 and 4. To further
investigate the influence of unloading on the specimen, the number of loading cycles were increased. Unloading
was set to occur with an interval of 1 kN. For the sixth run, an error had been made so that the first load cycles
were not saved. The test was rerun with a seventh specimen, this can be seen in Figure 153 and Figure 155.
When studying the images from the camera used for the DSP, it could be seen that cracks, on the surface,
appeared before the peak load. This is presented in Figure 156, Figure 157, and Figure 158, where it can be seen
that despite presence of cracks, the tangent of the load curves remains constant up to a value of 2.80 mm on the
horizontal axis, similar behavior was observed for all the tests with DSP. At a given displacement the cracks have
grown in size, and large parts of the specimen starts to fall off.
From the DSP it was evident that the specimen did not behave as a homogenous body, see Figure 159 - Figure
161. Furthermore, it was noted that the stacking of layers was problematic, since the gaps between the layers
were perceived as areas with great deformation. An effort was made to remove the gaps, through filtering, and
only measure on the layers, this can be seen in Figure 162 - Figure 165. From the filtered data it is seen that the
strain is not homogenously distributed throughout the entire body. Certain layers are subjected to greater levels of
strain, which will cause these layers to fail early during the loading procedure.
Considering the random distribution of the specimen, the force response is quite similar for all runs, with only the
response from the fifth run being a bit lower. Even when subjecting the specimen to a number of load cycles, the
agreement between the specimens is quite good. It appears that approximately two tangents can be identified
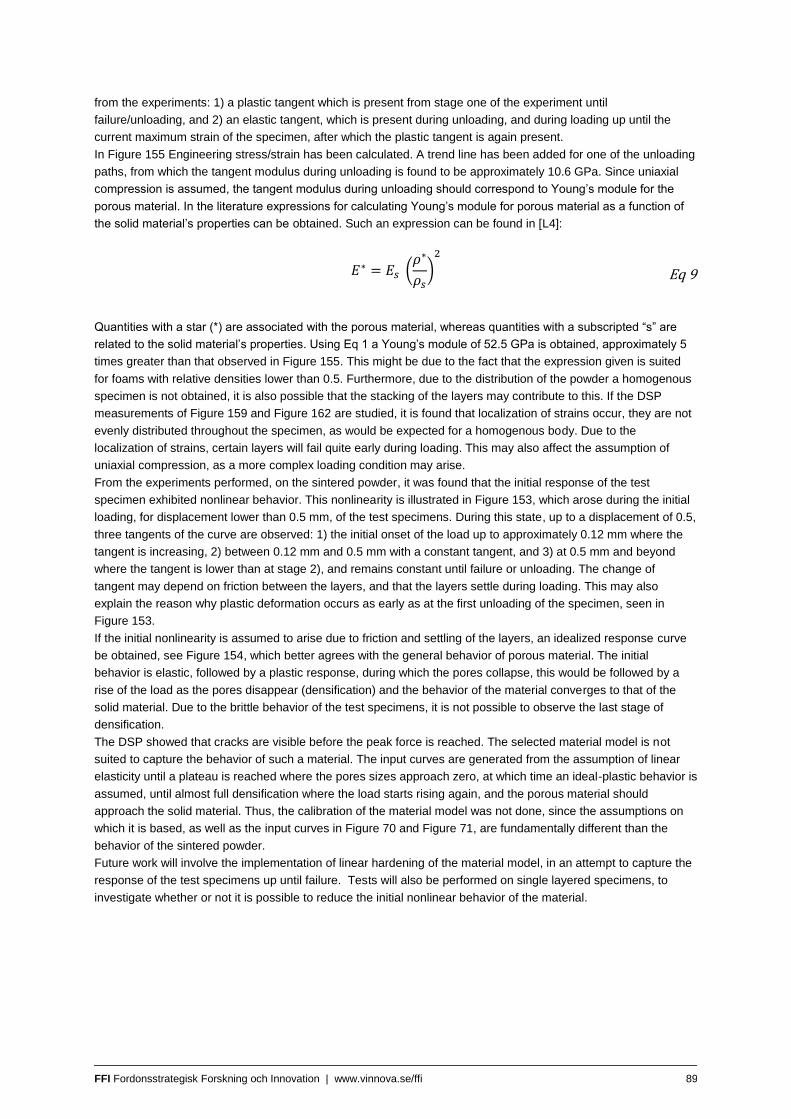
FFI Fordonsstrategisk Forskning och Innovation | www.vinnova.se/ffi 89
from the experiments: 1) a plastic tangent which is present from stage one of the experiment until
failure/unloading, and 2) an elastic tangent, which is present during unloading, and during loading up until the
current maximum strain of the specimen, after which the plastic tangent is again present.
In Figure 155 Engineering stress/strain has been calculated. A trend line has been added for one of the unloading
paths, from which the tangent modulus during unloading is found to be approximately 10.6 GPa. Since uniaxial
compression is assumed, the tangent modulus during unloading should correspond to Young’s module for the
porous material. In the literature expressions for calculating Young’s module for porous material as a function of
the solid material’s properties can be obtained. Such an expression can be found in [L4]:
𝐸∗ = 𝐸𝑠 (
𝜌∗
𝜌𝑠)
2
Eq 9
Quantities with a star (*) are associated with the porous material, whereas quantities with a subscripted “s” are
related to the solid material’s properties. Using Eq 1 a Young’s module of 52.5 GPa is obtained, approximately 5
times greater than that observed in Figure 155. This might be due to the fact that the expression given is suited
for foams with relative densities lower than 0.5. Furthermore, due to the distribution of the powder a homogenous
specimen is not obtained, it is also possible that the stacking of the layers may contribute to this. If the DSP
measurements of Figure 159 and Figure 162 are studied, it is found that localization of strains occur, they are not
evenly distributed throughout the specimen, as would be expected for a homogenous body. Due to the
localization of strains, certain layers will fail quite early during loading. This may also affect the assumption of
uniaxial compression, as a more complex loading condition may arise.
From the experiments performed, on the sintered powder, it was found that the initial response of the test
specimen exhibited nonlinear behavior. This nonlinearity is illustrated in Figure 153, which arose during the initial
loading, for displacement lower than 0.5 mm, of the test specimens. During this state, up to a displacement of 0.5,
three tangents of the curve are observed: 1) the initial onset of the load up to approximately 0.12 mm where the
tangent is increasing, 2) between 0.12 mm and 0.5 mm with a constant tangent, and 3) at 0.5 mm and beyond
where the tangent is lower than at stage 2), and remains constant until failure or unloading. The change of
tangent may depend on friction between the layers, and that the layers settle during loading. This may also
explain the reason why plastic deformation occurs as early as at the first unloading of the specimen, seen in
Figure 153.
If the initial nonlinearity is assumed to arise due to friction and settling of the layers, an idealized response curve
be obtained, see Figure 154, which better agrees with the general behavior of porous material. The initial
behavior is elastic, followed by a plastic response, during which the pores collapse, this would be followed by a
rise of the load as the pores disappear (densification) and the behavior of the material converges to that of the
solid material. Due to the brittle behavior of the test specimens, it is not possible to observe the last stage of
densification.
The DSP showed that cracks are visible before the peak force is reached. The selected material model is not
suited to capture the behavior of such a material. The input curves are generated from the assumption of linear
elasticity until a plateau is reached where the pores sizes approach zero, at which time an ideal-plastic behavior is
assumed, until almost full densification where the load starts rising again, and the porous material should
approach the solid material. Thus, the calibration of the material model was not done, since the assumptions on
which it is based, as well as the input curves in Figure 70 and Figure 71, are fundamentally different than the
behavior of the sintered powder.
Future work will involve the implementation of linear hardening of the material model, in an attempt to capture the
response of the test specimens up until failure. Tests will also be performed on single layered specimens, to
investigate whether or not it is possible to reduce the initial nonlinear behavior of the material.
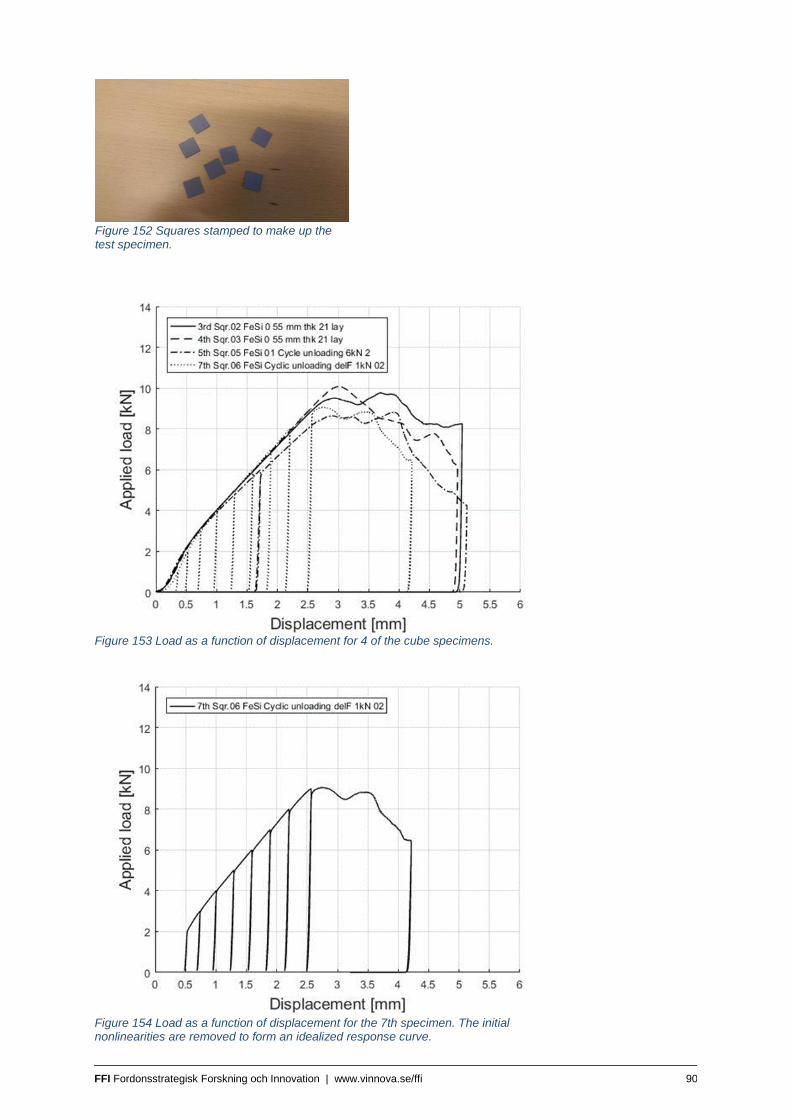
FFI Fordonsstrategisk Forskning och Innovation | www.vinnova.se/ffi 90
Figure 152 Squares stamped to make up the test specimen.
Figure 153 Load as a function of displacement for 4 of the cube specimens.
Figure 154 Load as a function of displacement for the 7th specimen. The initial nonlinearities are removed to form an idealized response curve.
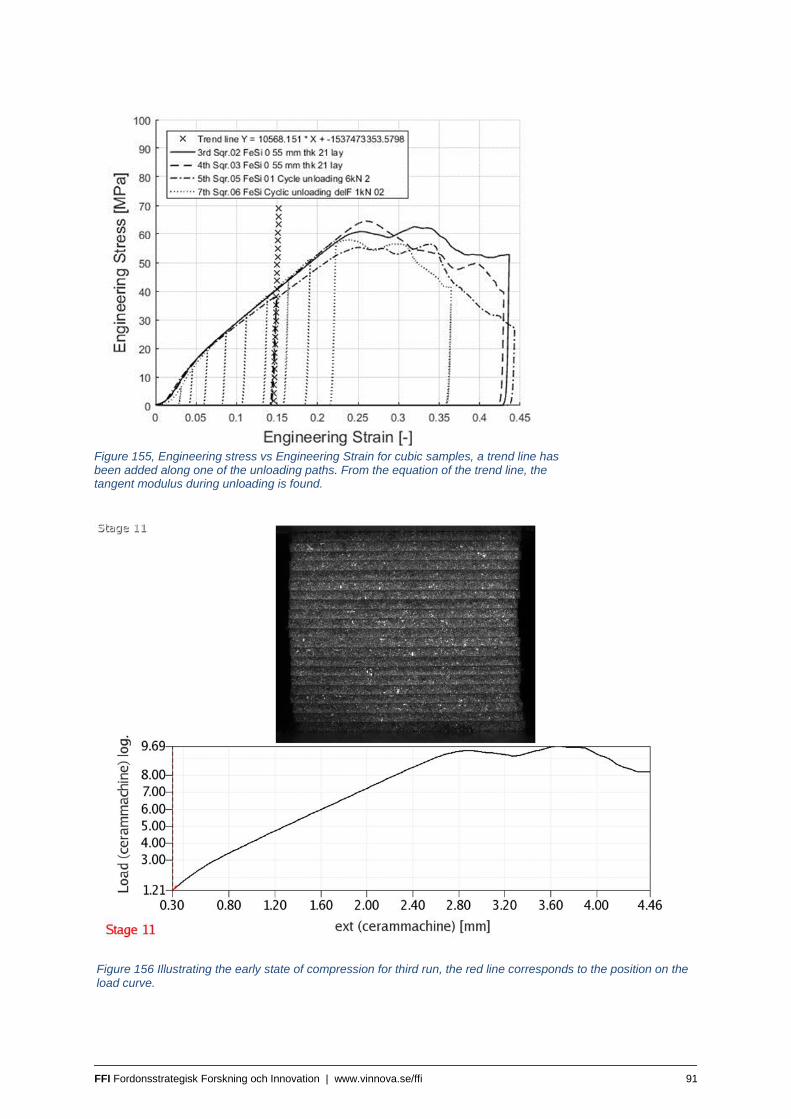
FFI Fordonsstrategisk Forskning och Innovation | www.vinnova.se/ffi 91
Figure 155, Engineering stress vs Engineering Strain for cubic samples, a trend line has been added along one of the unloading paths. From the equation of the trend line, the tangent modulus during unloading is found.
Figure 156 Illustrating the early state of compression for third run, the red line corresponds to the position on the load curve.
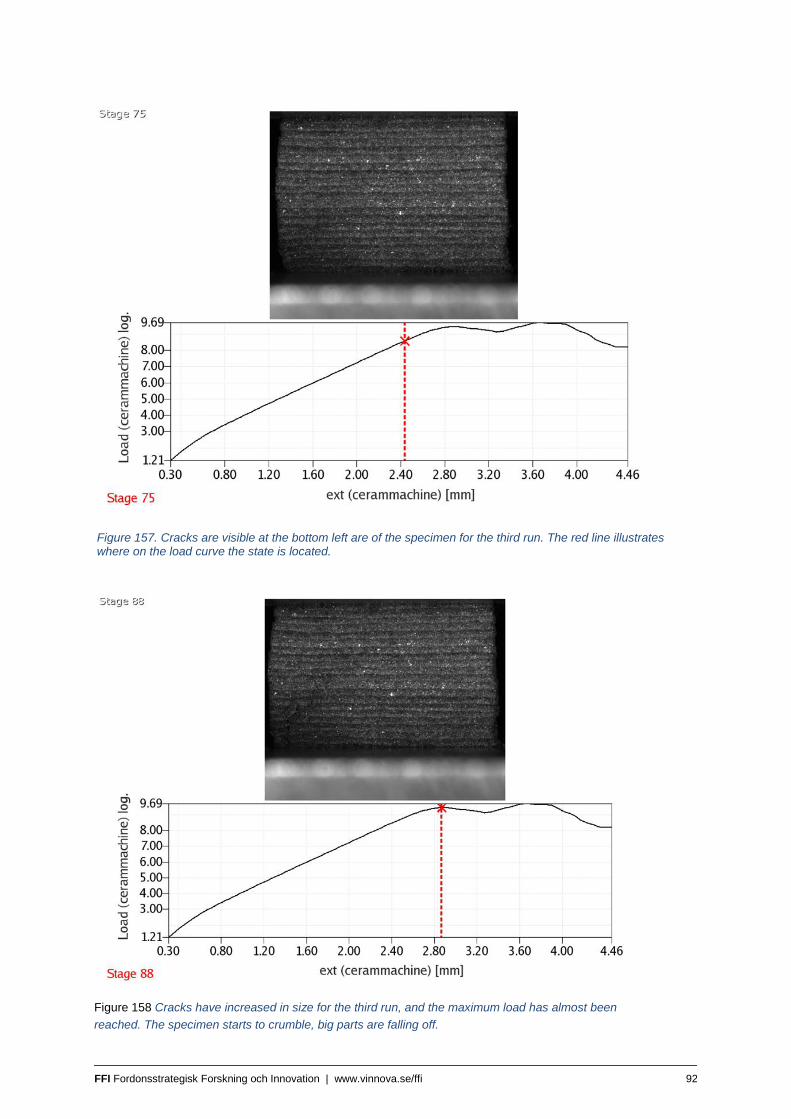
FFI Fordonsstrategisk Forskning och Innovation | www.vinnova.se/ffi 92
Figure 158 Cracks have increased in size for the third run, and the maximum load has almost been
reached. The specimen starts to crumble, big parts are falling off.
Figure 157. Cracks are visible at the bottom left are of the specimen for the third run. The red line illustrates where on the load curve the state is located.
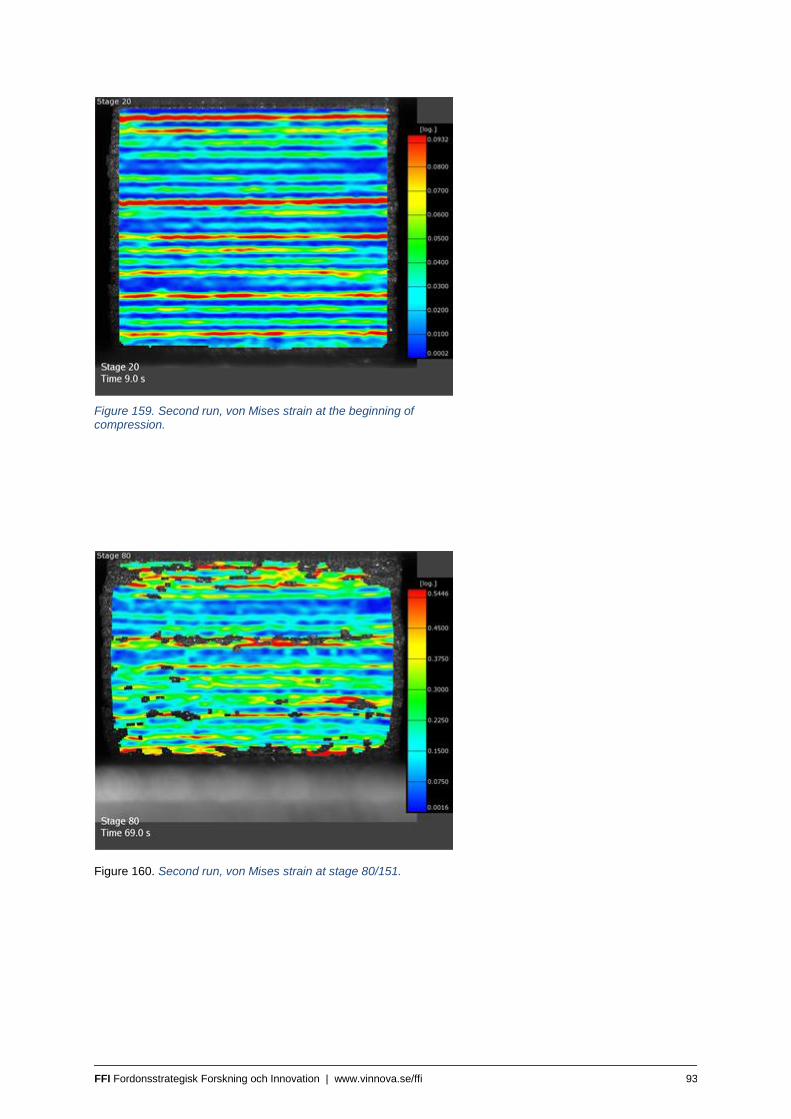
FFI Fordonsstrategisk Forskning och Innovation | www.vinnova.se/ffi 93
Figure 159. Second run, von Mises strain at the beginning of compression.
Figure 160. Second run, von Mises strain at stage 80/151.
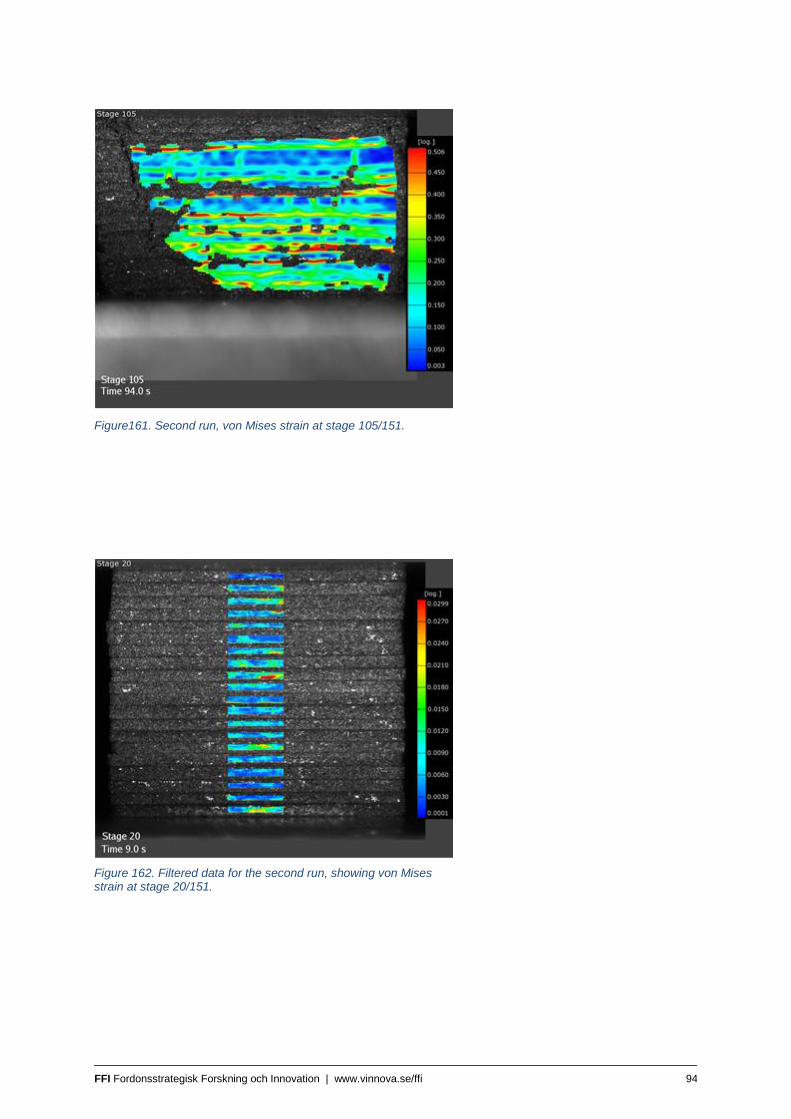
FFI Fordonsstrategisk Forskning och Innovation | www.vinnova.se/ffi 94
Figure161. Second run, von Mises strain at stage 105/151.
Figure 162. Filtered data for the second run, showing von Mises strain at stage 20/151.
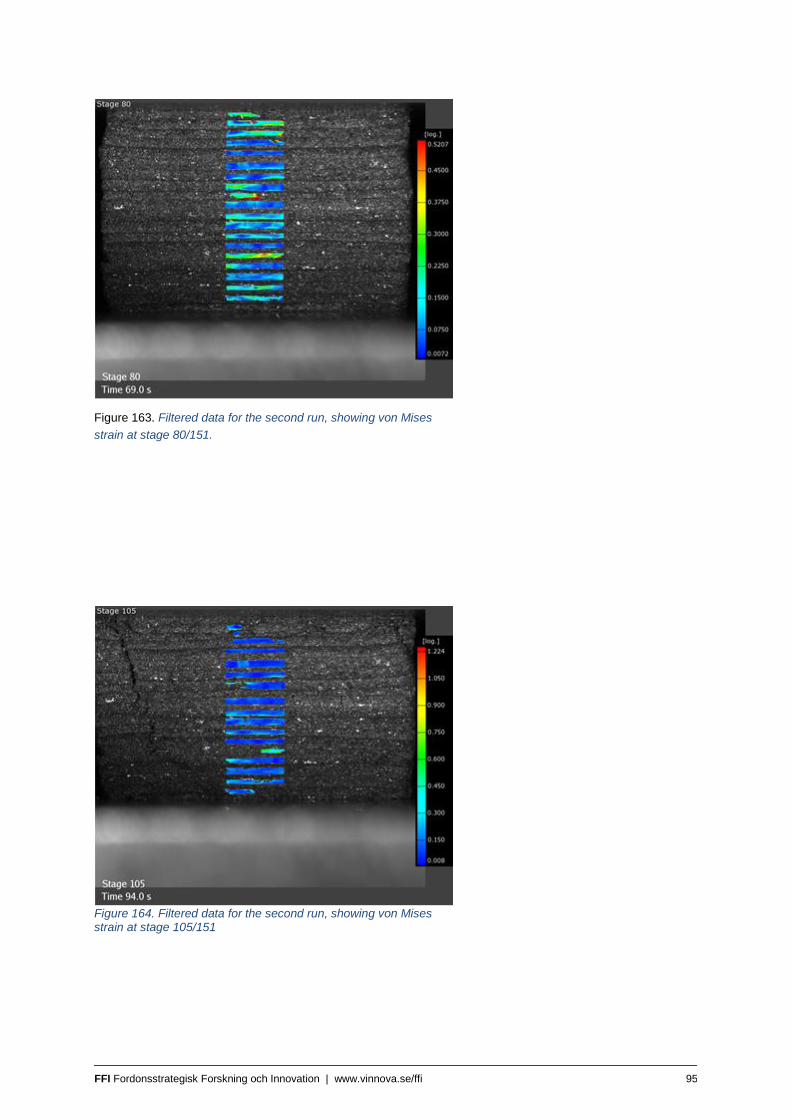
FFI Fordonsstrategisk Forskning och Innovation | www.vinnova.se/ffi 95
Figure 163. Filtered data for the second run, showing von Mises
strain at stage 80/151.
Figure 164. Filtered data for the second run, showing von Mises strain at stage 105/151
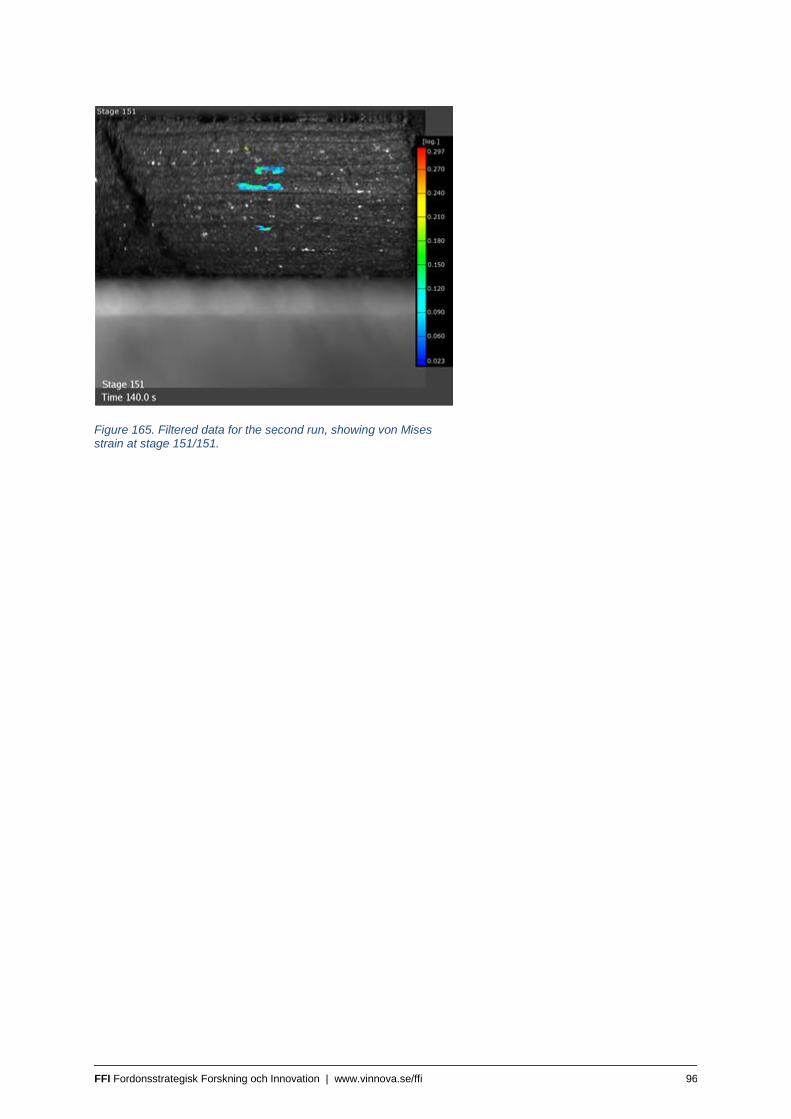
FFI Fordonsstrategisk Forskning och Innovation | www.vinnova.se/ffi 96
Figure 165. Filtered data for the second run, showing von Mises strain at stage 151/151.
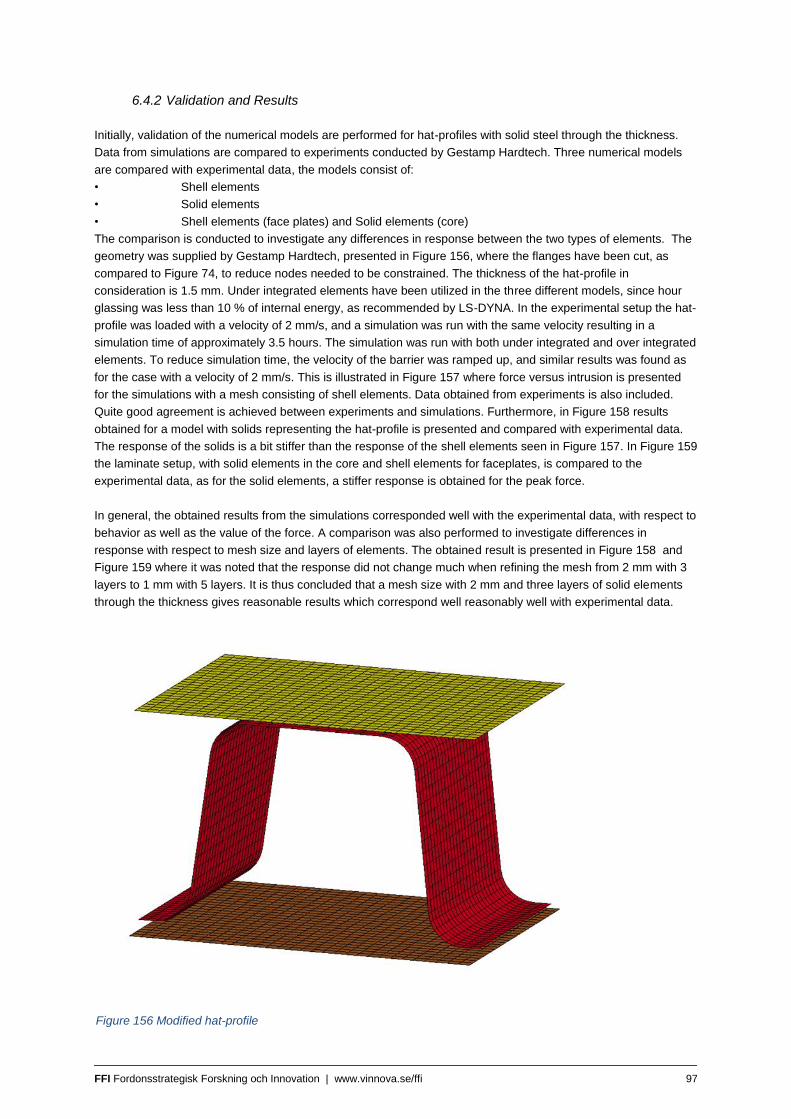
FFI Fordonsstrategisk Forskning och Innovation | www.vinnova.se/ffi 97
6.4.2 Validation and Results
Initially, validation of the numerical models are performed for hat-profiles with solid steel through the thickness.
Data from simulations are compared to experiments conducted by Gestamp Hardtech. Three numerical models
are compared with experimental data, the models consist of:
• Shell elements
• Solid elements
• Shell elements (face plates) and Solid elements (core)
The comparison is conducted to investigate any differences in response between the two types of elements. The
geometry was supplied by Gestamp Hardtech, presented in Figure 156, where the flanges have been cut, as
compared to Figure 74, to reduce nodes needed to be constrained. The thickness of the hat-profile in
consideration is 1.5 mm. Under integrated elements have been utilized in the three different models, since hour
glassing was less than 10 % of internal energy, as recommended by LS-DYNA. In the experimental setup the hat-
profile was loaded with a velocity of 2 mm/s, and a simulation was run with the same velocity resulting in a
simulation time of approximately 3.5 hours. The simulation was run with both under integrated and over integrated
elements. To reduce simulation time, the velocity of the barrier was ramped up, and similar results was found as
for the case with a velocity of 2 mm/s. This is illustrated in Figure 157 where force versus intrusion is presented
for the simulations with a mesh consisting of shell elements. Data obtained from experiments is also included.
Quite good agreement is achieved between experiments and simulations. Furthermore, in Figure 158 results
obtained for a model with solids representing the hat-profile is presented and compared with experimental data.
The response of the solids is a bit stiffer than the response of the shell elements seen in Figure 157. In Figure 159
the laminate setup, with solid elements in the core and shell elements for faceplates, is compared to the
experimental data, as for the solid elements, a stiffer response is obtained for the peak force.
In general, the obtained results from the simulations corresponded well with the experimental data, with respect to
behavior as well as the value of the force. A comparison was also performed to investigate differences in
response with respect to mesh size and layers of elements. The obtained result is presented in Figure 158 and
Figure 159 where it was noted that the response did not change much when refining the mesh from 2 mm with 3
layers to 1 mm with 5 layers. It is thus concluded that a mesh size with 2 mm and three layers of solid elements
through the thickness gives reasonable results which correspond well reasonably well with experimental data.
Figure 156 Modified hat-profile
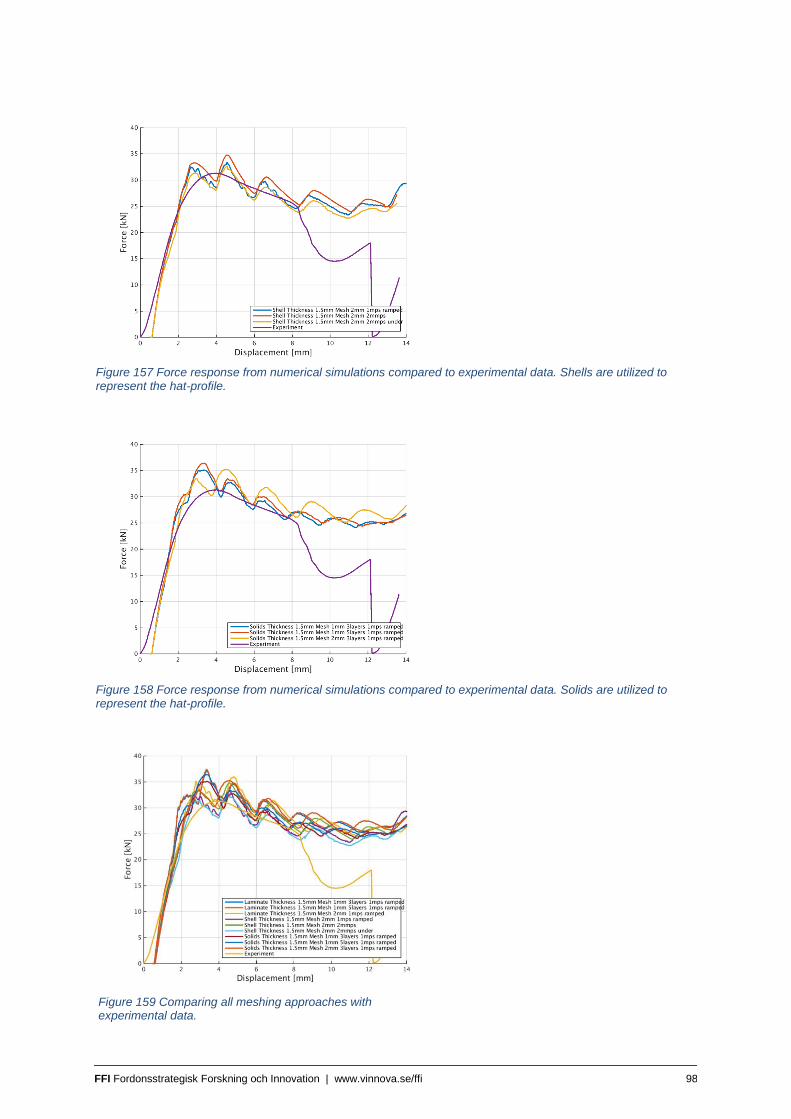
FFI Fordonsstrategisk Forskning och Innovation | www.vinnova.se/ffi 98
Figure 157 Force response from numerical simulations compared to experimental data. Shells are utilized to represent the hat-profile.
Figure 158 Force response from numerical simulations compared to experimental data. Solids are utilized to represent the hat-profile.
Figure 159 Comparing all meshing approaches with experimental data.

FFI Fordonsstrategisk Forskning och Innovation | www.vinnova.se/ffi 99
6.4.3 Conclusions and Discussion
It was found that convergence is achieved for a mesh size of 1 millimeters. However, to increase resolution in the
core of the laminate a mesh size of 0.5 millimeters was adopted. An analysis was performed to find the influence
of the amount of layers used for the solid elements in the core. The simulations show equal response for 4 and 5
layers. Due to this, 4 layers are used since to difference in behavior was found. This also reduces simulation time.
The methodology adopted for simulating laminates seem to be acceptable. In Figure 15, similar response for a
hat-profile consisting of shells, as compared to one using solid elements to represent the core, is obtained.
However, further work will be applied through investigating the impact on the response by the amount of Gauss
points through the thickness. At the moment, equal amounts of Gauss points through the thickness is not used,
perhaps this generate a stiffer response for the solids. Further work is required to model debonding, between core
and face plates, in a satisfactory manner. At the moment shared nodes have been adopted, and so that no
debonding occurs.
Moving from a controlled displacement to ramping up the velocity of the barrier reduces dynamic effects and
makes it possible to use an even coarser mesh than 1 mm for solids and laminates, while still obtaining quite
good results when compared to experiments. This can be seen in Figure 32 - Figure 34. Thus, the models are
quite accurate as well as computationally efficient.
To further predict the behavior of the hat-profile with a porous core, and also the interface between core and face
plates, further work is required. Experiments on the porous core material are required so that the material model,
describing the porous media, can be calibrated. Furthermore, experimental data for the bonding between core
and face plates is required.
As already mentioned, no experiments have been conducted for the porous core material. Therefore the
constitutive model, representing the porous core, is not calibrated. Thus, no meaningful conclusions can be drawn
considering weight saving or energy absorption for the laminate with a porous core. However, a theoretical yield
function has been chosen, where the input data is derived from initial porosity and properties of the solid material.
This yield surface is applied to generate part of the input curves for a porous medium, required for the chosen
constitutive model. The missing parts, at high volumetric strain, is generated from the assumption of how such a
material should behave at full densification. It was assumed that at high volumetric strain, the behavior and
properties of the porous medium should converge towards the behavior of the solid material itself. These
assumptions are deemed physically acceptable, and should not be too far off from the true behavior of the cellular
material.

FFI Fordonsstrategisk Forskning och Innovation | www.vinnova.se/ffi 100
7 Distribution och publication
7.1 Knowledge and result distribution
Hur har/planeras projektresultatet att
användas och spridas?
Markera
med X
Kommentar
Öka kunskapen inom området X Ökad kunskap om kraven på kärna samt bindning
mellan ytterplåtarna och kärnan
Föras vidare till andra avancerade
tekniska utvecklingsprojekt
X Kunskap förs vidare till andra laminatprojekt.
Föras vidare till
produktutvecklingsprojekt
Teknik ej redo.
Introduceras på marknaden Teknik ej redo.
Användas i utredningar/regelverk/
tillståndsärenden/ politiska beslut
7.2 Publications
Two master thesis has been made.
Modelling and analysis of steel laminate with a core based on porous steel material by Samuel Hammarberg
Furnace Brazing of AlSi-coated and Uncoated 22MnB5 steel at austenite temperatures. by Adam Häggqvist
8 Conclusion and continued research Using Ni-based brazing foil and sintered core is not strong enough to hold press hardened outer sheets together to
get the full advantage of a sandwich structure to use in crash situations. However it works on parts with low
deformation to increase the stiffness to weight ration.
The search will continue to find a stronger and more ductile core and stronger joining between the core and the
outer sheets. If that is found a laminate sheet for press hardening will be interesting and would have its share on
the market.
9 Participation partners and contacts
Gestamp Hardtech Lars Wikström [email protected]
Höganäs Shawn Miller [email protected]
Luleå Tekniska Universitet Samuel Hammarberg [email protected]
Luleå Tekniska Universitet Mats Oldenburg [email protected]
Luleå Tekniska Universitet Pär Jonsen [email protected]
Luleå Tekniska Universitet Göran Lindkvist [email protected]
SWEREA KIMAB Tag Hammam [email protected]
SWEREA KIMAB Paul Janiak [email protected]
SWEREA KIMAB Joakim Hedegård [email protected]
FFI Fordonsstrategisk Forskning och Innovation | www.vinnova.se/ffi 101
10 Reference
[1] M. Naderi, ”Hot Stamping of Ultra High Strength Steels,” Aachen, 2008.
[2] H. Nayeb-Hashemi och M. Lockwood, ”The effect of processing variables on the microstructures and
properties of aluminum brazed joints,” Journal of Materials Science, vol. 37, pp. 3705-3713, 2002.
[3] A. Naganathan and L. Penter, "Hot Stamping," Sheet Metal Forming - Processes and Applications, pp.
133-156, 2012.
[4] J. Holmberg, "En sammanfattning av presshärdningsteknologin," Mölndal, 2009.
[5] ArcelorMittal, "Europe product catalogue Automotive," [Online]. Available:
http://automotive.arcelormittal.com/europe/products/UHSS/Usibor/EN. [Accessed 10 February 2015].
[6] H. Engels, O. Schalmin and C. Müller-Bollenhag, "Controlling and Monitoring of the Hot-Stamping Process
of Boron-Alloyed Heat-Treated Steels," in The International Conference on New Development in Sheet
Metal Forming Technology, Stuttgart, 2006.
[7] M. Merklein och M. Lechler, ”Investigation of the Thermo-Mechanical Properties of Hot Stamping Steels,”
J. Mater. Process. Technol., vol. 177, 2006.
[8] M. Nikravesh, M. Naderi and G. H. Akbari, "Influence of hot plastic deformation and cooling rate on
martensite and bainite start temperatures in 22MnB5 steel," Materials Science and Engineering A, vol.
540, pp. 24-29, 2012.
[9] H. Karbasian and A. E. Tekkaya, "A review on hot stamping," Journal of Materials Processing Technology,
no. 210, pp. 2103-2118, 2010.
[10] R. Veit, H. Hofmann, R. Kolleck and S. Sikora, "Investigation of the Phase Formation of AlSi-Coatings for
Hot Stamping of Boron Alloyed Steel," in International Conference on Advances in Materials and
Processing Technologies, Paris, 2010.
[11] A. Ghiotti, S. Bruschi, F. Sgarabotto och P. F. Bariani, ”Tribological performances of Zn-based coating in
direct hot stamping,” Tribology International, vol. 78, pp. 142-151, 2014.
[12] R. Autengruber, G. Luckeneder, S. Kolnberger, J. Faderl and A. W. Hassel, "Surface and Coating Analysis
of Press-Hardened Hot-Dip Galvanized Steel Sheet," Steel Research int., vol. 83, no. 11, pp. 1005-1011,
2012.
[13] B. P. Burton and P. Perrot, in Phase Diagram of Binary Iron Alloys, OH, Materials Park, OH: ASM
International, 1993, p. 459.
[14] J. Kondratiuk, P. Kuhn, E. Labrenz och C. Bischoff, ”Zinc coatings for hot sheet metal forming:
Comparison of phase evolution and microstructure during heat treatment,” Surface & Coatings
Technology, vol. 205, pp. 4141-4153, 2001.
[15] M. Windmann, A. Röttger and W. Theisen, "Formation of intermetallic phases in Al-coated hot-stamped
22MnB5 sheets in terms of coating thickness and Si content," Surface & Coatings Technology, vol. 246,
pp. 17-25, 2014.
[16] M. Windmann, A. Röttger and W. Theisen, "Phase formation at the interface between a boron alloyed
steel substrate and an Al-rich coating," Surface & Coating Technology, vol. 226, pp. 130-139, 2013.
[17] "Handbook - Brazing & Soldering," [Online]. Available:
http://www.esabna.com/euweb/oxy_handbook/589oxy19_1.htm. [Accessed 4 March 2015].
[18] Kohlweiler, W; BrazeTec GmbH, [Online]. Available:
http://www.brazetec.us.com/en/brazingCenter/aus_der_loetpraxis/show_brazing_aluminium.pdf.
[Accessed 4 March 2015].
[19] A. Belohlav, "Understanding Brazing Fundamentals," American Welding Society, [Online]. Available:
http://www.aws.org/wj/amwelder/9-00/fundamentals.html. [Accessed 4 March 2015].
[20] A. Kenneth, "Solving the Problems Inherent to Torch Brazing Aluminum," Welding Journal, pp. 39-40,
2009.
[21] ”Aluminium Brazing,” [Online]. Available: http://www.aluminium-
brazing.com/sponsor/nocolok/Files/PDFs/Dictionary.pdf. [Använd 4 March 2015].

FFI Fordonsstrategisk Forskning och Innovation | www.vinnova.se/ffi 102
[22] Y. Baskin, ”How to select a brazing flux,” [Online]. Available: http://www.silversmithing.com/1flux.htm.
[Använd 27 July 2015].
[23] J. Zähr, H.-J. Ullrich, S. Oswald, M. Türpe and U. Füssel, "Analyses about the influence of natural oxide
layer of aluminium on the brazeability in shielding gas furnace," Weld World, vol. 57, no. 4, pp. 449-455,
2013.
[24] D. Hawksworth and A. Gray, "The Influence of Silicon Particle Morphology on the Melting Mechanism of
Aluminium Brazing Sheet," in Vehicle Thermal Management Systems Conference and Exhibition, Toronto,
2005.
[25] "Aluminium Brazing," [Online]. Available: http://www.aluminium-brazing.com/2010/09/cladding-alloys/.
[Accessed 4 March 2015].
[26] T. H. Chuang, M. S. Yeh, L. C. Tsao, T. C. Tsai and C. S. Wu, "Development of a Low-Melting-Point Filler
Metal for Brazing Aluminum Alloys," Metallurgical and Materials Transactions A, vol. 31A, pp. 2239-2245,
2000.
[27] G. Zhang, Y. Bao, Y. Jiang and H. Zhu, "Microstructure and Mechanical Properties of 6063 Aluminum
Alloy Brazed Joints with Al-Si-Cu-Ni-Re Filler Metal," Journal of Materials Engineering and Performance,
vol. 28, no. 8, pp. 1451-1456, 2011.
[28] D. Zenkert, in An Introduction to Sandwich Structures Student Edition, Stockholm, 2005, pp. 1.1-1.4.
[29] "Nautic Expo," [Online]. Available: http://www.nauticexpo.com/prod/ayres-composite-panels/sandwich-
panels-honeycomb-aluminum-28043-189246.html. [Accessed 3 March 2015].
[30] "Altair Enlighten," [Online]. Available: http://altairenlighten.com/2012/07/sandwich-structures/. [Accessed 3
March 2015].
[31] D. Zenkert, in An Introduction to Sandwich Structures Student Edition, Stockholm, 2005, pp. 3.1-3.9.
[32] D. Zenkert, in An Introduction to Sandwich Structures Student Edition, Stockholm, 2005, pp. 4.1-13.28.
[33] N. N, ”USIBOR 1500 precoated,” Arcelor, 2003.
[34] ArcelorMittal, ”ArcelorMittal Automotive Worldwide,” [Online]. Available:
http://automotive.arcelormittal.com/europe/products/alusi/alusi_general_points/EN. [Använd 27 May
2015].
[35] ”VITROBRAZE Amorphous Brazing Foils,” [Online]. Available:
http://www.vacuumschmelze.de/fileadmin/documents/pdf/fipublikationen/FA_VITROBRAZE.pdf. [Använd
27 July 2015].
[36] D. Kopeliovich, ”Adhesion tests,” 3 May 2014. [Online]. Available:
http://www.substech.com/dokuwiki/doku.php?id=adhesion_tests. [Använd 18 May 2015].
[37] M. K. Abou Khatwa och D. V. Malakhov, ”On the thremodynamic stability of intermetallic phases in the
AA6111 aluminum alloy,” Computer Coupling of Phase Diagrams and Thermochemistry, vol. 30, nr 2, pp.
159-170, 2006.
[38] M. Windmann, A. Röttger, H. Kügler, W. Theisen och F. Vollertsen, ”Laser beam welding of aluminum to
Al-base coated high-strength steel 22MnB5,” Journal of Materials Processing Technology, vol. 217, pp.
88-95, 2015.
[39] J. Lacaze, S. Tierce, M. -C. Lafont, Y. Thebault, N. Pébère, G. Mankowski, C. Blanc, H. Robidou, D.
Vaumousse and D. Daloz, "Study of the microstructure resulting from brazed aluminium materials used in
heat exchangers," Materials Science and Engineering A, vol. 413 and 414, pp. 317-321, 2005.
[L1] LS-DYNA Keyword User's Manual VOL II, Livermore, California , 2013.
[L2] F. Bartl, H. Klaus, R. Dallner and O. Huber, "Material behavior of cellular composite undergoing large
deformations," International journal of impact engineering, vol. 36, 2009.
[L3] T. C. Triantafillou and L. J. Gibson, "Constitu," Constitutive Modeling of Elasti-Plastic Open-Cell Foams, vol.
116, 1990.
[L4] L. J. Gibson and M. F. Ashby, Cellular solids, Cambride: Cambride , 2001.

FFI Fordonsstrategisk Forskning och Innovation | www.vinnova.se/ffi 103
[L5] H. Mattsson and K. Axelsson, "A METHOD TO CORRECT YIELD SURFACE DRIFT IN SOIL PLASTICITY
UNDER MIXED CONTROL AND EXPLICIT INTEGRATION," International Journal for Numerical and
Analytical Methods in Geomechanics, vol. 21, pp. 175-197, 1997.
[L6] LS-DYNA, "LS-DYNA Keyword User's Manual VOL I," 2013.
[L7] V. S. Deshpande and N. A. Fleck, "Isotropic constitutive models for metallic foams," Journal of the Mechanics
and Physics of Solids, vol. 48, pp. 1253-1283, 2000.
[L8] Y. Zhang, G. Sun, X. Xu, G. Li, X. Huang, J. Shen and Q. Li, "Identification of material parameters for
aluminum foam at high strain rate," Computational Materials Science, vol. 74, pp. 65-74, 2013.


