
Unclassified ECO/WKP(98)1
Organisation de Coopération et de Développement Economiques OLIS : 13-Feb-1998Organisation for Economic Co-operation and Development Dist. : 23-Feb-1998__________________________________________________________________________________________
English text onlyECONOMICS DEPARTMENT
ECONOMICS DEPARTMENTWORKING PAPERSNo. 188
ASSET PRICES AND MONETARY POLICY
byMike Kennedy, Angel Palerm, Charles Pigott and Flavia Terribile
61961
Document complet disponible sur OLIS dans son format d'origine
Complete document available on OLIS in its original format
Unclassified
EC
O/W
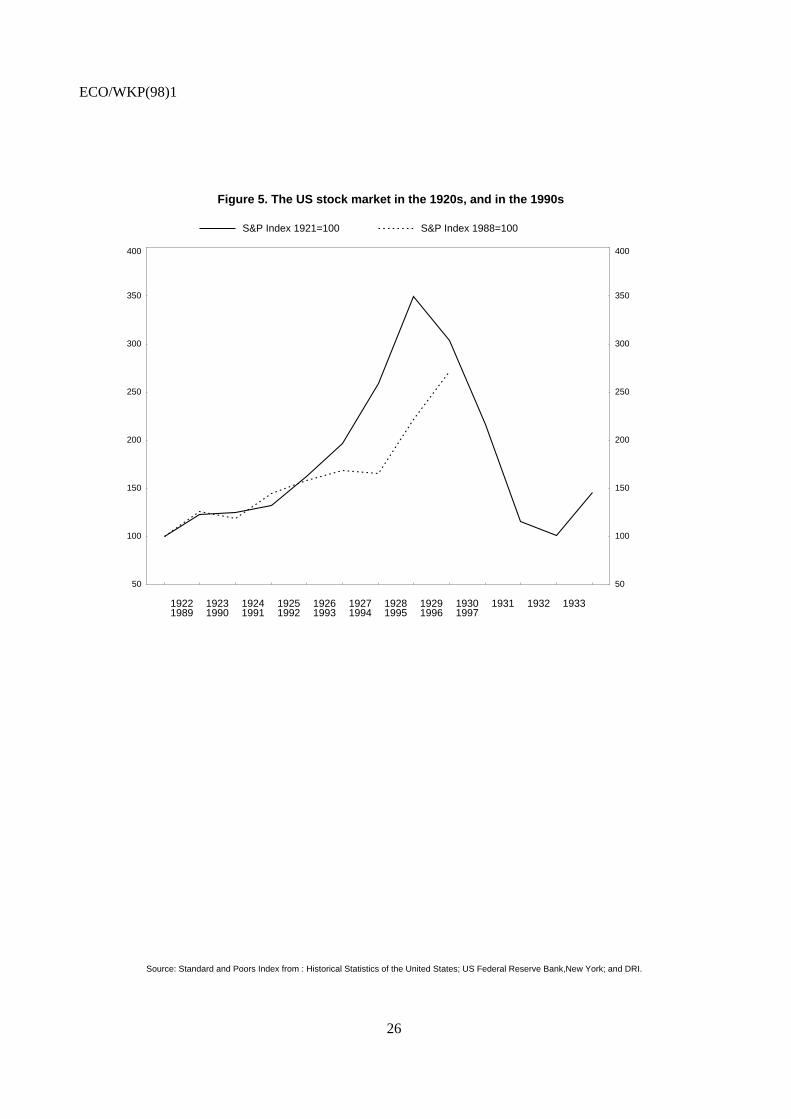
KP
(98)1 E
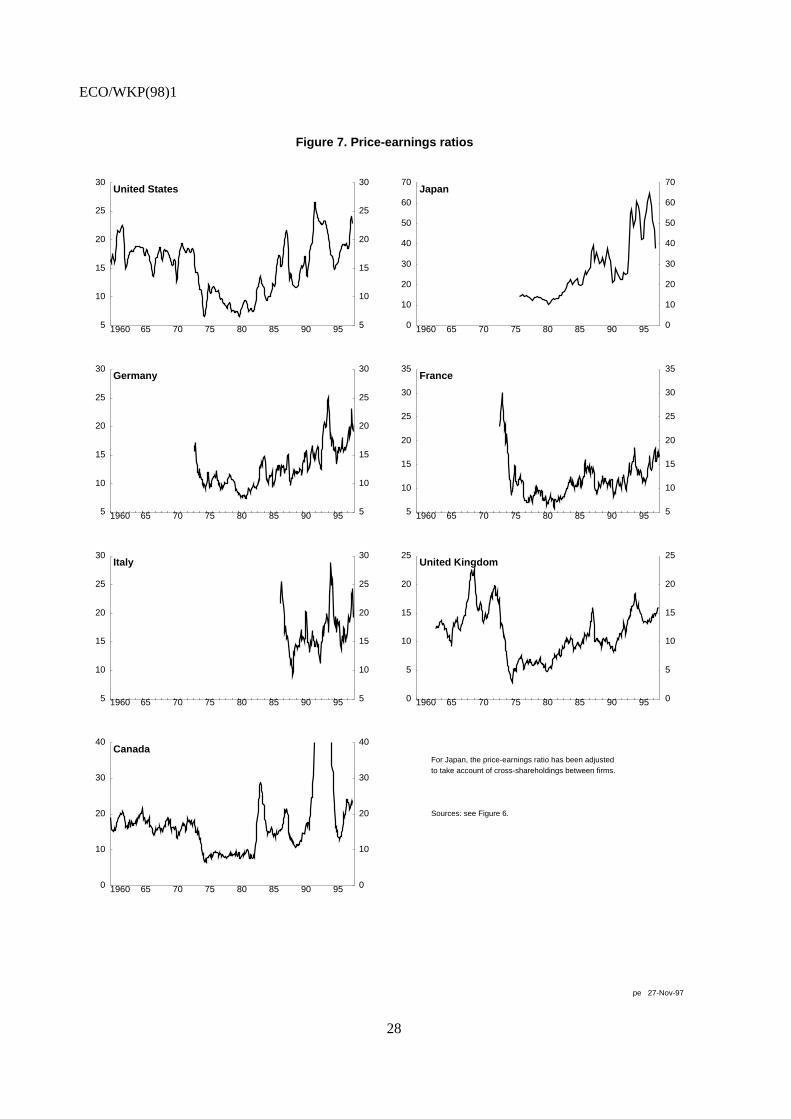
nglish text only
Most Economics Department Working Papers beginning with No. 144 are now available through OECD'sInternet Web site at http://www.oecd.org/eco/eco.

ECO/WKP(98)1
2
ABSTRACT/RÉSUMÉ
In this paper, the authors analyse the role of asset market prices in the formation of monetarypolicy with particular reference to equity markets, a concern for policy makers in the late 1990s. Whileasset prices have potentially valuable supplementary information for monetary policy makers, they arehard to interpret because of their inherent volatility. Dilemmas arise when asset price movements arelarge and there are no signs of inflation pressures. Waiting until speculative pressures run their courserisks both contagion to other sectors and assets and potentially damaging fallout from a correction.Tightening monetary policy in these circumstances (perhaps to avoid potential fallout on other sectors)would be difficult to justify to the public. In the current situation of low inflation (late 1997), variousvaluation measures suggest that equity markets are over-valued in the United States, Canada and Italy.Other countries are either at more intermediate positions (Germany and the United Kingdom) or close tocalculated equilibrium values. If there were to be a correction of the same order of magnitude as occurredin October 1987 (20 per cent) output growth could be lowered in the OECD area by 1/2 a per cent overthis year and next, assuming no adverse effects on confidence.
****
Dans cet article les auteurs analysent le rôle des prix du marché des actifs dans le développementd'une politique monétaire étroitement liée au marché des capitaux, préoccupation des décideurs de la findes années 90. Bien que les prix des actifs représentent une information de valeur pour les responsables dela politique monétaire, ils sont difficilement interprétables du fait de leur volatilité inhérente. Lesproblèmes surgissent quand les mouvements des actifs sont importants alors qu'il n'y a pas de signe depoussée inflationniste. Attendre que les pressions spéculatives suivent leur cours comporte un risque decontagion pour les autres secteurs et actifs et peut nuire aux retombées d'une éventuelle correction.Resserrer la politique monétaire dans ces conditions (afin peut-être d'éviter de possibles retombées surd'autres secteurs) serait difficile à justifier face au public. Dans la situation actuelle de faible inflation (fin1997) plusieurs mesures d'évaluation laissent à penser que le marché des actions est surévalué aux Etats-Unis, au Canada et en Italie. Les autres pays sont plus ou moins dans une situation intermédiaire(l'Allemagne et le Royaume-Uni) ou proche des valeurs calculées d'équilibre. S'il devait y avoir unecorrection de même ampleur que celle d'octobre 1987 (20%), les perspectives de croissance dans la zonede l'OCDE pourraient diminuer d'un demi point de pourcentage cette année et l’année suivante, àcondition que la confiance ne soit pas négativement affectée.
Copyright: OECD 1998Applications for permission to reproduce or translate all, or part of, this material should be madeto: Head of Publications Service, OECD, 2 rue André-Pascal, 75775 PARIS CEDEX 16, France.

ECO/WKP(98)1
3
Table of Contents
I. Introduction.............................................................................................................................4
II. The role of asset prices in monetary policy formulation........................................................5
Experiences with asset prices as indicators of inflation.........................................................6
Systemic problems that have resulted......................................................................................7
III. The situation in equities markets.............................................................................................8
IV. Possible consequences of a large correction..........................................................................11
Bibliography..........................................................................................................................................14
Tables and figures.................................................................................................................................16

ECO/WKP(98)1
4
ASSET PRICES AND MONETARY POLICY
Mike Kennedy, Angel Palerm, Charles Pigott and Flavia Terribile1
I. Introduction
1. The current high levels of equity prices in all major markets, with the important exception ofJapan (Figure 1), have given rise to a view that stock prices are over-valued and vulnerable to a largecorrection2. At the same time, the volatility of equity markets has been increasing (Figure 2)3 and pricesseem to have become very sensitive to economic news. This paper basically focuses on some issuesrelated to using asset prices in monetary policy formulation with a particular focus on equity markets inthe current situation. The plan of the paper is first to examine the selected lessons from the historicalexperience with asset price movements (Section II) and then to attempt to identify some key forces actingon equity prices in the current situation (Section III) and the possible implications of a correction(Section IV).
2. Below are the main findings:
On the role of assets prices in monetary policy formulation in general
− Asset price movements are potentially helpful as supplementary indicators of inflationpressures. However, developments in these markets are hard to interpret and, at times, tooambiguous to serve as a formal guide to policy. Nonetheless, sharp rises in asset prices haveat times served to confirm the message from other indicators.
− Situations in which large asset price changes raise risks of systemic problems or otherdamage to the real economy, while relatively uncommon, are more problematic.Historically, large and sustained declines have proved the most damaging. Waiting untilspeculative forces have run their course risks contagion effects to other sectors or assets,potentially worsening the eventual fall-out from the correction. In the absence of well-perceived general inflation pressures, the authorities are likely to find it difficult to explainand justify a pre-emptive policy tightening, even one that could potentially limit the falloutfrom a correction.
1. The authors would like to thank Ignazio Visco, Michael Feiner, Martine Durand and Jorgen Elmeskov for
many helpful comments and suggestions. Thanks are also due to Laure Meuro for statistical assistance andto Paula Simonin for secretarial skills. The views expressed in this paper are those of the authors and arenot necessarily shared by the OECD.
2. See, for example, “Cliff-hanger on Wall Street”, The Economist, 1-7 November 1997, pp. 85-86 for asummary of views.
3. Implied volatility is calculated from options prices.
ECO/WKP(98)1
5
On the role of current equity prices in particular
− In the current situation, valuation measures of equity markets appear to be at extreme levelsin the United States, Italy and Canada. Germany and the United Kingdom are moreintermediate cases, while valuation measures appear to be close to calculated equilibriumvalues in France and Japan. The large increases in equity prices in these countries occurredagainst a background of low and stable inflation, as was the case in Japan during the latterhalf of the 1980s. But, unlike Japan in that period, they as yet do not seem to have spread toother asset markets or to be associated with excessive debt accumulation or over investmentin real assets.
− Estimates based on rules of thumb from the Secretariat’s INTERLINK model indicate thatthe direct effects of a 20 per cent stock market correction on GDP growth in OECDeconomies, if it were to occur now, would lower output in the area by about half of a per centin the next two years (with most of its effect distributed over the second year). The largesteffects are on the United States, Japan and Canada respectively. This ignores possibly largeconfidence effects, especially on capital accumulation. The fallout on the financial systemsof countries is likely to be largest in Japan.
− The issue for monetary policy in those countries where output gaps have been closed iswhether to tighten in the near term to contain incipient inflation pressures or to wait forbetter indications of their existence. The possible negative effect of a prospective stockmarket correction will have to be taken into account but itself does not shift the balance ofrisks. In those countries that still have significant output gaps and fragile recoveries, theneed is to continue to support activity and to be prepared to offset any negative spilloversfrom an equity market correction in the United States.
II. The role of asset prices in monetary policy formulation4
3. By now it is widely accepted that the longer-run goal of monetary policy is price stability;policy responses to asset prices will depend on their effects on that goal. Large increases in asset pricesthat could potentially spill over into excessive demand growth with inflationary consequences, or thatwere an indication of an overly accommodative monetary policy, would be a concern since they wouldcontain information relevant to the central bank’s inflation objective. However, there are considerabledifficulties in interpreting the information content of asset prices in this context. To begin with, assetprices are influenced a great deal by expectations about a range of factors concerning futuredevelopments, as well as risk premia which can vary considerably but whose determination is poorlyunderstood. Depending on its cause, any given movement in asset prices can call for quite differentmonetary policy responses: for example an exchange rate appreciation implies monetary easing if it raisesthe prospects that domestic inflation pressures will ease; but calls for unchanged policy if the cause is arise in inflation abroad. For these reasons central banks generally have been reluctant to make regular5 orformal use of asset prices in policy formulation. At the same time, there are occasions when authoritiesdo need to pay close attention to the potential consequences of asset price movements. These instances
4. Reviews of these issues are contained in Borio, Kennedy and Prowse (1994) and Smets (1997).
5. An exception is the Bank of Canada which takes account of exchange rate movements in deciding thestance of monetary policy. But even in this case, judgement is employed in discerning what are theunderlying factors behind any change.

ECO/WKP(98)1
6
fall into two classes: one is when such movements can be interpreted as fairly clear indications of a build-up of inflation pressures; the other is when there is a serious risk that a run up, even if not caused bymonetary policy and even if not obviously the result of unsustainable speculative booms or “bubbles”, willresult in a severe contraction that could lead to systemic financial problems or other major disruptions tothe real economy.
Experiences with asset prices as indicators of inflation
4. The use of asset prices as indicators of future inflation is not straightforward. Exceptions maybe the experience of several Nordic countries and the United Kingdom during the 1980s when some assetprices, such as real estate, rose by well over 100 per cent (Figure 3) indicating that monetary policy wasexcessively expansionary and that inflationary pressures were present. However, there were ample othersigns of these conditions, including real growth in excess of potential, accelerating price and wageincreases and an exceptionally rapid expansion of credit. Thus the asset price movements themselveslargely confirmed other indicators. Moreover the asset price increases were greatly amplified by financialderegulation which expanded access to credit and heightened competitive pressures in the financialindustry; the effects were further reinforced by tax incentives encouraging borrowing and the leveragedacquisition of real assets (whose effects were magnified by inflation); and by inadequacies in regulatoryoversight.
5. There also have been cases in which over-emphasis on asset price movements has led toproblems in monetary policy formulation. An example here is the attempt by the Bank of England to limitthe appreciation of Sterling during the latter 1980s. This policy was a factor leading to an overly easymonetary policy stance that resulted in a run up in inflation. Its subsequent containment produced a majorrecession. Attempts by the Bank of Japan to limit yen appreciation after 1985, by allowing nominalinterest rates to continue to fall, at least helped delay monetary tightening that, in retrospect, probablyshould have begun earlier6.
6. However, Japan’s experience during the latter 1980s is complex. It is often cited as a clear casewhere domestic asset price movements, in real estate and equity markets, seemed to signal that monetarypolicy was overly expansionary. It did turn out ex post that growth was overly rapid in relation topotential. Moreover, the strong growth in capital spending did create extensive excess capacity thatbecame apparent with the onslaught of recession. However, the degree to which these developmentsreflected overly expansionary monetary policy, particularly given that they did not spill over into generalinflation, remains unclear even ex post7. The signals provided by the asset market run ups at the time wereeven less clear given that there seemed to be a range of factors unrelated to monetary policy at workincluding: expanded access to credit arising from financial deregulation; increased incentives by banks tolend to real estate and to acquire stocks to boost profit margins that were being eroded by competition;and the increased access by banks’ corporate customers to international financial markets. Moreover,large run ups in land prices had also occurred during the 1960s and 1970s and could be explained in partby the pressure of expanding demand on limited and highly inelastic land supplies; while the strength incapital spending could be partly explained by a need to rebuild capacity following the relative weakness ofinvestment earlier in the decade and during the latter half of the 1970s8. For these reasons, asset price
6. See Shigehara (1997).
7. See Hutchinson (1994).
8. See Harris and Pigott (1997).
ECO/WKP(98)1
7
movements themselves do not seem to have provided a reliable ex ante signal about monetary policy evenin this case, and may have been saying more about structural problems.
Systemic problems that have resulted
7. Nonetheless, the monetary authorities cannot always ignore major asset price run ups. This isparticularly the case when such events encourage excessive debt accumulation or other imbalances that inthe event of a contraction would threaten to lead to severe balance sheet retrenchments and other adversefinancial repercussions. The potential risks are especially evident when the banking system becomes overexposed to asset markets. In principle, authorities need to take account of these potential consequences inassessing economic prospects. History has not, however, provided any clear guidelines as to theappropriate response in the face of such asset price run ups, or how they can deal with the consequencesand constraints on policy that may arise if and when a contraction does occur. There is, as well, theinherent difficulty in establishing well-defined guidelines inasmuch as the pace of innovation in financialinstruments continues to alter the exposure of inter-related parties and the nature of the systemic risksinvolved.
8. The rapid rise of equity prices during the 1920s, and their subsequent crash in 1929 (Figure 4), isfrequently cited as an example of the dangers of speculative excesses. It is also an illustration of thedifficulties involved in focusing on asset prices for monetary policy. At the time it was difficult tounderstand what was driving prices. There were arguments for a fundamental explanation of the stockmarket boom9 which held that the rise in stock prices would have been justified by continued economicgrowth led by technological and structural changes in industry. On the other hand, most historians haveargued that a bubble had developed in the stock market during the rapid growth of the 1920s. A change infundamentals may have initiated the boom, but they were probably not the sustaining force10.
9. In the immediate aftermath of the 1929 crash, the New York Fed intervened in order to supportthe financial system and to try to confine the problem to the equities markets11. While this wasappropriate, the Board’s later concern about the possible revival of speculative excesses has been cited asthe reason why policy failed to lend enough support to the economy. By not expanding the money supplysufficiently, the Federal Reserve Board effectively acquiesced in the long deflation from 1929 to 1933which a less restrictive monetary policy might have curtailed. The failure of the Fed to support thebanking system certainly exacerbated the banking crisis in 1931 and 193312. In contrast, is the policyresponse to the 1987 stock market corrections. The immediate reaction of the monetary authorities hasbeen widely perceived as having been appropriate; potential systemic risks were contained, helping toensure that any problems were confined just to equity markets. However, in retrospect, the easing inresponse to the crash may have persisted for too long, contributing to the subsequent acceleration ininflation in many countries.
10. The 1980s asset price booms presented authorities in many countries with no less a set ofproblematic choices. It is clear in retrospect that the real estate price booms in the United Kingdom andNordic countries were leading to over accumulation of debt and real estate assets by households. As well,
9. See Fisher (1930) and Sirkin (1975).
10. See Galbraith (1954); and White (1990).
11. See Friedman and Schwartz (1963).
12. See US Government (1988).
ECO/WKP(98)1
8
in the Nordic countries, bank exposures to real estate were becoming excessive. Likewise in Japan, thestock and real estate markets were becoming overvalued and were at risk of a substantial correction. Inretrospect, the corrections of the asset price run ups in these cases led to prolonged recessions, aggravated,except in the United Kingdom, by very severe banking sector problems. The United States did notundergo nearly as large a nation-wide asset price boom, but it did experience rapid household debtaccumulation and a rise in problem bank loans to commercial real estate. The excessive debt in this case,along with banking sector problems, did lead to retrenchments that slowed the recovery from the 1990recession. In the United States, and considerably more so in Japan, the banking sector problems increaseduncertainties about the impact of monetary policy and, especially in Japan, seem to have blunted itsimpact13. If these consequences could have been reliably foreseen, monetary policy should have beentighter than it was, or at least tightened earlier14.
11. Such ex post judgements, however, seriously understate the true policy uncertainties, dilemmasand constraints. As noted earlier, the factors behind the asset market run ups were far from clear ex ante,nor was it clear if, or to what extent, they would need to be reversed. For example, household financialassets and their capacity to service debt had also been increased by financial liberalisation; hence thedegree to which debt accumulations had become a severe problem became clear only with the onset ofrecession. Much, if not all, of the stock market run ups during the latter 1980s, including in Japan for alarge part of that period, seemed justifiable in view of the strong economic expansions underway and, inmost countries, improved inflation performances. Nor was it clear that even a large reversal in assetmarkets would have significant effects on the real economy; this view was somewhat encouraged by the1987 crash whose real effects were much milder than feared. Tightening monetary policy to counter assetprice movements thus risked prematurely interrupting economic expansions that seemed sustainable andwhich had not, as yet, led to any overt inflation pressures. Authorities also faced the risk that suchtightening would precipitate the very contraction and its repercussions that were feared; whereas waitingmight allow a more gradual correction that would cause less of a problem. Moreover policy aimed atcountering asset price movements, driven in large part by factors outside its traditional scope, or toprevent banking sector problems normally the responsibility of prudential authorities, would have beendifficult to explain and could have undermined transparency and public confidence in monetaryauthorities.
III. The situation in equities markets
12. At present, it is developments in stock markets that are of most concern. The long run-up in theUS stock market (Figure 5) and the spread of this strength to many other countries has invitedcomparisons with the 1920s. At that time, the surge in asset values was seen, in part, as a reflection ofimproved fundamentals in a “new age” in which technology and modern management techniques of largescale commercial and industrial enterprises would ensure rapid growth in earnings. The process wasassisted by developments in the securities markets, such as the establishment of investment trusts andcommercial banks’ securities affiliates. The current US equity market has been characterised by optimism
13. Shigehara (1997).
14. For a review of the experiences and problems with financial market reform, in particular the failure of theregulatory and prudential systems, see Edey and Hviding (1995); Harris and Pigott (1997) and OECD(1997).

ECO/WKP(98)1
9
about the future because of the promised rewards of technological change and the “new” economy15.Technology stocks have been among the best performers in the current US market. The drops intransactions costs for smaller investors plus the proliferation of new types of mutual funds followingfinancial market deregulation have also been cited as factors contributing to the boom.
13. Developing an appropriate monetary policy response depends in part on the implications forprice stability, and in part on whether or not equity prices are over valued and at risk of a large enoughcorrection to have disruptive effects. By the end of 1997, the rise in equity prices in various countries didnot appear to have spilled over into other assets (land or housing). Indeed, the recent inflationperformance of all countries has been very good, even in those where excess capacity has largelydisappeared. The question of an appropriate response depends then on an evaluation of the sustainabilityof equity prices and the implications of a correction for the economy.
14. Commonly used valuation measures to address these questions for equities markets are thedividend-price and the price-earnings ratios. Taking historical averages as a benchmark (Table 1), thedividend-price ratio for the United States and a number of other countries is very low (Figure 6) whileprice-earnings ratios are at the high end (Figure 7) of experience over the past two to four decades. Suchlow levels of the dividend yield could be signalling that the total returns to holding equity over longhorizons will also be low16. The question is whether market participants are willing to accept low returnsover a longer horizon17. If not, there is a risk of a correction.
15. Another way of looking at this is to start from the premise that, in equilibrium, the dividend-price ratio (D/P) is determined by the riskless real rate of interest (r) and the equity premium (σ) less theexpected growth rate of real dividends (g). Assuming that dividends are a constant fraction of earnings inequilibrium, then g could be thought of as real earnings growth as well. This is a variant of the “Gordon”formula18:
(1) D/P = r + σ − g.
The equity premium is a measure of the extra return required by investors to purchase stocks inrecognition of their risk. The required return on equity is the sum of the real interest rate plus thispremium. An equally simple formula for the equilibrium price-earnings ratio (P/E) can be developedfrom equation (1). Assume that in equilibrium the value of the pay-out ratio (the amount of earnings paidout as dividends) is a constant fraction of earnings and call it ν. Then the price-earnings ratio should be:
(2) P/E = ν/( r + σ − g).
15. In a Louis Harris and Associates poll of mutual fund investors published in April 1997, 75 per cent of the
respondents thought that future returns would be equal to, or above, returns experienced in the past decade.See Easton (1997).
16. See Fama and French (1988).
17. In the United States, investors could be receiving dividends in the form of capital gains (through share buybacks), which would have a more favourable tax treatment. This could be one reason for the observed lowdividend yield. Cole and Helwege (1996) have adjusted the US data for this effect and find that thedividend yield is still low. No such adjustments to the data are made here.
18. See Gordon (1962).

ECO/WKP(98)1
10
16. If the required return on equity has fallen for fundamental reasons, the current values of thedividend-price and the earnings-price ratio could be sustainable. On the other hand, strong earningsgrowth could equally be consistent with current low dividend-price ratios as long as this growth weresustainable. The price-earnings ratio (and by extension the price of equity) is sensitive to changes in anyof these variables. For example, in the United States, as of late 1997 the difference between the price-earnings ratio of about 24 and its historical average of 15 could be explained by a difference in the riskpremium of only one percentage point ceteris paribus (Figure 8). A change in real earnings growth or thereal rate of interest of that magnitude would have the same effect.
17. The Gordon formula (equation 1) can be used to make some illustrative calculations of potentialovervaluation. One way to proceed is to use historical averages of the key variables and calculate theimplied value of the equilibrium dividend-price ratio. It is equally possible to use the current level of thedividend yield and calculate implicit values of the real interest rate, the equity premium or the real growthin earnings, that would be consistent with current values of the dividend yield. Such calculations, as wellas those for the dividend yield, are shown in Table 2.
18. Care must be taken in interpreting these results since they depend critically on the assumptionsmade about underlying equilibrium levels of the determinants. A few words are in order here. Themeasure of the equity premium, which can only be inferred from the data, is the average of the past15 years in most cases. This value is lower than the historical average and the one that existed in the1970s. There seem to be good reasons for accepting this lower value. To begin with, inflation has comedown from its high level in the 1970s and this could have contributed to the decrease of the equitypremium below its trend19. Moreover, long-horizon investors20 and households (Table 3) have increasedtheir participation in the market and this has contributed to the post-war decline in the premium. Both ofthese groups are thought to be willing to accept a lower equity premium because of their longer-termhorizons. Judgement was also used in choosing the current real interest rate levels. For the most part itwas assumed that current inflation expectations had not adjusted fully to recent low levels of inflation. Itwas also assumed that real interest rates converge in Europe to 4 per cent and that the current very lowreal rates in Japan are not sustainable. Finally, long-run real dividend growth is assumed to be constrainedto be equal to the growth of potential output21.
19. Because of the subjective nature of this exercise, the implications that follow are at bestsuggestive. Bearing this mind, the following can be said:
− The implied dividend yield is above critical values in all countries, with the largestdifferences in the United States, Italy and Canada, in that order.
− − Similar patterns emerge when the other variables are examined. For example, in the UnitedStates and Canada the implied real interest rate necessary to sustain the current dividendyield is below levels on real indexed bonds in those countries. For Italy, where there are noindex bonds, the implied real interest rate is below recent historical norms.
19. See Blanchard (1993) and Carlson and Sargent (1997).
20. See Blanchard (1993) and Golob and Bishop (1997).
21. In a number of countries, there do not exist long-run time series on dividend growth from which to makeestimates of equilibrium growth rates. Potential output growth has therefore been used as a reasonableproxy which also facilitates cross-country comparisons.
ECO/WKP(98)1
11
− The implicit growth of dividends (proxied by potential output growth) is significantly abovepotential growth in the four countries mentioned.
− Finally, equity valuation measures in Japan and France appear to be closest to theirfundamentals, while those in Germany and the United Kingdom are more intermediate cases.
20. In the United States, Italy and Canada, current high prices could be being supported by investorsextrapolating recent developments. This could well be the case in the United States for earnings. Forinstance, an aggregation of analysts’ forecasts of earnings growth for the S&P 500 companies shows a14 per cent rise in nominal earnings for the coming year. These rates are considerably in excess ofnominal GDP and they follow two years of exceptionally strong earnings growth. In addition, marketsalso appear to be optimistic that the threat of inflation has been lessened considerably and, with it, thepossibility that interest rates will have to rise any time soon. Here, Italy could be an exception because offurther convergence of nominal interest rates with EMU. However, the measures in Table 2 implicitlyassume such convergence has occurred. The yield curves in a number of countries appear flat byhistorical standards. The difficulty in justifying current valuation levels has prompted suggestions of thepossible existence of an unsustainable element in prices22. Whether equity markets (particularly the USmarket) have developed a bubble23 is very difficult to determine a priori24. One piece of evidencesupporting this view has been the recent increase in the expected volatility of returns (see Figure 2).
IV. Possible consequences of a large correction
21. Gauging the effect of a substantial correction of equity prices on the real economy is difficult,partly because history is not much of a guide. For example, the effects of the 1987 correction on the USas well as on other economies appear to have been modest. In the United States, this was due to theoffsetting effects of the exchange rate. In the case of other countries, it reflected smaller wealth effects.The role of the 1929 stock market crash in explaining the Great Depression, while originally thoughtimportant, appears to have been limited. Wealth effects on consumer spending were probably marginal(only 6 per cent of all households were directly affected). The drop in equity values at that time didincrease the debt-equity ratios of firms that were already highly leveraged but the largest declines inbusiness investment spending occurred later when business confidence was plummeting25. In the currentsituation any slowdown in spending in the United States and the United Kingdom (and Canada to a lesserextent) would come about in the context of aggregate demand that is close to or above potential levelsestimated for the economy. For those countries where output gaps are still present, any reductions inlong-term interest rates, as occurred in the aftermath of the 1987 correction, would provide some bufferingeffect on demand.
22. The direct effects on GDP will come through wealth changes on consumption and costs ofcapital increases, as well as its availability, for investment.
22. See Federal Reserve Chairman’s recent testimony before Congress, 29 October 1997.
23. Blanchard and Watson (1982) argue that bubbles are more likely to appear when fundamentals are difficultto assess, as they are currently.
24. See Shleifer and Summers (1990) for a description of how the process might work. On the econometricdifficulties testing for a bubble, see Flood and Hodrick (1990).
25. See US Government (1988).

ECO/WKP(98)1
12
− Using rules of thumb from the Secretariat’s INTERLINK model, measures of the effect onconsumption spending of a large US stock market correction (for example, a 20 per centdrop as occurred in October 1987), both on growth in that country and on other majorcountries where the role of equity in household portfolios is not large, are estimated to berelatively small, even assuming that similar declines take place in the stock markets of othermajor countries (Table 4). The level of output for the area as a whole is estimated to fallabout ½ a per cent in the next two years with most of the effect occurring in the second year.In order, the largest effects are on the United States, Japan and Canada. These estimates,however, are likely to be an upper bound. For example, in the United States, the UnitedKingdom and Canada, equity markets have been rising for some time and consumption hasprobably not fully adjusted to the higher level of wealth.
− The other expenditure channel is investment (Figure 9). Any effects are only likely to besignificant to the extent that the stock market correction coincided with changes in businessconditions; a phenomenon that in the past has been associated with changes in the broaderoutlook in financial markets that would imply higher spreads on longer-term and riskierdebt26. Furthermore, such changes would have to be permanent and involve a generalmovement in asset markets to be of significance for investment decisions; fluctuations inequity values away from what might be considered its longer-term trend -- as defined bymovements in fundamentals -- do not typically have a significant impact27. Such amovement would be typically linked with changes in perception regarding the business cycleclimate. On the other hand, a sharp financial correction may engender rapid shifts in thevalue of outstanding positions of market participants and bring into doubt previousperceptions of their creditworthiness thus lowering access of borrowers to credit.
23. Historically, the fall out from an asset price boom seems to have had its greatest effect throughproblems it created in the financial system. The risks to a banking system that is not already in a fragileposition would seem to be limited. Important here, is whether or not there has been a spill over to otherasset markets like housing and commercial real estate from rising stock markets. This does not appear tobe an issue where markets may be over valued (the United States, Italy or Canada) in the current situation.In a number of OECD countries in the past, adjustment has been made more difficult and prolongedbecause of the fall out from collapsing asset prices. The aftermath of the excesses of the “bubble”economy still clouds prospects for a solid recovery in Japan. If the current low level of the Nikkei were topersist, a number of major Japanese banks would come under pressure to improve their capitalisationlevels either by raising new capital or by reducing the size of their balance sheet (Table 5).
24. Further complications can develop to the extent that there is contagion to other countries, whichcould arise through several vehicles. First, new issuance in the United States has been dominated byforeign issuers, many of which come from emerging markets (Table 6). A decline in the US marketwould reduce the scope and increase the cost of raising further capital by foreign firms. Second, marketsare directly linked -- the same stocks are quoted in different stock markets and held by investors indifferent parts of the world -- and the changes in the value of these stocks prompt a similar response frominvestors holding these assets independent of their location. Finally, a weaker US economy would feedinto weaker equity prices elsewhere. Short-term correlations between changes across major stock marketsdo suggest that large shifts in one market are quickly spread to other markets, particularly between theUnited States, on the one hand, and the United Kingdom and Canada, on the other (Figure 10). The low
26. See Fama and French (1989).
27. See Tease (1993).

ECO/WKP(98)1
13
correlation between the United States and Japan is due to the special factors that have been affecting theJapanese equities markets since the fallout from the bubble economy. Nevertheless, it seems unlikely thatthe Japanese market would escape a major downward adjustment on equity prices from current levels,even if the adjustment might perhaps be less than elsewhere, given that current values are basically aroundtheir equilibrium counterparts, according to estimates presented here.
ECO/WKP(98)1
14
BIBLIOGRAPHY
Blanchard, Olivier J.(1993), “Movements in the Equity Premium”, Brookings Papers on EconomicActivity 2, pp. 75-138.
Blanchard, Olivier J. and Mark Watson (1982), “Bubbles, Rational Expectations and Financial Markets”,in Crises in the Economic and Financial Structure, Paul Wachtel (ed.), Lexington.
Borio, C.V., N. Kennedy and S. D. Prowess (1994), “Exploring Aggregate Asset Price FluctuationsAcross Countries”, BIS Economic Papers, No. 40, April.
Carlson, John B. and Kevin H. Sargent (1997), “The Recent Ascent of Stock Prices: Can it be Explainedby Earnings Growth or other Fundamentals”, Economic Review, Federal Reserve Bank ofCleveland, pp. 2-12.
Cole, Kevin, Jean Helwege, and David Laster (1996), “Stock Market Valuation Indicators: Is This TimeDifferent?” Financial Analysts Journal, May/June, pp. 56-64.
Easton, Thomas (1997), “Buy High, Sell Low”, Forbes, April 7, p. 119.
Edey, Malcolm and Ketil Hviding (1995), “An Assessment of Financial Reform in OECD Countries”,OECD Economic Studies No. 25, pp. 7-38.
Ely, David P. and Kenneth J. Robinson (1989), “The Stock Market and Inflation: A Synthesis of theTheory and Evidence”, Economic Review, Federal Reserve Bank of Dallas, March, pp. 17-29.
Fama, Eugene F. and Kenneth R. French (1988), “Dividend Yields and Expected Stock Returns”, Journalof Financial Economics, October, pp. 3 - 25.
Fama, Eugene F. and Kenneth R. French (1989), “Business Conditions and Expected Returns on Stocksand Bonds”, Journal of Financial Economics 25, pp. 23-49.
Flood, Robert P. and Robert J. Hodrick (1990), “On Testing for Speculative Bubbles”, Journal ofEconomic Perspectives 4(2), Spring, pp. 85-101.
Fisher, Irving (1930), The Stock Market Crash and After, Macmillan.
Friedman, Milton and Anna J. Schwartz (1963), A Monetary History of the United States, 1867-1960,Princeton University Press.
Galbraith, J.K. (1954), The Great Crash of 1929, Houghton Mifflin Company.
Golob, John E and David G. Bishop (1997), “What Long-Run Returns Can Investors Expect from theStock Market?”, Federal Reserve Bank of Kansas City Economic Review, Third Quarter, pp. 5-20.
Gordon, Myron J. (1962), The Investment, Financing and Valuation of the Corporation, Homewood, Ill.

ECO/WKP(98)1
15
Hardouvelis, Gikas A. (1990), “Stock Market Bubbles before the Crash of 1987?”, Federal Reserve Bankof New York Research Paper No. 9004, March.
Harris, Stephen and Charles Pigott (1997), “Regulatory Reform in the Financial Services Sector: Whereare we Going; Where have we Been”, OECD Financial Market Trends, June, pp. 71-74.
Hutchison, Michael M. (1994), Asset Price Fluctuations in Japan: What Role for Monetary Policy?”,Bank of Japan Monetary and Economic Studies, Vol. 12, No. 2, December, pp. 61-83.
Jacobs, Jill (1996), “Profits and Labour”, Economic Research, Goldman Sachs.
Mehra, Rajnish and Edward C. Prescott (1985), “The Equity Premium: A Puzzle”, Journal of MonetaryEconomics 15(2), March, pp. 145-161.
OECD (1997), The OECD Report on Regulatory Reform: Volumes 1 and 2, Paris.
Poterba, J.M. and L.H. Summers (1988), “Mean Reversion in Stock Prices: Evidence and Implications,”Journal of Financial Economics 22, pp. 27-59.
Seyhun, H. Nejat (1990), “Overreaction or Fundamentals: Some Lessons from Insiders’ Response to theMarket Crash of 1987”, The Journal of Finance, Vol. 45, No. 5, December, pp. 1363-1388.
Shigehara, Kumiharu (1997), “Monetary Policy and Economic Performance: the Recent Experience ofthe United States and Japan”, paper presented at the International Economic AssociationConference “Monetary Theory as a Basis for Monetary Policy”, 4-7 September, Trento, Italy.
Shiller, Robert (1981), “Do Stock Prices Move Too Much to be Justified by Subsequent Changes inDividends?” American Economic Review 71(3), June, pp. 421-436).
Shleifer, Andrei and Lawrence H. Summers (1990), “The Noise Trader Approach to Finance”, Journal ofEconomic Perspectives 4(2), Spring, pp. 19-33.
Sirkin, Gerald (1975), “The Stock Market of 1929 Revisited: A Note”, Business History Review 49(2),Summer, pp. 223-231.
Smets, Frank (1997), “Financial Asset prices and Monetary Policy: Theory and Evidence”, Bank forInternational Settlements, Working Paper No. 47, September
Tease, Warren (1993), “The Stock Market and Investment”, OECD Economic Studies No. 20, Spring,pp. 41-63.
US Government (1988), “Study VIII: A Comparison of 1929 and 1987” in Report of the Presidential TaskForce on Market Mechanisms, January.
White, Eugene N. (1990), “The Stock Market and the Crash of 1929 Revisited”, Journal of EconomicPerspectives 4(2), Spring, pp. 67-83.
Zhou, Chunsheng (1996), “Stock Market Fluctuations and the Term Structure”, Federal Reserve Board ofGovernors, mimeo.

EC
O/W
KP
(98)
1
16
Tab
le 1
. S
ome
styl
ised
fact
s on
G-7
equ
ity m
arke
ts
Wh
ole
pe
rio
d1
96
0-6
91
97
0-7
91
98
0-8
91
99
0-9
71
99
61
99
7Q
1N
ovem
ber
Uni
ted
Sta
tes (
S&
P)
Rea
l lon
g-te
rm in
tere
st r
ate
12
.80
2.3
40
.11
5.2
33
.34
3.8
24
.04
3.8
Pri
ce e
arn
ing
s ra
tio1
5.2
11
7.7
71
2.2
81
2.1
61
9.6
11
9.1
01
8.8
02
4.2
3D
ivid
en
d y
ield
3.6
03
.18
4.0
24
.18
2.7
92
.11
1.8
81
.59
GD
P p
oten
tial g
row
th r
ate2
2.8
63
.82
2.9
62
.74
2.2
8Ja
pan
(Top
ix)
Rea
l lon
g-te
rm in
tere
st r
ate
1,3
2.5
83
.01
-0.7
14
.58
3.7
43
.18
2.7
51
.1P
rice
earn
ings
rat
io (
adju
sted
)4
,52
7.5
8n
.a.
13
.86
22
.71
41
.38
59
.04
47
.00
30
.00
Div
ide
nd
yie
ld2
.23
4.4
22
.30
1.0
70
.78
0.7
90
.93
0.9
1G
DP
pot
entia
l gro
wth
rat
e63
.61
n.a
.4
.34
3.8
52
.48
Ger
man
y (D
ax)
Rea
l lon
g-te
rm in
tere
st r
ate
14
.09
4.1
83
.25
4.7
84
.18
4.6
94
.12
4.1
Pric
e ea
rnin
gs r
atio7
14
.00
n.a
.1
2.7
51
3.2
01
6.1
01
5.6
01
8.2
01
8.6
0D
ivid
en
d y
ield
3.0
0n
.a.
3.9
63
.00
2.1
41
.88
1.5
81
.49
GD
P p
oten
tial g
row
th r
ate9
3.0
03
.90
2.9
12
.08
2.4
9F
ranc
e (C
ompo
site
)R
eal l
ong-
term
inte
rest
rat
e1
3.3
62
.35
0.9
14
.99
5.7
34
.69
4.1
24
.1P
rice
earn
ings
rat
io71
1.8
2n
.a.
12
.50
10
.40
13
.10
14
.80
17
.70
16
.70
Div
ide
nd
yie
ld4
.21
n.a
.4
.86
4.5
33
.27
3.2
72
.78
2.6
1G
DP
pot
entia
l gro
wth
rat
e62
.53
n.a
.3
.32
2.3
01
.93
Italy
(C
ompo
site
)R
eal l
ong-
term
inte
rest
rat
e1
2.3
12
.29
-2.2
43
.59
6.6
25
.27
4.7
93
.6P
rice
earn
ings
rat
io81
6.9
0n
.a.
n.a
.1
5.6
01
7.4
01
5.9
01
8.3
01
9.3
0D
ivid
en
d y
ield
2.9
8n
.a.
4.0
12
.35
2.8
72
.43
2.1
31
.66
GD
P p
oten
tial g
row
th r
ate6
2.6
0n
.a.
3.6
32
.43
1.8
22
.22
Uni
ted
Kin
gdom
(F
T-S
E)
Rea
l lon
g-te
rm in
tere
st r
ate
12
.50
3.0
0-1
.39
4.1
14
.80
5.0
64
.65
4.1
Pric
e ea
rnin
gs r
atio9
11
.42
14
.64
9.7
99
.40
13
.24
13
.87
14
.79
16
.81
Div
iden
d yi
eld9
4.7
84
.71
5.3
54
.72
4.2
03
.81
3.6
43
.60
GD
P p
oten
tial g
row
th r
ate2
2.2
32
.85
1.8
72
.34
2.1
6C
anad
a (T
SE
-300
)R
eal l
ong-
term
inte
rest
rat
e1
3.7
73
.17
1.0
95
.20
6.1
75
.75
5.0
73
.8P
rice
ea
rnin
gs
ratio
20
.27
17
.36
11
.63
14
.31
42
.86
19
.48
22
.83
23
.82
Div
ide
nd
yie
ld3
.41
3.2
23
.95
3.5
52
.66
2.0
51
.77
1.5
9G
DP
pot
entia
l gro
wth
rat
e63
.09
n.a
.4
.19
2.9
42
.18
1.
Re
al l
on
g-t
erm
inte
rest
ra
tes
are
de
fine
d a
s th
e n
om
ina
l 10
ye
ar
rate
less
a s
mo
oth
se
ries
of
GD
P d
efla
tor
infla
tion
. T
he
se
ries
wa
s sm
oo
the
d u
sin
g a
Ho
dric
k-P
resc
ott
filt
er.
T
he
No
vem
be
r va
lue
is c
alc
ula
ted
as
the
no
min
al 1
0 y
ea
r r
ate
less
th
e S
ecr
eta
ria
t’s p
roje
ctio
n f
or
infla
tion
on
ave
rag
e o
ver
19
98
an
d 1
99
9.
2.
Da
ta s
tart
fro
m 1
96
4.
3
. D
ata
sta
rt f
rom
19
61
.
4
. P
rice
-ea
rnin
gs
ha
ve b
ee
n a
dju
ste
d t
o t
ake
into
acc
ou
nt
cro
ss-s
ha
re h
old
ing
s b
etw
ee
n f
irm
s.
5
. D
ata
sta
rt f
rom
19
76
.6
.D
ata
sta
rt f
rom
19
70
.
7.
Da
ta s
tart
fro
m 1
97
4.
8.
Da
ta s
tart
fro
m 1
98
6.
9.
Da
ta s
tart
fro
m 1
96
3.

ECO/WKP(98)1
17
Table 2. Evaluations of current dividend yields
Recent and historical dataDividend yield Real interest rates Average value of
premiumAverage potential
growthNovember 1997 1980-971 1980-972
United States 1.59 3.90 1.70 2.50Japan 0.91 2.75 0.34 2.00Germany 1.49 4.00 0.36 2.25France 2.61 4.00 0.86 2.15Italy 1.66 4.00 1.19 2.20United Kingdom 3.60 4.00 2.35 2.25Canada 1.59 4.00 1.29 2.60
Measures of potential overvaluationImplied dividend
yield3Implied real interest
rates4Implied premium4 Implied growth of
dividends4
United States 3.10 2.38 0.19 4.00Japan 1.09 2.57 0.16 2.18Germany 2.11 3.38 -0.26 2.87France 2.71 3.92 0.76 2.25Italy 2.99 2.67 -0.14 3.53United Kingdom 4.10 3.50 1.85 2.75Canada 2.69 2.90 0.19 3.70
1. For Japan, Italy and Canada the 1980-89 average was used because of extreme values in the data in the 1990s.2. For Japan, the historical average was not used. The potential growth rate for Japan was lowered in view of the
mounting evidence that the slowdown in productivity seen in the first half of the 1990s reflected a permanentrather than a cyclical phenomenon.
3. Implied dividend yield is the sum of columns two and three, less column four in the top panel. Similar calculationscould be made for the price-earnings ratio using equation (2) in the text and historical values for the price-earnings ratio.
4. Implicit values of the real interest rate, the premium and the growth rate are derived from equation (1) in the textusing the current dividend yield and various combinations of two of the other measures from columns two to fourin the top panel.

ECO/WKP(98)1
18
Table 3. Household equity holdings, net wealth and disposable income
A. Households’ equity holdings as a per cent of net wealth
1980/84 1985/89 1990/94 1995 1996 19971
Memo: Capital gains onequity in 1997 (as a share
of net wealth)1
United States 10.6 11.0 15.1 19.5 20.9 24.4 5.2Japan 4.5 7.6 5.8 5.4 4.91 3.7 -1.0France2 1.3 3.1 2.9 2.6 2.9 3.2 0.4Italy2 0.8 2.1 3.6 3.8 3.6 4.7 1.4United Kingdom 5.5 6.3 9.4 11.3 11.3 12.4 1.6Canada 13.7 13.9 14.2 15.6 16.5 18.3 2.4
B. Households' equity holdings as a per cent of net financial wealth
1980/84 1985/89 1990/94 1995 1996 19971
Memo: Capital gains onequity in 1997 (as a share
of net financial wealth)1
United States 20.7 20.4 26.3 32.3 33.8 38.9 8.1Japan 17.2 26.8 19.7 15.3 12.41 9.5 -2.6Germany 4.8 7.5 5.8 5.7 6.51 7.6 1.7France2 7.8 20.1 18.6 11.4 12.0 13.2 1.7Italy2 2.2 4.7 7.7 7.9 7.4 9.0 2.6United Kingdom 16.2 18.0 22.8. 22.4 21.8 23.7 3.0Canada 35.1 34.6 34.6 36.1 38.0 40.7 5.4
C. Households' equity holdings as a per cent of disposable income
1980/84 1985/89 1990/94 1995 1996 19971
Memo: Capital gains onequity in 1997 (as a share
of disposable income)1
United States 52.1 56.0 76.8 102.1 114.4 135.8 28.3Japan 23.8 56.8 43.2 35.6 34.71 26.0 -7.0Germany 7.2 13.4 10.3 11.0 14.01 17.1 3.8France2 5.2 12.7 12.1 10.9 12.9 14.4 1.9Italy2 2.5 8.0 16.6 18.2 17.2 23.4 6.8United Kingdom 24.2 36.0 53.1 63.0 62.6 67.6 8.6Canada 53.8 58.3 64.0 75.4 83.0 91.1 12.0
1. Secretariat estimates based on previous year’s data, average savings rate over last five years, and observedmovements in stock market indices. Value of stock markets as of 13 November 1997.
2. For France and Italy, national sources’ estimates for household equity holdings have been corrected to excludenon-quoted shares. Data presented are based on national authorities’ estimates of the ratio of quoted to non-quoted shares in household portfolios.

ECO/WKP(98)1
19
Table 4. Macro effects of an equity market correction 1,2
(Consumption effect only, changes compared to baseline in level terms)
Scenario 1: Correction of 20 per cent in US equity values1
Impact on Real GDP Inflation Current account Current account Trade balance(percentage points) (percentage points) (US$ billion) (as per cent of GDP) (as per cent of GDP)1st year 2nd year 1st year 2nd year 1st year 2nd year 1st year 2nd year 1st year 2nd year
United States -0.2 -0.5 0.0 -0.2 5.6 16.4 0.1 0.2 0.1 0.1Japan -0.1 -0.3 0.0 -0.1 -1.2 -4.4 0.0 -0.1 0.0 -0.1Germany -0.1 -0.2 0.0 0.0 -0.6 -1.8 0.0 -0.1 0.0 -0.1France 0.0 -0.1 0.0 0.0 -0.2 -0.9 0.0 -0.1 0.0 -0.1Italy 0.0 -0.2 0.0 -0.1 -0.3 -1.2 0.0 -0.1 0.0 -0.1United Kingdom 0.0 -0.1 0.0 -0.1 -0.2 -0.8 0.0 -0.1 0.0 0.0Canada -0.1 -0.4 0.0 -0.1 -0.3 -1.1 -0.1 -0.2 0.0 -0.1
OECD3 -0.1 -0.3 0.0 -0.1 1.6 2.9 0.0 0.0 0.0 0.0OECD Europe3 0.0 -0.2 0.0 -0.1 -2.1 -7.5 0.0 -0.1 0.0 -0.1
Scenario 2: Correction of 20 per cent in equity markets of all G-7 Countries2
Impact on Real GDP Inflation Current account Current account Trade balance(percentage points) (percentage points) (US$ billion) (as per cent of GDP) (as per cent of GDP)1st year 2nd year 1st year 2nd year 1st year 2nd year 1st year 2nd year 1st year 2nd year
United States -0.2 -0.6 0.0 -0.2 5.3 15.7 0.1 0.2 0.1 0.1Japan -0.2 -0.5 0.0 -0.3 -0.7 -3.3 0.0 -0.1 0.0 -0.1Germany -0.1 -0.4 0.0 0.0 -0.6 -1.7 0.0 -0.1 0.0 -0.1France -0.1 -0.2 0.0 -0.1 -0.2 -0.8 0.0 0.0 0.0 0.0Italy -0.1 -0.3 0.0 -0.1 -0.3 -1.2 0.0 -0.1 0.0 -0.1United Kingdom -0.1 -0.2 0.0 -0.2 0.3 0.7 0.0 0.0 0.0 0.0Canada -0.2 -0.5 0.0 -0.1 0.0 -0.3 0.0 0.0 0.0 0.0
OECD3 -0.1 -0.4 0.0 -0.2 2.3 4.6 0.0 0.0 0.0 0.0OECD Europe3 -0.1 -0.2 0.0 -0.1 -1.9 -6.8 0.0 -0.1 0.0 -0.1
1. The equity market correction is assumed to produce an ex ante drop in US real private consumption of 0.6 percentage pointsrelative to baseline; this drop is not immediate but gradual with a mean lag of 0.75 years and a maximum lag of 4 half-years.Simulations based on fixed exchange rates and unchanged policies.
2. The equity market correction is assumed to have an ex ante drop in real private consumption of 0.6 percentage points relativeto baseline in the United States; 0.2 in Japan; 0.1 in Germany, France and Italy; 0.3 in the U’nited Kingdom; and 0.4 inCanada. These drops are not immediate but gradual with a mean lag of 0.75 years. Simulations based on fixed exchangerates and unchanged policies.
3. Weighted averages.

ECO/WKP(98)1
20
Table 5. The effects of a stock market's declineon the balance sheets of major Japanese banks
March 1996 March 1997 November 1997 Critical level1
Nikkei 18244 15500 14800Value of banks’ stock holdings
- market (Yen trillion) 55.3 47.3- book (Yen trillion) 39.3 39.3- unrealised profits (Yen trillion) 16.0 8.0
Stock market change since March 1997 average(per cent)
-15.0 -18.9
Value change of banks’ holdings (Yen trillion) -7.1 -8.9
New unrealised profits (Yen trillion) 0.9 -0.9
Change in Tier 2 capital (Yen trillion)2 -3.2 -4.5
Regulatory capital 41.2 40.9 37.7 36.4
Risk-weighted assets 452.3 456.9
BIS capital ratio 9.1 9.0
Estimated BIS capital ratio 8.3 8.0
1. This column shows the level of the stock market at which the average capitalisation ratio of major JapaneseBanks would fall below the critical 8 per cent level.
2. Under BIS capitalisation rules, only 45 per cent of unrealised profits on stock holdings are counted in Tier 2capital.
Source: OECD Secretariat estimates using data from Bank of Japan and Bloomberg.
EC
O/W
KP
(98)
1
21
Tab
le 6
. F
orei
gn a
nd d
omes
tic is
suer
s in
the
Uni
ted
Sta
tes
equi
ty m
arke
t
($U
S b
illio
n)
1970
/791
1980
/891
1990
1991
1992
1993
1994
1995
1996
1997
Q12
1997
Q22
Net
issu
es7.
91-4
2.29
-37.
776
.910
3.4
130.
124
.1-2
.33.
8-5
9.0
-36.
1
Non
-fin
anci
al c
orpo
rate
busi
ness
5.52
-55.
89-6
3.0
18.3
27.0
21.3
-44.
9-5
8.3
-64.
2-8
6.2
-83.
6
Fin
anci
al s
ecto
r2.
0410
.63
17.9
28.0
44.0
45.4
20.9
5.6
9.2
-19.
8-8
.1
Res
t of t
he w
orld
0.3
52.
977.
430
.732
.463
.448
.150
.458
.847
.055
.6
1.
Ave
rage
s of
ann
ual d
ata.
2.
Qua
rter
ly fi
gure
s ar
e se
ason
ally
adj
uste
d at
ann
ual r
ates
.S
ourc
e :
Sec
reta
riat
calc
ulat
ions
on
the
basi
s of
Flo
w o
f Fun
ds A
ccou
nts
of th
e U
nite
d S
tate
s , B
oard
of
Gov
erno
rs o
f th
e F
eder
al R
eser
ve S
yste
m,
Was
hing
ton,
1997
.
ECO/WKP(98)1
22
(Daily from January 1996 up to November 1997)Equity nominal market pricesFigure 1.
United States CanadaJapan (right scale)
1996 974500
5000
5500
6000
6500
7000
7500
8000
8500
15000
16000
17000
18000
19000
20000
21000
22000
23000
Germany France
1996 971500
2000
2500
3000
3500
4000
4500
1500
2000
2500
3000
3500
4000
4500
United Kingdom Italy (right scale)
Source: Financial Times.USA: Dow Jones Industrial, Japan: Nikkei 225, Canada: composite, Germany: Dax, France: CAC40,Italy: MIB, United Kingdom: FTSE 100.
1996 973500
4000
4500
5000
5500
900
1000
1100
1200
1300
1400
1500
1600

ECO/WKP(98)1
23
Figure 2. Implied volatility of stock prices (1)
fla_vol_fig 20-Nov-97
1994 1995 1996 19970
10
20
30
40
50
0
10
20
30
40
50United States : S&P 500
1994 1995 1996 19970
10
20
30
40
50
0
10
20
30
40
50Japan: Nikkei 225
1994 1995 1996 19970
10
20
30
40
50
0
10
20
30
40
50Germany: DAX
1994 1995 1996 19970
10
20
30
40
50
0
10
20
30
40
50France: CAC 40
1994 1995 1996 19970
10
20
30
40
50
0
10
20
30
40
50Italy: MIB 30
1994 1995 1996 19970
10
20
30
40
50
0
10
20
30
40
50United Kingdom: FTSE 100
1994 1995 1996 19970
10
20
30
40
50
0
10
20
30
40
50Canada: TSE 35
Source: Bloomberg.
1. Implied volatility is the market’s prediction of expected volatility and is indirectly calculated from current call option prices usingthe Black-Sholes model.In essence, this is the market’s volatility ’forecast’ for the underlying security during the remaining life of the option.
1994 1995 1996 199710
20
30
40
50
60
70
80
10
20
30
40
50
60
70
80Hong Kong: Hang Seng

ECO/WKP(98)1
24
Figure 3. Real housing prices(Index 1984=100, except for Sweden: 1988=100)
rhs 20-Nov-97
90
100
110
120
130
140
150
160
170
90
100
110
120
130
140
150
160
170United States
1984 85 86 87 88 89 90 91 92 93 94 95 96 9750
100
150
200
250
300
350
400
450
500
50
100
150
200
250
300
350
400
450
500Japan (1)
1984 85 86 87 88 89 90 91 92 93 94 95 96 97
90
100
110
120
130
140
150
160
170
90
100
110
120
130
140
150
160
170United Kingdom
1984 85 86 87 88 89 90 91 92 93 94 95 96 9760
70
80
90
100
110
120
130
140
60
70
80
90
100
110
120
130
140Finland
1984 85 86 87 88 89 90 91 92 93 94 95 96 97
70
80
90
100
110
120
130
140
150
70
80
90
100
110
120
130
140
150Norway
1. Japan: commercial land prices.Sources: United States: DRI; Japan: Nikko Research Center; United Kingdom: Halifax; Finland: Bank of Finland; Norway: Bank of Norway; Sweden: SCB.
1984 85 86 87 88 89 90 91 92 93 94 95 96 9760
70
80
90
100
110
120
130
140
60
70
80
90
100
110
120
130
140Sweden
1984 85 86 87 88 89 90 91 92 93 94 95 96 97
ECO/WKP(98)1
25
Figure 4. Historical stock prices in the United States and in the United Kingdom(in logs)
1
2
3
4
5
6
7
1
2
3
4
5
6
7Nominal Real
United States
1900 1910 1920 1930 1940 1950 1960 1970 1980 1990
4
5
6
7
8
9
10
4
5
6
7
8
9
10
United Kingdom
1900 1910 1920 1930 1940 1950 1960 1970 1980 1990
Source: United States : Standard and Poors Index from Historical Statistics of the United States, US Federal Reserve Bank, and DRI. United Kingdom : BZW equity index from Bank of England
ECO/WKP(98)1
26
50
100
150
200
250
300
350
400
50
100
150
200
250
300
350
400
S&P Index 1921=100 S&P Index 1988=100
Figure 5. The US stock market in the 1920s, and in the 1990s
1922 1923 1924 1925 1926 1927 1928 1929 1930 1931 1932 19331989 1990 1991 1992 1993 1994 1995 1996 1997
Source: Standard and Poors Index from : Historical Statistics of the United States; US Federal Reserve Bank,New York; and DRI.

ECO/WKP(98)1
27
Figure 6. Dividend yields
yld 20-Nov-97
1
2
3
4
5
6
7
1
2
3
4
5
6
7United States
1960 65 70 75 80 85 90 95 0
1
2
3
4
5
6
7
0
1
2
3
4
5
6
7Japan
1960 65 70 75 80 85 90 95
1
2
3
4
5
6
1
2
3
4
5
6Germany
1960 65 70 75 80 85 90 95 2
4
6
8
10
2
4
6
8
10France
1960 65 70 75 80 85 90 95
0
1
2
3
4
5
6
7
0
1
2
3
4
5
6
7Italy
1960 65 70 75 80 85 90 95 2
4
6
8
10
12
14
2
4
6
8
10
12
14United Kingdom
1960 65 70 75 80 85 90 95
1
2
3
4
5
6
7
1
2
3
4
5
6
7Canada
Sources:United States (S&P): DRI.Japan (Topix): Bank of Japan.Germany (Dax): Salomon Brothers.France (composite): Salomon Brothers.Italy (composite): Salomon Brothers.United Kingdom (FT-SE): ONSCanada (TSE300): Cansim.
1960 65 70 75 80 85 90 95
ECO/WKP(98)1
28
Figure 7. Price-earnings ratios
pe 27-Nov-97
5
10
15
20
25
30
5
10
15
20
25
30United States
1960 65 70 75 80 85 90 95 0
10
20
30
40
50
60
70
0
10
20
30
40
50
60
70Japan
1960 65 70 75 80 85 90 95
5
10
15
20
25
30
5
10
15
20
25
30Germany
1960 65 70 75 80 85 90 95 5
10
15
20
25
30
35
5
10
15
20
25
30
35France
1960 65 70 75 80 85 90 95
5
10
15
20
25
30
5
10
15
20
25
30Italy
1960 65 70 75 80 85 90 95 0
5
10
15
20
25
0
5
10
15
20
25United Kingdom
1960 65 70 75 80 85 90 95
0
10
20
30
40
0
10
20
30
40Canada
For Japan, the price-earnings ratio has been adjustedto take account of cross-shareholdings between firms.
Sources: see Figure 6.
1960 65 70 75 80 85 90 95

ECO/WKP(98)1
29
5
10
15
20
25
30
35
5
10
15
20
25
30
35
Figure 8. Sensitivity of price-earnings ratio to changes in fundamentals
0.5 1 1.5 2 2.5 3 3.5 4 4.5
historical average (15.2)
November 1997 (24.2)
Risk premium(in per cent)
Real interest rate : 3.5 per centReal growth in earnings : 2.5 per centPay-out ratio : 0.5

ECO/WKP(98)1
30
1970 1975 1980 1985 1990 1995
0.10
0.15
0.20
50
100
150
200
250
300
Business fixed investment (left scale) Real stock prices (right scale)
Figure 9. Stock prices and investment
United States
1970 1975 1980 1985 1990 1995
0.10
0.15
0.20
50
100
150
200
250
300
Japan
1970 1975 1980 1985 1990 1995
0.10
0.15
0.20
50
100
150
200
250
300
Germany
1970 1975 1980 1985 1990 1995
0.10
0.15
0.20
50
100
150
200
250
300
France
1970 1975 1980 1985 1990 1995
0.10
0.15
0.20
50
100
150
200
250
300
Italy
1970 1975 1980 1985 1990 1995
0.10
0.15
0.20
50
100
150
200
250
300
United Kingdom
United States : Standard and Poors 500Japan : TOPIXGermany : CDAXFrance : SBF 250Italy : MIBUnited Kingdom : FT-SE-A Non FinancialsCanada : TS300
1970 1975 1980 1985 1990 1995
0.10
0.15
0.20
50
100
150
200
250
300
Canada

ECO/WKP(98)1
31
Figure 10. Correlations across stock markets (1)
vol3 27-Nov-97
-0.2
0.0
0.2
0.4
0.6
0.8
-0.2
0.0
0.2
0.4
0.6
0.8Japan vis-à-vis the United States
1960 1965 1970 1975 1980 1985 1990 1995
-0.2
0.0
0.2
0.4
0.6
0.8
-0.2
0.0
0.2
0.4
0.6
0.8United Kingdom vis-à-vis the United States
1960 1965 1970 1975 1980 1985 1990 1995
-0.2
0.0
0.2
0.4
0.6
0.8
-0.2
0.0
0.2
0.4
0.6
0.8Germany vis-à-vis the United States
1960 1965 1970 1975 1980 1985 1990 1995
-0.2
0.0
0.2
0.4
0.6
0.8
-0.2
0.0
0.2
0.4
0.6
0.8France vis-à-vis the United States
1960 1965 1970 1975 1980 1985 1990 1995
0.3
0.4
0.5
0.6
0.7
0.8
0.9
1.0
0.3
0.4
0.5
0.6
0.7
0.8
0.9
1.0Canada vis-à-vis the United States
1. As measured by the correlation of monthly price changes calculated over a 36 month period.Sources: Bloomberg, OECD Secretariat.
1960 1965 1970 1975 1980 1985 1990 19950.0
0.1
0.2
0.3
0.4
0.5
0.6
0.7
0.8
0.9
0.0
0.1
0.2
0.3
0.4
0.5
0.6
0.7
0.8
0.9France vis-à-vis Germany
1960 1965 1970 1975 1980 1985 1990 1995

ECO/WKP(98)1
32
ECONOMICS DEPARTMENTWORKING PAPERS
187. NAIRU: Incomes Policy and Inflation(January 1998) Silvia Fabiani, Alberto Locarno, Gian Paolo Oneto and Paolo Sestito
186. OECD Submission to the Irish National Minimum Wage Commission(December 1997)
185. OECD Submission to the UK Low Pay Commission(December 1997)
184. Concept, Measurement and Policy Implications of the NAIRU - Perspective from Belgium(October 1997) Joost Verlinden
183. Structural unemployment in Denmark(September 1997) Agnete Gersing
182. The United Kingdom NAIRU: Concepts, Measurement and Policy Implications(September 1997) Chris Melliss and A.E. Webb
181. Globalisation and Linkages: Macro-Structural Challenges and Opportunities(August 1997) Pete Richardson
180. Regulation and Performance in the Distribution Sector(August 1997) Dirk Pilat
179. Measurement of Non-tariff Barriers(July 1997) Alan Deardorff and Robert M. Stern
178. The NAIRU-Concept: A Few Remarks(July 1997) Karl Pichelmann and Andreas Ulrich Schuh
177. Structural Unemployment in Finland(July 1997) Pasi Holm and Elina Somervouri
176. Taxation and Economic Performance(June 1997) Willi Leibfritz, John Thornton and Alexandra Bibbee
175. Long-Term Interest Rates in Globalised Markets(May 1997) Hans Christiansen and Charles Pigott
174. International Implications of European Economic and Monetary Union(May 1997) Norbert Funke and Mike Kennedy
173. The NAIRU in Japan: Measurement and its implications(March 1997) Fumihira Nishizaki
ECO/WKP(98)1
33
172. The Unemployment Problem - A Norwegian Perspective(February 1997) Steinar Holden
171. The Reliability of Quarterly National Accounts in Seven Major Countries: A User’s Perspective(February 1997) Robert York and Paul Atkinson
170. Confidence Indicators and their Relationship to changes in Economic Activity(November 1996) Teresa Santero and Niels Westerlund.
169. Labour Productivity Levels in OECD Countries. Estimates for Manufacturing and Selected ServiceSectors(September 1996) Dirk Pilat
168. Ageing Populations, Pension Systems and Government Budgets: Simulations for 20 OECDCountries(September 1996) Deborah Roseveare, Willi Leibfritz, Douglas Fore and Eckhard Wurzel
167. Modelling the Supply Side of the Seven Major OECD Economies(September 1996) Dave Turner, Pete Richardson and Sylvie Rauffet
166. Size Distribution of Output and Employment: A Data Set For Manufacturing Industries in FiveOECD Countries, 1960s-1990(August 1996) Bart van Ark and Erik Monnikhof
165. Trade and Competition: Frictions after the Uruguay Round(July 1996) International Trade and Investment Division
164. Corporate Governance, Competition and Performance(June 1996) Colin Mayer
163. Fiscal Relations within the European Union(May 1996) Peter Hoeller, Marie-Odile Louppe and Patrice Vergriete
162. Mark-Up Ratios in Manufacturing Industries(April 1996) Joaquim Oliveira Martins, Stefano Scarpetta and Dirk Pilat
161. Innovation, Firm Size and Market Structure: Schumpeterian Hypotheses and some new Themes(April 1996) George Symeonidis
160. Valuing the right to Tax Incomes: An Options Pricing Approach(April 1996) Teun Draaisma and Kathryn Gordon
159. Innovation and Competitive Advantage(October 1995) P.A. Geroski
158. Monetary Policy at Price Stability: A review of some issues(September 1995) Malcolm Edey, Norbert Funke, Mike Kennedy and Angel Palerm
157. Technical Progress, Factor Productivity and Macroeconomic Performance in the Medium Term(September 1995) Claude Giorno, Pete Richardson and Wim Suyker


