
PSAT™ 8/9
Understanding Scores UPDATED WITH ANSWER KEY AND SCORE CONVERSIONS
APRIL 1–26, 2019

Contact Us About College Board College Board is a mission-driven not-for-profit organization that connects students to college success and opportunity. Founded in 1900, College Board was created to expand access to higher education. Today, College Board’s membership is made up of over 6,000 of the world’s leading educational institutions and is dedicated to promoting excellence and equity in education. Each year, College Board helps more than seven million students prepare for a successful transition to college through programs and services in college readiness and college success—including the SAT® and the Advanced Placement Program®. The organization also serves the education community through research and advocacy on behalf of students, educators, and schools. For further information, visit collegeboard.org.
CONTACTS FOR PARENTS AND STUDENTS [email protected]
866-433-7728+1-212-713-8105 (International)8 a.m. to 7 p.m. ET, Mon.–Fri.
GENERAL CONTACTS PSAT 8/9P.O. Box 6720 Princeton, NJ 08541-6720
CONTACTS FOR EDUCATORS [email protected]
888-477-PSAT (7728)+1-212-237-1335 (International)8 a.m.–8 p.m. ET, Mon.–Fri.

The PSAT 8/9 and the SAT Suite of Assessments
The SAT Suite of Assessments The SAT® Suite of Assessments is an integrated system oftests that includes the SAT (for students in grades 11 and 12),the PSAT/NMSQT® and the PSAT™ 10 (for grades 10 and 11),and the PSAT™ 8/9 (for grades 8 and 9).
The tests measure the same skills and knowledge in grade-appropriate ways. They work together to show collegereadiness over time so educators, students, and parents canmonitor student progress. Their content reflects the kind ofmeaningful, engaging, and challenging work that studentsfind in the best middle school and high school coursestaught today.
What the PSAT 8/9 Measures The PSAT 8/9 measures the skills and knowledge (at the level of content and skill appropriate for eighth and ninth grades) that research shows are the most important for success in college and career. The Reading Test measures comprehension and reasoning skills, and focuses on close reading of passages in a wide array of subject areas. The Writing and Language Test measures a range of skills, including command of evidence, expression of ideas, and the use of standard English conventions in grammar and punctuation. The Math Test covers a range of math practices, with an emphasis on problem solving, modeling, using tools strategically, and using algebraic structure.
How the PSAT 8/9 Is Scored Students receive a total score that is the sum of their scores on the two sections (Evidence-Based Reading and Writing and Math).
To calculate section scores, we first compute the student’sraw score—the number of questions correctly answered—foreach section. Nothing is deducted for incorrect answers or forunanswered questions.
Next, we convert each of the raw section scores to a scaled score of 120 to 720. This conversion process adjusts forslight differences in difficulty among versions of the test andprovides a score that is consistent across different versions.The scaled scores are the scores provided on score reports.
How You Can Use the Student Score Report The student score report clearly summarizes a student’scurrent achievement levels and encourages next steps foracademic progress. You can help students by going over theirscore reports and helping them understand what their scoresmean. Here’s how.
TALK WITH STUDENTS ABOUT COLLEGE READINESS For each section, the score report includes an indicatorthat shows whether the student’s score meets the grade-level benchmark. These benchmarks allow students and educators to understand how students are progressing towardcollege readiness.
§ If a student is meeting the benchmark for a section, remind them to continue to take rigorous courses and work hard to stay on track for college success.
§ If a student is not meeting the benchmark for a section, connect them to classroom work that is focused on areas that need improvement.
1

USE STUDENT SCORES TO IDENTIFY STRENGTHS AND WEAKNESSES § Use test scores, as well as the cross-test scores and
subscores online, to evaluate a student’s relative strengths and weaknesses and to determine which skills need practice.
§ Use the red/yellow/green coding on section scores to see how your student is performing relative to other students who are meeting or exceeding the benchmark.
w Highlight the areas in green as the student’s strengths.
w Prioritize areas in the red range for additional work and practice.
HELP STUDENTS DECIDE ON NEXT STEPS § Work with your students to think of ways to develop
each of the skills you have identified for focus and improvement.
§ Encourage students age 13 or over to go online for more details and to link their College Board account to Khan Academy for a free, personalized study plan.
For further guidance on interpreting score reports, see theProfessional Development modules for K–12 educators atsat.org/educators.
Score-Reporting Features On pages 12–13 of this booklet, you’ll find an annotatedsample score report that includes detailed explanations of theinformation that students receive about their college readinessskills. Students age 13 or over can access their online reportsto obtain more information and guidance.
The online reporting portal at k12reports.collegeboard.org offers you an array of powerful tools to assess your students’progress and plan instruction that delivers what they need.These tools include:
§ Flexible reports that can be sorted and filtered by key demographics.
§ Instructional planning support using test subscores in specific content areas, benchmarks, information for cross-subject tasks, and data for prescribing interventions when students are behind or ahead.
§ Question Analysis Report that helps educators connectsubscores to state standards, analyze students’ strengths and weaknesses, learn which mistakes were the most common, and look for opportunities to reinforce skills. (The Question Analysis Report won’t be available to schools participating in the test administration study or research group.)
§ Access to the AP Potential™ tool to pinpoint students who are likely to succeed in more challenging courses.
2
PSAT 8/9 Scores Total Scores ONLINE AND PAPER SCORE REPORTS The total score is the sum of the two section scores; its range is 240–1440.
Section Scores ONLINE AND PAPER SCORE REPORTS Your students receive scores in the range of 120–720 for each of two sections. The Evidence-Based Reading and Writing section score combines the scores for the Reading Test and the Writing and Language Test. The Math section score is derived from the Math Test score, including the calculator and no-calculator portions.
Test Scores ONLINE AND PAPER SCORE REPORTS The range for the following test scores is 6–36:
§ Reading
§ Writing and Language
§ Math
Cross-Test Scores ONLINE SCORE REPORT ONLY The range for cross-test scores is also 6–36. These scoresrepresent student performance on select questions acrossthe three tests and show a student’s strengths in thefollowing domains:
§ Analysis in History/Social Studies
§ Analysis in Science
Subscores ONLINE SCORE REPORT ONLY Subscores in the range of 1–15 offer feedback on student performance in the following skill areas:
§ Command of Evidence
§ Words in Context
§ Expression of Ideas
§ Standard English Conventions
§ Heart of Algebra
§ Problem Solving and Data Analysis
Score Ranges ONLINE SCORE REPORT ONLY A student’s ability is better represented by score ranges than points. Score ranges are derived from the standard error of measurement and show how much a student’s scores would likely vary if they took a different administration of the test under identical conditions.
From recent administrations of the PSAT 8/9, these ranges are approximately:
§ Total: ±40 points
§ Evidence-Based Reading and Writing: ±20 points
§ Math: ±30 points
§ Test scores, subscores, and cross-test scores: ±2 points
3
Score Scales and Score Changes Using PSAT 8/9 Scores to Project PSAT/NMSQT or PSAT 10 Scores The SAT Suite—from the PSAT 8/9 through the SAT—uses a common score scale for the total, section, test, and cross-test scores. The ranges reported for each assessment reflect grade-level appropriateness within the common scale. Thus, while the total range for the SAT is 400–1600, the total range for the PSAT 8/9 is 240–1440.
This common score scale means that a student who took the PSAT 8/9 and received a Math section score of 500 would be expected to also get a 500 on the SAT, the PSAT/NMSQT, or the PSAT 10 if they had taken any of those tests on that same day; a score of 500 represents the same level of academic achievement on all four assessments.
This also means that student growth across the SAT Suite is easy to determine. If a student takes the PSAT 8/9 this year and receives a 500 Math section score, then takes the PSAT/NMSQT or the PSAT 10 next year and earns a 550 Math section score, that student has shown a growth of 50 points, which likely resulted from hard work both in and out of school.
The total, section, test, and cross-test scores have been vertically scaled to allow the accurate measurement of growth from test to test. Encourage students to focus on the section scores if they are curious about the growth they can expect to see in their scores over the next year. They should look at the set of projected score ranges we have provided (only in online score reports) for students that reflect typical growth. Of course, a student’s individual growth will be shaped by the courses taken and by the practice the student undertakes between assessments.
Subscores (available online only) aren’t on a vertical scale, and therefore comparing performance year after year should be based on relative performance rather than by calculating student growth across tests.
Students who wish to improve their performance on thePSAT/NMSQT or the PSAT 10 should follow these guidelines:
§ Develop academic skills through challenging coursework.
§ Read extensively and develop strong writing skills.
§ Engage in deliberate practice in the three math areas that are emphasized the most in the assessments.
§ If they are age 13 or over, take a practice test and upload their results to Khan Academy for free, personalized practice of the skills they need to improve. To learn more, go to psat.org/practice.
4

Benchmarks and Red/Yellow/Green Performance The PSAT 8/9 Grade-Level Benchmarks The SAT Suite offers grade-level benchmarks that can be used to gauge whether students are on track for becoming college ready each year in grades 8–12. Grade-level benchmarks represent the section scores on each assessment that students should meet or exceed to be considered on track to be college ready.
The PSAT 8/9 reports separate benchmarks for eighth and ninth graders to help them understand their level of readiness for college and career training programs. The benchmarks help educators better understand how many students and also which students are on track to have the skills necessary for college-entry, credit-bearing courses. Equipped with this information, educators can support students who need extra help while there is still time for improvement. Teachers can also accelerate the progress of students who meet or exceed the benchmarks.
RECOMMENDED USES Grade-level benchmarks can help educators:
§ Identify students who are on track for success in college and career readiness.
§ Identify students who may need extra support while there is still time for improvement.
§ Find students who may be ready for more challenging coursework.
Grade-level benchmarks shouldn’t be used to assign academic tracks, to discourage students from pursuing college, or to keep students from participating in challenging courses. Rather, the benchmarks are intended to help all students better prepare for life after high school.
What the Benchmarks Mean The College and Career Readiness Benchmarks for the current SAT predict a 75% likelihood of achieving a C or higher in related first-semester, credit-bearing college courses. The benchmarks are set at the section level, so there is a benchmark for Evidence-Based Reading and Writing and a benchmark for Math.
Score reports for the PSAT/NMSQT, PSAT 10, and PSAT 8/9include grade-level benchmarks based on how students grow from year to year toward the SAT benchmarks.
PSAT 8/9 Grade-Level Benchmarks Evidence-Based
Reading and Writing Math
8th Grade PSAT 8/9 390 430
9th Grade PSAT 8/9 410 450
Additional Information Provided to Help You Understand Progress Toward College Readiness The student score report provides further context for understanding scores by showing a color-coded bar chart for the section scores. Students who met or exceeded the benchmark will be in the green portion of the score band. If students didn’t meet the benchmark but were close (within one year’s growth), their scores will be in the yellow portion. Students who have a score indicating more than a year’s growth below the grade-level benchmark will have a score in the red portion of the score band. Additionally, for each of the test scores and subscores, we have provided a color-coded guide to a student’s relative strengths (green) and weaknesses (red).
5
6
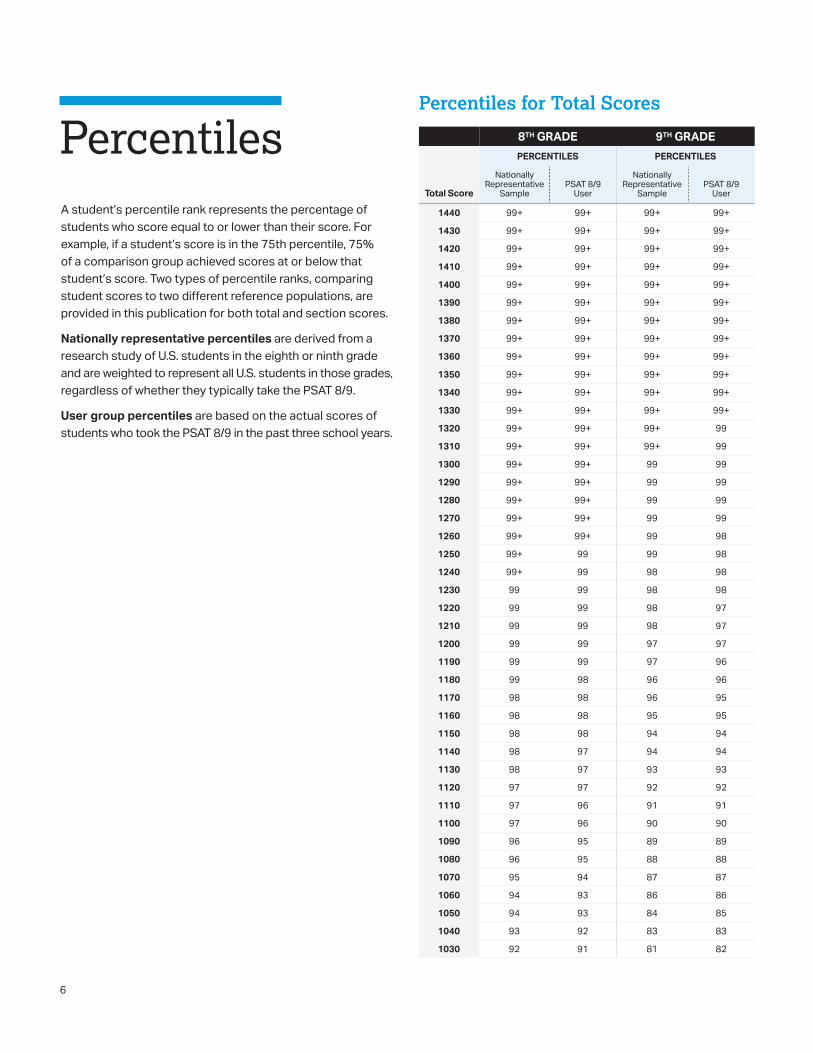
A student’s percentile rank represents the percentage of students who score equal to or lower than their score. For example, if a student’s score is in the 75th percentile, 75% of a comparison group achieved scores at or below that student’s score. Two types of percentile ranks, comparing student scores to two different reference populations, are provided in this publication for both total and section scores.
Nationally representative percentiles are derived from a research study of U.S. students in the eighth or ninth grade and are weighted to represent all U.S. students in those grades, regardless of whether they typically take the PSAT 8/9.
User group percentiles are based on the actual scores of students who took the PSAT 8/9 in the past three school years.
Percentiles 8TH GRADE 9TH GRADE
Total Score
PERCENTILES PERCENTILES
Nationally Representative
SamplePSAT 8/9
User
Nationally Representative
SamplePSAT 8/9
User
1440 99+ 99+ 99+ 99+
1430 99+ 99+ 99+ 99+
1420 99+ 99+ 99+ 99+
1410 99+ 99+ 99+ 99+
1400 99+ 99+ 99+ 99+
1390 99+ 99+ 99+ 99+
1380 99+ 99+ 99+ 99+
1370 99+ 99+ 99+ 99+
1360 99+ 99+ 99+ 99+
1350 99+ 99+ 99+ 99+
1340 99+ 99+ 99+ 99+
1330 99+ 99+ 99+ 99+
1320 99+ 99+ 99+ 99
1310 99+ 99+ 99+ 99
1300 99+ 99+ 99 99
1290 99+ 99+ 99 99
1280 99+ 99+ 99 99
1270 99+ 99+ 99 99
1260 99+ 99+ 99 98
1250 99+ 99 99 98
1240 99+ 99 98 98
1230 99 99 98 98
1220 99 99 98 97
1210 99 99 98 97
1200 99 99 97 97
1190 99 99 97 96
1180 99 98 96 96
1170 98 98 96 95
1160 98 98 95 95
1150 98 98 94 94
1140 98 97 94 94
1130 98 97 93 93
1120 97 97 92 92
1110 97 96 91 91
1100 97 96 90 90
1090 96 95 89 89
1080 96 95 88 88
1070 95 94 87 87
1060 94 93 86 86
1050 94 93 84 85
1040 93 92 83 83
1030 92 91 81 82
Percentiles for Total Scores
7
8TH GRADE 9TH GRADE
Total Score
PERCENTILES PERCENTILES
Nationally Representative
SamplePSAT 8/9
User
Nationally Representative
SamplePSAT 8/9
User
1020 91 90 80 81
1010 89 89 78 79
1000 88 88 76 78
990 86 87 74 76
980 85 86 72 74
970 83 84 70 73
960 80 83 68 71
950 78 82 66 69
940 77 80 64 67
930 75 78 62 65
920 73 77 60 63
910 71 75 57 61
900 69 73 55 59
890 67 72 53 57
880 65 70 50 55
870 62 68 48 53
860 60 65 46 51
850 57 63 43 49
840 55 61 41 46
830 52 59 38 44
820 50 56 36 42
810 47 54 33 40
800 44 51 31 37
790 41 48 29 35
780 38 46 26 33
770 35 43 24 31
760 32 40 22 28
750 29 37 20 26
740 26 35 18 24
730 23 32 16 22
720 21 29 14 20
710 19 26 12 18
700 16 23 11 16
690 14 21 9 14
680 13 18 8 12
670 11 16 7 11
660 9 14 5 9
650 8 12 4 8
640 6 10 4 7
630 5 9 3 6
620 4 8 2 5
610 3 6 2 4
8TH GRADE 9TH GRADE
Total Score
PERCENTILES PERCENTILES
Nationally Representative
SamplePSAT 8/9
User
Nationally Representative
SamplePSAT 8/9
User
600 3 5 1 3
590 2 4 1 3
580 2 4 1 2
570 1 3 1 2
560 1 3 1- 2
550 1- 2 1- 1
540 1- 2 1- 1
530 1- 2 1- 1
520 1- 1 1- 1
510 1- 1 1- 1
500 1- 1 1- 1
490 1- 1 1- 1
480 1- 1 1- 1-
470 1- 1 1- 1-
460 1- 1 1- 1-
450 1- 1- 1- 1-
440 1- 1- 1- 1-
430 1- 1- 1- 1-
420 1- 1- 1- 1-
410 1- 1- 1- 1-
400 1- 1- 1- 1-
390 1- 1- 1- 1-
380 1- 1- 1- 1-
370 1- 1- 1- 1-
360 1- 1- 1- 1-
350 1- 1- 1- 1-
340 1- 1- 1- 1-
330 1- 1- 1- 1-
320 1- 1- 1- 1-
310 1- 1- 1- 1-
300 1- 1- 1- 1-
290 1- 1- 1- 1-
280 1- 1- 1- 1-
270 1- 1- 1- 1-
260 1- 1- 1- 1-
250 1- 1- 1- 1-
240 1- 1- 1- 1-
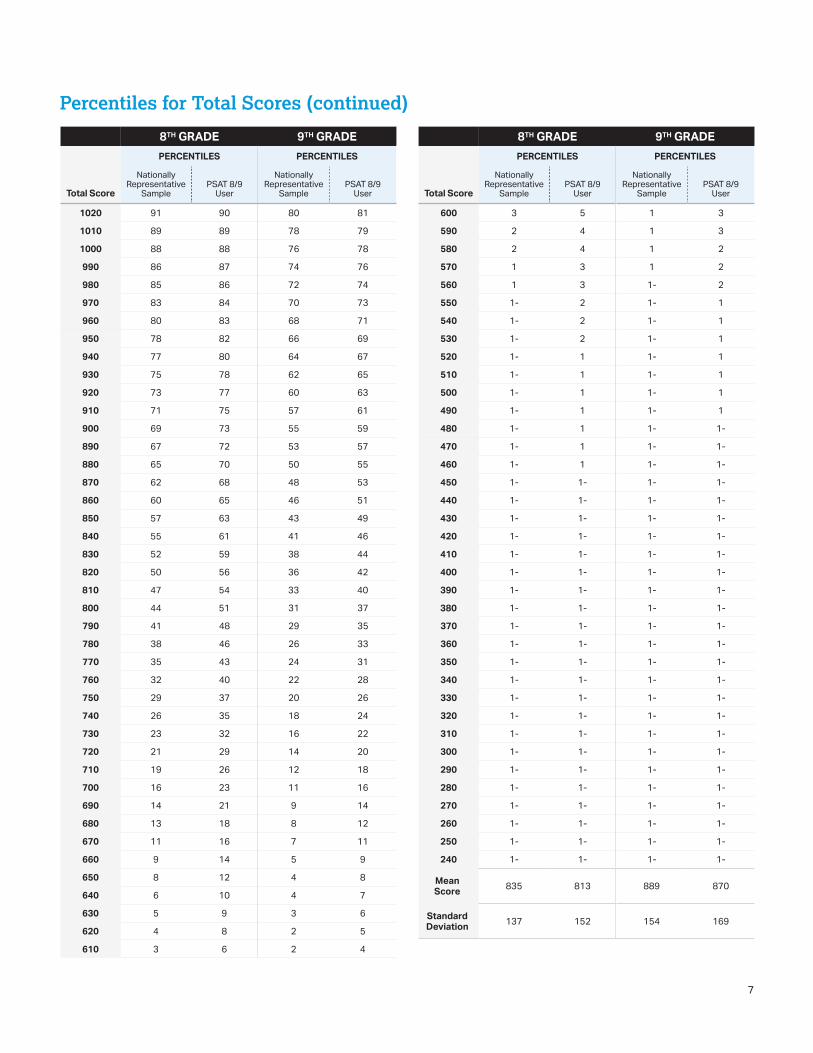
Mean Score 835 813 889 870
Standard Deviation 137 152 154 169
Percentiles for Total Scores Percentiles for Total Scores (continued)

8
8TH GRADE 9TH GRADE
Evidence-Based Reading and Writing Math
Evidence-Based Reading and Writing Math
Section Score
PERCENTILES PERCENTILES PERCENTILES PERCENTILES
Nationally Representative
SamplePSAT 8/9
User
Nationally Representative
SamplePSAT 8/9
User
Nationally Representative
SamplePSAT 8/9
User
Nationally Representative
SamplePSAT 8/9
User
720 99+ 99+ 99+ 99+ 99+ 99+ 99+ 99+
710 99+ 99+ 99+ 99+ 99+ 99+ 99+ 99+
700 99+ 99+ 99+ 99+ 99+ 99+ 99+ 99+
690 99+ 99+ 99+ 99+ 99+ 99+ 99+ 99+
680 99+ 99+ 99+ 99+ 99+ 99+ 99+ 99
670 99+ 99+ 99+ 99+ 99+ 99+ 99 99
660 99+ 99+ 99+ 99+ 99 99 99 99
650 99+ 99+ 99+ 99 99 99 99 99
640 99 99 99 99 99 98 99 98
630 99 99 99 99 98 98 98 98
620 99 99 99 99 97 97 98 98
610 99 98 99 99 96 96 97 97
600 98 98 99 99 95 95 97 96
590 98 97 99 98 94 94 96 96
580 97 97 99 98 93 93 95 95
570 96 96 98 97 91 91 94 94
560 95 95 98 97 89 89 92 92
550 94 93 97 96 87 87 90 91
540 92 92 96 95 85 85 88 89
530 91 90 94 94 82 82 86 87
520 89 89 93 93 79 80 83 85
510 86 87 91 91 76 77 80 82
500 84 85 88 89 73 74 77 79
490 81 82 85 86 69 71 74 76
480 78 80 83 84 66 68 69 72
470 74 77 79 81 62 64 65 69
460 71 74 75 77 59 61 60 64
450 67 71 69 73 55 58 55 60
440 63 68 63 69 51 54 49 55
430 58 64 58 64 47 50 44 51
420 54 60 53 59 42 46 39 46
410 49 56 50 55 38 42 35 42
400 44 52 46 50 33 38 32 38
390 39 47 38 44 29 34 27 33
380 33 42 30 38 25 30 21 28
370 27 37 26 32 21 26 18 24
360 22 32 22 27 17 22 15 20
Percentiles for Section Scores

9
Percentiles for Section Scores (continued)
8TH GRADE 9TH GRADE
Evidence-Based Reading and Writing Math
Evidence-Based Reading and Writing Math
Section Score
PERCENTILES PERCENTILES PERCENTILES PERCENTILES
Nationally Representative
SamplePSAT 8/9
User
Nationally Representative
SamplePSAT 8/9
User
Nationally Representative
SamplePSAT 8/9
User
Nationally Representative
SamplePSAT 8/9
User
350 17 27 19 23 13 18 12 17
340 13 22 16 20 10 15 10 14
330 9 17 13 16 7 11 8 11
320 6 13 11 13 4 8 6 9
310 4 9 8 10 3 6 4 7
300 3 7 6 8 2 4 3 6
290 2 5 5 6 1 3 2 4
280 1 3 3 5 1- 2 2 3
270 1 3 2 3 1- 1 1 2
260 1 2 2 3 1- 1 1 2
250 1- 2 2 3 1- 1 1 2
240 1- 1 1 2 1- 1 1- 1
230 1- 1 1 1 1- 1 1- 1
220 1- 1 1- 1 1- 1- 1- 1
210 1- 1 1- 1 1- 1- 1- 1
200 1- 1- 1- 1 1- 1- 1- 1
190 1- 1- 1- 1 1- 1- 1- 1-
180 1- 1- 1- 1- 1- 1- 1- 1-
170 1- 1- 1- 1- 1- 1- 1- 1-
160 1- 1- 1- 1- 1- 1- 1- 1-
150 1- 1- 1- 1- 1- 1- 1- 1-
140 1- 1- 1- 1- 1- 1- 1- 1-
130 1- 1- 1- 1- 1- 1- 1- 1-
120 1- 1- 1- 1- 1- 1- 1- 1-
Mean Score 422 408 414 405 446 438 443 432
Standard Deviation 76 85 75 80 85 92 81 88

10
Answer KeyApril 1–26, 2019, Test Form
Reading Test
SECTION 1
1 C2 D3 B4 A5 A6 B7 D8 D9 A
10 B11 D12 C13 C14 D15 A16 D17 D18 B19 D20 A21 C22 A23 A24 A25 B26 A27 B28 C29 A30 C31 D32 C33 B34 C35 C36 D37 A38 B39 B40 D41 B42 C
Writing and Language Test
SECTION 2
1 D2 D3 C4 B5 C6 A7 B8 A9 D
10 A11 A12 C13 C14 D15 B16 C17 A18 C19 A20 B21 B22 D23 B24 C25 B26 D27 D28 A29 C30 B31 B32 D33 D34 C35 A36 C37 B38 A39 D40 D
Math Test – No Calculator
SECTION 3
1 B2 B3 D4 D5 A6 C7 B8 A9 C
10 C11 712 213 10
Math Test – Calculator
SECTION 41 D2 A3 D4 B5 D6 C7 A8 B9 B
10 B11 C12 B13 C14 D15 A16 A17 C18 A19 D20 C21 A22 4023 1224 325 75
NOTE: For more detailed information about scores, visit psat.org/8-9-resources.
11
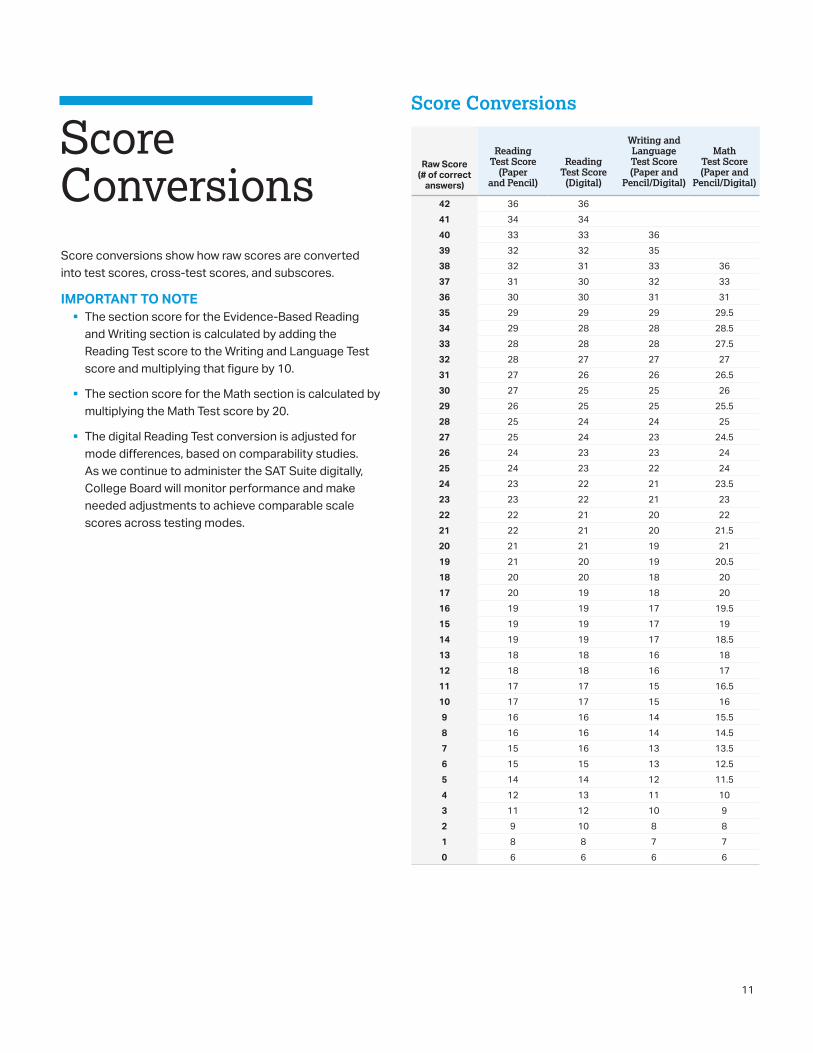
Score Conversions Score conversions show how raw scores are converted into test scores, cross-test scores, and subscores.
IMPORTANT TO NOTE§ The section score for the Evidence-Based Reading
and Writing section is calculated by adding the Reading Test score to the Writing and Language Test score and multiplying that figure by 10.
§ The section score for the Math section is calculated by multiplying the Math Test score by 20.
§ The digital Reading Test conversion is adjusted for mode differences, based on comparability studies. As we continue to administer the SAT Suite digitally, College Board will monitor performance and make needed adjustments to achieve comparable scale scores across testing modes.
Score Conversions
Raw Score (# of correct
answers)
Reading Test Score
(Paper and Pencil)
Reading Test Score (Digital)
Writing and Language Test Score (Paper and
Pencil/Digital)
Math Test Score (Paper and
Pencil/Digital)
42 36 3641 34 3440 33 33 3639 32 32 3538 32 31 33 3637 31 30 32 3336 30 30 31 3135 29 29 29 29.534 29 28 28 28.533 28 28 28 27.532 28 27 27 2731 27 26 26 26.530 27 25 25 2629 26 25 25 25.528 25 24 24 2527 25 24 23 24.526 24 23 23 2425 24 23 22 2424 23 22 21 23.523 23 22 21 2322 22 21 20 2221 22 21 20 21.520 21 21 19 2119 21 20 19 20.518 20 20 18 2017 20 19 18 2016 19 19 17 19.515 19 19 17 1914 19 19 17 18.513 18 18 16 1812 18 18 16 1711 17 17 15 16.510 17 17 15 169 16 16 14 15.58 16 16 14 14.57 15 16 13 13.56 15 15 13 12.55 14 14 12 11.54 12 13 11 103 11 12 10 92 9 10 8 81 8 8 7 70 6 6 6 6
12
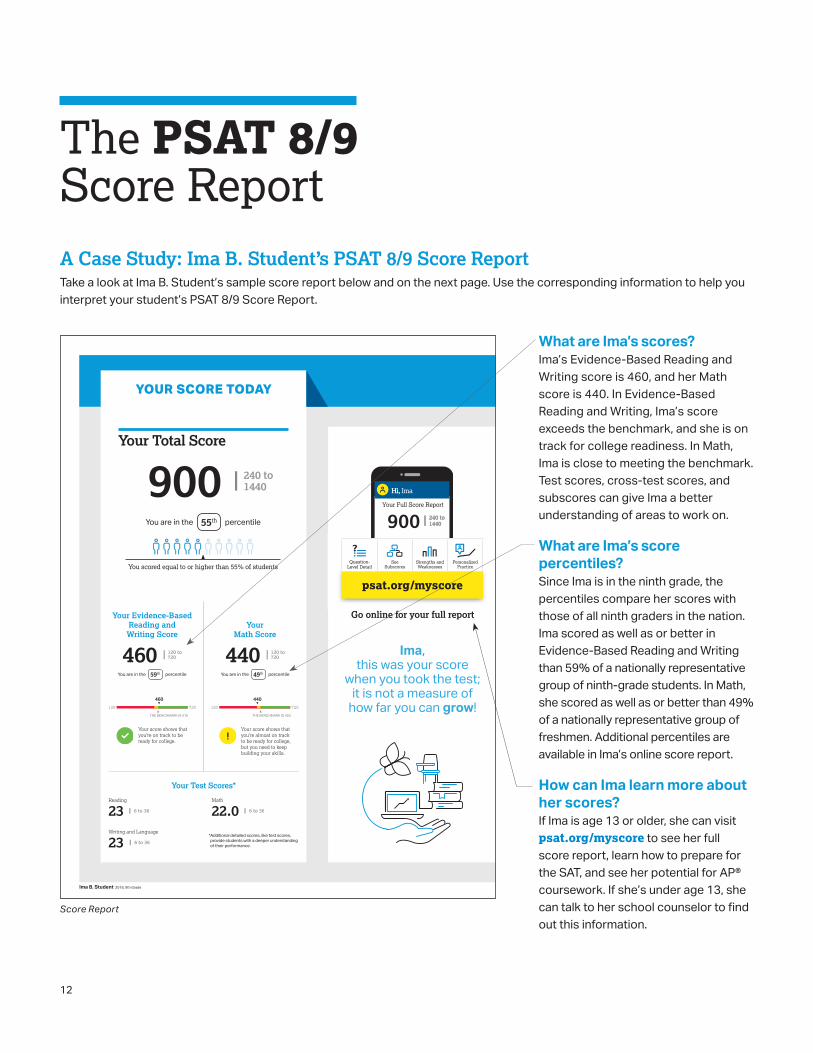
The PSAT 8/9 Score ReportA Case Study: Ima B. Student’s PSAT 8/9 Score Report Take a look at Ima B. Student’s sample score report below and on the next page. Use the corresponding information to help you interpret your student’s PSAT 8/9 Score Report.
this was your score
when you took the test; it is not a measure of
how far you can grow!
Your Total Score
YOUR SCORE TODAY
240 to 1440
You are in the percentile
120 to 720
You are in the percentile
Your Evidence-Based Reading and Writing Score
Your Math Score
You are in the percentile
120 to 720
Your Test Scores*
* Additional detailed scores, like test scores, provide students with a deeper understanding of their performance.
Reading
Writing and Language
Math
psat.org/myscore
Question-Level Detail
See Subscores
?Strengths and Weaknesses
Personalized Practice
Your Full Score Report
Hi,
240 to 1440
Hi,
240 to 1440
Go online for your full report
Ima,
Ima B. Student 2018, 9th Grade
90055th
You scored equal to or higher than 55% of students
46059th 49th
440
120 720
460
THE BENCHMARK IS 410
120 720
440
THE BENCHMARK IS 450
Your score shows that you’re on track to be ready for college.
Your score shows that you’re almost on track to be ready for college, but you need to keep building your skills.
23 8 to 386 to 36
23 6 to 36
22.0 6 to 36
900
Ima
Score Report
What are Ima’s scores?Ima’s Evidence-Based Reading and Writing score is 460, and her Math score is 440. In Evidence-Based Reading and Writing, Ima’s score exceeds the benchmark, and she is on track for college readiness. In Math, Ima is close to meeting the benchmark. Test scores, cross-test scores, and subscores can give Ima a better understanding of areas to work on.
What are Ima’s score percentiles?Since Ima is in the ninth grade, the percentiles compare her scores with those of all ninth graders in the nation. Ima scored as well as or better in Evidence-Based Reading and Writing than 59% of a nationally representative group of ninth-grade students. In Math, she scored as well as or better than 49% of a nationally representative group of freshmen. Additional percentiles are available in Ima’s online score report.
How can Ima learn more about her scores?If Ima is age 13 or older, she can visit psat.org/myscore to see her full score report, learn how to prepare for the SAT, and see her potential for AP® coursework. If she’s under age 13, she can talk to her school counselor to find out this information.

13
Here’s what else is waiting for you online:
You’re On Your Way
Congrats! You made a smart move when you took the PSAT 8/9.
Now invite your parents along for the ride—point them to a website where they can:
§ Get college planning tips.
§ Sign up for email and text reminders.
§ Browse FAQs.
Topics include scholarships, financial aid, high school coursework, and more.
Tell your parents about collegeboard.org/parents.
A PARENT’S GUIDE TO COLLEGE
Sign Up Today
YOUR PATH TOMORROW
A link to free personalized practice on Khan AcademyShare your scores with Khan Academy® to get your personalized practice.
A list of the challenging courses you’re ready for Congrats! Your scores show you’re ready to succeed in AP® courses.
Roadtrip NationRoadmap to Careers lets you explore careers and majors that align with your personal interests and connects you to compatible schools on BigFuture™. © 2018 The College Board. College Board, AP, SAT, and the acorn logo are
registered trademarks of the College Board. PSAT and BigFuture are trademarks owned by the College Board. PSAT/NMSQT is a registered trademark of the College Board and National Merit Scholarship Corporation. Visit the College Board on the web: collegeboard.org. Khan Academy is a registered trademark in the United States and other jurisdictions.
Ima B. Student 2018, 9th Grade
1
22
3
Score Report
What are Ima’s next steps?If Ima is age 13 or over, when she visits psat.org/myscore she can connect to free, personalized practice on Khan Academy, see her potential for AP coursework, and explore college majors and careers at Roadtrip Nation.
How can Ima measure her progress?When she becomes a sophomore, Ima can take the PSAT/NMSQT or the PSAT 10 to measure the progress she’s made since she took the PSAT 8/9. She can continue to take advantage of practice resources by visiting satpractice.org.
Your Question-Level Feedback
READING
Que
stio
n #
Corre
ct
Your
An
swer
Diffi
culty
123456789
101112131415161718192021222324252627282930313233343536373839404142
WRITING AND LANGUAGE
Que
stio
n #
Corre
ct
Your
An
swer
Diffi
culty
123456789
10111213141516171819202122232425262728293031323334353637383940
MATH – CALCULATOR
Que
stio
n #
Corre
ct
Your
An
swer
Diffi
culty
123456789
1011
MATH – CALCULATOR
Que
stio
n #
Corre
ct
Your
An
swer
Diffi
culty
12131415161718192021
Que
stio
n #
Corre
ct
Your
An
swer
Diffi
culty
22232425
Que
stio
n #
Corre
ct
Your
An
swer
Diffi
culty
12345
Que
stio
n #
Corre
ct
Your
An
swer
Diffi
culty
6789
10
MATH – NO CALCULATOR
Que
stio
n #
Corre
ct
Your
An
swer
Diffi
culty
111213
QUESTIONS OVERVIEW
READING
Total Questions
Correct Answers
Incorrect Answers
Omitted Answers
WRITING AND LANGUAGE
Total Questions
Correct Answers
Incorrect Answers
Omitted Answers
MATH – CALCULATOR
Total Questions
Correct Answers
Incorrect Answers
Omitted Answers
MATH – NO CALCULATOR
Total Questions
Correct Answers
Incorrect Answers
Omitted Answers
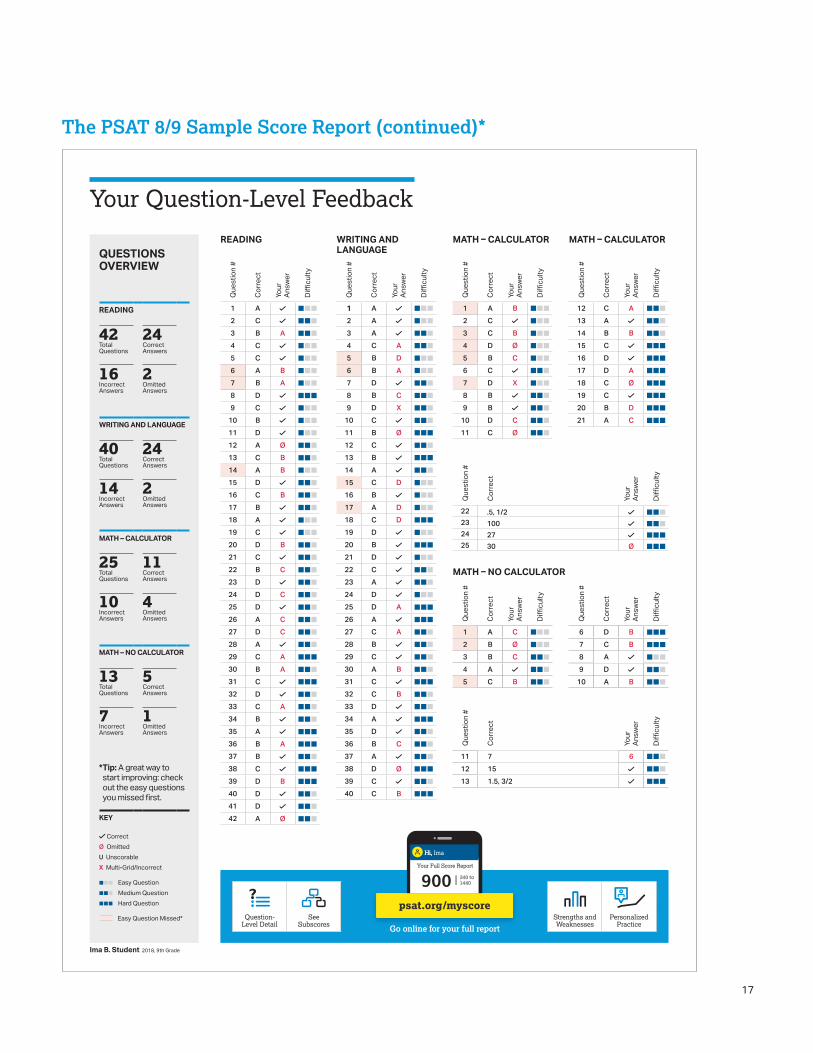
* Tip: A great way to start improving: check out the easy questions you missed first.
KEY
CorrectØ OmittedU UnscorableX Multi-Grid/Incorrect
¢¢¢ Easy Question¢¢¢ Medium Question¢¢¢ Hard Question
Easy Question Missed*
Go online for your full report
psat.org/myscore
Your Full Score Report
Hi,
240 to 1440
Hi,
240 to 1440
Question-Level Detail
See Subscores
?Strengths and Weaknesses
Personalized Practice
psat.org/myscore
1 A B ¢¢¢
C ¢¢¢
3 C B ¢¢¢
4 D Ø ¢¢¢
5 B C ¢¢¢
C ¢¢¢
7 D X ¢¢¢
B ¢¢¢
B ¢¢¢
D C ¢¢¢
C Ø ¢¢¢
C A ¢¢¢
A ¢¢¢
B B ¢¢¢
C ¢¢¢
D ¢¢¢
D A ¢¢¢
C Ø ¢¢¢
C ¢¢¢
B D ¢¢¢
A C ¢¢¢
1 A C ¢¢¢
2 B Ø ¢¢¢
B C ¢¢¢
A ¢¢¢
5 C B ¢¢¢
42 24
16 2
40 24
14 2
25 11
10 4
13 5
7 1
Ima B. Student 2018, 9th Grade
Ima
900
1 A ¢¢¢
A ¢¢¢
A ¢¢¢
C A ¢¢¢
5 B D ¢¢¢
6 B A ¢¢¢
D ¢¢¢
B C ¢¢¢
D X ¢¢¢
C ¢¢¢
B Ø ¢¢¢
C ¢¢¢
B ¢¢¢
A ¢¢¢
15 C D ¢¢¢
B ¢¢¢
17 A D ¢¢¢
C D ¢¢¢
D ¢¢¢
B ¢¢¢
D ¢¢¢
C ¢¢¢
A ¢¢¢
D ¢¢¢
D A ¢¢¢
A ¢¢¢
C A ¢¢¢
B ¢¢¢
C ¢¢¢
A B ¢¢¢
C ¢¢¢
C B ¢¢¢
D ¢¢¢
A ¢¢¢
D ¢¢¢
B C ¢¢¢
A ¢¢¢
D Ø ¢¢¢
C ¢¢¢
C B ¢¢¢
7 6 ¢¢¢
15 ¢¢¢
1.5, 3/2 ¢¢¢
.5, 1/2 ¢¢¢
100 ¢¢¢
27 ¢¢¢
30 Ø ¢¢¢
A ¢¢¢
C ¢¢¢
B A ¢¢¢
C ¢¢¢
C ¢¢¢
6 A B ¢¢¢
7 B A ¢¢¢
D ¢¢¢
C ¢¢¢
B ¢¢¢
D ¢¢¢
A Ø ¢¢¢
C B ¢¢¢
14 A B ¢¢¢
D ¢¢¢
C B ¢¢¢
B ¢¢¢
A ¢¢¢
C ¢¢¢
D B ¢¢¢
C ¢¢¢
B C ¢¢¢
D ¢¢¢
D C ¢¢¢
D ¢¢¢
A C ¢¢¢
D C ¢¢¢
A ¢¢¢
C A ¢¢¢
B A ¢¢¢
C ¢¢¢
D ¢¢¢
C A ¢¢¢
B ¢¢¢
A ¢¢¢
B A ¢¢¢
B ¢¢¢
C ¢¢¢
D B ¢¢¢
D ¢¢¢
D ¢¢¢
A Ø ¢¢¢
D B ¢¢¢
C B ¢¢¢
A ¢¢¢
D ¢¢¢
A B ¢¢¢
Score Report
How can Ima learn from her answers?The score report is designed to help Ima see how she performed by showing whether the answer was correct, incorrect, or omitted.
NOTE: For students at schools participating in the test administration study or research group, the actual questions, answers, and answer explanations won’t be provided, and the score report won’t include the correct answer column.
14
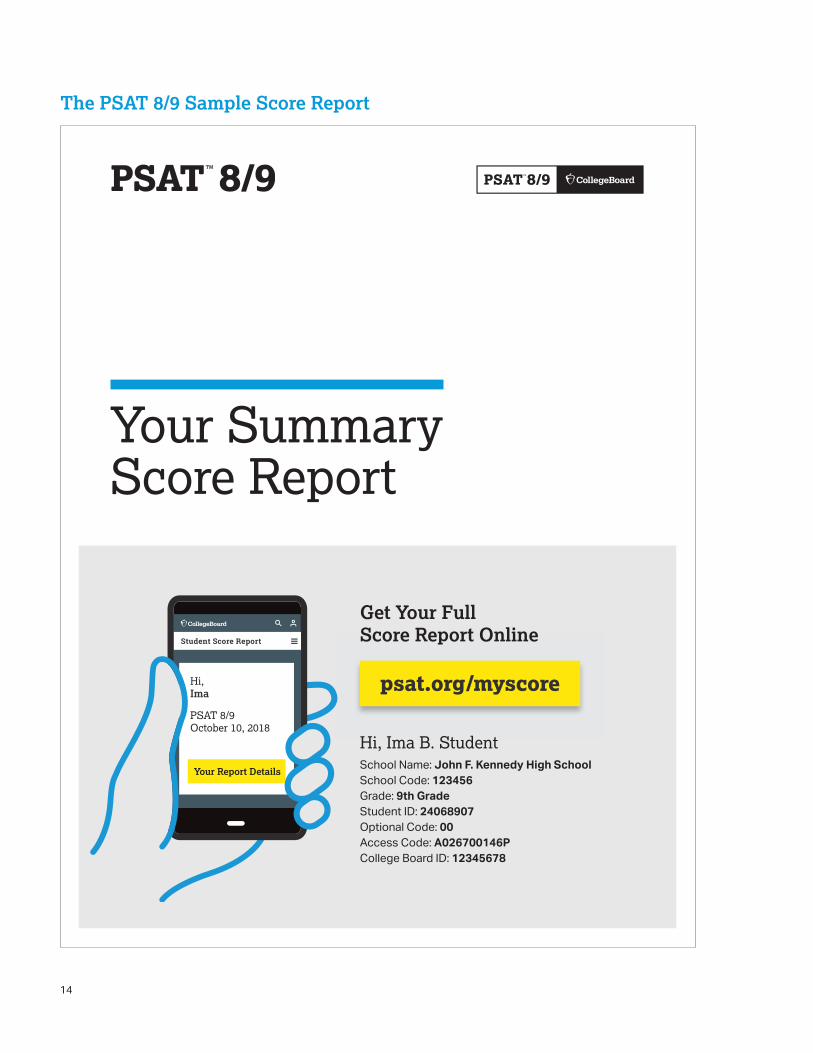
The PSAT 8/9 Sample Score Report
Your Summary Score Report
Get Your Full Score Report Online
psat.org/myscore,
Your Report Details
Student Score Report
Hi, Ima B. StudentSchool Name: John F. Kennedy High SchoolSchool Code: 123456Grade: 9th GradeStudent ID: 24068907Optional Code: 00Access Code: A026700146PCollege Board ID: 12345678
Hi,Ima
PSAT 8/9October 10, 2018

15
The PSAT 8/9 Sample Score Report (continued)
this was your score
when you took the test; it is not a measure of
how far you can grow!
Your Total Score
YOUR SCORE TODAY
240 to 1440
You are in the percentile
120 to 720
You are in the percentile
Your Evidence-Based Reading and Writing Score
Your Math Score
You are in the percentile
120 to 720
Your Test Scores*
* Additional detailed scores, like test scores, provide students with a deeper understanding of their performance.
Reading
Writing and Language
Math
psat.org/myscore
Question-Level Detail
See Subscores
?Strengths and Weaknesses
Personalized Practice
Your Full Score Report
Hi,
240 to 1440
Hi,
240 to 1440
Go online for your full report
Ima,
Ima B. Student 2018, 9th Grade
90055th
You scored equal to or higher than 55% of students
46059th 49th
440
120 720
460
THE BENCHMARK IS 410
120 720
440
THE BENCHMARK IS 450
Your score shows that you’re on track to be ready for college.
Your score shows that you’re almost on track to be ready for college, but you need to keep building your skills.
23 8 to 386 to 36
23 6 to 36
22.0 6 to 36
900
Ima

The PSAT 8/9 Sample Score Report (continued)
YOUR PATH TOMORROW
Here’s what else is waiting for you online:
1 A link to free personalized practice on Khan Academy Share your scores with Khan Academy® to get your personalized practice.
22 A list of the challenging courses you’re ready for Congrats! Your scores show you’re ready to succeed in AP® courses.
3 Roadtrip Nation Roadmap to Careers lets you explore careers and majors that align with your personal interests and connects you to compatible schools on BigFuture™.
You’re On Your Way
Congrats! You made a smart movewhen you took the PSAT 8/9.
Now invite your parents along for theride—point them to a website wherethey can:
§ Get college planning tips.
§ Sign up for email and text reminders.
§ Browse FAQs.
Topics include scholarships, financialaid, high school coursework, and more.
Tell your parents about collegeboard.org/parents.
Sign Up Today
A PARENT’S GUIDE TO COLLEGE
© 2018 The College Board. College Board, AP, SAT, and the acorn logo areregistered trademarks of the College Board. PSAT and BigFuture are trademarks owned by the College Board. PSAT/NMSQT is a registered trademark of the College Board and National Merit Scholarship Corporation. Visit the College Board on the web: collegeboard.org. Khan Academy is a registered trademark in the United States and other jurisdictions.
Ima B. Student 2018, 9th Grade
16
17
The PSAT 8/9 Sample Score Report (continued)*
Your Question-Level Feedback
READINGQ
uest
ion
#
Corre
ct
Your
An
swer
Diffi
culty
123456789
101112131415161718192021222324252627282930313233343536373839404142
WRITING AND LANGUAGE
Que
stio
n #
Corre
ct
Your
An
swer
Diffi
culty
123456789
10111213141516171819202122232425262728293031323334353637383940
MATH – CALCULATOR
Que
stio
n #
Corre
ct
Your
An
swer
Diffi
culty
123456789
1011
MATH – CALCULATOR
Que
stio
n #
Corre
ct
Your
An
swer
Diffi
culty
12131415161718192021
Que
stio
n #
Corre
ct
Your
An
swer
Diffi
culty
22232425
Que
stio
n #
Corre
ct
Your
An
swer
Diffi
culty
12345
Que
stio
n #
Corre
ct
Your
An
swer
Diffi
culty
6789
10
MATH – NO CALCULATOR
Que
stio
n #
Corre
ct
Your
An
swer
Diffi
culty
111213
QUESTIONS OVERVIEW
READING
Total Questions
Correct Answers
Incorrect Answers
Omitted Answers
WRITING AND LANGUAGE
Total Questions
Correct Answers
Incorrect Answers
Omitted Answers
MATH – CALCULATOR
Total Questions
Correct Answers
Incorrect Answers
Omitted Answers
MATH – NO CALCULATOR
Total Questions
Correct Answers
Incorrect Answers
Omitted Answers
* Tip: A great way to start improving: check out the easy questions you missed first.
KEY
CorrectØ OmittedU UnscorableX Multi-Grid/Incorrect
¢¢¢ Easy Question¢¢¢ Medium Question¢¢¢ Hard Question
Easy Question Missed*
Go online for your full report
psat.org/myscore
Your Full Score Report
Hi,
240 to 1440
Hi,
240 to 1440
Question-Level Detail
See Subscores
?Strengths and Weaknesses
Personalized Practice
psat.org/myscore
1 A B ¢¢¢
C ¢¢¢
3 C B ¢¢¢
4 D Ø ¢¢¢
5 B C ¢¢¢
C ¢¢¢
7 D X ¢¢¢
B ¢¢¢
B ¢¢¢
D C ¢¢¢
C Ø ¢¢¢
C A ¢¢¢
A ¢¢¢
B B ¢¢¢
C ¢¢¢
D ¢¢¢
D A ¢¢¢
C Ø ¢¢¢
C ¢¢¢
B D ¢¢¢
A C ¢¢¢
1 A C ¢¢¢
2 B Ø ¢¢¢
B C ¢¢¢
A ¢¢¢
5 C B ¢¢¢
42 24
16 2
40 24
14 2
25 11
10 4
13 5
7 1
Ima B. Student 2018, 9th Grade
Ima
900
1 A ¢¢¢
A ¢¢¢
A ¢¢¢
C A ¢¢¢
5 B D ¢¢¢
6 B A ¢¢¢
D ¢¢¢
B C ¢¢¢
D X ¢¢¢
C ¢¢¢
B Ø ¢¢¢
C ¢¢¢
B ¢¢¢
A ¢¢¢
15 C D ¢¢¢
B ¢¢¢
17 A D ¢¢¢
C D ¢¢¢
D ¢¢¢
B ¢¢¢
D ¢¢¢
C ¢¢¢
A ¢¢¢
D ¢¢¢
D A ¢¢¢
A ¢¢¢
C A ¢¢¢
B ¢¢¢
C ¢¢¢
A B ¢¢¢
C ¢¢¢
C B ¢¢¢
D ¢¢¢
A ¢¢¢
D ¢¢¢
B C ¢¢¢
A ¢¢¢
D Ø ¢¢¢
C ¢¢¢
C B ¢¢¢
7 6 ¢¢¢
15 ¢¢¢
1.5, 3/2 ¢¢¢
.5, 1/2 ¢¢¢
100 ¢¢¢
27 ¢¢¢
30 Ø ¢¢¢
A ¢¢¢
C ¢¢¢
B A ¢¢¢
C ¢¢¢
C ¢¢¢
6 A B ¢¢¢
7 B A ¢¢¢
D ¢¢¢
C ¢¢¢
B ¢¢¢
D ¢¢¢
A Ø ¢¢¢
C B ¢¢¢
14 A B ¢¢¢
D ¢¢¢
C B ¢¢¢
B ¢¢¢
A ¢¢¢
C ¢¢¢
D B ¢¢¢
C ¢¢¢
B C ¢¢¢
D ¢¢¢
D C ¢¢¢
D ¢¢¢
A C ¢¢¢
D C ¢¢¢
A ¢¢¢
C A ¢¢¢
B A ¢¢¢
C ¢¢¢
D ¢¢¢
C A ¢¢¢
B ¢¢¢
A ¢¢¢
B A ¢¢¢
B ¢¢¢
C ¢¢¢
D B ¢¢¢
D ¢¢¢
D ¢¢¢
A Ø ¢¢¢
D B ¢¢¢
C B ¢¢¢
A ¢¢¢
D ¢¢¢
A B ¢¢¢

© 2019 College Board. College Board, Advanced Placement Program, AP, SAT, and the acorn logo are registered trademarks of College Board. AP Potential, BigFuture, and PSAT are trademarks owned by College Board. PSAT/NMSQT is a registered trademark of College Board and National Merit Scholarship Corporation. All other marks are the property of their respective owners. Visit College Board on the web: collegeboard.org.Khan Academy is a registered trademark in the United States and other jurisdictions.01550-096


