
UNLV Theses, Dissertations, Professional Papers, and Capstones
5-1-2015
Understanding the Experience of MedicareAdvantage Patients in a Health MaintenanceOrganizationCurtis E. BoldmanUniversity of Nevada, Las Vegas, [email protected]
Follow this and additional works at: https://digitalscholarship.unlv.edu/thesesdissertations
Part of the Health and Medical Administration Commons
This Thesis is brought to you for free and open access by Digital Scholarship@UNLV. It has been accepted for inclusion in UNLV Theses, Dissertations,Professional Papers, and Capstones by an authorized administrator of Digital Scholarship@UNLV. For more information, please [email protected].
Repository CitationBoldman, Curtis E., "Understanding the Experience of Medicare Advantage Patients in a Health Maintenance Organization" (2015).UNLV Theses, Dissertations, Professional Papers, and Capstones. 2334.https://digitalscholarship.unlv.edu/thesesdissertations/2334

UNDERSTANDING THE EXPERIENCE OF MEDICARE ADVANTAGE PATIENTS
IN A HEALTH MAINTENANCE ORGANIZATION
By
Curtis Edward Boldman
Bachelor of Science in Supply Chain Management
Arizona State University
1998
A thesis submitted in partial fulfillment of requirements for the
Master of Science – Hotel Administration
William F. Harrah College of Hotel Administration
The Graduate College
University of Nevada, Las Vegas
May 2015

-----------------------------------------------
Copyright by Curtis Edward Boldman
All Rights Reserved
-----------------------------------------------

ii
We recommend the thesis prepared under our supervision by
Curtis Boldman
entitled
“Understanding the Experience of Medicare Advantage Patients in a
Health Maintenance Organization”
is approved in partial fulfillment of the requirements for the degree of
Master of Science - Hotel Administration
William F. Harrah College of Hotel Administration
Stowe Shoemaker, Ph.D., Committee Chair
Bo Bernhard, Ph.D., Committee Member
Rhonda Montgomery, Ph.D., Committee Member
Olena Mazurenko , Ph.D., Graduate College Representative
Kathryn Hausbeck Korgan, Ph.D., Interim Dean of the Graduate College
May 2015

iii
ABSTRACT
Understanding the Experience of Medicare Advantage Patients in a Health
Maintenance Organization
by
Curtis Boldman
Dr. Stowe Shoemaker, Committee Chair
Dean of the William F. Harrah College of Hotel Administration
University of Nevada, Las Vegas
This study was conducted using a single Health Maintenance Organization in Las
Vegas, NV to determine the key drivers and attributes of quality in the patient experience
for Medicare Advantage holders. The purpose of this study was to investigate these
perceptions of quality to assist the provider in identifying the areas in their treatment
process which could be refined in order to better serve their customer base. With the
recent changes in healthcare laws, patient satisfaction is now a key determinant in the
financial compensation providers receive for services performed.
Data was collected by doing patient intercepts outside of the selected provider
utilizing a questionnaire based on the 5Q model of service quality. A total of 84 usable
surveys were collected and the data shows that ultimately there is positive impact
between the quality of each point of contact with a patient, and the patient’s overall
satisfaction with their experience at the provider.
The data demonstrates that there is a connection between the quality of the
treatment process, the equipment and facilities, the exchange of information and the
interaction between patients and the provider’s staff. With this information the provider
can now make changes to their process to improve the patient’s experience at their
clinics. The study also solidifies the idea the customer service theory can be an effective
way on analyzing the healthcare industry.

iv
TABLE OF CONTENTS
ABSTRACT……………………………………………………………………………...iii
LIST OF TABLES………………………………………………………………………vii
LIST OF FIGURES……………………………………………………………………..viii
CHAPTER ONE: INTRODUCTION……………………………………………………..1
Theoretical and Conceptual Framework…………………………………………..4
Purpose Statement…………………………………………………………………5
Statement of Problem……………………………………………………………...5
Preview of Methodology…………………………………………………………..6
Limitations………………………………………………………………………...6
Summary…………………………………………………………………………..7
Definitions………………………………………………………………………....7
CHAPTER TWO: REVIEW OF LITERATURE…………………………………………9
Medicare Star Ratings……………………………………………………………..9
Important Medicare Patient Satisfaction Surveys………………………………..10
The Patient Experience…………………………………………………………..11
Service Quality…………………………………………………………………...12
Service Quality Models…………………………………………………………..13
SERVQUAL……………………………………………………………..13
GAP Model………………………………………………………………14
RATER Model…………………………………………………………...18
5Qs Model………………………………………………………………..20
Measuring the Patient Experience………………………………………………..21

v
Patient Perceptions of Quality…………………………………………………...25
Patient Satisfaction………………………………………………………………27
Selected Model…………………………………………………………………..29
Surveys as an Instrument of Measurement………………………………………32
CHAPTER THREE: RESEARCH METHODOLOGY…………………………………34
Study Participants………………………………………………………………..35
Questionnaire Design…………………………………………………………….36
Reliability………………………………………………………………..37
Validity…………………………………………………………………..38
Scoring and Analysis…………………………………………………….38
Administration of the Study……………………………………………………...39
Data Analysis…………………………………………………………………….40
Ethical Issues…………………………………………………………………….40
Potential Sources of Error………………………………………………………..41
Limitations……………………………………………………………………….41
CHAPTER FOUR: ANALYSIS OF THE DATA ………………………………………43
Data Collection…………………………………………………………………..43
Data Analysis…………………………………………………………………….43
Demographics……………………………………………………………………45
Statistical Results and Data Interpretation……………………………………….48
Multiple Linear Regression Analysis…………………………………………….49
Principle Component Analysis…………………………………………………..49
Hypothesis Testing………………………………………………………………52

vi
CHAPTER FIVE: RECOMMENDATIONS AND CONCLUSION……………………53
Key Findings……………………………………………………………………..53
Implications……………………………………………………………………....54
Limitations……………………………………………………………………….55
Discussion………………………………………………………………………..56
Conclusion……………………………………………………………………….58
Future Research………………………………………………………………….59
APPENDIX A: QUESTIONNAIRE…………………………………………………….61
APPENDIX B: INFORMED CONSENT DOCUMENT……………………………….64
APPENDIX C: GRAPHICAL REPRESENTATION OF DATA………………………66
APPENDIX D: PRINCIPLE COMPONENT ANALYSIS……………………………..71
APPENDIX E: FINAL REGRESSION MODEL………………………………………74
REFERENCES…………………………………………………………………………..75
CURRICULUM VITA…………………………………………………………………..81

vii
LIST OF TABLES
Table 1: Question and Hypothesis Correlation…………………………………………44
Table 2: Demographics…………………………………………………………………46
Table 3: Descriptive Statistics………………………………………………………….48
Table 4: Significant Coefficients……………………………………………………….49
Table 5: Significant Principle Coefficients……………………………………………..51

viii
LIST OF FIGURES
Figure 1: GAP Model……………………………………………………………………17
Figure 2: Gender Proportions Heat Map………………………………………………...47

1
CHAPTER ONE
INTRODUCTION
Healthcare in America is changing. “As the United States steps up to the historic
opportunity offered by the Affordable Care Act (ACA), the imperative for health care
transformation to the needs of an increasingly diverse population is indisputable”
(Clancy, Uchendu, & Jones, 2014, p. 527). The changes associated with the ACA have
slowly been implemented over recent years, and healthcare organizations are coming to a
realization that they may need make some changes in the way they operate. The number
of insured patients increased at a rate of 26% since the third quarter of 2014 (Clancy et
al., 2014). These increases are naturally leading to problems with wait times and the
quality of care. Issues such as these are forcing the healthcare industry to think outside
the box. While the days of having the same doctor, in the same office, with the same
staff for most of your life may be over, the personalization and feeling of comfort
associated with that type of experience is still something patients covet. Thus a
movement that views patients as consumers is gaining momentum in an attempt to create
a similar experience and raise patient satisfaction levels (Andrew, Salamonson, Everett,
Halcomb, & Davidson, 2011). This could very likely be the future of healthcare.
With changes to national healthcare laws a new set of issues has come to the
forefront in managed patient care of Medicare patients who use Health Maintenance
Organizations (HMO). With the implementation of the ACA there were some changes
made to Medicare to improve its services and extend its life. Some of these changes were
more preventive services, a lower payment for services performed, increased support for
doctors and a minimum of a 12-year extension of Medicare services (Medicare.gov,

2
2014a). With this increase in the number of insured Americans and the length of time
Americans are living, a strain is being put on these healthcare providers. These demands
are leading to increased wait times in getting appointments, in waiting rooms and an
overall unsatisfactory patient experience. Issues such as these are especially important to
healthcare providers who manage Medicare patients because healthcare providers in the
Medicare world are reimbursed for their services based on patient satisfaction ratings.
With the passage of the Patient Protection Act in 2010, payment incentives were created
to improve the “value” of healthcare delivery by improving the patient experience.
“Therefore a benefit exists in identifying the key drivers (attributes) of patient satisfaction
in a managed care setting” (Farley et al., 2014, p. 1).
The evolution of healthcare into a managed care system in the United States has
raised concerns about the quality and access of care to those seeking medical attention
(Meng, Jatulis, McDonald, & Legoretta, 1997). The previous statement was made in the
late 1990’s when there was initially a strong push for nationalized healthcare. That
evaluation came to fruition with the passage of the ACA, and with it there has come an
increasing perception that patients should be viewed as customers and customer
satisfaction measures are gaining credence in the healthcare industry (Andrew et al.,
2011). Consumer satisfaction has long been an important outcome measure of service-
based industries and these same measures now have a direct financial impact on the
healthcare industry (Farley et al., 2014). Therefore the need to identify the drivers of
patient (customer) satisfaction is more important than ever for HMOs. By identifying
these drivers healthcare providers can create an experience that the patient desires.

3
Customer satisfaction is one of the most extensively studied and researched areas
in businesses, especially in the realm of marketing and hospitality (Curtis, Abratt,
Rhoades, & Dion, 2011; Teixeira, Patricio, Nunes, Fisk, & Constatine, 2012). The
reason why is simple, companies are in constant search of methods to maximize sales,
increase profits and keep customers coming back. One factor in accomplishing these
goals is the satisfaction of the customer, which in turn leads to customer loyalty (Wilson,
Zeithaml, Bitner, & Gremler, 2008). Customers make purchases with some level of
expectation and if an organization is able to consistently meet those expectations their
ability to develop customer loyalty is greatly enhanced.
These same principles are becoming increasingly recognized in the healthcare
industry in terms of patient satisfaction. The frequency with which patient satisfaction is
used as an outcome to gain perspective on the patient’s view of healthcare is becoming
more prevalent in the healthcare industry (Andrew et al., 2011; Meng et al., 1997)).
Measuring patient satisfaction is similar to measuring variables of customer satisfaction.
When customers are satisfied with a purchase or experience they are more likely to do
repeat business with an organization, and likewise patients who are satisfied with their
care are more likely to stay with the same provider (Andrew et al., 2011). The carryover
of this concept into the healthcare industry is significant given the personal nature of the
business. Patient satisfaction is the desired outcome, but it is the entirety of the patient’s
experience that leads to that outcome.
Patient satisfaction and increasingly the patient experience has come to the
forefront of managed healthcare, mandated by recent legislative changes. This study

4
proposes to determine key drivers and attributes that influence patient satisfaction and
identify indicators of a successful patient experience.
It is important for this study to determine the various aspects that Medicare
Advantage patients perceive as essential to a quality healthcare experience while working
with and being treated at the selected provider’s clinics. This study will provide
information on these patients to the provider as well add a new element to patient
satisfaction and patient experience literature. Thus an analysis of satisfaction with
medical care revealed the areas for patient satisfaction and overall performance of an
organization included: overall quality, trust, reputation, continuity, competence,
information, organization, facilities, attention to psychosocial problems, humanness and
outcome of care (Hall & Dornan, 1988). Factors such as these need to be identified and
then manipulated by healthcare providers in a way that creates a satisfactory experience
for patients and loyalty for the provider.
Theoretical and Conceptual Framework
This study will look at three prevalent customer satisfaction models and select a
preferred model for the analysis of the data collected. All of the selected models have
been derived from the customer service theory that analyzes the differences between
customer expectations of service and their perceptions of the services received called
SERVQUAL. SERVQUAL is a quality management framework created to measure
quality in the service sector (Parasuraman, Zeithaml, & Berry, 1985). The preferred
model for this study will be selected after a review of the literature, and by creating the
questionnaire based upon the categories analyzed in the model. Selecting and organizing

5
information into the selected framework will allow for a thorough analysis of factors
involved in patient satisfaction in terms of customer service.
The first model that will be looked at is the 5Q model of service quality, which
allows a look at five key variables that influence customer satisfaction: quality of object,
quality of infrastructure, quality of interaction and quality of atmosphere (Zineldin,
2006a). The second selected model will be the RATER model of customer satisfaction
which focuses on: reliability, assurance, tangibles, empathy and responsiveness (Hussain
& Rehman, 2012). The final model to be examined is the GAP model of customer
service which will review: 1) Gap between consumer expectations and management
perceptions, 2) GAP between management perception and service quality specification,
3) Gap between service quality specification and service delivery, 4) Gap between
service delivery and external communications and 5) Gap between expected service and
service experienced (Headley & Choi, 1992).
Purpose Statement
HMOs are rapidly becoming an entity where customer service (patient
satisfaction) is mandated and taking a leading role in how these healthcare providers are
paid for performed services. Analyzing patients’ perceptions of quality and identifying
the predominate drivers is the key to designing an experience that will maximize patient
satisfaction and in turn revenue.
Statement of Problem
The basis of this paper is to determine key drivers and attributes of the patient
experience that influence patient satisfaction among Medicare Advantage holders at a
single Health Maintenance Organization (HMO) in Las Vegas, NV.
6
Preview of Methodology
The study was based primarily on quantitative data collected from a questionnaire
that was administered to patients at a selected clinic, managed by a single Health
Maintenance Organization. The HMO was selected after they approached the research
team in the hopes of gaining feedback as to why they are scoring low on the surveys that
make up their Medicare Star Ratings. Medicare Star Ratings are a rating system that has
an impact on how providers are reimbursed for their services (Darden & McCarthy,
2013). The questionnaire was designed by the research team based on a selected
customer service model, and developed after receiving input from the provider on the
themes identified during focus groups conducted by the HMO. There was also an
extensive review of the literature on the many facets related to this study utilizing the
library database at the University of Nevada-Las Vegas. The study will look at patient
satisfaction, the patient experience, patient’s perception of quality, and various customer
service models in order to select one that can be applied in the hopes of improving patient
satisfaction levels.
Limitations
The questionnaire administered was designed to collect quantitative data.
Quantitative data can sometimes fail to capture the deeper feelings as to why the selected
the answer that they did off of the survey. This why it is often recommend that the some
qualitative research be conducted in conjunction with quantitative research. In addition
the study’s focus on one HMO in Las Vegas providing service to Medicare Advantage
patients is a defining limitation. The information collected will be valuable to the

7
provider, but the services provided at other healthcare organizations both in Las Vegas
and elsewhere may differ and the results could be vary.
The results could differ based on many factors such as demographics of the
patient population, expectations of other patient populations and operations at different
providers. In addition to these factors there was limitations put on the research in terms
of the times and dates that research could be conducted. These limitations were put on
the study by the HMO and the research team to ensure that the study was done in a timely
manner with as little interruption to operations as possible.
Summary
With the broad changes in healthcare laws and an increased focus on patient
satisfaction and the patient experience, now is a perfect time to take a look at patient
satisfaction in terms of customer service. This becomes even more relevant given that
providers who service Medicare patients are now reimbursed based on patient satisfaction
surveys administered by the government. It is the goal of this study to identify through a
review of the literature grounded in theory and the administration of a questionnaire to
identify the key drivers of patient satisfaction. More importantly the study aims to
identify perceived expectations of quality in their healthcare experience, and use this
information to assist in the development of a satisfactory experience.
Definitions
Throughout this study, the following terms are used:
Customer Satisfaction – Measure of how a company’s goods and/or services meet or
exceed customer expectations (Giese & Cote, 2002).

8
Health Maintenance Organization – An organization that plans and organizes a patient’s
care for health insurance companies, usually having the patient pick one primary
physician who is responsible for referring the patient to any other physicians who usually
have partnerships with the insurance company (Blue Cross Blue Shield Blue Care
Network, n.d.).
Medicare Advantage Plan – Medicare Advantage health plans are a type of Medicare
health plan offered by private companies contracted through Medicare (Medicare,
2014b).
Patient Experience – The Beryl Institute defines the patient experience as “the sum of all
interactions, shaped by an organization’s culture, that influence patient perceptions,
across the continuum of care” (Wolf, J. A., Nierderhauser, V., Marshburn, D., & LaVela,
S. L., 2014, p. 8).
Patient Satisfaction – How a patient’s expectations of a good healthcare experience,
compare to their perception of the care they receive (Andrew et al., 2011).
Service Quality – An accomplishment in customer service achieved when a customer’s
expectations are met or exceeded (Seth, Deshmukh, & Vrat, 2005).

9
CHAPTER TWO
REVIEW OF LITERATURE
The term “patient experience” is rapidly becoming the focus of the healthcare
industry with the shifts in both public policy in terms of public reporting, incentives and
reimbursement, as well emergence of the consumer mindset (Wolf, Nierderhauser,
Marshburn, & LaVela, 2014). With the focus being moved toward a customer service
mindset the need to identify elements of the patient experience and how to enhance them
to achieve satisfactory outcomes has never been more important to the financial well-
being of healthcare organizations. A high level of patient satisfaction is the desired
outcome that providers are looking for when treating patients. To achieve these levels of
satisfaction healthcare companies are attempting to improve on all interactions with the
patient, or the patient’s experience. Delivering a great patient experience is increasingly
critical for healthcare providers to gain market share, increase profitability and improve
outcomes (Needham, 2012). This study aims to identify drivers of a satisfactory patient
experience in an effort to improve the perceived quality of the patient experience at a
single HMO specializing in Medicare patients.
Medicare Star Ratings
There needs to be a dual focus on not only the outcomes of the service but also
the process (Buttle, 1996; Gill & White, 2009). It seems as if organizations focus on one
or the other, however by analyzing the process in terms of the outcomes, healthcare
organizations can hone in on consistently delivering a quality experience for patients.
Organizations understand the importance of measuring patient satisfaction and will look
at the outcomes of patient feedback, but often times fail to analyze the individual patient
10
interactions to determine why the outcome is the way it is (Gill & White, 2009).
Analyzing the individual interactions and their impact on a patient’s satisfaction is
essential from HMOs to improve their patient care process. HMOs providing services to
Medicare patients are annually rated based on individual measures such as surveys that
are distributed to a percentage of the patient population. These surveys such as the
Consumer Assessment of Healthcare Provides and Systems (CAHPS) and the Health
Outcomes Survey (HOS) are then analyzed and a “Star Rating” of one through five stars
is assigned to the provider (Darden & McCarthy, 2013). This Star Rating is then the
basis for reimbursement for services performed by the provider, with CAHPS being
linked to 0.6 percent of reimbursement for Medicare (Needham, 2012).
While the current reimbursement platform is significant there are additional
incentives coming in 2015. “Medicare Advantage plans can earn substantial quality
bonus payments based on their performance on measures on clinical performance, patient
experience, patient-reported outcomes, and customer complaints and service indicators”
(Ryan & Damberg, 2013, p. 44). In 2010 “customer service” was added as one of the
five domains on which providers are rated (Darden & McCarthy, 2013). CAHPS surveys
ask consumers and patients to report on the quality of their experience when dealing with
healthcare providers (Agency for Healthcare Research and Quality, 2014).
Important Medicare Patient Satisfaction Surveys
There are two surveys that currently impact a Medicare provider’s Star Rating;
CAHPS and the HOS. These surveys make up two-fifths of a provider’s Star Rating and
thus can have significant impact on their ability to be reimbursed for services performed
(United Healthcare, n.d.). The CAHPS survey is given to the patients of a Medicare

11
provider in an effort to gauge the satisfaction levels with the services provided by the
healthcare organization, and to assess patients’ perceptions of the accessibility of the
provider (United Healthcare, n.d.). The HOS survey on the other hand is designed to
collect data on the patient’s mental and physical wellbeing over a period time to assess if
the provider has been making strides in improving the patient’s quality of life (United
Healthcare, n.d.). Other than effecting their ability to be reimbursed for services
performed these surveys also provide insight into how patients view the treatment they
are receiving.
The healthcare provider in this study is currently receiving failing marks in terms
of the quality of the patient experience on the CAHPS. Therefore the need exists to look
at what the drivers and attributes of quality are in the patient experience as it applies to
the CAHPS in an interest of developing processes and procedures that lead to consistent
satisfactory outcomes. While identifying these attributes and delivering a satisfactory
experience has financial implications for healthcare providers the true value is in
delivering an exceptional experience regardless on compensation (Needham, 2012).
The Patient Experience
One goal in healthcare should be to provide care to large numbers of people at a
reasonable cost. To do this effectively it is important that the patient be at the center of
the process and should be accomplished with the patient experience at the forefront
(LaVela & Gallan, 2014). To assist in this it is important to incorporate the patient’s
viewpoint of their experience (Lees, 2011). However, during this there is a transition
from the focus being primarily on the process to the evaluation of the process with a
focus on the outcome.

12
Truly understanding customer experiences means capturing information across all
interactions with a company and even other companies that support the overall customer
activity (Teixeira, Patricio, Nunes, Fisk, & Constatine, 2012). Customer service is a goal
in most industries and this type of analysis has been taking place for some time (Panda &
Das, 2014). Nowhere is this truer than in the hospitality industry where companies are
always trying to maximize their consumer’s experience (Panda & Das, 2014). This study
aims to use existing customer service theory to analyze the patient experience at the
participating HMO in terms of customer service.
Service Quality
In order to make this evaluation it is necessary to look at service quality and how
it is measured. Service can be defined as “any tangible act or performance that one party
offers to another that does not result in the ownership of anything” (Kotler & Keller,
2009, p. 789). The last couple of decades has seen a focus on service quality by
managers and researchers as they analyze its effect on business performance (Panda &
Das, 2014; Seth, Deshmukh, & Vrat, 2005). This focus on service quality is leading to an
increased knowledge as to what consumers are looking for in the services they utilize.
Headley and Choi (1992) put forth that “an investment in quality usually pays dividends”
(p. 5) and went on to summarize that by offering quality service businesses were able to
better attract first time customers, repeat customers, charge a higher price and enable
more effective marketing programs.
Quality care is generally considered to be the right of all patients and the
responsibility of the provider so it comes as no surprise that it is of vital importance to
healthcare organizations (Zineldin, 2006a). To effectively carry this out medical

13
organizations need to look at the process as well as all points of contact in the patient
experience. The process and the outcome of the service are dependent on interactions
and transactions with staff and the process itself (McKnight, 2009). Patients like most
consumers will seek out quality services when they are provided choice. It is then the
responsibility of the service provider to meet the expectations of the patient. To
effectively measure the quality of a patient’s experience, organizations must find the
difference between expectations and perceptions of the services rendered (Hussain &
Rehman, 2012).
Measuring these differences has been a goal of researchers for decades and a
number of service quality models have been created to aid in this. This study will look at
three service models utilized in various industries. This will be done in an attempt to
determine which one could best be used by the HMO in the study.
Service Quality Models
A number of relevant service quality models look at different perspectives and
utilize multiple methodologies (Seth et al., 2005). The three models being used in this
study include: RATER model, GAP model and the 5Qs model. They are all based on the
SERVQUAL model, which was created in 1985 by a group of American authors
("SERVQUAL," 2014; Parasuraman, Zeithaml, & Berry, 1985). It is the SERVQUAL
model that established the customer service theory that this study will be grounded in.
SERVQUAL
SERVQUAL was designed to summarize the nature and determinants of service
quality as perceived by consumers (Parasuraman, Zeithaml, & Berry, 1985).
SERVQUAL looks at customer perceptions and the relative importance of service

14
attributes by surveying customers against key service dimensions and comparing them
against an organization that is deemed as “excellent” (McKnight, 2009).
SERVQUAL is a multi-itemed scale developed to assess customer perceptions of
service quality in service and retail business (Parasuraman et al., 1988). After some
extensive focus group research 10 criteria for evaluating service quality were identified:
credibility, security, access, communication, understanding the customer, tangibles,
reliability, responsiveness, competence and courtesy (Lovelock & Wirtz, 2010). These
10 dimensions were later reduced to five because of correlation among many of the
original 10 variables (Lovelock & Wirtz, 2010). These five dimensions will be discussed
later as they are the framework for future models. SERVQUAL is valuable in that it
made strides to close the gaps between customer’s expectations of a service and their
perceptions of the service they receive by requiring respondents to answer questions
about both areas (Parasuraman et al., 1988). By using perceived as opposed to actual
service received makes the SERVQUAL measure an attitude measure that is related to,
but not the same as, satisfaction (Parasuraman et al., 1988). It this framework and
customer service theory that the models to be examined in this study are based, and the
theory from which this study will be conducted.
GAP Model
The GAP model is a management tool developed by the same authors who
developed SERVQUAL to identify five gaps that may cause customers to experience
poor service quality (Shoemaker & Lewis, 1999).
GAP 1: Between consumer expectations and management perceptions.
GAP 2: Between management perception and service quality specification.
GAP 3: Between service quality specification and service delivery.

15
GAP 4: Between service delivery and external communication.
GAP 5: Between expected service and experienced service (Headley & Choi,
1992).
This service quality model looks at several gaps as important in the design and
execution of quality service. Analysis of these gaps allow a service provider to better
understand their customers’ expectations and turn them into better service offerings
(Headley & Choi, 1992; Shoemaker & Lewis, 1999).
Figure 1 illustrates how each of these gaps works in the process. The diagram
shows the perspectives of both the consumer and the provider to demonstrate how each
gap will influence the other. The initial gap representing the gap between management
perceptions and consumer expectations is shown in the bottom box and leads into Gap 2.
In the analysis of these gaps it is important to identify what is both causing them and how
to close them. Shoemaker and Lewis (1999) looked closer at the GAP Model, especially
Gaps 1-3 because these Gaps have the most significant impact on customer loyalty. Gap
1 can be caused by any of the following reasons: inadequate market research, lack of
communication between management and customers and a lack of focus on building
relationships. To close this gap companies should spend time interacting with customers
to gain feedback on their products and services in an effort to close the communication
gap.
Gap 2 then leads into gap 3 but it is illustrated at this point that gaps begin to
impact the other gaps in no specific order. Gap 2 occurs when a providers designed
services do not meet customer expectations or the company is too focused on operations.
This gap can be closed fairly easily when management makes a full commitment to

16
customer service (Shoemaker & Lewis, 1999). Gap 3 (service quality specification and
delivery) occurs when employees of a company fail to deliver services to the desired
specifications of management (Lovelock & Wirtz, 2010). This gap is often caused by
poor communication between management and employees, or a lack of focus from
management on employee satisfaction (Shoemaker & Lewis, 1999). Gap 3 can be closed
by improving the approach in which a company hires its employees. By hiring the right
employees, for the right jobs and stressing the importance of customer service a company
can tighten up this gap (Lovelock & Wirtz, 2010). As seen in Figure 1, Gap 3 leads into
Gap 4 as well as directly impacting Gap 5.
Gap 4 (service delivery and external communication) occurs when a company
advertise and sell their services at a particular level but that is not what the company
delivers (Lovelock & Wirtz, 2010). Gap 4 can be closed by ensuring that communication
between operations and advertising is an open line of communication, as well ensuring
the services have been adequately tested to meet advertised expectations. Gap 5
(expected service and experienced service) can be caused when a consumer misinterprets
the service quality for something that it was not intended (McKnight, 2009). As
demonstrated by the arrows on the diagram, Gaps 2 through 5 all have a direct impact on
each other, ultimately leading from expected service back to management perceptions.
Lastly, the three areas of word of mouth, personal needs and past experience are
highlighted as to how the consumers will impact expected service. All of the gaps play a
role in the service process and an organizations ability to better understand all of the gaps
increases their ability provide a quality service (Headley & Choi, 1992).

17
Figure 1. GAP analysis model. Adapted from Parasuraman, A., Zeithaml, V. A., &
Berry, L. L. (1985).
The GAP model has fallen under some criticism because it is said that it does not
explain the measurement procedures for the measurement of gaps at the different levels
(Seth et al., 2005). It would seem that in analyzing the patient experience and its
outcomes, the study would be best served by using a service model that is clear it its
measurements. The GAP model is more one dimensional with a primary focus on
customer perceptions (Chakraborty & Majumdar, 2011). While perception plays a major
role in this study, there is an additional focus on expectations and outcomes. The model
measures service quality and identifies gaps but not the causes (Zineldin, 2006b). There
also seems to be a lack of focus on the quality of facilities and point by point interactions
between patients and staff, and when used by itself may not identify issues needed to
provide a clear picture on the changes necessary to improve the process and outcomes at
the selected provider (Dabney & Tzeng, 2013; Zineldin, 2006a).

18
RATER Model
The RATER model is a simplified version of SERVQUAL that breaks down and
measures service quality by looking at the following five dimensions:
Reliability: Ability to perform the desired service dependably and accurately.
Assurance: Knowledge and courtesy of employees and their ability to inspire trust
and confidence.
Tangibility: Physical facilities, equipment and appearance of personnel of an
organization.
Empathy: Caring, individualized attention the firm provides its customers.
Responsiveness: Willingness to help customers and provide prompt service
(Parasuraman et al., 1988).
By using these five dimensions an organization can gain insight into the
perceptions and expectations of their customers, and the quality of service can be
improved (Hussain & Rehman, 2012). The model is a good method for closing gaps
identified in the GAP model. An effective analysis of ones services allows an
organization to create a plan. To do this a provider will want to look at their “future
state”, where they want to be in terms of service, the level of service they are currently
providing and the necessary steps to get to their future state (Mind Tools, n.d.). After
determining where they want to be the organization will administer a questionnaire that
measures the customers’ expectations of service in terms of the five dimensions, and their
perception of the services they received (“SERVQUAL,” n.d.). RATER is a solid
resource for pinpointing areas that need attention and action to improve service quality
(Parasuraman et al., 1988).

19
Even with its popularity and widespread applications of RATER there is still
some skepticism, especially when applied to healthcare organizations. A primary
criticism of the model is that it focuses on the process of service and not the outcome.
There are additional theoretical and operational criticisms of the model such as
intercorrelation between the dimensions and that it fails to draw on other established
theories (Buttle, 1996; Hussain & Rehman, 2012). For the purpose of this study its
failure to look at the outcomes of the process is critical. In the healthcare industry
consistent improvement in the care process leading to a satisfactory patient experience is
a key outcome, and it seemed that looking at the process in terms of improvement and a
satisfactory outcome was essential.
The RATER and GAP models are both direct descendants of SERVQUAL and
the SERVQUAL models have been utilized in the healthcare industry with some success.
It is has been found that that SERVQUAL models are suitable in analyzing the perceptual
gap in understanding patient satisfaction and are a reliable and valid model in the hospital
environment (Chakraborty & Majumdar, 2011; Raposo, Alves, & Duarte, 2009). The use
of these models allows for the analysis of the process and questionnaires based on that
analysis provide management with a valuable tool in assessing their process.
It has also been shown that all five dimensions of service quality in the RATER
model are significant and reliable in healthcare settings (Chakraborty & Majumdar,
2011). However some have found that the model may be inappropriate for measuring
professional service and that it may not be generalized to healthcare services because of
the uniqueness of the services (Chakraborty & Majumdar, 2011). This could be

20
problematic for this study given that it will be looking at an HMO who specializes in
Medicare patients.
5Qs Model
The 5 Qualities Model (5Qs) was designed to expand on SERVQUAL models
into a framework of five quality dimensions as seen below (Zineldin, 2006b, p. 432):
Q1: Quality of object – The technical quality (what customer receives). It measures
the core product or service itself.
Q2: Quality of process – The functional quality (how the product or service provider
provides the core product or service (the technical). This can be used to pinpoint
problems in service delivery and to suggest solutions.
Q3: Quality of infrastructure – Measures the basic resources which are needed to
perform the product or service: the quality of internal competence and skills,
experience, know-how, technology, internal relationships, motivation, attitudes,
internal resources and activities, and how these activities are managed, co-
operated and co-ordinated.
Q4: Quality of interaction – Measures the quality of information exchange, financial
exchange and social exchange, etc.
Q5: Quality of atmosphere – The relationship and interaction process between the
customer-company are influenced by the quality of the atmosphere in a specific
environment where they operate. The atmosphere indicators should be considered
very critical and important because of the belief that lack of frankly and friendly
atmosphere explains poor quality and less loyalty (Zineldin, 2006b).

21
“The 5Qs model is more comprehensive and incorporates essential and
multidemonical attributes for customer relationship management which are missing from
other models” (Zineldin, 2006b, p. 432). The 5Qs model incorporates the atmosphere
and interaction between the customer and the staff which are left out of the SERVQUAL
models (Zineldin, 2006b). A component of goal oriented questions is also suggested in
the 5Qs model to make it more comprehensive. Zineldin believes that by incorporating
this component it will lead to “increased trust and an increased likelihood for positive
recommendations” (Zineldin, 2006a, p. 70).
The 5Qs model, being derived from SERVQUAL, incorporates aspects of
technical-functional models and expands the previous models ability to look at quality:
quality of object, process, infrastructure, interaction and atmosphere (Zineldin, 2006b).
In doing so the 5Qs model has set itself up as a model that healthcare providers can
utilize in order to evaluate patient satisfaction (Hussain & Rehman, 2012).
The criticism of the 5Qs model is that it focuses too much on perceptions and
leaves out expectations (Cardona & Bravo, 2011). This could be critical when evaluating
healthcare providers where it would seem like expectations would usually be high.
Expectations could play a significant role when evaluating a healthcare provider and
based on the literature the 5Qs may fail to properly account for this dimension.
Measuring the Patient Experience
As previously mentioned the Beryl Institute defines the patient experience as “the
sum of all interactions, shaped by an organization’s culture, that influence patient
perceptions, across the continuum of care” (Wolf et al., 2014, p. 8). While broad in its
scope the definition does provide basic framework from which we can begin to look at

22
elements of the patient experience. The ability to identify and measure indicators of the
patient experience is key if healthcare providers are to achieve the patient satisfaction
levels that they covet. LaVela and Gallen (2014, p. 29) who have contributed
significantly to the study of the patient experience noted, “measuring the patient
experience is important because it provides an opportunity to improve care, enhance
strategic decision making, meet patients’ expectations, effectively manage and monitor
health care performance, and document benchmarks for health care organizations”.
In measuring the patient experience healthcare providers can also make
improvements to the organization. These improvements include amelioration to the
processes and outcomes, and the provider can better utilize resources if they are aware of
the areas in which those resources will make the greatest impact on a patient’s experience
(LaVela & Gallan, 2014). In addition by making such improvements the provider
enhances its ability to both attract new patients and retain patients that they are currently
treating by enhancing loyalty (LaVela & Gallan, 2014). These improvements highlight
the goals of any successful business and provide insight for medical organizations as to
the importance of viewing the patient experience in terms of consumer satisfaction. This
view is increasingly taking a more important role in quality of care reforms and
healthcare delivery (Bleich, Ozaltin, & Murray, 2009).
Healthcare organizations realize that measurement of the patient experience is no
easy task (Needham, 2012). Problems exist in the measurement of the patient experience
do to a lack of agreed upon benchmarks, a standardized definition, established set of
standards and measurable indicators would be the preferred platform to work from when
establishing what matters most to patients and how to understand and improve those
23
factors (LaVela & Gallan, 2014). Adding to this difficulty is a reluctance by healthcare
organizations to take patient reported information as a valid measure. Reasons such as
patient feedback not being credible, factors not dealing directly with the quality of the
process and the patient-experience being influenced by immediate gratification rather that
the desired outcome, have all been highlighted as weaknesses by providers (LaVela &
Gallan, 2014). Accompanied by the numerous terms that have been used in conjunction
with or synonymously with patient experience, such as patient satisfaction, have created
difficulty in defining the indicators for measurement.
This led to the question proposed by LaVela and Gallan (2014) “is the right goal
being measured and how to do we incorporate the patient experience measure to
optimally achieve (and measure) the best clinical outcomes and/or subjective goals that
matter to patients?” (p. 29). By asking this questions healthcare organizations can begin
the journey of creating a process that will truly bring a customer service mindset to the
patient experience. Thus far these organizations have focused on improving things such
as wait times but for the most part little attention has been paid to the emotions and
stresses patients experience (Needham, 2012).
By taking into account the emotions associated with a patient’s health, and how
those emotions affect not only their experience but their perceived outcome of that
experience, providers can begin to close this gap. Therefore a framework needs to be
created that will focus on optimizing the patient experience by not only measuring the
tangible (physical) indicators of the experience but the intangible (emotional) experience
(Needham, 2012; Wolf et al., 2014).

24
To accomplish this, healthcare needs to adopt methods from other industries that
go beyond just aiming to measure satisfaction and look to measure the complete patient
experience (LaVela & Gallan, 2014). Improving the quality of the experience will take
an effort by providers to look at their process in a new light. Throughout the literature a
number of different views on the measurables of the patient experience were expressed
but some central themes were established. Autonomy, choice, communication,
confidentiality, dignity, prompt attention, quality of basic amenities and support (access
to family and community networks) were the indicators established by Bleich, Ozaltin
and Murray (2009) and set a basic framework from which the patient experience can be
approached. There were also the most consistent themes established in reviewed sources:
emotional and physical lived experiences, personal interactions, organization and culture,
responsiveness, information, perceptions and partnerships/patient involvement into
categories that can then be developed into instruments of measurement (Wolf et al.,
2014). By looking at the patient experience in these terms healthcare organizations can
begin to prioritize quality improvements to their process.
While there is still some question as to how the patient experience should be
defined and measured there is some consensus on a framework in which to move
forward. By building their services around the needs of the patient, healthcare
organizations can begin to take steps to improving the quality in their process (Needham,
2012). Incorporating the patient’s point of view has been shown to increase confidence
in healthcare services and proven to be a positive return on investment for providers
(Lees, 2011). In developing instruments that can capture not only the patient’s point of

25
view but the tangible aspects of the patient experience providers can position themselves
as pioneers in the industry as patient satisfaction takes on a more prominent role.
Patient Perceptions of Quality
To properly understand how to build instruments to measure the quality of the
patient experience, and use that information to build a process that leads to increased
patient satisfaction it is necessary to understand what patients perceive as quality (Sofaer
& Firminger, 2005). With an increased understanding of patient’s perceptions of quality,
providers can begin to identify dimensions of quality from the patient’s viewpoint. A
number of factors influence this perception such as: experience, knowledge, competence
of healthcare personnel, commitment to the patient, willingness to serve the patient,
reliability, trust, empathy and handling of critical factors (Duggirala, Rajendran, &
Anantharaman, 2008). Understanding the patient perspective is vital to developing
healthcare services that are patient-centric (Dabney & Tzeng, 2013). By acknowledging
that these factors influence perceptions of the care they provide, healthcare organizations
can achieve a more patient-centered process.
To improve the overall effectiveness and in turn increase patient satisfaction and
loyalty healthcare organizations need to engage patients on every level of their care
(Dabney & Tzeng, 2013). Effectively achieving this means that these organizations need
to look at the process through the eyes of the patient and how they define quality. Sofaer
and Firminger (2005) found that across a number of patient studies, that they categorized
their experience as quality experience in terms of patient-centered care. The areas that
were highlighted by patients in these studies “included having their physical and
emotional needs met; receiving individualized care; being involved with their care and

26
decision-making about their care; having doctors, nurses, and staff who have
personalized knowledge of the patient, who respect and know about the patient’s health
beliefs, including beliefs regarding non-Western health practices, who build report with
the patient, show respect for the patient, listen to the patient and anticipate the patient’s
needs; protecting patient privacy and confidentiality; having nurses who act as advocates
for the patient; giving equal care for all patients; and involving family and friends in the
care of the patient” (Sofaer & Firminger, 2005, p. 521). When accompanied with access
to services and quality of infrastructure, healthcare providers have a solid foundation
from which to analyze the quality of their process.
There are however issues with determining patients’ perceptions of quality that
need to be discussed. One such issue is the instability of patient definitions and
perceptions of quality (Sofaer & Firminger, 2005). These definitions can change based
on a number a reasons that were identified throughout the literature. Characteristics that
cause the variations can come from demographics, a patient’s health status and
difficulties that exist in determining whether patients’ understand the differences between
expectations and perceptions (Sofaer & Firminger, 2005). Additionally, difficulty exists
in that providers believe that the technical aspects of patient care cannot be reliably
evaluated by the patient (Sofaer & Firminger, 2005).
The importance of understanding patients perceptions of quality is paramount as
the healthcare industry continues to progress and patients are provided with more options.
By incorporating the highlighted aspects of patient-centered care, healthcare
organizations can refine their care process to focus on both the physical and emotional
needs of the patient. Focusing on the issues associated with identifying and measuring

27
patients’ perceptions of quality is essential to providers. As patients are required to
accept more financial responsibility in their healthcare they expect value in their
healthcare purchases, and this is achieved by providing them with a quality experience
(Dabney & Tzeng, 2013). It is not enough just to collect information about expectations
of patients through surveys or one-on-one interviews, the information must be used as a
tool to improve quality (Sofaer & Firminger, 2005). By embracing the concept of
patient-centered care, a healthcare organization can position itself as an industry leader
and set the standard for service quality.
Patient Satisfaction
Patient satisfaction as an outcome of providing a patient experience that is
centered on meeting the patient’s expectations of quality care, would seem to be the goal
of healthcare organizations. Research has demonstrated that patient satisfaction is
directly related to healthcare quality, and there is evidence that patient satisfaction plays a
role and individuals will move toward those organizations providing higher quality care
(Kessler & Mylod, 2011). This clearly illustrates the benefits of designing a process that
will lead to improved patient satisfaction. For HMOs this is vital as satisfaction is being
used to measure the performance of healthcare providers through public reporting and
pay-for-performance incentives (Farley et al., 2014).
With patient satisfaction being identified as not only the desired outcome of care
but as a key distinguisher of a quality process it is important to identify the areas of
service that drive satisfaction in healthcare. There have been numerous studies done on
what patients identify as the critical factors in what they believe lead to satisfactory care.
Outcome of care, access to care, personal interest in the patient and seeing their physician

28
of choice are all areas that patients have deemed as essential in the evaluation of a
satisfactory patient experience (Cliff, 2012; Gill & White, 2009; Meng et al., 1997).
With these areas highlighted providers have the foundation necessary to shape their
services to meet the expectations of their patients. If providers adopt these guidelines
they should see increased levels of patient satisfaction (Meng et al., 1997).
Much like the patient experience and patients’ perceptions of quality, problems
exist in accurately measuring patient satisfaction. It is difficult to draw a correlation
between a provider’s performance and patient satisfaction levels given the demand and
restrictions on the current healthcare system (Farley et al., 2014). Other issues with
measuring patient satisfaction exist in the characteristics of the patient. Identifiers such
as age, sex, geographical location, education, medication and utilization also can play a
role in a patient’s satisfaction level (Meng et al., 1997). A patient’s health may also play
a role in satisfaction levels. While the patient may be dissatisfied with their current
health, it may not be representative of either their treatment, or the process. “Those in
poor health status tended to be less satisfied with the selected dimensions (quality, costs,
availability), compared with those with better health status” (Rosenbach, 1995, p. 163).
The listed issues with the measurement of patient satisfaction are significant for Medicare
HMOs, as they can have an impact on their star ratings and in turn their ability to
generate revenue.
The problems with accurately measuring patient satisfaction do not discount its
significance in determining and measuring the outcomes of the patient experience. By
increasing patient satisfaction levels healthcare organizations can develop patients in
terms of customer service. There has been a significant statistical link shown between

29
patient satisfaction and loyalty (Kessler & Mylod, 2011). Like all business, developing
loyal, repeat customers, enhance an organizations ability to increase revenue. When the
development of loyal customers is accompanied by the previously discussed ability to
attract new patients, providers have reason to take patient satisfaction seriously. For
example hospitals who score in the top 25 percent of Hospital Consumer Assessment of
Healthcare Providers and Systems (HCAHPS) are on average the most profitable in the in
the industry (Cliff, 2012). This demonstrates the positive impact that patient-centered
care can have on a provider. “Patient satisfaction is regarded as an outcome of care itself,
and it is one of the major contributors toward better patient compliance leading,
presumably, to better clinical outcomes” (Duggirala et al., 2008, p. 560). With
reimbursement for services performed being based on patient satisfaction, within HMOs
providing Medicare services a need exists to focus on the care process and patient
experience. Once again these need to be designed to meet both the physical and
emotional needs of the patient.
Selected Model
The 5Qs model is the model adopted for this study. The focus on quality in both
interactions and atmosphere seem to be an ideal fit for evaluating and improving the
patient experience at healthcare providers. The 5Qs model views an organization as the
sum of interdependent systems and processes (Zineldin, 2006b). This view allows
management the ability to understand where problems occur and enhances their ability to
correct them. Zineldin (2006a) applied the 5Qs model to the healthcare industry and
identified characteristics of a quality healthcare experience in each of the five quality
dimensions:

30
Q1: Quality of object – measures the treatment itself.
Q2: Quality of process – measures how well healthcare activities are being
implemented. Examples include waiting times and speed of performing
healthcare activities.
Q3: Quality of infrastructure – measures the basic resources which are needed to
perform healthcare services.
Q4: Quality of interaction – measures the quality of information exchange. Examples
are the percentage of patients who are informed when to return for check-ups,
amount of time spent by physicians or nurses to understand the patient’s needs.
Q5: Quality of atmosphere – the relationship and interaction process between
healthcare workers and patients is influenced by the quality of the atmosphere in a
specific environment (Zineldin, 2006a).
The dimension above provide a solid foundation for analyzing the patient
experience, the perceptions of quality in that experience and attributes that ultimately
lead to a satisfactory experience. Each of the dimensions will be represented in the
patient questionnaire that will ultimately be used to determine the quality of the system
currently in place (Zineldin, 2006a).
The 5Qs model has been used to look at healthcare providers in other parts of the
world, and this study should add significantly to the previous research by looking at a
new demographic of patient, in a new country. The 5Qs model was intended to
effectively analyze the process and additionally the environment, which could play a role
in patient satisfaction. Zineldin (2006a) went on to state “this is applicable in hospitals,
medical centre or private medical clinic atmosphere where the patient, physician, nurses

31
and other healthcare staff are operating in turn, the atmosphere influenced by the
characteristics of the partners involved and the nature of the interaction itself. The
atmosphere can affect the perceived quality by improving it or making it worse” (p. 69).
Zineldin’s (2006a) original research was done at medical clinics in Jordan and
Egypt with funding from the European Union. He found that when the 5Qs model was
used to evaluate these clinics, that the model provided insight into which dimensions
would need to be influenced to improve patient satisfaction (Zineldin, 2006a). This
research was confirmed by Hussain and Rehman (2012) when they conducted a similar
study at University Hospital in Umea, Sweden. They too found that the by utilizing the
5Qs model the dimensions in which the hospital was failing to meet patient expectations
could be identified and then improved on (Hussain & Rehman, 2012). The success of
these studies gives credence to this study’s choice to utilize the 5Qs model to identify
dimensions in which the HMO provider in Las Vegas is failing to meet its patient’s
expectations.
Even with the success of these previous studies there are still potentially
limitations with the 5Qs model. As previously discussed one criticism of the 5Qs model
is that it focuses too much on perceptions and minimizes the impact of expectations.
Analyzing the differences between what a patient expects and what the patient perceives
of their experience with a provider is also important. The GAP model was created just
for this reason and has been successfully used in a number of industries. With this in
mind the study will need to take steps to ensure that it takes into account both perceptions
and expectations.

32
Surveys as an Instrument of Measurement
Surveys have proven to be reliable instrument for gaining insight into consumer
and patient experiences and expectations (Sofaer & Firminger, 2005). They are a
relatively inexpensive, quick, efficient and accurate way of collecting information about a
population (Zikmund, Babin, Carr, & Griffin, 2010). As a means of collecting data on a
large patient population, surveys are a productive instrument. In utilizing this instrument
of measurement organizations, and this study, have the ability gather data on patients’
perceptions of the healthcare process. In doing so a quantitative analysis can be
conducted that identifies themes in patient responses and draws conclusions based on
those themes (Zikmund et al., 2010). This has been demonstrated by increased use of
surveys such as CAHPS to evaluate the quality of care and level of patient satisfaction in
the healthcare industry. Sofaer and Firminger (2005) noted that these surveys have
“given us more confidence in the validity and salience of survey results and in research
that uses the results as measures of either independent or dependent variables” (p. 553).
It must be noted that there has been discussion as to the effectiveness of surveys
in measuring the patient experience and patient satisfaction. Areas such as the literacy of
the study population, the reliability and validity across cultures, the confusion between
expectations and experiences, and whether the results of surveys actually lead to clinical
improvements have all been discussed in the literature (Lees, 2011; Sofaer & Firminger,
2005). These areas are a concern to this study and others conducting this type of
research. These concerns provide justification for also including a more qualitative
method of data collection and are a primary reason this study was done in conjunction
with focus groups. Healthcare organizations have argued that surveys are not an
33
appropriate tool to discover objective elements of quality in the delivery of care (Farley et
al., 2014). Providers believe that patients are incapable of accurately portraying their
levels of satisfaction through the use of surveys. Even with these misgivings surveys
have proven to be representative, reliable and accurate when assessing a company, a
process or an individual in terms of quality (Lovelock & Wirtz, 2010).

34
CHAPTER THREE
RESEARCH METHODOLOGY
This chapter will explain the methods used to design and conduct this study. It
will look at the study’s proposed hypotheses, discuss the sample design and selection, the
instrument of measurement, how the instrument was administered and how the data was
analyzed. Furthermore the chapter will discuss limitations of the study and conclude with
ethical considerations of the research.
The HMO in this study is one of the largest providers of primary care services in
Nevada with over 200 providers, nine healthcare centers, five urgent care clinics and an
outpatient surgery center. Comparatively this is a good sized medical corporation and in
its region is one of the predominate providers of Medicare services. This study came
about due the selected HMOs failing marks in terms of the quality of their patient
experience on the CAHPS surveys. As previously discussed the CAHPS survey results
impact the providers Medicare Star Rating and ultimately their ability to be reimbursed
for services performed. In these terms the research conducted is critical for the HMO,
but there is a great deal more to be learned from this study. A quality experience should
be the goal of all healthcare providers, and the research conducted in this study will
contribute to previous research on both patient and customer satisfaction. With this
information healthcare providers can design a patient experience based on patients’
perceptions of quality, and this can assist in achieving their desired outcomes.
After reviewing the literature it was determined that there had been a number of
studies on the connections that exist between service quality and satisfaction. However,
very few have been done using the 5Q model of service quality which allowed the study

35
to take a closer look at how atmosphere, interaction and infrastructure can impact
patient’s perceptions of quality and satisfaction (Zineldin, 2006a). This study’s
utilization of the 5Qs model to measure patient satisfaction based on their perceptions of
quality pertaining to their experience has led to the development of the following
hypotheses.
H1: The quality of the treatment and interaction with the doctor will have a positive
impact on the patient’s experience.
H2: The quality of the healthcare process (wait times and scheduling) will have a
positive impact on the patient’s experience.
H3: The quality of the facilities and equipment will have a positive impact on the
patient’s experience.
H4: The quality of the information exchange between the provider and patients will have
a positive impact on the patient’s experience.
H5: The quality of interactions between the staff and patients will have a positive impact
on the patient’s experience.
Study Participants
The target population for this study is Medicare Advantage patients at the
participating HMO. By studying this population and establishing relationships between
the quality of process and patient satisfaction the study can add to existing research, and
be valuable for the participating HMO and other similar Medicare providers. Having
selected a survey as the research method it was necessary to select the participants who
would be used in the study. The sampling framework was one clinic from the selected
HMO providing service to Medicare Advantage patients in Las Vegas, NV.
36
A convenience sampling technique was utilized for selecting participants in this
study. This sampling technique allowed for the research team to survey all available
Medicare patients on the days that the HMO made available for administration of the
survey. Being that the survey was done in a clinic as patients were leaving, a
convenience sample was the most efficient way of administering the survey. It would
have been ideal to take a random sample from the HMOs database and survey them
directly, but this method was not feasible due to time constraints, and the HMOs desire to
have the study done at the clinics. The research team was directed by the provider to
administer this questionnaire to 100 participants during the allotted time at the clinic. A
sample size of 100 was the target because it would have provided the research team with
a large enough sample to be confident in the results. Given that the research team was
only provided with two dates on which they could administer the study, the potential
existed of the team not collecting 100 usable questionnaires.
Questionnaire Design
For the purpose of this study a questionnaire (located in appendix A) was built off
of previous qualitative research done by the HMO. The HMO conducted focus group
research on the quality of their process approximately three months prior to
administration of the questionnaire. The focus groups were selected by an independent
research firm and called into to participate in the study. The focus groups were recorded
and the recordings were provided to this research group for analyzing. By analyzing the
video areas in which patients seem dissatisfied were identified. Given that a portion of
the focus group questions were grounded in the 5Q model of service quality these focus
groups provided an excellent foundation for building the questionnaire that was

37
administered for this study. By utilizing a questionnaire both the research team and
HMO were able to generate findings that are more representative of the larger Medicare
population that is being treated at the provider.
The 5Q model of service quality was selected as the model from which the
questions in the survey would be based. The primary variables in the study are patient
satisfaction and the 5Qs model, with patient satisfaction being the dependent variable. In
other words patient satisfaction as an outcome is dependent on the quality of service in
the process. The 5Qs model will provided a framework from which the process was
broken down and questions targeting the five dimensions of service quality were
developed.
Reliability
The research conducted should demonstrate reliability characteristics, in that any
research attempting to recreate the study should find similar results. The use of a fixed-
alternative structured questionnaire is a good tool for developing a reliable study
(Zikmund, W. G., Babin, B. J., Carr, J. C., & Griffin, M., 2010). . Thus the use of the
survey administered in this study will make for a good tool in assisting future researcher
to replicate its findings. To truly test reliability of the study, the research would be best
served by implementing a test-retest method. In doing this the survey could be
administered a second time to the same respondents to verify the results of the first
survey. Given the time constraints of this research project it will not be possible to verify
in this manner.

38
Validity
There is also the potential for validity issues with the study. Validity with the
research will indicate the study’s ability to accurately represent the views of Medicare
Advantage patients on the quality of the patient experience and their subsequent
satisfaction levels. The questions in the survey will be designed to capture this
information as it is a vital part of the research that validity is established in the examined
dimensions with the questionnaire. On a large scale it may be difficult to establish
external validity because the study will only be conducted at one HMO, located in Las
Vegas, NV (Zikmund et al., 2010). However, internal validity should be established
because the research is a cause and effect study where one variable can impact another
(Zikmund et al., 2010). The survey utilized in this research uses questions with fixed
answers so this should provide an adequate level of internal validity.
Scoring and Analysis
The questionnaire is broken down into questions covering the five dimensions of
the 5Q model of service quality. It was done using a fixed-alternative questionnaire
which limits the number of responses available to the survey’s respondents. The survey
will be scored on a Likert Scale to gage the respondent’s reactions to different elements
on quality in the service process (Zikmund et al., 2010). This allows the participants to
decide how strongly they “agree” or “disagree” with the presented questions. A strong
agreement will garner a score of ten, demonstrating a favorable attitude towards the
presented statement (1=strongly disagree, 10=strongly agree). The survey was
constructed to avoid difficult questions and encourage participants to answer honestly,
thus the questionnaire was better suited to gather the information (data) the study needed
39
for analysis. The data was then analyzed using statistical software to determine if there
was a statistical significance in the quality of the patient experience as it pertains to
patient satisfaction levels.
Administration of The Study
This study took place at the selected clinic that falls under the guidance of the
HMO participating in this study. The survey was pretested to ensure the questionnaire
established the metrics that the study was intended to identify. This was done by taking a
convenience sample of Medicare patients on the morning prior to day the questionnaire
was fully administered. The ease of a convenience sample assisted in facilitating the
pretest in a timely manner.
As previously discussed the participants in the survey were also selected using a
convenience sampling technique. They were contacted at the selected HMO as they
checked out of the clinic and asked to participate in the survey. They were then read and
offered a copy on the University of Nevada, Las Vegas Informed Consent Document
(Appendix B) so that they had a full understanding of the process. There were two
members of the research team administering the survey at the provider over a two day
period. Both members of the survey team were trained to properly administer the survey
in an effort to eliminate potential errors. At the conclusion of the administration of the
survey the survey was collected by the research team for analysis.
The information collected is primary data which is data collected by the research
team and used to test the proposed hypotheses. It provides original and specific
information to be used in assessing the research problem (Hussain & Rehman, 2012).
For collection purposes the HMO administration was contacted to arrange for dates and

40
times in which the research team could administer the survey. Once at the clinic the
research team administered the survey to any interested parties that qualified as Medicare
Advantage patients.
Data Analysis
The information collected in this survey was analyzed to determine if there was
statistical significance between the quality of the process and patient satisfaction. Given
that the questionnaire was designed using the 5Q model of service quality it was
important to analyze the impact of the independent variables measuring quality on the
dependent variable of patient satisfaction. The data was analyzed using Minitab 17.0
statistical software to identify standard deviations, frequency, means, response rates to
the questions and various statistical regression tests.
Ethical Issues
There were potential ethical issues with this research process, and it is important
in research that ethical guidelines are both set and upheld. This is done to prevent
potential damage to those involved in the research process. For this study an informed
consent document was read to the participants to assist them in understanding the
research instrument and to aid in providing complete disclosure. There were also
measures in place to ensure that the information collected remains confidential. To assist
in maintaining confidentiality all surveys were taken anonymously. There were no
names or identifying information on the surveys and once collected the information was
maintained by the research team. The information is being presented as collected without
any modification and all participation was voluntary.
41
Potential Sources of Error
There were potential sources of error that needed to be protected against in the
administration of this study. One such error was administrative error in the analysis of
the data. To prevent this the data was reviewed by multiple researchers for verification
purposes. Only after sufficient review of the information yielded did the research
proceed with drawing conclusions. Other possible errors are: nonresponse errors from
respondents failing to complete the survey, acquiescence bias where the participants tend
to agree or disagree with all or most of the questions and deliberate falsification of survey
answers.
Limitations
With this research, as with all research there are limitations that need to be
addressed. One limitation exists in the method chose to carry out this study. While
surveys with close-ended questions are an excellent source for gathering information
quickly, inexpensively, efficiently and accurately about a population, they can also miss
some valuable data. They tend to be cold way of collecting data, and can fail to capture
the actual opinions of the participants as they only allow for limited responses. The
questionnaire involved in this study did not allow for a back and forth discussion with the
respondents. Therefore it may not have clearly identified the reasoning for their opinions
on the quality of the care they received.
Additional limitations existed in that only one HMO provider from Las Vegas,
NV was used in this study, and that a convenience sampling method was utilized. By
only using one provider the research can only be generalized to the population of that
provider. To gain an accurate view of the larger Medicare Advantage population it

42
would be necessary to conduct further research at other providers in other cities. Due to
time constraints that was not possible for this study. These time restraints also facilitated
the research being done using a convenience sampling technique which will make
projecting the findings of the study beyond the selected clinic carry some risk. Other
healthcare providers would assume risk in using the findings as a way of measuring the
quality of their process.
43
CHAPTER FOUR
ANALYSIS OF THE DATA
This study aims to identify drivers of quality in a patient’s experience and how
healthcare providers can improve their services by focusing on those drivers. As
previously mentioned the provider analyzed in this study has received failing marks on
their CAHPS in terms of quality so the research team utilized a survey as a means on
conducting a quantitative analysis on the quality of their treatment process. The research
team collected and analyzed this data, and the statistical results were interpreted and will
be presented in this chapter.
Data Collection
The data for this study was collected over a two day period on April 30, 2015 and
April 31, 2015. The participants in this study were Medicare Advantage Patients being
treated at the selected provider. The surveys were executed using Quick Tap Survey, a
survey application provided on the Apple IPad. The researchers intercepted potential
study candidates, asked for the voluntary participation and read the respondents the
University of Nevada, Las Vegas Informed Consent Document. The benefit of doing the
survey on the IPads was that the surveyors were able to ask the questions and enter the
answers. This lowered the potential for user error and unusable surveys. At the end of
the two days the research team had collected 84 useable surveys.
Data Analysis
After the data was collected it was transferred into Microsoft Excel so that if
could be formatted for use by Minitab. There were three questions associated with each
area of the 5Qs model and these questions were then coded to assist in the analysis. The

44
questions were assigned a value of V2 through V16 and designated to determine their
impact on V17 (Y or overall satisfaction with the experience) as seen in Table 1.
Table 1
Question and Hypothesis Correlation
Variable Question
V2 Today the doctor listened to my concerns.
V3 Today the doctor clearly explained my situation.
V4 Today the treatment I received met my expectations.
V5 Today's appointment was easy to schedule.
V6 I was able to get an appointment today that fit well into my schedule.
V7 The wait times at the clinic today were minimal.
V8 There was plenty of parking available today.
V9 It was easy to reach the clinic where my appointment was scheduled.
V10 The clinic was very clean today.
V11 Instructions I was given by the staff were easy to understand.
V12 The staff prepared me for what to expect throughout the visit.
V13 The staff was clear in their instructions for possible follow up visits.
V14 The staff was attentive to my concerns today.
V15 I was treated very well by the staff today.
V16 The staff was friendly today.
V17(Y) My experience at the clinic met my expectations today.
H1: The quality of the treatment and interaction with the doctor will have a positive
impact on the patient’s experience. (V2, V3, V4 impact Y in a positive way.)

45
H2: The quality of the healthcare process (wait times and scheduling) will have a
positive impact on the patient’s experience. (V5, V6, V7 impact Y in a positive way.)
H3: The quality of the facilities and equipment will have a positive impact on the
patient’s experience. (V8, V9, V10, impact Y in a positive way.)
H4: The quality of the information exchange between the provider and patients will have
a positive impact on the patient’s experience. (V11, V12, V13 impact Y in a positive
way.)
H5: The quality of interactions between the staff and patients will have a positive impact
on the patient’s experience. (V14, V15, V16 impact Y in a positive way.)
The data was then entered into Minitab and a graphical summary of the data
(Appendix C) was generated to show the frequency with which respondents chose the
various answers to the questions. The questions associated with the five areas of the 5Qs
model were scored on a ten-point Likert Scale. There was also one question associated
with the frequency with which participants use the facility. The graphically summary
shows the frequency that the respondents selected the corresponding numbers on each
question in the survey.
Demographics
In addition to the questions listed above there were three demographic questions
on the survey to help categorize the respondents. The majority of those who responded to
the survey were female (54%), white (67%) and fell between the ages of 66 and 70
(30%). Table 2 shows the breakdown of the variables examined by the demographics
questions.

46
Table 2
Demographics
Variable N %
Gender
Male 39 46
Female 45 54
Ethnicity
White 56 67
Black 10 12
Hispanic of Latino 16 19
Pacific Islander or Asian 2 2
Age
59 or Under 2 2
60-65 7 8
66-70 25 30
71-75 23 27
76-80 21 25
81 and over 6 7
As is shown in the above table demographics were broken down into three areas:
gender, age and ethnicity. Given the small sample size this study made the decision to
focus on whether gender played a role in a patient’s perceptions of a quality experience.
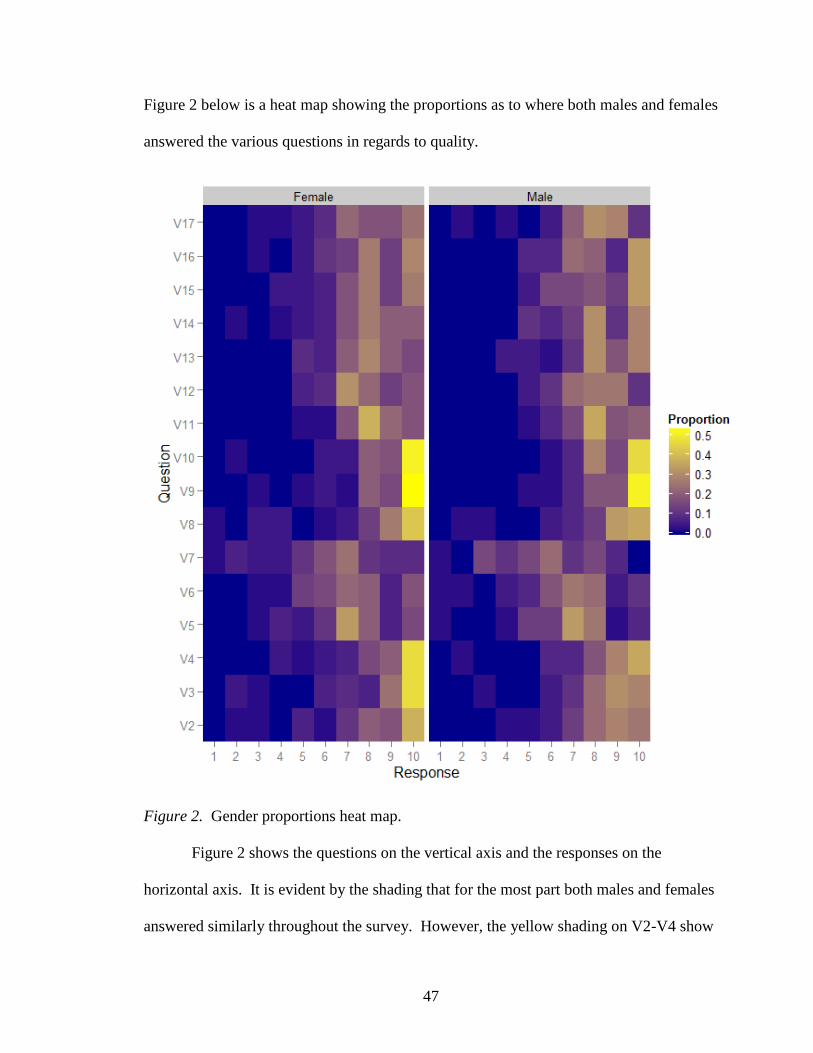
47
Figure 2 below is a heat map showing the proportions as to where both males and females
answered the various questions in regards to quality.
Figure 2. Gender proportions heat map.
Figure 2 shows the questions on the vertical axis and the responses on the
horizontal axis. It is evident by the shading that for the most part both males and females
answered similarly throughout the survey. However, the yellow shading on V2-V4 show

48
that females did tend to rate their interactions with the doctor more favorably than their
male counterparts.
Statistical Results and Data Interpretation
Table 3
Descriptive Statistics
Variable M SD n
Treatment (V2+V3+V4) 8.52 1.49 84
Process (V5+V6+V7) 6.75 1.76 84
Facilities (V8+V9+V10) 8.81 1.48 84
Information
(V11+V12+V13)
8.36 1.27 84
Interactions
(V14+V15+V16)
7.98 1.43 84
Overall Experience (V17) 7.93 2.43 84
Table 3 shows the mean and standard deviation of the five dimensions of the 5Qs
model of service quality and overall experience as related to this study. It is important to
note that all of the areas with the exception of process (V5+V6+V7) had means of 7.93 of
higher. Process came in with a mean of 6.75 which demonstrates that patients selected
lower numbers when it came to wait times and scheduling. This could be evidence of a
problem that the provider will want to address in their patient treatment process.

49
Multiple Linear Regression Analysis
Next a multiple linear regression (MLR) model was run to show the relationship
between Y (my experience at the clinic today met my expectations) the dependent
variable and independent variables (V2 through V16). After running this analysis it was
shown that only two variables were significant with a Variance Inflation Factor (VIF)
less than 10%. The results for V6 and V16 are shown in table 4 below.
Table 4
Significant Coefficients
Coefficients Beta Std. Error T-Value P-Value
V6 -0.332002 0.139622 -2.378 0.0228
V16 0.425828 0.162450 2.621 0.0128
The other independent variables in the regression showed a high degree of
multicollinearity or similarity, and had VIF’s sometimes exceeding 10% which resulted
in a poor initial model for analysis. It was decided that the model would be run a second
time after insignificant predictors were dropped from the formula and when this was done
the only on predictor left that was significant at 5% was V16 (the staff was friendly
today). This proved to be a poor model as well and it was determined that a Principle
Component Analysis (PCA) (Appendix D) should be run to determine which of the
variables should selected for a final regression model.
Principle Component Analysis
To remove the correlation between the importance ratings, a PCA was done for
the data collected on each segment of the total sample. Principal component analysis is

50
used to reduce a number of variables into smaller sets of composite variables, called
“components.” These components are linear combinations of the original variables. For
example we asked respondents three questions about their experience with the physician.
The answers to the three questions were very similar throughout the population. By
using a PCA we can combine the three questions into a single component.
One advantage of this is that the data becomes more meaningful and easier to
analyze. Rather than considering three individual attributes, you only need to think about
the thought that the three variables represent. This is an advantage in that by removing
the redundancy in the original data, the derived components are essentially uncorrelated
with each other. Principal component analysis is considered subjective because the
analyst needs to determine how many components to keep.
To determine which components to keep we looked at the data in the following
way. The PCA on the first set of questions (V2+V3+V4) revealed that PC1 explains
82.38% of the variance so it can be used in the final model. On the second set of
questions (V5+V6+V7) the first two PC’s explain 89.52% of the variability and therefore
can be used in the final model. When dealing with the third set of questions
(V8+V9+V10) it was determined the PC1 and PC2 would be used as they explained
91.36% of the variance. PC1 and PC2 once again were chosen from the next analysis as
they explained 88.99% of the variance in V11+V12+V13. The final set of questions
(V14+V15+V16) showed that only PC1 would be necessary for analysis as it explained
82.68% of the variance. With this information available a Principle Components
Regression (PCR) was run to determine which components were significant for a final
regression analysis to be run. The final regression model can be seen in Appendix E.

51
From this final model significant information was identified and can be seen
below in Table 5.
Table 5
Significant Principle Coefficients
Coefficients Estimate Std. Error T-Value P-Value Sig. VIF
Pca1D 0.10802 0.04702 2.297 0.0242 .05 1.16
Pca1EF -0.09890 0.05037 -1.964 0.0531 .10 1.06
Pca1INF -0.24114 0.07230 -3.335 0.0013 .05 1.59
Pca1INT -0.26580 0.05775 -4.602 1.57e-05 .05 1.63
In this table Pca1D can be thought of as the questions associated with treatment
(V2+V3+V4), Pca1EF can be thought of as equipment and facilities (V8+V9+V10),
Pca1INF can be thought of as V11+V12+V13 (information exchange) and interaction
with staff (V14+V15+V16) can be thought of as Pca1INT.
This final model produced an R-Square of 59.94%, and an adjusted R-squared of
57.91%, which indicates that nearly 60% of our dependent variables have success on the
statistical analysis. It also indicates that with 60% confidence that research can predict
future variability. Additionally Pca1D is 0.01802 which is greater than zero and each
loading is greater than zero which implies that Y (V17) increases with Pca1D. Pca1EF,
Pca1INF and Pca1INT are less than zero with all loadings being less than zero, which
implies that Y (V17) increases with all three components. This accompanied with all
four components having a VIF close to 1.00 demonstrates that the final PCR fits the data

52
quite well. With this analysis done it is now possible to look at the significance of the
five proposed hypotheses.
Hypothesis Testing
There were four components of the 5Qs model of service quality that
demonstrated a positive impact on the overall patient experience. Therefore based on the
analysis of the data the proposed hypotheses.
H1: The quality of the treatment and interaction with the doctor will have a positive
impact on the patient’s experience. (Accepted)
H2: The quality of the healthcare process (wait times and scheduling) will have a
positive impact on the patient’s experience. (Rejected)
H3: The quality of the facilities and equipment will have a positive impact on the
patient’s experience. (Accepted)
H4: The quality of the information exchange between the provider and patients will have
a positive impact on the patient’s experience. (Accepted)
H5: The quality of interactions between the staff and patients will have a positive impact
on the patient’s experience. (Accepted)

53
CHAPTER FIVE
RECOMMENDATIONS AND CONCLUSION
The purpose of this study was to utilize customer service theory, more specifically
the 5Q model of service quality to analyze the service process at the selected Medicare
HMO. Looking at an HMOs process in these terms had yet to be done, and by doing so
the research was able to identify weaknesses and just as importantly strengths in the
process of the selected provider. The study asked questions about the quality in five
distinct categories: treatment, wait times and scheduling, facilities, information exchange
and interactions with the staff. The study also looked for feedback on the patients overall
experience and the demographics of study’s population.
Key Findings
The data analysis showed a link between the quality of the process and the level
of satisfaction with their experience at the selected provider. Table 4 showed the means
and standard deviations within the five dimensions of the 5Qs model. While four of the
dimensions scored relatively well near or above a mean of 8.00, the area of quality of the
healthcare process as it deals with wait times and scheduling only scored a 6.75 which
could indicate displeasure among the patients with these areas. The standard deviation
for the process also was higher than the other dimensions which indicates are wider range
of answers being selected. This could demonstrate a lack of consistency in this area at
the provider.
Table 3 shows that generally males and females had the same experience during
their visits to the HMO. However, females did tend to rate their interactions with the

54
doctors higher than their male counterparts. This demonstrates that females feel as if
their interactions with the doctors are more favorable.
After running a PCA to better determine the variables to be used in the final
regression model it was eventually determined that four of the five dimensions of the 5Q
model of service quality had a positive impact on a patient’s experience. This aligns with
Zineldin’s theory that, “patient satisfaction is a cumulative combination of different
constructs, summing satisfaction with various facets of the healthcare organization, such
as technical, functional, infrastructure, interaction and atmosphere variables items”
(Hussain & Rehman, 2012, p. 36). The data also supports the researcher’s idea that it
takes a quality interaction in each aspect of the 5Qs model to have an overall positive
impact on patient satisfaction.
Implications
This research could have implications on both future research and the way that the
healthcare provider in this study operates. As the healthcare industry continues to
become more competitive and reimbursements for performed services hinge on patient
satisfaction levels this study can provide insight for companies looking to improve the
quality of their process. The literature on customer service theory has demonstrated the
importance of providing a quality experience. By providing a quality experience a
provider can have an effect on their ability to both attract and retain patients.
The practical implication of this study is that it provides specific answers to the
Health Maintenance Organization utilized for the research. The research provides insight
for the provider as to where their process is succeeding and failing to meet expectations.
They can use this information in conjunction with their knowledge of the CAHPS survey

55
to improve their ratings in terms of quality on the surveys that are sent out annually to
their patients. It provides them with a data set to show their employees areas in which
they can make an impact while keeping the patients’ perceptions of quality as the
company’s focus.
From a theoretical perspective the research provides insight into how to operate a
healthcare organization with a customer service mindset. The information gathered and
examined in this research through the use of reviewed literature and empirical data can be
used by future researchers. The study is a contribution to literature on healthcare quality
and the patient experience, and highlights that the 5Q model of service quality can be
used to effectively research the quality of a provider’s process. By looking at patients’
perceptions of quality, the predominate drives of quality and the attributes of a patient’s
experience that lead to patient satisfaction the study has added to the research in each of
these areas.
Limitations
The study did come across some limitations during its execution. The first
limitation encountered was that the research team was only able to accumulate 84 usable
surveys. While this is enough to provide statistical significance, it would have been
beneficial to the research to collect more. The increased participation would make the
information more generalizable to the larger population of the provider’s patients. This
lead to the study’s second limitation in that because of time limitations the research team
only had two days to collect responses to the questionnaire. This contributed to the study
not reaching its goal of 100 usable surveys.
56
Another limitation was not knowing the demographics and attitudes of the
employees working at the provider. There could be correlation between the ratings
identified in this study and these areas. For example women rated their experience with
doctors more favorably than men. Knowing the gender, ethnicity and other identifying
characteristics of the doctors treating the group could play an important role why the men
and women in this study answered these questions differently.
There were two more significant limitations that had an effect on the study. The
use of a convenience sampling technique which limits the randomization of the study.
Thus it is difficult for other providers to use the findings to make assumptions about their
patient populations. The use of one Medicare HMO provider in Las Vegas also put
limitations on the study. If the research had more time it would have been beneficial to
survey multiple providers in Las Vegas or other cities. This would make the data
collected more generalizable to the larger Medicare Advantage population.
Discussion
Studying the healthcare industry in terms of customer service theory can prove to
be useful to the medical industry. The data collected can help the provider and other
healthcare organizations to determine the areas of their patient treatment process in which
they are failing to meet patient expectations. Research has demonstrated that by focusing
on the patient’s experience, healthcare providers can generate the responses they desire
for the services they provide. Generating higher Medicare Star Ratings is now more
important than ever for healthcare organizations providing care to Medicare patients. As
of 2015 not only will it directly impact how they are reimbursed for services performed,

57
but with the implementation of bonus payments programs for quality care there is a new
revenue stream available for these providers.
Based on both the literature review and the results of this study it would be
beneficial for the healthcare organization in this study to begin implementing their own
hospitality and customer service programs. Achieving quality is a continually evolving
process so it is imperative that the healthcare organization create quality control positions
within their organization. These positions need to oversee every aspect of the patient’s
experience including clinical, administrative and operational functions of the provider.
By ensuring that each aspect of the company is meeting quality standards implemented to
improve the patient’s experience, providers can move past viewing the patient’s health
outcomes as a benchmark for success and embrace both the physical and emotional
health of the patient. By governing and demonstrating quality improvement, marked
improvement in the patient care process can be achieved and remain a priority.
In effort to engage patients more effectively the provider in this study could create
case manager or patient advocate positions. These positions would be a direct point of
contact for patients to assist them with all aspects of their healthcare. They could provide
assistance scheduling appointments, reminding patients of scheduled appointments, help
with refills of prescriptions, arrange for transportation and ultimately act as voice for the
patient within the healthcare provider. It has been shown that by engaging patients more
outside of the provider there is a reduction of use of healthcare facilities (LaVela &
Gallan, 2014). Over time these patient advocates could reduce the stress being placed on
clinics by over or improper use, and help to ease the burden being placed on the staff.

58
It will be important for the provider to implement customer service benchmarks
within their organization. This will require training the staff on expectations the provider
has about their interactions with the patients. Areas such as not updating patients on wait
times, failing to inform patients of future appointments, and the lack of a friendly and
pleasant exchange with a patient can all have a negative impact on the provider. To
ensure that the staff is engaging patients in an effective manner that is in line with the
provider’s goals, the organization can implement a mystery shopper or shadowing
program. While no single visit can encompass what every patients experience is like,
over time by mystery shopping the clinics you can begin to establish patterns. The
reports from these events can then be used to refine and improve the process. There is
the additional benefit when using these programs of the element of the unknown, which
can have positive impact on an employee’s performance if they suspect that they are
being observed.
Conclusion
With the recent changes in healthcare laws in the United States it is more
important than ever for providers to achieve higher patient satisfaction levels and an
improved patient experience. The focus of this study was to identify key drivers and
attributes of the patient experience that influence patient satisfaction. As HMOs continue
to trend towards becoming more customer service focused the opportunity exists for
forward thinking companies to expand their operations.
Based on the analysis of the collected data in this study the opportunity exists to
have a positive influence on the overall quality of a patient’s experience by focusing on
the quality of every interaction point with a patient. The 5Q model of service quality
59
provides a solid model in which healthcare providers can examine the quality of each of
area of treatment. The research demonstrated that treatment, equipment and facilities,
information exchange and interaction with staff all had a positive impact on the patients
overall experience. This establishes that a provider must identify the key drivers of a
quality patient experience in each dimension of their treatment process in order provide
an overall experience that meets their patients’ expectations. For the provider in this
study this information can be used to establish customer service processes that will in
turn lead to the Medicare Star Ratings and increased revenue they desire.
Future Research
The opportunity to further explore how understanding the patient experience
exists. One such way would be to take the data in this study and see how manipulating
the areas examined would influence patient behavior. This could be done by
implementing some of the previously suggested strategies and then repeating the survey
after a designated period of time. It would also be pertinent for the provider to survey
their employees to determine levels of employee satisfaction. Having an employee base
that is displeased with the company they work for can most certainly have an impact on
customer service.
It would also be beneficial to conduct this study on a larger scale and over a
longer time period. This would be beneficial in establishing a more generalizable
population and identifying patterns over time. Lastly, research could be done to look
deeper into the demographics and identify trends in the different areas. For example the
provider has clinics throughout the Las Vegas area and their ratings at clinics in areas that
have different demographic makeups could influence how the patient populations view

60
their treatment. There was evidence in this study that differences exist between the
genders in their interactions with the doctors. These sort of differences could exist in any
number of arrangements, and if a provider can identify them across their entire
organization they have the ability to enact real change.
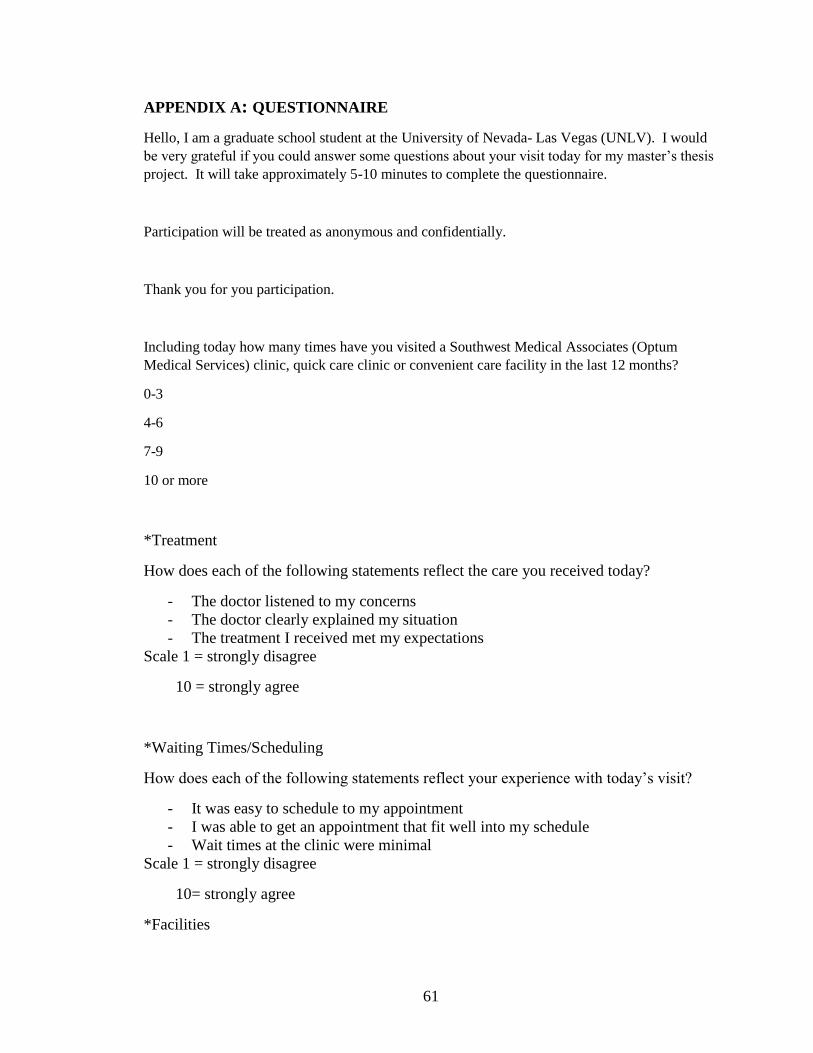
61
APPENDIX A: QUESTIONNAIRE
Hello, I am a graduate school student at the University of Nevada- Las Vegas (UNLV). I would
be very grateful if you could answer some questions about your visit today for my master’s thesis
project. It will take approximately 5-10 minutes to complete the questionnaire.
Participation will be treated as anonymous and confidentially.
Thank you for you participation.
Including today how many times have you visited a Southwest Medical Associates (Optum
Medical Services) clinic, quick care clinic or convenient care facility in the last 12 months?
0-3
4-6
7-9
10 or more
*Treatment
How does each of the following statements reflect the care you received today?
- The doctor listened to my concerns
- The doctor clearly explained my situation
- The treatment I received met my expectations
Scale 1 = strongly disagree
10 = strongly agree
*Waiting Times/Scheduling
How does each of the following statements reflect your experience with today’s visit?
- It was easy to schedule to my appointment
- I was able to get an appointment that fit well into my schedule
- Wait times at the clinic were minimal
Scale 1 = strongly disagree
10= strongly agree
*Facilities

62
How does each of the following statements reflect the clinic you visited today?
- There was plenty of parking available
- It was easy to reach the clinic where my appointment was scheduled
- The clinic was very clean
Scale 1= strongly disagree
10= strongly agree
*Information exchange
How does each of the following statements reflect your experience with the staff during
today’s visit?
- Instructions I was given were easy to understand
- The staff prepared me for what to expect throughout the visit
- The staff was clear in their instructions for possible follow up visits
Scale 1= strongly disagree
10= strongly agree
*Interactions with the staff
How does each of the following statements reflect your experience at the clinic today?
- The staff was attentive to my concerns
- I was treated very well by the staff
- The staff was friendly
Scale 1= strongly disagree
10= strongly agree
*Overall Experience
How does the following statement reflect your experience today?
- My experience at the clinic today met my expectations
Scale 1= Very bad experience
10= Great experience
Now I would like to ask you just a few more questions to gather some information about
patients visiting the clinic today.

63
Demographics
-Please select the appropriate answer.
Are you male or female?
Male / Female
Which age group do you fall in?
59 or under
60-65
66-70
71-75
76-80
81 or over
Ethnicity origin (or race): Please Specify
White
Hispanic or Latino
Black or African American
Native American or Indian American
Pacific Islander or Asian
Other

64
APPENDIX B: INFORMED CONSENT DOCUMENT
INFORMED CONSENT
Department of Hotel Management
TITLE OF STUDY: Understanding the Experience of Medicare Advantage Patients in a
Health Maintenance Organization
INVESTIGATOR(S): Boldman, Curtis E., Shoemaker, Stowe and McBeath, Jessica
For questions or concerns about the study, you may contact Curtis Boldman at (702) 496-7272.
For questions regarding the rights of research subjects, any complaints or comments regarding
the manner in which the study is being conducted, contact the UNLV Office of Research
Integrity – Human Subjects at 702-895-2794, toll free at 877-895-2794 or via email at
Purpose of the Study You are invited to participate in a research study. The purpose of these study is to gain insight
into what drives patient satisfaction for an HMO providing medical services to Medicare
Advantage patients.
Participants
You are being asked to participate in the study because you fit this criteria: Medicare Advantage patient utilizing the services provided by Southwest Medical Associates (SMA).
Procedures If you volunteer to participate in this study, you will be asked to do the following: Participate in a
questionnaire about your experience with the SMA clinic.
Benefits of Participation There will not be direct benefits to you as a participant in this study. However, we hope to learn
areas where the provider can improve the services that they provide to you.
65
Risks of Participation There are risks involved in all research studies. This study may include only minimal risks. These
risks may be some discomfort with the questions being asked by the research
team.
Cost
/Compensation
There will not be financial cost to you to participate in this study. The study will take 5-
10 minutes of your time. You will not be compensated for your time.
Confidentiality
All information gathered in this study will be kept as confidential as possible. No reference will
be made in written or oral materials that could link you to this study. All records will be stored
in a locked facility at UNLV for 3 years after completion of the study. After the storage time the
information gathered will be
destroyed.
Voluntary Participation
Your participation in this study is voluntary. You may refuse to participate in this study
or in any part of this study. You may withdraw at any time without prejudice to your
relations with UNLV. You are encouraged to ask questions about this study at the
beginning or any time during the research study.
Participant Consent:
I have read the above information and agree to participate in this study. I have been able
to ask questions about the research study. I am at least 18 years of age. A copy of this
form has been given to me.

66
APPENDIX C: GRAPHICAL REPRESNTATION OF DATA

67

68

69

70

71
APPENDIX D: PRINCIPLE COMPONENT ANALYSIS
Treatment and Interaction with the Doctor
Importance of components:
Comp.1 Comp.2 Comp.3
Standard deviation 2.7127210 0.9761870 0.78769293
Proportion of Variance 0.8238518 0.1066854 0.06946287
Cumulative Proportion 0.8238518 0.9305371 1.00000000 Use PC1 only
Loadings:
Comp.1 Comp.2 Comp.3
[1,] 0.565 0.815 -0.129
[2,] 0.616 -0.521 -0.591
[3,] 0.549 -0.254 0.796
Comp.1 Comp.2 Comp.3
SS loadings 1.000 1.000 1.000
Proportion Var 0.333 0.333 0.333
Cumulative Var 0.333 0.667 1.000
-------------------- Healthcare Process (Wait times & Scheduling) -------------------------
Importance of components:
Comp.1 Comp.2 Comp.3
Standard deviation 2.8607490 1.3522851 1.0825729
Proportion of Variance 0.7317151 0.1635005 0.1047844
Cumulative Proportion 0.7317151 0.8952156 1.0000000 Use PC1 & PC2
Loadings:
Comp.1 Comp.2 Comp.3
[1,] -0.484 -0.484 0.729
[2,] -0.567 -0.461 -0.683
[3,] -0.667 0.744
Comp.1 Comp.2 Comp.3
SS loadings 1.000 1.000 1.000
Proportion Var 0.333 0.333 0.333
Cumulative Var 0.333 0.667 1.000
-------------------- Equipment & Facilities --------------------
Importance of components:
Comp.1 Comp.2 Comp.3
Standard deviation 2.4245777 1.1894263 0.83029973
Proportion of Variance 0.7364137 0.1772249 0.08636136
Cumulative Proportion 0.7364137 0.9136386 1.00000000 Use PC1 & PC2
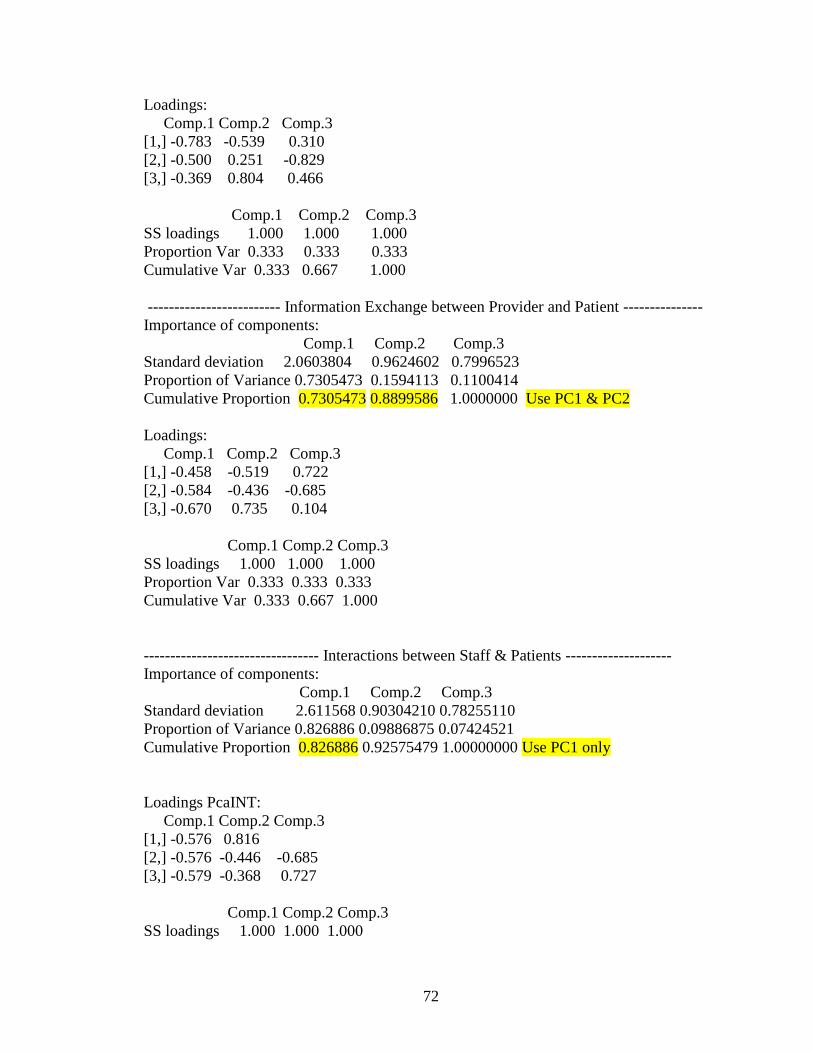
72
Loadings:
Comp.1 Comp.2 Comp.3
[1,] -0.783 -0.539 0.310
[2,] -0.500 0.251 -0.829
[3,] -0.369 0.804 0.466
Comp.1 Comp.2 Comp.3
SS loadings 1.000 1.000 1.000
Proportion Var 0.333 0.333 0.333
Cumulative Var 0.333 0.667 1.000
------------------------- Information Exchange between Provider and Patient ---------------
Importance of components:
Comp.1 Comp.2 Comp.3
Standard deviation 2.0603804 0.9624602 0.7996523
Proportion of Variance 0.7305473 0.1594113 0.1100414
Cumulative Proportion 0.7305473 0.8899586 1.0000000 Use PC1 & PC2
Loadings:
Comp.1 Comp.2 Comp.3
[1,] -0.458 -0.519 0.722
[2,] -0.584 -0.436 -0.685
[3,] -0.670 0.735 0.104
Comp.1 Comp.2 Comp.3
SS loadings 1.000 1.000 1.000
Proportion Var 0.333 0.333 0.333
Cumulative Var 0.333 0.667 1.000
--------------------------------- Interactions between Staff & Patients --------------------
Importance of components:
Comp.1 Comp.2 Comp.3
Standard deviation 2.611568 0.90304210 0.78255110
Proportion of Variance 0.826886 0.09886875 0.07424521
Cumulative Proportion 0.826886 0.92575479 1.00000000 Use PC1 only
Loadings PcaINT:
Comp.1 Comp.2 Comp.3
[1,] -0.576 0.816
[2,] -0.576 -0.446 -0.685
[3,] -0.579 -0.368 0.727
Comp.1 Comp.2 Comp.3
SS loadings 1.000 1.000 1.000

73
Proportion Var 0.333 0.333 0.333
Cumulative Var 0.333 0.667 1.000

74
APPENDIX E: FINAL REGRESSION MODEL
Call:
lm(formula = survdata$V17 ~ pcaD$scores[, 1] + pcaEF$scores[,
1] + pcaINF$scores[, 1] + pcaINT$scores[, 1])
Residuals:
Min 1Q Median 3Q Max
-2.28934 -0.79668 -0.03866 0.61525 2.99449
Coefficients:
Estimate Std. Error T-Value (P-Value)
(Intercept) 7.92857 0.11824 67.057 < 2e-16 ***
pcaD$scores[, 1] 0.10802 0.04702 2.297 0.0242 *
pcaEF$scores[, 1] -0.09890 0.05037 -1.964 0.0531 .
pcaINF$scores[, 1] -0.24114 0.07230 -3.335 0.0013 **
pcaINT$scores[, 1] -0.26580 0.05775 -4.602 1.57e-05 ***
---
Signif. codes: 0 ‘***’ 0.001 ‘**’ 0.01 ‘*’ 0.05 ‘.’ 0.1 ‘ ’ 1
Residual standard error: 1.084 on 79 degrees of freedom
Multiple R-squared: 0.5994, Adjusted R-squared: 0.5791
F-statistic: 29.55 on 4 and 79 DF, p-value: 5.01e-15
(VIF) pcaD$scores[, 1] pcaEF$scores[, 1] pcaINF$scores[, 1] pcaINT$scores[, 1]
1.163669 1.066812 1.587422 1.627301
Doctor: pca1D can be thought of as V2+V3+V4
Equipment and Facility: pca1EF can be thought of as V8+V9+V410
Information Exchange: pca1INF can be thought of as V11+V12+V13
Interaction: pca1INT can be thought of as V14+V15+V16
The final PCR model has R2 of 60%, max VIF = 1.63, and total responses o D, INF, INT
are significant at
5%; sum of Equipment & Facilities (EF) responses is marginally significant at 5%

75
REFERENCES
Agency for Healthcare Research and Quality (2014). Consumer Assessment of
Healthcare Providers and Systems. Retrieved from https://cahps.ahrq.gov/
Andrew, S., Salamonson, Y., Everett, B., Halcomb, E. J., & Davidson, P. M. (2011).
Beyond the ceiling effect: Using a mixed methods approach to measure patient
satisfaction. International Journal of Multiple Research Approaches, 5(1), 52-63.
Bleich, S. N., Ozaltin, E., & Murray, C. J. (2009). How does satisfaction with the health-
care system relate to patient experience? Bulletin of the World Health
Organization, 87, 271-278.
Blue Cross Blue Shield Blue Care Network. (n.d.). Retrieved from
http://www.bcbsm.com/index/health-insurance-help/faqs/topics/how-health-
insurance-works/difference-hmo-ppo-epo.html
Buttle, F. (1996). SERVQUAL: Review, critique, research agenda. European Journal of
Marketing, 30(1), 8-32.
Cardona, M. M., & Bravo, J. J. (2012). Service quality perceptions in higher education
institutions: The case of a Columbian Universtiy. Estudios Gerenciales, 28, 23-
29.
Chakraborty, R., & Majumdar, A. (2011). Measuring consumer satisfaction in health
care sector: The applicability of SERVQUAL. Journal of Arts, Science &
Commerce, 2(4), 149-160.
Clancy, C. M., Uchendu, U. S., & Jones, K. T. (2014). Excellence and Equality in Health
Care. American Journal of Public Health, 104, 527-528.

76
Cliff, B. (2012). Excellence in patient satisfaction within a patient-centered culture.
Journal of Healthcare Management, 57(3), 157-159.
Curtis, T., Abratt, R., Rhoades, D., & Dion, P. (2011). Customer loyalty, repurchase and
satisfaction: A meta-analytical review. Journal of Consumer Satisfaction,
Dissatisfaction and Complaining Behavior, 24, 1-26.
Dabney, B. W., & Tzeng, H. (2013). Service quality and patient-centered care. Medsurg
Nursing, 22(6), 359-364.
Darden, M., & McCarthy, I. M. (2013). The star treatment: Estimating the impact of
star ratings on Medicare Advantage enrollments. Retrieved from
http://papers.ssrn.com/sol3/papers.cfm?abstract_id=2328803
Dimitriadis, S., & Stevens, E. (2008). Intergrated customer relationship management for
service activities: an internal/external gap model. Managing Service Quality,
18(5), 496-511.
Farley, H., Enguidanos, E. R., Coletti, C. M., Honigman, L., Mazzeo, A., Pinson, T. B.,
... Wiler, J. L. (2014, October). Patient satisfaction surveys and quality of care: an
information paper. Annals of Emergency Medicine, 64(4), 351-357.
Giese, J. L., & Cote, J. A. (2002). Defining consumer satisfaction. Academy of
Marketing Science Review, 2000(1), 1-24.
Gill, L., & White, L. (2009). A critical view of patient satisfaction. Leadership in Health
Services, 22(1), 8-19.
Hall, J. A., & Dornan, M. C. (1988). What patients liked about their medical care and
how often they were asked: A meta-analysis of the satisfaction literature. Social
Science and Medicine, 27, 935-939.
77
Headley, D. E., & Choi, B. (1992). Achieving service quality through GAP analysis and
basic statistical approach. The Journal of Services Marketing, 6(1), 5-14.
Hussain, S. N., & Rehman, S. U. (2012). Patient satisfaction regarding hospital
services: A study of Umea Hospital (Doctoral dissertation, Umea University).
Retrieved from http://www.diva-
portal.org/smash/get/diva2:545811/FULLTEXT02
Kessler, D. P., & Mylod, D. (2011). Does patient satisfaction affect patient loyalty?
International Jouranl of Health Care Quality Assurance, 24(4), 266-273.
Kotler, P., & Keller, K. (2009). Marketing Management (13th ed). Upper Saddle River,
NJ: Prentice Hall.
LaVela, S. L., & Gallan, A. S. (2014). Evaluation and measurement of patient
experience. Patient Experience Journal, 1(1), 28-36.
Lees, C. (2011). Measuring the patient experience. Nurse Research, 19(1), 25-28.
Lovelock, C., & Wirtz, J. (2010). Improving service quality and productivity. Services
Marketing: People, technology, strategy. Upper Saddle River, NJ: Pearson
Prentice Hall.
McKnight, S. (2009). Bridging the gap between service provision and customer
expectations. Performance Measurements and Metrics, 10(2), 79-93.
Medicare.gov. (2014a). The Affordable Care Act and Medicare. Retrieved from
http://www.medicare.gov/about-us/affordable-care-act/affordable-care-act.html
Medicare.gov. (2014b). Medicare Advantage Plans. Retrieved from
http://www.medicare.gov/sign-up-change-plans/medicare-health-plans/medicare-
advantage-plans/medicare-advantage-plans.html

78
Meng, Y., Jatulis, D. E., McDonald, J. P., & Legoretta, A. P. (1997). Satisfaction with
access to and quality of health care among Medicare enrollees in a Health
Maintenance Organization. Western Journal of Medicine, 166(4), 242-247.
Mind Tools. (n.d.). Retrieved from http://www.mindtools.com/pages/article/rater.htm
Needham, B. R. (2012). The truth about patient experience: what we can learn from
other industries, and how three Ps can improve health outcomes, strengthen
brands and delight customers. Journal of Healthcare Management, 57(4), 255-
263.
Panda, T. K., & Das, S. (2014, November). The role of tangibility in service quality and
its impact on external customer satisfaction: A comparative study of hospital and
hospitality sectors. IUP Journal of Marketing Management, 53-69.
Parasuraman, A., Zeithaml, V. A., & Berry, L. L. (1985). A conceptual model of service
quality and its implications for future research. Journal of Marketing, 49, 41-50.
Parasuraman, A., Zeithaml, V. A., & Berry, L. L. (1988). SERVQUAL: A multiple-item
scale for measuring consumer perceptions of service quality. Journal of
Retailing, 64(1), 12-40.
Pope, G. C., Greenwald, L., Kautter, J., Olmstead, E., & Mobley, L. (2006). Medicare
preferred provider organization demonstration: plan offerings and beneficiary
enrollment. Health Care Financing Review, 27(3), 95-109.
Raposo, M. L., Alves, H. M., & Duarte, P. A. (2009). Dimensions of service quality and
satisfaction in healthcare: A patient’s satisfaction index. Service Business: An
International Journal, 3, 85-100.

79
Rosenbach, M. L. (1995). Access and satisfaction with the disabled Medicare
population. Health Care Financing Review, 17(2), 147-167.
Ryan, A. M., & Damberg, C. L. (2013). What can the past of pay-for-performance tell us
about the future of value-based purchasing in Medicare? Healthcare: The
Journal of Delivery Science and Innovation, 1, 42-49.
SERVQUAL. (2014). In Wikipedia The Free Encyclopedia. Retrieved from
http://en.wikipedia.org/wiki/SERVQUAL
Seth, N., Deshmukh, S., & Vrat, P. (2005). Service quality models: a review.
International Journal of Quality and Reliability Management, 22(9), 913-949.
Shoemaker, S., & Lewis, R. C. (1999). Customer loyalty: The future of hospitality
marketing. International Journal of Hospitality Management, 18, 345-370.
Sofaer, S., & Firminger, K. (2005). Patient perceptions of the quality of health services.
Annual Review Public Health, 26, 513-559.
Teixeira, J., Patricio, L., Nunes, N. J., Fisk, R. P., & Constatine, L. (2012). Customer
experience modeling: from customer experience to service design. Journal of
Service Management, 23(3), 362-376.
United Healthcare (n.d.). Measuring patient care: Medicare star ratings. Retrieved from
https://www.healthplanofnevada.com/documents/provider%20files/Star%20Ratin
gs%20-%20Powerpoint%20presentation-FINAL.pdf
Wilson, A., Zeithaml, V. A., Bitner, M. J., & Gremler, D. D. (2008). Service Marketing
(1st ed). McGraw-Hill Education.
Wolf, J. A., Nierderhauser, V., Marshburn, D., & LaVela, S. L. (2014). Defining patient
experience. Patient Experience Journal, 1(1), 7-19.
80
Zikmund, W. G., Babin, B. J., Carr, J. C., & Griffin, M. (2010). Business Research
Methods (8th ed). Mason, OH: South-Western, Cengage Learning.
Zineldin, M. (2006a). The quality of healthcare and patient satisfaction: An exploratory
investigation of the 5Qs model at some Egyptian and Jordanian medical clinics.
International Journal of Health Care Quality Assurance, 19(1), 60-92.
Zineldin, M. (2006b). The royalty of loyalty: CRM, quality and retention. Journal of
Consumer Marketing, 23(7), 430-437.

81
CURRICULUM VITA
Curtis Boldman
Contact Information:
Email: [email protected]
Education:
M.S. in Hotel Administration, May 2015, University of Nevada, Las Vegas
B.S. in Supply Chain Management, December 1998, Arizona State University
Experience:
Psychological Operations Specialist: September 2014 – current, United States Army
Reserve
Corporate Operations Manager: June 2013 – September 2014, Block 16 Hospitality
Infantry Reconnaissance Squad Leader: July 2007 – July 2013, United States Army
Marketing and Promotions Director: August 2005 – May 2007, Tryst Nightclub
Activities:
University Veterans Association: August 2013 – May 2015, University of Nevada, Las
Vegas
Disabled American Veterans: May 2013 – May 2015, Las Vegas Chapter
References:
Jesse Waits
(702) 556-7171
Jessica McBeath
(702) 378-5683
Billy Richardson
(702) 830-3228


