
UNDERSTANDING THE RESPIRATORY
CONSEQUENCES OF PRETERM BIRTH
Benjamin Stoecklin, MD
This thesis is presented for the degree of
Doctor of Philosophy at The University of Western Australia
School of Human Sciences
Physiology
February, 2021

ii
THESIS DECLARATION
I, Benjamin Stoecklin, certify that:
This thesis was substantially accomplished during enrolment in this degree.
This thesis does not contain material submitted for the award of any other degree or
diploma in my name, in any university or other tertiary institution.
In the future, no part of this thesis will be used in a submission in my name, for any
other degree or diploma in any university or other tertiary institution without the prior
approval of The University of Western Australia and where applicable, any partner
institution responsible for the joint-award of this degree.
This thesis does not contain any material previously published or written by another
person, except where due reference has been made in the text and, where relevant, in
the Authorship Declaration that follows.
This thesis does not violate or infringe any copyright, trademark, patent, or other rights
whatsoever of any person.
The research involving human data reported in this thesis was assessed and approved
by The University of Western Australia Human Research Ethics Committee: Approval
#: (RA/3/1/5942 and RA/4/1/426). Written parental consent was received and archived
for the research involving patient data reported in this thesis. This thesis contains co-
authored published work and/or work prepared for publication.
Signature:
Date: 31/0

iii
ABSTRACT
Introduction
Infants born premature whilst the lungs are still developing are prone to postnatal
respiratory disease consequent to reduced gas exchange area and surfactant deficiency.
Bronchopulmonary dysplasia (BPD) is the most common long-term respiratory
complication after preterm birth, affecting between 10–32 % of all very preterm
infants. Infants with BPD exhibit dyspnoea and have impaired pulmonary gas
exchange, usually attributed to failed alveolarisation. Classification of the severity of
BPD remains controversial, whilst the contribution of the diaphragm and the chest
wall to breathing difficulties in these infants warrant further exploration.
My PhD studies aimed to further characterise the physiological basis of breathing
disorder present in infants with BPD.
Methods
The changes and pitfalls in the BPD definitions over time were reviewed (Chapter 2).
All physiological studies were undertaken in infants enrolled in the Preterm Infant
Functional and Clinical Outcome (PIFCO) study (ACTRN12613001062718l). The
PIFCO study is a single centre, prospective observational study performed at the
neonatal intensive care unit at the King Edward Memorial. Eligible infants were born
between 21st of July 2013 and 12th of May 2018. The study was approved by the
Women and Newborn Health Service Human Research Ethics Committee
(HREC:1883EW and 20130193EW) and the University of Western Australia
(RA/3/1/5942) in Perth, Western Australia.
We performed a comprehensive lung function assessment in very preterm infants at
36 weeks’ PMA. The test included the measurements of pulmonary gas exchange,
tidal breathing parameters, lung volumes, diaphragm function and measurements of
the static compliances of the chest wall. Anthropometric data was collected at birth
and at time of the test. Background information including antenatal and postnatal
factors potentially contributing to the breathing disorder were collected from the
medical charts. All data were securely stored on a REDCap database hosted by the
University of Western Australia.

iv
Results
Our published review (Chapter 2) concluded the importance of moving from a
treatment-based to a physiologically-based definition of BPD. Published detailed
physiological studies of pulmonary gas exchange in very preterm infants (co-first
author, Appendix 1) validated this conclusion and justified the aim of the first
physiological study in this thesis: a simple rapid bedside assessment for shift of the
oxyhaemoglobin saturation versus inspired oxygen pressure curve (“Shift”) was
developed. Data collected in 219 very preterm infants at 36 weeks’ postmenstrual age
showed that Shift can be predicted from a single paired measurement of peripheral
oxyhaemoglobin saturation (SpO2) and inspired partial pressure of oxygen (PIO2)
(Chapter 3), and is valid for assessment of outcomes at a population but not individual
level.
Contrary to our expectations, infants with BPD showed more efficient diaphragmatic
contractile force and decreased diaphragmatic work of breathing during quiet sleep at
36 weeks’ postmenstrual age (Chapter 4). Early postnatal energy intake and
intrauterine growth (birthweight Z score) were the only independent factors predicting
diaphragm function but only explained 12 % of the variability. Gestation,
chorioamnionitis and duration of mechanical ventilation were associated with but not
independently predictive of diaphragm function. Other unidentified antenatal and
postnatal factors likely influence efficiency of diaphragm contractile function and
diaphragmatic work during quiet sleep at 36 weeks’ posmenstrual age.
Chest wall, lung and total respiratory system compliance was assessed in 23 infants at
36.6 ± 0.6 weeks’ PMA. Infants with BPD had lower chest wall compliance most
likely related to an increased functional residual capacity (Chapter 5).
Conclusion
Shift of the oxyhaemoglobin saturation versus inspired oxygen pressure curve
provides an index of efficiency of gas exchange and should be considered as a key
variable of a new classification of BPD severity. Rigidity of the chest wall may
contribute to increased efficiency and reduced diaphragmatic work in infants with
BPD. However, the compound contribution of the diaphragm and chest wall

v
compliance to the breathing disorder present in infants with BPD appears to be
minimal when assessed at 36 weeks’ PMA.

vi
TABLE OF CONTENTS
THESIS DECLARATION ..................................................................................................................... ii
ABSTRACT .......................................................................................................................................... iii
Introduction ....................................................................................................................................... iii
Methods ............................................................................................................................................. iii
Results ............................................................................................................................................... iv
Conclusion ........................................................................................................................................ iv
TABLE OF CONTENTS ...................................................................................................................... vi
LIST OF TABLES ................................................................................................................................ xi
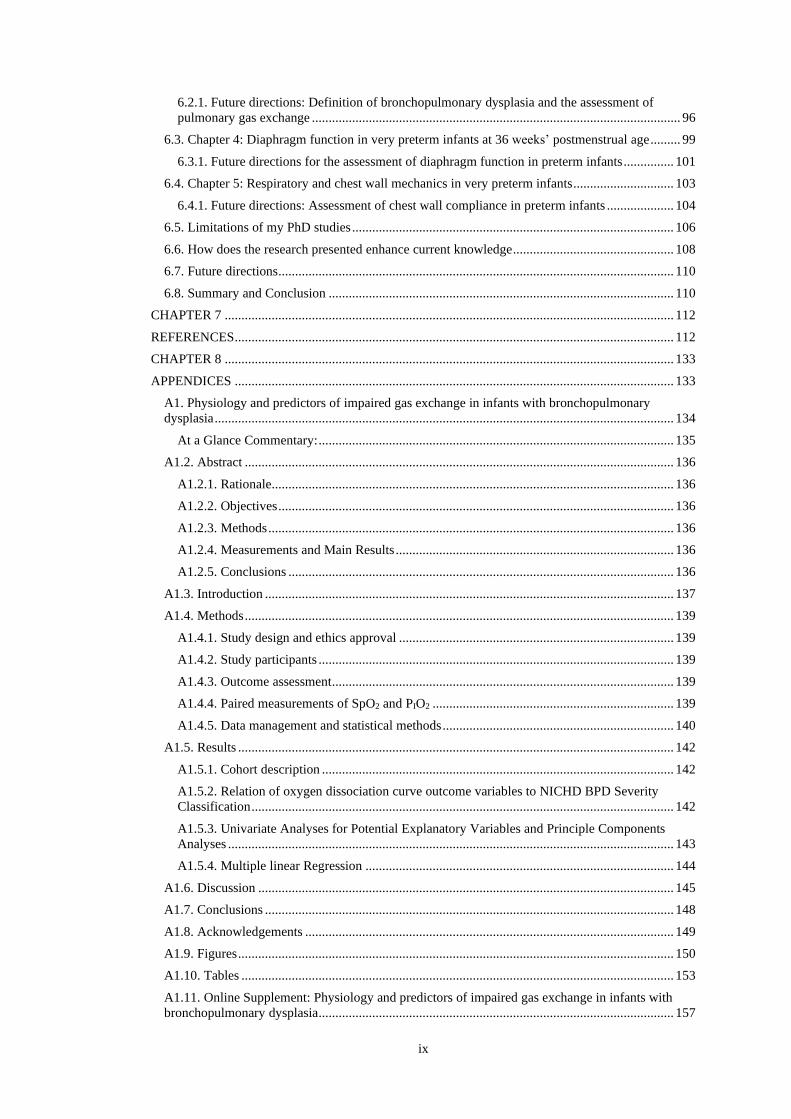
LIST OF FIGURES .............................................................................................................................. xii
ACKNOWLEDGEMENTS ................................................................................................................. xv
AUTHORSHIP DECLARATION: CO-AUTHORED PUBLICATIONS ......................................... xvii
CHAPTER 1 .......................................................................................................................................... 1
GENERAL INTRODUCTION .............................................................................................................. 1
1.1. Preterm birth ................................................................................................................................ 2
1.2. Developmental stages of the lung and respiratory muscles ......................................................... 3
1.2.1 Stages of lung development .................................................................................................. 3
1.2.2. Development of the diaphragm ............................................................................................ 4
1.2.3. Development of the chest wall ............................................................................................. 6
1.3. Early respiratory disease ............................................................................................................. 7
1.4. Chronic lung disease in preterm infants ...................................................................................... 9
1.3. Aims .......................................................................................................................................... 12
1.4. Hypotheses ................................................................................................................................ 12
1.4.1. Hypothesis I (Chapter 3) .................................................................................................... 12
1.4.2. Hypothesis II (Chapter 4) ................................................................................................... 13
1.4.3. Hypothesis III (Chapter 5) .................................................................................................. 13
1.5. Brief outline of the manuscripts ................................................................................................ 13
1.5.1. Manuscript 1: Bronchopulmonary dysplasia: rationale for a pathophysiological rather than
treatment based approach to diagnosis. ........................................................................................ 14
1.5.2. Manuscript 2: Simplified bedside assessment of pulmonary gas exchange in very preterm
infants at 36 weeks’ postmenstrual age. ....................................................................................... 14
1.5.3. Manuscript 3: Diaphragm function in very preterm infants at 36 weeks’ postmenstrual age.
...................................................................................................................................................... 14
1.5.4. Manuscript 4: Static respiratory mechanics in very preterm infants with and without
bronchopulmonary dysplasia ........................................................................................................ 15
CHAPTER 2 ........................................................................................................................................ 16
BRONCHOPULMONARY DYSPLASIA: RATIONALE FOR A PATHOPHYSIOLOGICAL
RATHER THAN TREATMENT BASED APPROACH TO DIAGNOSIS. ....................................... 16
2.1. Summary ................................................................................................................................... 18
2.2. Definitions of BPD across the ages ........................................................................................... 19
2.2.1 The original definition of BPD ............................................................................................ 19
2.2.2. BPD definition during the pre-surfactant era ..................................................................... 21
2.2.3. The post-surfactant era ....................................................................................................... 21

vii
2.3. Pitfalls of the current BPD definitions ...................................................................................... 24
2.3.1. Use of treatment as basis for definition and classification: ................................................ 24
2.3.2. Semi-quantitative assessment and arbitrary thresholds: ..................................................... 25
2.3.3. Failure to consider altitude in assessment of BPD: ............................................................ 25
2.3.4. Interpretation of chest radiographs ..................................................................................... 27
2.3.5. BPD definitions as a benchmarking tool for neonatal intensive care units ........................ 27
2.3.6. Time-points for diagnosis of BPD and assessment of its severity: ..................................... 28
2.3.7. Lack of distinction between underlying pathophysiologies of BPD .................................. 28
2.3.8. Poor predictive value of current definitions for future respiratory morbidity and
responsiveness to therapy. ............................................................................................................ 29
2.4. The way forward: A dynamic definition of BPD based on pathophysiology? .......................... 30
2.4.1. Desired features of a new definition of BPD ...................................................................... 30
2.4.2. A proposed new measure of the severity of BPD at the parenchymal level ....................... 30
2.5. Conclusion................................................................................................................................. 33
2.6. Acknowledgements ................................................................................................................... 33
CHAPTER 3 ........................................................................................................................................ 34
SIMPLIFIED BEDSIDE ASSESSMENT OF PULMONARY GAS EXCHANGE IN VERY
PRETERM INFANTS AT 36 WEEKS’ POSTMENSTRUAL AGE .................................................. 34
3.1. Abstract ..................................................................................................................................... 36
3.1.1. Introduction ........................................................................................................................ 36
3.1.2. Methods .............................................................................................................................. 36
3.1.3. Results ................................................................................................................................ 36
3.1.4. Discussion .......................................................................................................................... 36
Key Messages............................................................................................................................... 37
3.2. Introduction ............................................................................................................................... 38
3.3. Methods ..................................................................................................................................... 40
3.3.1. Development of the prediction table: ................................................................................. 40
3.3.2. Validation of the prediction table: ...................................................................................... 41
3.3.3. Study size and potential source of bias ............................................................................... 41
3.3.4. Statistical methods .............................................................................................................. 41
3.4. Results ....................................................................................................................................... 43
3.4.1. Prediction table for shift ..................................................................................................... 44
3.4.2. Validation of the prediction table ....................................................................................... 45
3.5. Discussion ................................................................................................................................. 47
3.6. Conclusion and future directions ............................................................................................... 50
3.7. Acknowledgements ................................................................................................................... 50
3.7.1. Funding source ................................................................................................................... 50
CHAPTER 4 ........................................................................................................................................ 51
DIAPHRAGM FUNCTION IN VERY PRETERM INFANTS AT 36 WEEKS’ POSTMENSTRUAL
AGE ..................................................................................................................................................... 51
4.1. Abstract ..................................................................................................................................... 53
4.1.1. Objectives ........................................................................................................................... 53
4.1.2. Working hypothesis ............................................................................................................ 53

viii
4.1.3. Methodology ...................................................................................................................... 53
4.1.4. Results ................................................................................................................................ 53
4.1.5. Conclusions ........................................................................................................................ 53
4.2. Introduction ............................................................................................................................... 54
4.3. Methods ..................................................................................................................................... 57
4.3.1. Study design ....................................................................................................................... 57
4.3.2. Study infants and recruitment ............................................................................................. 57
4.3.3. Measurement of breathing pattern and diaphragm function ............................................... 57
4.3.4. Statistical analysis .............................................................................................................. 58
4.4. Results ....................................................................................................................................... 60
4.4.1. Univariate analysis ............................................................................................................. 63
4.4.2. Multivariable regression ..................................................................................................... 64
4.5. Discussion ................................................................................................................................. 67
4.6. Conclusion................................................................................................................................. 71
CHAPTER 5 ........................................................................................................................................ 72
RESPIRATORY AND CHEST WALL MECHANICS IN VERY PRETERM INFANTS ................ 72
5.1. Abstract ..................................................................................................................................... 74
5.1.1. Introduction ........................................................................................................................ 74
5.1.2. Methods .............................................................................................................................. 74
5.1.3. Results ................................................................................................................................ 74
5.1.4. Conclusion .......................................................................................................................... 74
5.2. Introduction ............................................................................................................................... 75
5.3. Methods ..................................................................................................................................... 76
5.3.1. Study design ....................................................................................................................... 76
5.3.2. Study population and data management ............................................................................. 76
5.3.3. Assessment of bronchopulmonary dysplasia ...................................................................... 77
5.3.4. Experimental protocol and measurements .......................................................................... 77
5.3.5. Data analysis ...................................................................................................................... 78
5.3.6. Statistical analysis .............................................................................................................. 79
5.4. Results ....................................................................................................................................... 80
5.4.1. Breathing parameters and lung volumes between infants with and without BPD .............. 80
5.4.2. Compliance in infants with and without BPD .................................................................... 83
5.4.3. Relationship between compliances and antenatal and postnatal factors ............................. 84
5.5. Discussion ................................................................................................................................. 87
5.5.1. Limitations ......................................................................................................................... 90
5.5.2. Strengths ............................................................................................................................. 90
5.6. Conclusions ............................................................................................................................... 90
CHAPTER 6 ........................................................................................................................................ 92
GENERAL DISCUSSION ................................................................................................................... 92
6.1. Introduction ............................................................................................................................... 93
6.2. Chapter 2 and 3. The definition of bronchopulmonary dysplasia and a simplified bedside
assessment of pulmonary gas exchange ........................................................................................... 94
ix
6.2.1. Future directions: Definition of bronchopulmonary dysplasia and the assessment of
pulmonary gas exchange .............................................................................................................. 96
6.3. Chapter 4: Diaphragm function in very preterm infants at 36 weeks’ postmenstrual age ......... 99
6.3.1. Future directions for the assessment of diaphragm function in preterm infants ............... 101
6.4. Chapter 5: Respiratory and chest wall mechanics in very preterm infants .............................. 103
6.4.1. Future directions: Assessment of chest wall compliance in preterm infants .................... 104
6.5. Limitations of my PhD studies ................................................................................................ 106
6.6. How does the research presented enhance current knowledge ................................................ 108
6.7. Future directions ...................................................................................................................... 110
6.8. Summary and Conclusion ....................................................................................................... 110
CHAPTER 7 ...................................................................................................................................... 112
REFERENCES ................................................................................................................................... 112
CHAPTER 8 ...................................................................................................................................... 133
APPENDICES ................................................................................................................................... 133
A1. Physiology and predictors of impaired gas exchange in infants with bronchopulmonary
dysplasia ......................................................................................................................................... 134
At a Glance Commentary: .......................................................................................................... 135
A1.2. Abstract ................................................................................................................................ 136
A1.2.1. Rationale ........................................................................................................................ 136
A1.2.2. Objectives ...................................................................................................................... 136
A1.2.3. Methods ......................................................................................................................... 136
A1.2.4. Measurements and Main Results ................................................................................... 136
A1.2.5. Conclusions ................................................................................................................... 136
A1.3. Introduction .......................................................................................................................... 137
A1.4. Methods ................................................................................................................................ 139
A1.4.1. Study design and ethics approval .................................................................................. 139
A1.4.2. Study participants .......................................................................................................... 139
A1.4.3. Outcome assessment ...................................................................................................... 139
A1.4.4. Paired measurements of SpO2 and PIO2 ........................................................................ 139
A1.4.5. Data management and statistical methods ..................................................................... 140
A1.5. Results .................................................................................................................................. 142
A1.5.1. Cohort description ......................................................................................................... 142
A1.5.2. Relation of oxygen dissociation curve outcome variables to NICHD BPD Severity
Classification .............................................................................................................................. 142
A1.5.3. Univariate Analyses for Potential Explanatory Variables and Principle Components
Analyses ..................................................................................................................................... 143
A1.5.4. Multiple linear Regression ............................................................................................ 144
A1.6. Discussion ............................................................................................................................ 145
A1.7. Conclusions .......................................................................................................................... 148
A1.8. Acknowledgements .............................................................................................................. 149
A1.9. Figures .................................................................................................................................. 150
A1.10. Tables ................................................................................................................................. 153
A1.11. Online Supplement: Physiology and predictors of impaired gas exchange in infants with
bronchopulmonary dysplasia .......................................................................................................... 157

x
A2. List of abstracts ....................................................................................................................... 162
A2.1. Validation of FiO2 derived by a portable inspired oxygen pressure sensor (PSANZ
Townsville, 2016) ...................................................................................................................... 162
A2.2. Shift in very preterm infants with oxyhaemoglobin saturation >94% in room air (PSANZ
Townsville 2016, European Respiratory Society, Milan; Italy 2017) ........................................ 163
A2.3. Low-frequency oscillatory mechanics in very preterm infants with and without
Bronchopulmonary Dysplasia (European Respiratory Society, Milan; Italy 2017) ................... 164
A2.4. Longitudinal Changes in Right Ventricular Function in Very Preterm Infants (PSANZ
Auckland 2018) .......................................................................................................................... 165
A2.5. Do We Overestimate the Incidence of Pulmonary Hypertension in Preterm Infants with
Bronchopulmonary Dysplasia? (PSANZ Auckland 2018) ......................................................... 166
A2.6. Shift of the SpO2/PIO2 curve assessed early in life enables prediction of bronchopulmonary
dysplasia in extremely preterm infants (jens Maastricht, 2019) ................................................. 167
A2.7. Bronchopulmonary dysplasia can be predicted by early assessment of shift of the SpO2 vs.
PIO2 curve in extremely preterm infants (PSANZ Sydney 2020, cancelled due to SARS-CoV-2
pandemic) ................................................................................................................................... 168
A3. Simplified bedside assessment of pulmonary gas exchange in very preterm infants at 36 weeks’
postmenstrual age ........................................................................................................................... 169
A3.1. Abstract ................................................................................................................................ 171
A3.2. Introduction .......................................................................................................................... 173
A3.3. Methods ................................................................................................................................ 175
A3.3.1. Development of the prediction table ............................................................................. 175
A3.3.2. Validation of the prediction table .................................................................................. 176
A.3.3.3. Study size and potential source of bias ......................................................................... 177
A3.3.4. Statistical methods ......................................................................................................... 177
A3.4. Results .................................................................................................................................. 177
A3.4.1. Prediction table for shift ................................................................................................ 179
A3.4.2. Bedside assessment and NIH BPD definition ............................................................... 180
A3.4.3. Validation of the prediction table .................................................................................. 181
A3.5. Discussion ............................................................................................................................ 183
A3.5. Conclusion and future directions .......................................................................................... 186
A3.6. Acknowledgements .............................................................................................................. 187
A4. Simplified bedside assessment of pulmonary gas exchange in very preterm infants – online
supplement ..................................................................................................................................... 188
A4.1. Rationale for use of fetal hemoglobin as a reference for the ideal oxyhemoglobin dissociation
curve ............................................................................................................................................... 197

xi
LIST OF TABLES
Table 1. Stages of bronchopulmonary dysplasia described by Northway et al. in 1967. ..................... 20 Table 2. NICHD criteria for severity of Bronchopulmonary dysplasia. ............................................... 22 Table 3. April 2018 revision of the 2001 NICHD BPD criteria. .......................................................... 24 Table 4. Oxygen availability dependent on altitude above sea level. ................................................... 27 Table 5. Summary characteristics of both cohorts of infants. .............................................................. 43 Table 6. Shift dependent on SpO2 in infants breathing room air at sea level (PIO2 = 20 kPa). ............ 44 Table 7. Prediction table for shift from a single paired SpO2 vs. PIO2 measurement. .......................... 45 Table 8. Perinatal characteristics of all measured infants..................................................................... 61 Table 9. Perinatal characteristics of measured and excluded infants. .................................................. 62 Table 10. Lung function parameters between infants with and without BPD. ..................................... 62 Table 11. Univariable and multivariable regression. ............................................................................ 65 Table 12. Demographics of enrolled infants and comparison between infants with and without BPD.
.............................................................................................................................................................. 81 Table 13. Tidal breathing and lung volume variables. Comparison between infants with and without
BPD. ..................................................................................................................................................... 82 Table 14. Outcome variable: Normalised respiratory system compliance (Crs/weight). ...................... 85 Table 15. Univariate and multivariable associations of normalised lung and chest wall compliance
(Cl/kg), (Ccw/kg) with antenatal and postnatal exposures and breathing variables. .............................. 86 Table 16. Comparison of patient demographics for eligible and recruited infant subpopulations. .... 153 Table 17. Detailed Characteristics of Studied Infants. ....................................................................... 154 Table 18. Thresholds for Shift, VA/Q and Shunt for Any BPD and Moderate-Severe BPD. ............ 155 Table 19. Multivariable Analyses. ..................................................................................................... 156 Table 20. Summary values of Shift, VA/Q and Shunt relative to NICHD BPD Classification using the
fetal oxyhemoglobin dissociation curve as a reference. ..................................................................... 157 Table 21. Summary values of Shift, VA/Q and Shunt relative to NICHD BPD Classification using the
adult oxyhemoglobin dissociation curve as a reference. .................................................................... 157 Table 22. Summary values of shift, VA/Q and shunt for infants classified as severe BPD according to
need for oxygen at 36w PMA. ........................................................................................................... 157 Table 23. Pearson correlations® of shift, VA/Q and shunt with potential explanatory factors. ......... 158 Table 24. Rotated Principal Components Analysis Matrix. ............................................................... 161 Table 25. Prediction table for shift at SpO2 > 94% in room air (21 kPa) .......................................... 163 Table 26. Summary characteristics of both cohorts of infants. .......................................................... 178 Table 27. Shift dependent on SpO2 in infants breathing room air at sea level (PIO2 = 20 kPa). ...... 179 Table 28. Prediction table for shift from a single paired SpO2 vs. PIO2 measurement. ...................... 180 Table 29. Thresholds for Shift (kPa) for Any BPD and Moderate-Severe BPD. ............................... 181 Table 30. SpO2, PIO2 values and corresponding shift values extracted from Figure 21. .................... 189 Table 31. Calculated shift values at SpO2 88 %, 90 %, 92 % and 94 % in room air at sea level (20 kPa
PIO2). .................................................................................................................................................. 190 Table 32. Prediction table for shift from a single paired SpO2 vs. PIO2 measurement in room air at sea
level. Shaded values are estimates (for details please refer to the main manuscript). ........................ 191 Table 33. Prediction table for shift from a single paired SpO2 vs. PIO2 measurement. Shift values
(bold) and according 95 % confidence intervals (CI) in the column to the right. PIO2 = Partial pressure
of inspired oxygen (kPa). SpO2 = oxyhemoglobin saturation (%). .................................................... 192
xii
LIST OF FIGURES
Figure 1. Stages of lung development. http://www.embryology.ch/anglais/rrespiratory/phasen07.html.
© www.embryology.ch; reprinted with permission ("www.embryology.ch," 2008) ............................. 3 Figure 2. Anatomy, Thorax, Phrenic nerve, Dec 2018, StatPearls Publishing, Copyright 2020 by
StatPearls Publishing. Reprinted with permission (Rehman et al., 2020). ............................................. 5 Figure 3. Timeline of major revisions in the definition of BPD. .......................................................... 19 Figure 4. Assessment of the right shift of the SpO2 vs PIO2 curve: A) the test is performed using a
headbox, within which the PIO2 is adjusted stepwise. SpO2 is measured on the right hand at least 4
minutes after PIO2 has stabilised at each level. B) The paired measurements of SpO2 at each PIO2 are
plotted, and the rightward shift of the SpO2 / PIO2 curve from the oxyhaemoglobin dissociation curve
is determined (arrows). The curve of a healthy term infant is shifted to the right by ~ 6 kPa, whereas
the rightward shift in the preterm infant depends on the infant’s pulmonary gas exchange capacity.
SpO2, peripheral oxyhaemoglobin saturation; PIO2, partial pressure of inspired oxygen. ................... 31 Figure 5. Comprehensive shift test enables assessment of pulmonary gas exchange and monitoring of
changes in pulmonary gas exchange. Assessment of shift at day four and at day eight of life in
contrast to a predicted normal shift of 7.1 kPa. Fetal oxygen dissociation curve is measured as
SaO2/PO2, and predicted shift curves are measured as SpO2/PIO2. ODC = oxygen dissociation curve;
VA/Q = ventilation to perfusion ratio (adapted from Gareth Jones). .................................................... 39 Figure 6. Scatter plot: shift assessed by the 15-minute test dependent on shift assessed by the
comprehensive test. R2 = 0.83; p < 0.0001. ......................................................................................... 46 Figure 7. Plot of differences between the 15-minute bedside assessment and the comprehensive shift
test, expressed as percentage difference from the mean of two tests. Each open circle denotes a single
infant. Solid black line = mean; dotted line = 95 % CI of the mean; dashed line = limits of agreement
(1.96 SD). ............................................................................................................................................. 46 Figure 8. Study flowchart showing all recruited infants and final number of infants with valid
measurements ....................................................................................................................................... 60 Figure 9. Pdi/VT and PTIdi·min-1 in infants with and without BPD. .................................................. 63 Figure 10. Crs, Cl, and Ccw were statistically significantly lower in infants with BPD compared to
infants without BPD (Mann-Whitney U). ............................................................................................ 83 Figure 11. Compliance respiratory system (Crs, p = 0.017) and compliance lung (Cl, p = 0.022) were
significantly lower in infants with moderate or severe BPD compared to infants without BPD (Mann
Whitney-U). The difference in compliance of the chest wall between infants with moderate or severe
BPD and infants without BPD was not significant (Ccw, p = 0.056). Compliances did not differ
between infants with mild BPD and infants without BPD, or infants with mild BPD and either
moderate or severe BPD (* indicates significant difference). .............................................................. 84 Figure 12. Position of the two tips of the pressure transducer.............................................................. 99 Figure 13. Oxygen Saturation vs. Oxygen Pressure. .......................................................................... 150 Figure 14. Flowchart describing the inclusion pathway of the studied infants. ................................. 151 Figure 15. Shift, VA/Q and shunt for included infants relative to NICHD BPD classification. Mean
values and 95 % confidence intervals for A) shift, B) VA/Q, and C) shunt for infants with no BPD,
mild BPD, moderate BPD and severe BPD. Accompanying dot plot shows the spread of individual
measurements. .................................................................................................................................... 152 Figure 16. Major determinants of right shift of the SpO2/PIO2 curve. Figure shows relation between
measured right shift of the SpO2/PIO2 and gestation (left panel) and duration of invasive ventilation
(right panel). Symbols show NIH BPD classification: no BPD (op circle); mild BPD (pink triangle);
moderate BPD (brown square) and severe BPD (diamond). The fill colour of the severe BPD
diamond symbols are coloured according to the whether infants required oxygen for less than 28 d
(white) or according to oxygen requirement at 36 w PMA in those infants requiring supplemental
oxygen for at least 28 d: air (pink), < 30 % (brown) and ≥ 30 % (blue). The mean (95 % CI) for the
no BPD group is shown as a solid (dashed) line for reference. This figure highlights the heterogeneity
of oxygen requirements in the severe BPD group, in part accounting for the wide range of shift values
in this group. ...................................................................................................................................... 160 Figure 17. Comprehensive shift test enables assessment of pulmonary gas exchange and monitoring
of changes in pulmonary gas exchange. Assessment of shift at day four and at day eight of life in
contrast to a predicted normal shift of 7.1 kPa. Fetal oxygen dissociation curve is measured as
SaO2/PO2, and predicted shift curves are measured as SpO2/PIO2. ODC = oxygen dissociation curve;
VA/Q = ventilation to perfusion ratio (adapted from Gareth Jones). .................................................. 174

xiii
Figure 18. Shift assessed with the 15-minute bedside assessment in relation with the NIH BPD
definition published in 2001. Infants breathing room air on continuous positive pressure ventilation
(severe BPD) are not included in the graph........................................................................................ 181 Figure 19. Scatter plot: shift assessed by the 15-minute bedside assessment dependent on shift
assessed by the comprehensive test. R2 = 0.83; p < 0.0001. .............................................................. 182 Figure 20. Plot of differences between the 15-minute bedside assessment and the comprehensive shift
test, expressed as percentage difference from the mean of two tests. Each open circle denotes a single
infant. Solid black line = mean; dotted line = 95 % CI of the mean; dashed line = limits of agreement
(1.96SD). ............................................................................................................................................ 183 Figure 21. Three different scenarios. Green curve = infant born 294 weeks’ gestation without BPD;
blue curve = infant born 283 weeks’ gestation measured at high altitude; purple curve = infant born
252 weeks’ gestation with BPD. Red curve = Fetal oxyhemoglobin dissociation. = paired
measurements of SpO2/PIO2 recorded during full shift test. indicates shift. .................................. 188 Figure 22. Linear regression analyses with shift versus PIO2 required to achieve SpO2 88 %, 90 %, 92
% and 94 %. ....................................................................................................................................... 189 Figure 23. Shift dependent on SpO2 at 20 kPa PIO2. Shift = 48.61 – 0.4 * SpO2, R2 = 0.995. ........... 190

xiv
TO MY WONDERFUL WIFE ANITA
AND OUR CHILDREN
EMILY AND JONATHAN

xv
ACKNOWLEDGEMENTS
I would like to thank my supervisors, Prof Jane Pillow, Prof Raffaele Dellacà and
Assoc/Prof Andy Gill, for their ongoing support and their scientific input since
February 2015.
Dear Jane, you encouraged me to apply for an IPRS scholarship, even though I was
convinced that I would not be competitive enough to receive one. Thank you for
insisting and taking me on as your PhD student. Your knowledge is fascinating, and
your teachings over the past four years have been inspirational. You taught me
invaluable skills (including lung function tests, statistics, data collection, English
grammar, etc.) and a whole lot of physiology. Most importantly, I learned how to work
independently in the lung function lab and how to lead and supervise students. You
have become more than a supervisor over the past four years. Thank you also to your
husband Kevin and the few but unforgettable evenings we spent together.
Dear Raffaele, how courageous you were to take on a fellow neonatologist as a PhD
student. I was often overwhelmed by the physiology teaching received from a
biomedical engineer. Thank you for being a brilliant and patient teacher.
Dear Andy, we met in the second bay in SCN3 at KEMH, and you taught me
echocardiography. Working with you on my PhD and in the clinical setting was a
pleasure. The skills you taught me are invaluable for my position as a consultant
neonatologist.
A special thank you to Amanda Woods for her assistance with all the lung function
tests. You have been an amazing study nurse, and you have such a wonderful family.
GO EAGLES!
Thank you to Jane Choi and Zeena Al-Obaidi for your assistance with the lung
function tests, recruitment and data analysis. Dear Jane, we spent hours and hours
discussing the data and trying to make sense of the results. I will never forget these
hours and I am grateful for your support and perseverance. Thanks also for making
very pretty figures, some of which are embedded in this thesis.

xvi
Thank you to Shannon Simpson, you taught me a lot about lung function tests in babies
and you were there when I could not fix the problems with the equipment. I am looking
forward to our future collaborations.
Finally, a huge thank you to Chiara Veneroni, Guilia Pagani, Abhijeet
Rakshasbhuvankar, Hannah Barnett, Jenny Svedenkrans, Graham Hall and the
respiratory team at Telethon Kids Institute.
Thank you to Sven Schulzke for prompting me to embark on my journey to Perth and
offering me a position as a consultant neonatologist at the University Children’s
Hospital Basel.
Thank you to the doctors and nurses at King Edward Memorial Hospital and all the
participating infants and their families.
An extra special thank you to my wonderful wife Anita and our beautiful children
Emily and Jonathan. I could not have done my PhD without the continuous support
and love from you. Anita you were amazing and how you cared for the family over
the past few years, when I was hiding for hours and days in my office, was just
incredible.
A special thank you to my parents, my brothers and their families and to my in-laws
Milena and Roland and of course my brother in-law Oli.
This research was supported by an Australian Government Research Training Program
(RTP) Scholarship awarded by The University of Western Australia. Funding sources
included the National Health and Medical Research Council (NHMRC) of Australia
(GNT1047689, GNT1057514) and the Metropolitan Health Research Infrastructure
Fund (MHRIF). Prior to enrolment as a PhD student, Dr Stoecklin was supported by
the Swiss National Science Foundation (P2BSP3_158837).

xvii
AUTHORSHIP DECLARATION: CO-AUTHORED
PUBLICATIONS
This thesis contains work that has been published or prepared for publication.
Details of the work, Review article:
Stoecklin, B., S.J. Simpson, and J.J. Pillow, Bronchopulmonary dysplasia: Rationale
for a pathophysiological rather than treatment based approach to diagnosis. Paediatr
Respir Rev, 2019. 32: p. 91-97.
Location in thesis:
Chapter 2
Student contribution to work:
Student: 70 % Literature search, write manuscript, revise manuscript, submit
manuscript
S. Simpson: 15 % intellectual input, review drafts including final draft of the
manuscript, intellectual input
J. Pillow: 15 % intellectual input, review final draft of the manuscript
Co-author signatures and dates:
06/06/2020 10/06/2020
Details of the work:
Stoecklin B.*, Choi J.*, Rakshasbhuvankar A., Svedenkrans J., Jones JG., Pillow J.J.
Simplified bedside assessment of pulmonary gas exchange in very preterm infants at 36
weeks’ postmenstrual age. Submitted to Thorax 02/2020. Reviewer comments
received. Resubmission to Thorax planned 07/2020.
* joint 1st authors
Location in thesis:
Chapter 3
Student contribution to work:
Student: 50 % Collection and analysis of data. Development of the prediction table.
Drafted and completed manuscript. Submitted manuscript to Thorax.
J. Choi: 25 % Collection of data, development of the prediction table
A. Rakshasbhuvankar: 5 % collected data in some infants, review final draft of the
manuscript
J. Svedenkrans: 5 % collected data in some infants, review final draft of the manuscript
G. Jones: 5 % intellectual input, review final draft of the manuscript
J. Pillow: 10 % intellectual input, funding, review drafts including final draft of the
manuscript
06/06/2020 08/06/2020 10/06/2020 09/06/2020

xviii
Details of the work:
*Stoecklin B., *Al-Obaidi Z., Svedenkrans J., Pinniger G., Pillow J.J.
Diaphragm function in very preterm infants at 36 weeks’ postmenstrual age.
Manuscript in publishable standard; anticipated submission to Pediatric pulmonology
in August 2020
* joint 1st authors
Location in thesis:
Chapter 4
Student contribution to work:
Student: 50 % Collection and analysis of data. Drafted and completed manuscript.
Z. Al-Obaidi: 20 % Collection and analysis of data
J. Svedenkrans: 5 % Collection of some data
G. Pinniger: 10 % Intellectual input, review drafts including final draft of the
manuscript
J. Pillow:15 % Intellectual input, funding, review drafts including final draft of the
manuscript
Co-author signatures and dates:
06/06/2020 06/06/2020 10/06/2020 06/06/2020
Details of the work:
Stoecklin B., Veneroni C., Pillow J.J., Dellaca R.L.
Respiratory and chest wall mechanics in preterm very infants
Manuscript in publishable standard; anticipated submission to Journal of Applied
Physiology in August 2020.
Location in thesis:
Chapter 5
Student contribution to work:
Student: 50 % Collection and analysis of final data. Drafted and completed manuscript.
C. Veneroni: 20 % Analysis of the raw data
J. Pillow: 10 % Intellectual input, funding, review drafts of the manuscript including
final draft
R. Dellaca: 20 % Intellectual input, review drafts of the manuscript including final draft

xix
Student signature:
Date: 25/06/2020
I, Prof Jane Pillow certify that the student’s statements regarding their contribution to
each of the works listed above are correct.
As all co-authors’ signatures could not be obtained, I hereby authorise inclusion of the
co-authored work in the thesis.
Coordinating supervisor signature
Date: Saturday, 27 June 2020

1
CHAPTER 1
GENERAL INTRODUCTION

2
1 GENERAL INTRODUCTION
1.1. Preterm birth
Approximately 15 million infants are born preterm each year, which equates to a
global preterm birth rate of 10.6 % (Chawanpaiboon et al., 2019). The incidence of
preterm births is rising. In 2000, 9.8 % of all infants were born preterm; this proportion
increased to 10.6 % in 2014 (Blencowe et al., 2012; Chawanpaiboon et al., 2019; J. L.
Cheong et al., 2012). Preterm birth is defined as a birth occuring before 37 completed
weeks’ gestational age (GA). Term infants are born ≥ 37 weeks and < 42 weeks GA.
Preterm infants are further subcategorised into late preterm (34 – 36 weeks GA),
moderate preterm (32 – 33 weeks GA), very preterm (28 – 31 weeks GA), and
extremely preterm infants (< 28 weeks GA) (Blencowe et al., 2012). Approximately
1 % of all live births in Australia and New Zealand were born very preterm in 2017
(Chow et al., 2019). Complications of preterm birth are the leading cause globally for
mortality and morbidity within the first 5 years of age in infants born prematurely
(Chawanpaiboon et al., 2019). To understand the increased propensity of infants with
chronic respiratory disease to continuing illness, most investigators have focused on
the impact of premature birth on the developing lung. However, dyspnoea may result
not only from intra-pulmonary but also extra-pulmonary components of the
respiratory system. Therefore, it is important to understand the relative contributions
of not only the lung, but also the chest wall and diaphragm in development of
persistent breathing problems in infants born preterm.
3
1.2. Developmental stages of the lung and respiratory muscles
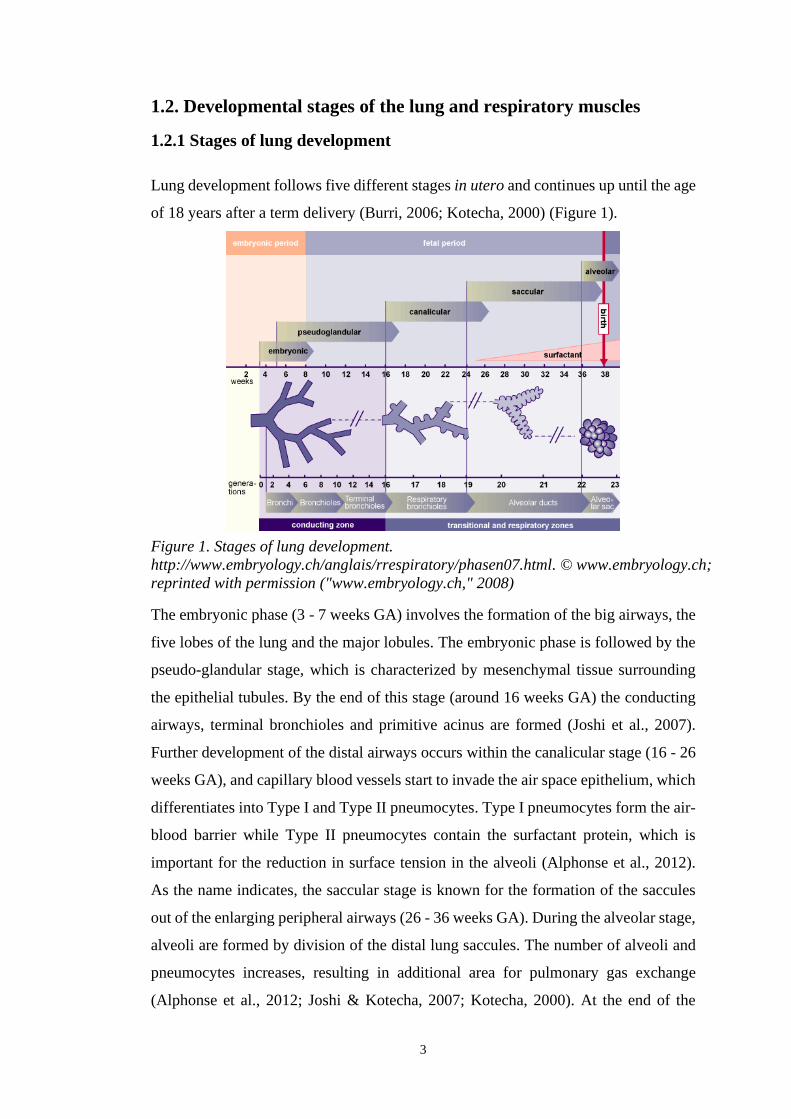
1.2.1 Stages of lung development
Lung development follows five different stages in utero and continues up until the age
of 18 years after a term delivery (Burri, 2006; Kotecha, 2000) (Figure 1).
The embryonic phase (3 - 7 weeks GA) involves the formation of the big airways, the
five lobes of the lung and the major lobules. The embryonic phase is followed by the
pseudo-glandular stage, which is characterized by mesenchymal tissue surrounding
the epithelial tubules. By the end of this stage (around 16 weeks GA) the conducting
airways, terminal bronchioles and primitive acinus are formed (Joshi et al., 2007).
Further development of the distal airways occurs within the canalicular stage (16 - 26
weeks GA), and capillary blood vessels start to invade the air space epithelium, which
differentiates into Type I and Type II pneumocytes. Type I pneumocytes form the air-
blood barrier while Type II pneumocytes contain the surfactant protein, which is
important for the reduction in surface tension in the alveoli (Alphonse et al., 2012).
As the name indicates, the saccular stage is known for the formation of the saccules
out of the enlarging peripheral airways (26 - 36 weeks GA). During the alveolar stage,
alveoli are formed by division of the distal lung saccules. The number of alveoli and
pneumocytes increases, resulting in additional area for pulmonary gas exchange
(Alphonse et al., 2012; Joshi & Kotecha, 2007; Kotecha, 2000). At the end of the
Figure 1. Stages of lung development.
http://www.embryology.ch/anglais/rrespiratory/phasen07.html. © www.embryology.ch;
reprinted with permission ("www.embryology.ch," 2008)

4
alveolar stage the conductive airways, a thin air-blood barrier and a large gas exchange
area, which consists of alveoli and a network of capillary blood vessels form the lung
(Burri, 2006). Within the alveolar stage, but only after birth, a microvascular
maturation stage leads to the formation of the interalveolar walls out of primary septae.
The primary septae contain a double capillary network with surrounding connective
tissue. In contrast, secondary septae only contain a single capillary blood vessel with
much less connective tissue allowing efficient gas exchange. The duration of the
microvascular maturation remains unknown, but seems to last between a few months
up to two years (Burri, 2006). Some authors suspect the arrested premature lung
development is a result of the interrupted microvascular maturation (Joshi & Kotecha,
2007).
1.2.2. Development of the diaphragm
The respiratory muscles are formed in parallel to early lung development. The
diaphragm is the main respiratory muscle, which develops between the 4th and the 10th
week of gestation (Clugston et al., 2007; De Troyer et al., 2011; Mayer et al., 2011).
The diaphragm consists of three different components (Merrell et al., 2013). The costal
component is a thin layer of muscle fibres extending from the ribs and the xiphoid
process to the central tendon (Poole et al., 1997). The crural component is a much
thicker muscle layer than the costal diaphragm and is located posteriorly extending to
the upper lumbar spine (Poole et al., 1997). The central tendon is the third component
and serves as a connection between the costal and the crural diaphragm (Merrell &
Kardon, 2013). The respiratory work is mainly performed by the costal diaphragm,
whereas the crural diaphragm is pierced by the oesophagus and plays an important
role in swallowing (Sefton et al., 2018).
The muscle fibres of the diaphragm are innervated by the right and the left branch of
the phrenic nerve (Allan et al., 1997) (Figure 2). The phrenic nerve originates from
the C3-C5 spinal nerves in the neck and passes over the anterior surface of the anterior
scalene muscle (Bains et al., 2020). This superficial anatomical course of the phrenic
nerve provides the opportunity to stimulate the phrenic nerve to assess maximum
diaphragmatic force. The diaphragm is dome shaped. An activation of the phrenic
nerve leads to an increase in thoracic volume by caudal displacement of the dome of

5
the diaphragm (Figure 2). The increase in thoracic volume leads in turn to an inflation
of the lungs (Poole et al., 1997).
Figure 2. Anatomy, Thorax, Phrenic nerve, Dec 2018, StatPearls Publishing,
Copyright 2020 by StatPearls Publishing. Reprinted with permission (Rehman et al.,
2020).
The diaphragm consists of different muscle fibres (De Troyer & Boriek, 2011). Muscle
fibres can be classified according to their speeds of shortening. Type I fibres are slow
twitch fibres and type II are fast twitch fibres (Scott et al., 2001). Type I fibres appear
red due to their high amount of myoglobin and a dense capillary network, which makes
them highly oxidative and relatively resistant to fatigue (Herbison et al., 1982). The
analysis of the myosin heavy chains enables a more detailed classification of the type
II muscle fibres into IIA, IIB and IIX fibres (Schiaffino et al., 1989; Scott et al., 2001).
In contrast to the red appearance of type I muscle fibres, type II muscle fibres appear
white. Type IIA fibres have a have a high oxidative and glycolytic capacity and are
fatigue resistant. In contrast, type IIB and IIX fibres are characterised by poor

6
oxidative and high glycolytic capacity, which explains why they are more prone to
fatigue (Herbison et al., 1982). However, type IIB and IIX muscle fibres produce more
force than type I fibres (Geiger et al., 2000). In the absence of respiratory disease, the
composition of the muscle fibres in the diaphragm changes over time with an increase
in type I muscle fibres towards term gestation (Keens et al., 1978). The diaphragm of
preterm infants comprises mainly type IIA fibres, whereas the type IIB and IIX muscle
fibres typically appear post-term (Song et al., 2014). The different combination of
muscle fibres in the diaphragm of preterm infants compared to term infants leads to a
fatigue resistant but weaker muscle at birth (Lavin et al., 2013). The postnatal
ontogeny of muscle fibre type composition in preterm subjects is unknown.
1.2.3. Development of the chest wall
The chest wall develops from the mesoderm and is part of the axial skeleton consisting
of bones, intercostal muscles and connective tissue (Donley et al., 2020). The chest
wall forms between the 5th and the 10th week of gestation in parallel to the development
of the diaphragm (Donley et al., 2020). The ossification process starts during the fetal
period and progresses rapidly after birth. The progress in ossification of the chest wall
can be measured by the static compliance of the chest wall. The compliance of the
chest wall at two years of age is almost equal to the chest wall compliance in adults
(Papastamelos et al., 1995). The stiffening of the chest wall prevents distortion of the
chest during normal breathing what is thought to play an important role in the
improved ventilatory efficiency in older children and adults (Papastamelos et al.,
1995).
The development of the diaphragm and the chest wall play an important role in the
development of the lung. Animal studies show that transection of the phrenic nerve in
utero eliminates fetal breathing movements, which subsequently leads to impaired
fetal lung growth (Liggins et al., 1981). Fetal breathing movements can be detected as
early as in the 11th week of gestation in humans (Boddy et al., 1975). Fetal breathing
movements increase with increasing gestation and stimulate lung growth by unknown
mechanisms (Jansen et al., 1991; Kitterman, 1996).
After birth, the diaphragm and the chest wall work synergistically towards efficient
breathing. The bony structures of the chest wall serve as anchor points for the
7
respiratory muscles (Donley et al., 2020). The contraction of the diaphragm is
responsible for the increase in the vertical diameter of the chest, whereas the
contraction of the external intercostal muscles increases the transverse diameter.
Furthermore, the contraction of the external intercostal muscles pulls the ribs cephalad
which results in an increase of the anterior-posterior diameter of the chest (Donley et
al., 2020). In addition to the diaphragm and the external intercostal muscles, several
accessory muscles exist (Donley et al., 2020). These muscles are usually not active
during quiet breathing, but play an important role during exercise and in case of
respiratory disease. Activity of the accessory muscles during rest is an indicator of
respiratory distress (Donley et al., 2020).
1.3. Early respiratory disease
Respiratory distress syndrome previously called hyaline membrane disease in preterm
infants is a combination of interrupted lung development and surfactant deficiency
(Hermansen et al., 2015). As mentioned earlier, very preterm infants are born during
the canalicular or saccular stages of lung development and therefore without alveoli,
as the alveolar stage of lung development begins at 36 weeks’ gestation. Type II
pneumocytes are present from the 26th week of gestation onwards (Hermansen &
Mahajan, 2015). Therefore, extremely and very preterm infants maintain pulmonary
gas exchange with reduced gas exchange surface through the respiratory bronchioles
and the alveolar ducts and with minimal amounts of surfactant (Figure 1). Moreover,
pulmonary gas exchange is impaired further by inflammation leading to a thickened
diffusion barrier (Ambalavanan et al., 2009).
Prevention and treatment of respiratory distress syndrome includes the administration
of antenatal steroids to the mother, postnatal surfactant replacement therapy and
assisted ventilation (Liggins et al., 1972; Robertson et al., 1998; Sweet et al., 2019).
The administration of antenatal steroids and postnatal surfactant decreases the severity
of respiratory distress syndrome resulting in increased survival of very- and extremely
preterm infants (Roberts et al., 2017; Sweet et al., 2019).
Antenatal steroids were introduced in the 1970s for women presenting with threatened
preterm labour (Liggins & Howie, 1972). Currently, antenatal steroids are routinely
prescribed to women with threatened preterm labour before 34 weeks’ gestation;

8
antenatal steroids should be administered at least 24 hours before birth (Sweet et al.,
2019). Antenatal steroids mature the surfactant producing Type II pneumocytes and
accelerate lung growth by thinning the double capillary loops to the thin gas
exchanging alveolar walls (Vyas et al., 1997). As a result antenatal steroids reduce
mortality and the incidence of respiratory distress syndrome (Roberts et al., 2017).
Moreover, antenatal steroids reduce the incidence of intraventricular haemorrhage and
necrotising enterocolitis (Roberts et al., 2017).
Routine administration of endotracheal surfactant was introduced in the early 1990s
(Robertson & Halliday, 1998). Lack of surfactant is associated with a higher lung
surface tension, atelectasis, ventilation/perfusion mismatch and results in hypoxia,
hypercapnia and subsequently acidosis (Hermansen & Mahajan, 2015). Surfactant
replacements therapy should be started as early as possible in preterm infants with
respiratory distress syndrome (Sweet et al., 2019). Currently, animal-derived
surfactant preparations are used, but synthetic preparations are under development
(Curstedt et al., 2015).
Eventually, infants with respiratory distress syndrome require assisted ventilation. In
Australia and New Zealand 95 % of the 3,502 infants born very preterm received
assisted ventilation in 2017. The main indication for assisted ventilation in these
infants was respiratory distress syndrome (Chow et al., 2019). The preferred mode for
mechanical ventilation is synchronised and volume targeted (Sweet et al., 2019).
However, whenever possible mechanical ventilation should be avoided for the
negative side effects including ventilator induced lung injury (VILI) and ventilator
induced diaphragm dysfunction (VIDD) (Sweet et al., 2019). The aim is therefore to
use non-invasive respiratory support whenever possible.
In addition to antenatal steroids, postnatal surfactant administration and assisted
ventilation, optimal care of infants with respiratory distress syndrome includes good
body temperature control, careful fluid management with sufficient caloric intake and
nutrient composition, and judicious use of antibiotics (Sweet et al., 2019). However,
despite the advances made in the care of respiratory distress syndrome in preterm
infants over the past decades, some infants with respiratory distress syndrome develop
a long-term complication called bronchopulmonary dysplasia (BPD).
9
1.4. Chronic lung disease in preterm infants
Bronchopulmonary dysplasia was first described by Northway et al. in 1967
(Northway et al., 1967). In 1967 infants affected were born at an average of 34 weeks
gestation (Northway et al., 1967), but most infants suffering from BPD in the
contemporary era are born < 32 weeks gestation (Higgins et al., 2018). BPD is the
most frequent long-term respiratory complication following preterm birth and the
prevalence of BPD is rising (B. J. Stoll et al., 2010; Thebaud et al., 2019). The
incidence of BPD in very preterm infants varies between 10 % – 32 % (Gortner et al.,
2011; Trembath et al., 2012). In Australia and New Zealand 30.3 % of all infants born
< 32 weeks gestation developed BPD in 2017 (Chow et al., 2019).
Infants with BPD show signs of a breathing disorder characterized by increased minute
ventilation and decreased functional residual capacity during the neonatal period
(Latzin et al., 2009; Wauer et al., 1998b; Yoder et al., 2019). Preterm infants with BPD
have an increased risk for respiratory morbidity within the first two years of life
compared to healthy term infants (Priante et al., 2016; Tan et al., 2020). Long-term
sequelae beyond early childhood include a decrease in lung function compared to
healthy term infants, including a decline in forced expiratory volume in one second
(FEV1), in forced expiratory flow and in FEV1 /forced vital capacity (Baraldi et al.,
2007; J. L. Y. Cheong et al., 2018; Doyle et al., 2017; Gibson et al., 2015; Shannon J.
Simpson et al., 2018). Moreover, infants with BPD show limitation in expiratory flow
during exercise (O'Dea et al., 2018).
BPD is a multifactorial disease. The main risk factors of BPD include prematurity and
low birth weight including intrauterine growth restriction (Higgins et al., 2018; A. H.
Jobe, 2011; Marshall et al., 1999; Morrow et al., 2017), male sex (Costeloe et al.,
2012), genetic factors (Parker et al., 1996), mechanical ventilation (Reiterer et al.,
2016; Van Marter et al., 2000), oxygen therapy (Northway et al., 1967), maternal
chorioamnionitis (Kinsella et al., 2006) and maternal smoking (Morrow et al., 2017).
The comprehensive list of risk factors offers multiple targets for the prevention and
the treatment of BPD. Nevertheless, the treatment of evolving BPD remains
challenging due to complex interactions between risk factors (Schulzke et al., 2010).
The primary aims in the prevention of BPD overlap largely with the treatment of

10
respiratory distress syndrome. The main goal is to limit lung injury by gentle assisted
ventilation, avoidance of oxygen therapy, optimal fluid balance with sufficient caloric
and nutrient intake and avoidance of postnatal infections (Schulzke & Pillow, 2010).
Pharmacological treatment include the administration of caffeine (Schmidt et al.,
2006), vitamin A (Tyson et al., 1999), postnatal steroids (Doyle et al., 2006) and
pulmonary vasodilators (Schulzke & Pillow, 2010). Of these four drugs, only caffeine
is used routinely for the prevention of BPD. Vitamin A is administered
intramuscularly and is therefore not used in daily practice. However, the EVARO
study investigating the effects of enteral vitamin A substitution for the prevention of
BPD was undertaken during my PhD candidature with my assistance
(Rakshasbhuvankar et al., 2017). The administration of enteral vitamin A is not painful
and therefore a good alternative to the intramuscular administration. The final results
of the EVARO study are pending, hence the value of this alternative approach remains
unknown. Postnatal steroids are not used routinely for their negative side effects
including an increased risk of cerebral palsy (Doyle et al., 2006). Similarly, pulmonary
dilators are not used routinely for the lack of clear treatment criteria and the high costs
(Schulzke & Pillow, 2010).
Surfactant does not decrease the incidence of BPD (Bancalari et al., 2001), but has
changed the phenotype of BPD, which is reflected by the term ‘new’ BPD coined by
Jobe in 1999 (Alan J. Jobe, 1999). Infants born in the post-surfactant era show less
fibroproliferative airway damage and parenchymal fibrosis but have fewer and
simplified alveoli attributed to arrested lung development (Bland, 2005; A. J. Jobe,
1999).
The definition of BPD changed several times alongside changes in therapeutic
strategies since the disease was first described in 1967. The most recent definition of
BPD was published by the National Institute of Health in 2018 and reflects the use of
newer modes of assisted ventilation including high and low flow nasal cannula (Table
3) (Higgins et al., 2018). Moreover, infants dying from respiratory disease older than
two weeks of age are for the first time reflected in the grade IIIA. Nevertheless, the
current definition of BPD is still a treatment based rather than a pathophysiological
based definition.

11
A major pitfall of the current BPD definition is that infants requiring FiO2 > 0.3 and
infants requiring invasive positive pressure ventilation without additional oxygen at
36 weeks’ postmenstrual age are both classified in the severity group III. The
requirement of oxygen indicates impaired pulmonary gas exchange, which is
explained by a reduction in gas exchange surface due to a lack of alveoli and also a
lack of surfactant. However, the requirement of positive pressure ventilation might
reflect respiratory muscle dysfunction or alterations of the chest wall structure. I
revisited the BPD definitions and compiled a comprehensive list with pitfalls of the
BPD definitions in the review article presented in Chapter 2.
To distinguish between the different underlying pathophysiology of BPD, I developed
a test to measure impairment in pulmonary gas exchange at the bedside in preterm
infants at 36 weeks postmenstrual age (Chapter 3). Despite the comprehensive list of
risk factors of BPD, data on how diaphragm function and the chest wall contribute to
the breathing disorder present in infants with BPD are scarce. I therefore investigated
efficiency of diaphragm contraction and diaphragmatic work of breathing (Chapter 4)
and chest wall compliance (Chapter 5) in infants these infants.
12
1.3. Aims
The main aim of my PhD studies was to:
Characterise the breathing disorder in infants with bronchopulmonary
dysplasia.
This aim was further subcategorised into:
a) Exploration of the current definitions of BPD (Chapter 2) and suggestion for a
pathophysiological based definition
b) Development of a simplified bedside assessment of pulmonary gas exchange
(Chapter 3). This aim arose from our manuscript entitled: “Physiology and predictors
of impaired gas exchange in infants with bronchopulmonary dysplasia (Svedenkrans
et al., 2019a) on which I was joint 1st author (Appendix 1).”
c) Characterisation of the breathing disorder in infants with BPD with respect to the
assessment of:
i) the contractile efficiency and work performed by the diaphragm during tidal
breathing in quiet sleep (Chapter 4),
ii) the static compliance of the respiratory system, the lung and the chest wall
(Chapter 5)
1.4. Hypotheses
1.4.1. Hypothesis I (Chapter 3)
We hypothesised that the shift value obtained from a prediction table using a single
paired measurement of SpO2 and PIO2 provides an assessment of pulmonary gas
exchange comparable to that using multiple paired SpO2 and PIO2 measurements.

13
1.4.2. Hypothesis II (Chapter 4)
We hypothesised that diaphragm function during spontaneous breathing in very
preterm infant is influenced by adverse antenatal and postnatal exposures. Moreover,
we hypothesised that diaphragm function is impaired in infants with
bronchopulmonary dysplasia (BPD).
1.4.3. Hypothesis III (Chapter 5)
We hypothesised that infants with BPD have a stiffer chest wall compared to infants
without BPD, which will contribute to the decreased compliance of the respiratory
system seen in infants with BPD.
1.5. Brief outline of the manuscripts
This thesis is in agreement with the Postgraduate and Research Scholarship Regulation
1.3.1.33 (1) of the University of Western Australia, Australia and is presented as a
series of four scientific papers. All physiological studies were performed on a cohort
of very preterm infants studied between 21st of July 2013 and 12th of May 2018 as part
of the Preterm Infant Functional and Clinical Outcomes (PIFCO) study (NHMRC
0147689). One manuscript is published, one is awaiting resubmission after addressing
reviewer comments and two manuscripts are presented as final drafts prior to journal
submission. There are six main chapters in this thesis; a general introduction (Chapter
1), a state of the art review (Chapter 2), three experimental chapters (Chapters 3-5)
and a general discussion (Chapter 6). References of the whole thesis are combined in
Chapter 7 and Appendices are included in Chapter 8. The General Introduction covers
the background for the work presented in the thesis. A more focussed review of the
literature is presented in the introduction of each experimental chapter. Chapter 2 to
Chapter 5 are presented in the format of scientific manuscripts, that can be read
individually or as a part of the whole thesis; these chapters are structured for
publication according to the guidelines of the actual or intended medical journal. Each
experimental chapter is preceded by a short preface, which serves to link the chapter
to the broader hypotheses addressed by the thesis. The general discussion ties together
the findings and outlines future potential projects.

14
1.5.1. Manuscript 1: Bronchopulmonary dysplasia: rationale for a
pathophysiological rather than treatment based approach to diagnosis.
The review article presented in Chapter 2 is a unique comprehensive summary of the
different BPD definitions and the pitfalls of the current BPD definitions. A detailed
explanation on the rationale to finally move from a treatment based to a physiological
based definition of the disease is embedded within (Stoecklin et al., 2019).
1.5.2. Manuscript 2: Simplified bedside assessment of pulmonary gas
exchange in very preterm infants at 36 weeks’ postmenstrual age.
In the second study of this thesis, I present a simplified and validated method to assess
pulmonary gas exchange bedside in very preterm infants at 36 weeks’ postmenstrual
age. We developed a prediction table for shift of the SpO2 versus PIO2 curve based on
a single-paired SpO2 versus PIO2 measurement and neonatal haemoglobin. The
prediction table is based on the data collected in 219 very preterm infants and provides
accurate estimations of shift at a population level (Stoecklin et al. submitted to Thorax
12/02/2020, reviewer comments received with an invitation to resubmit after revision
on 08/05/2020). The assessment of pulmonary gas exchange without this table was
possible previously, but was time-consuming and therefore only possible in the
research setting (Svedenkrans et al., 2019a). The table enables clinicians to assess
pulmonary gas exchange on a daily basis in the clinical setting and allows comparisons
between neonatal units.
1.5.3. Manuscript 3: Diaphragm function in very preterm infants at 36
weeks’ postmenstrual age.
In the third study, I focussed on the efficiency of diaphragm contractile function and
inspiratory work performed by the diaphragm during tidal breathing in quiet sleep. We
measured diaphragm contractility in 182 preterm infants at 36 weeks’ postmenstrual
age, which makes it the largest study on diaphragm function in preterm infants. We
deliberately assessed diaphragm function at rest, as infants with BPD exhibit
difficulties in breathing during rest. When examined as a full cohort, efficiency of
diaphragm contractile function increased with birthweight Z score, an indicator of
improved intrauterine growth. However, and counter to our expectations, increased

15
early postnatal nutritional energy content decreased diaphragmatic contractile
efficiency and increased diaphragmatic work of breathing. Moreover, infants with
BPD showed more efficient diaphragmatic contractile force and diaphragmatic work
of breathing during quiet sleep.
1.5.4. Manuscript 4: Static respiratory mechanics in very preterm infants
with and without bronchopulmonary dysplasia
The fourth study includes a comprehensive assessment of respiratory mechanics and
breathing parameters in the post-surfactant era. Currently no data exist on static
compliance of the chest wall in the post-surfactant era. Our results suggest a less
compliant respiratory system, less compliant lungs and a less compliant chest wall in
preterm infants with moderate and severe BPD compared to infants without BPD.

16
CHAPTER 2
BRONCHOPULMONARY DYSPLASIA: RATIONALE
FOR A PATHOPHYSIOLOGICAL RATHER THAN
TREATMENT BASED APPROACH TO DIAGNOSIS.
Preface:
I revisited the definitions of bronchopulmonary dysplasia and put
together a comprehensive list of pitfalls of the current BPD definitions.
The list of pitfalls enables the reader to understand why I recommend to
move on from a treatment- based definition to a pathophysiology- based
definition and provides the basic knowledge for the second study of my
PhD.
This manuscript was published in Paediatr Respir Rev, 2019. 32:
p. 91-97.
17
2. BRONCHOPULMONARY DYSPLASIA:
RATIONALE FOR A PATHOPHYSIOLOGICAL
RATHER THAN TREATMENT BASED APPROACH TO
DIAGNOSIS.
Benjamin Stoecklina,b,c, Shannon J. Simpsond, Jane J. Pillowa,b*
a School of Human Sciences, University of Western Australia, Perth, Australia
b Centre for Neonatal Research and Education, University of Western Australia,
Perth, Australia;
c Neonatal Clinical Care Unit, King Edward Memorial Hospital, Perth, Australia
d Telethon Kids Institute, Perth, Australia
*Corresponding author. School of Human Sciences, University of Western Australia,
35 Stirling Highway, Perth WA 6009, Australia. E-mail address:
Funding sources
Dr Stoecklin was supported by the Swiss National Science Foundation
(P2BSP3_158837) and a Research Training Program scholarship, The University of
Western Australia. Prof Jane Pillow is supported by a National Health Medical
Research Council Senior Research Fellowship (NHMRC 1077691).
Financial disclosure
None of the authors have financial relationships to this article relevant to disclose.
Directions for future research
Develop diagnostic criteria for BPD based on quantitative function rather than
unstandardized treatment, to reflect more accurately the pathophysiological basis and
severity of BPD and to provide meaningful insights that guide ongoing
cardiorespiratory management.
Educational aims
• Definition of bronchopulmonary dysplasia across the ages
• Pitfalls of the current definition of bronchopulmonary dysplasia
• Shift as a marker of impaired pulmonary gas exchange capacity
• Shift of the SpO2 / PIO2 curve as a dynamic physiological test for severity of
bronchopulmonary dysplasia
18
2.1. Summary
Bronchopulmonary Dysplasia (BPD), also known as Chronic Lung Disease (CLD), is
a chronic respiratory condition of prematurity with potential life-long consequences
for respiratory well-being. BPD was first described by Northway in 1967, when the
mean gestation of preterm infants with BPD was 34 weeks’ postmenstrual age (PMA).
Survival of preterm infants at lower gestational ages has increased steadily since 1967
associated with marked improvements in respiratory management of respiratory
distress syndrome. Currently, BPD develops in approximately 45 % of all infants born
extremely preterm (Barbara J. Stoll et al., 2015). These smaller and more immature
babies are born during the late canalicular or early saccular period of lung
development. Not surprisingly, the pathophysiology of BPD also evolved since
classical BPD was described. As the nature and our understanding of BPD evolved,
so too the definitions and classification of BPD changed over time. These differing
and ever-changing definitions hamper clinical benchmarking as they are interpreted
and applied inconsistently, and define BPD and its severity by non-standardised
treatments rather than independent evaluations of structure or function. A
standardised, unambiguous definition and classification of BPD is essential for
evaluation and improvement in clinical practice, both within an individual unit, as well
as across and between neonatal networks. The determination and implementation of
diagnostic criteria and severity classification that is standardised, globally applicable,
and that has prognostic utility for clinical outcomes and guidance of ongoing
respiratory management remains of utmost importance. This review describes the
evolution of BPD definitions, evaluates the benefits and limitations of each approach,
and discusses alternative approaches that may improve the functional assessment of
BPD severity.
Keywords
Infant, premature
Bronchopulmonary Dysplasia
Pulmonary Gas Exchange
Infant, Newborn, Diseases
Oximetry
Physiological definition
Abbreviations: BPD, bronchopulmonary dysplasia; PMA, postmenstrual age;
NICHD, National Institute of Child Health and Human Development; PNA, postnatal

19
age; FIO2, fractional inspired oxygen; PPV, positive pressure ventilation; CPAP,
continuous positive airway pressure; PIO2, inspired oxygen pressure.
2.2. Definitions of BPD across the ages
2.2.1 The original definition of BPD
The original definition of BPD was published by Northway in 1967. Affected infants
were born during the late saccular or the alveolar stage of lung development and
exposed to high oxygen concentrations and high peak airway pressure during
mechanical ventilation (Northway et al., 1967; Taghizadeh et al., 1976).
Northway described 4 stages of BPD based on the clinical, radiographic and the
histopathological findings (Table 1) (Cindy T. McEvoy et al., 2015). Preterm infants
with BPD initially presented with acute respiratory distress syndrome, which evolved
to a chronic disease after day 28 of life. The chest radiograph findings correlated with
changes in histopathology, which showed an initial acute inflammatory stage followed
by chronic inflammatory processes that resulted in fibrosis. A timeline highlighting
the most important revisions to the definition is shown in Figure 3.
Figure 3. Timeline of major revisions in the definition of BPD.

20
Table 1. Stages of bronchopulmonary dysplasia described by Northway et al. in
1967.
BPD Stages Chest radiograph Histopathology (most significant
findings)
Stage I
Acute respiratory
distress syndrome
(2 - 3 days)
Generalised granular
pattern, air
bronchogram.
Hyaline membranes, atelectasis,
lymphatic dilatation.
Decrease in ciliated cells with
metaplasia and necrosis of
bronchiolar mucosa.
Stage II
Period of
regeneration
(4-10 days)
White lungs, no visible
cardiac borders.
Persisting hyaline membranes.
Necrosis of alveolar epithelium and
bronchioles together with repair of
epithelium.
Focal thickening of capillary
basement membranes.
Stage III
Transition to
chronic disease
(10 - 20 days)
Small rounded areas of
radiolucency across
both lungs coexistent
with areas of irregular
density.
No signs of
cardiomegaly and no
air bronchogram.
Decrease in hyaline membranes.
Persisting injury to alveolar
epithelia.
Mucous secretion, moderate
exudation of alveolar macrophages
and histiocytes.
Focal thickening in the basement
membrane.
Stage IV
Chronic disease
(beyond 1 month)
Enlargement of the
rounded areas
described in stage III.
Irregular density areas
thinner than in stage
III.
Cardiomegaly
Increased number of macrophages,
histiocytes, foam cells.
Permucosal fibrosis, metaplasia
with detaching mucosal cells.
Marked separation of capillaries
from alveolar epithelia.
Early signs of pulmonary
hypertension (e.g. medial
hypertrophy).

21
2.2.2. BPD definition during the pre-surfactant era
Northway’s definition of BPD was revised in the late 1970s ("Workshop on
bronchopulmonary dysplasia. Sponsored by the Division of Lung Diseases. National
Heart, Lung, and Blood Institute, National Institutes of Health," 1979), motivated by
overlap and inconsistencies in the radiologic findings between acute respiratory
distress syndrome and advanced stages of BPD. Moreover, the four consecutive
radiologic stages of BPD described by Northway were observed rarely. The new
definition provided a more functional definition of BPD based on long-term abnormal
radiologic findings at 30 days of life and oxygen dependency at 28 days of life
(Bancalari et al., 1979; Tooley, 1979). Ten years later, chest radiograph findings were
abolished from the BPD definition, as the pulmonary radiologic changes did not
always correlate with disease severity (A. H. Jobe et al., 2001). Shennan et al. showed
that oxygen dependency at 28 days was a poor predictive factor for negative
pulmonary outcomes in infants born before 30 weeks’ gestation and instead suggested
assessment of oxygen dependency at 36 weeks’ PMA. The revised definition was
published in 1988 and was restricted to infants with a birthweight < 1500 g, reflecting
the transition of BPD to a more immature preterm infant group (Shennan et al., 1988).
At this time the terminology of Chronic Lung Disease (CLD) was introduced as an
alternative.
2.2.3. The post-surfactant era
The introduction of antenatal maternal glucocorticoids and postnatal exogenous
surfactant therapy in the early 1970s and the early 1990s respectively, enabled survival
of infants born extremely preterm. Extremely preterm infants are born with lungs in
the late canalicular or very early saccular stage of development, which changed the
underlying pathophysiology of BPD (Burri, 2006). The immature lungs affected by
BPD showed fewer alveoli with less fibrosis and an overall more diffuse disease of
the lung parenchyma. Jobe coined the term ‘new BPD’ in 1999, (Alan J. Jobe, 1999),
to reflect the histopathological changes in BPD seen in the surfactant era (Husain et
al., 1998; A. H. Jobe & Bancalari, 2001; Joshi & Kotecha, 2007).
In contrast to Northway’s original description of BPD, the new BPD is a consequence
of arrested lung development secondary to a chronic inflammatory process after

22
respiratory distress syndrome (Albertine et al., 1999; Coalson et al., 1995; Hislop et
al., 1987; Husain et al., 1998). In 2001, the National Institute of Child Health and
Human Development (NICHD) published a consensus on the definition of BPD
reflecting the changes the pathophysiology and management of BPD over time (Table
2) (A. H. Jobe & Bancalari, 2001). The NICHD criteria included a severity based scale
for the first time, dependent on the oxygen requirement of the preterm infant at 36 w
PMA (or at discharge). The 2001 definition reflected the improvement in respiratory
care responsible for the fact, that BPD now almost only affected infants born < 32
weeks’ gestational age and / or a birth weight < 1200 g (Berger et al., 2013).
Table 2. NICHD criteria for severity of Bronchopulmonary dysplasia.
Pre-requisite for BPD
(any severity):
FIO2 > 0.21 for at least 28 d
BPD Severity
GA (w PMA) and assessment
timing
Mild Moderate Severe
< 32 Sooner of 36 w PMA
or discharge home
FIO2 = 0.21 0.21 > FIO2 < 0.30 FIO2 = 0.30
and/or positive
pressure (PPV or
nasal CPAP)
≥ 32 Sooner of > 28 d but
< 56 d PNA, or
discharge home
FIO2 = 0.21 0.21 > FIO2 < 0.30 FIO2 = 0.30
and/or positive
pressure (PPV or
nasal CPAP)
PMA, postmenstrual age; PNA, postnatal age; FIO2, fractional inspired oxygen;
PPV, positive pressure ventilation; CPAP, continuous positive airway pressure.
Adapted from ((A. H. Jobe & Bancalari, 2001).
Walsh et al. proposed a physiological classification derived from an oxygen reduction
test in 2003 (Walsh et al., 2003). In contrast to the semi-quantitative severity-based
NICHD definition published in 2001, the outcome of the Walsh test is binary. Infants
failing the oxygen reduction test are classified as having BPD, whereas infants who
pass the test are considered to not have BPD. The SpO2 cut-off value for passing the
test was set to ≥ 90 %. However, normal SpO2 levels in healthy infants are > 96 %
(Mahle et al., 2012). Therefore, preterm infants with mild impairment in oxygenation
23
are misclassified as healthy, when using the Walsh criteria. In practice, the Walsh test
is sometimes used to determine if BPD is present, with the 2001 NICHD classification
added to grade disease severity.
The debate over the definition and classification has continued, with a recent cluster
of opinion and review articles discussing the relative merits of different approaches to
diagnosis of BPD (Babata et al., 2018; Bancalari et al., 2018; Ibrahim et al., 2018; E.
A. Jensen et al., 2018). In a summary of the 2016 NICHD Workshop on BPD, the
workshop panel proposed a further revision of the BPD definition in April 2018
(Higgins et al., 2018). The proposed new definition no longer includes the assessment
of oxygen use for 28 days prior to 36 weeks PMA and emphasises the new modes of
non-invasive respiratory support including nasal cannula. In contrast to the 1988 and
2001 definitions, abnormal chest radiograph findings are again included in the
definition. The subjective terminology of mild, moderate and severe BPD is replaced
by grades I-III. Infants who die due to a respiratory cause prior to 36 weeks PMA are
reflected in the categorisation as grade III(A). The grading depends on the amount of
oxygen the infants receives for at least three consecutive days around 36 weeks PMA,
type of assisted support and also on the flows of supplemental nasal cannula gas when
used (Table 3).

24
Table 3. April 2018 revision of the 2001 NICHD BPD criteria.
Grade BPD Severity Grade
I II III IIIA
Invasive PPV* - 0.21 > 0.21 > 0.21
nCPAP, NIPPV,
or nasal cannula ≥
3 L/min.
0.21 > 0.21 but
< 0.30
≥ 0.30 Early death
(between 14 d
PNA and 36 w
PMA) owing to
persistent
parenchymal
lung disease and
respiratory
failure not
attributable to
other neonatal
morbidities
Nasal cannula:
1 L/min ≤ flow <
3 L/min
> 0.21 but
< 0.30
≥ 0.30
Nasal cannula
flow ≥ 3 L/min
> 0.21 but
< 0.70
≥ 0.30
Hood O2 > 0.21 but
< 0.30
≥ 0.30
Data in cells are proposed FiO2 limits. * excludes infants ventilated for primary
airway disease or central respiratory control conditions. PPV, positive pressure
ventilation; nCPAP, nasal continuous positive airway pressure; NIPPV, non-
invasive positive pressure ventilation; PNA, postnatal age; PMA, postmenstrual
age. Adapted from Higgins et al. (Higgins et al., 2018).
2.3. Pitfalls of the current BPD definitions
The 2001 and current NICHD BPD classification have multiple pitfalls, as outlined
and briefly discussed below.
2.3.1. Use of treatment as basis for definition and classification:
The definition of BPD by its treatment rather than the underlying pathophysiology and
its consequences for later outcomes is perplexing and fundamentally flawed (C. T.
McEvoy et al., 2014). The non-standardised target range for SpO2 used to determine
prescription of supplemental oxygen leads to global differences in oxygen prescribing
25
policies (Bancalari & Jain, 2018; Ellsbury et al., 2002; Sahni et al., 2005; van Rossem
et al., 2015). Similarly, departmental guidelines and physician practices for choice of
mechanical respiratory support, and duration of such treatments vary widely. Not
surprisingly, the incidence of BPD defined by such treatments also varies widely
(Strueby et al., 2014). Importantly, neither level of oxygen therapy or type/duration of
respiratory support at 36 w PMA properly inform clinicians regarding the specific
nature of the underlying problem and hence do not assist development of appropriate
clinical management.
2.3.2. Semi-quantitative assessment and arbitrary thresholds:
The severity of BPD is a semi-quantitative assessment based on arbitrary thresholds.
Infants are categorized into three different stages based on the level of respiratory
support and physician-prescribed oxygen dependency at 36 weeks’ PMA. Semi-
quantitative categories are useful for broad classification but limit sensitivity for
detection of clinically relevant differences between intervention groups (in a
randomised controlled trial) or for determination of improvement in condition for any
given infant over time. Ideally, thresholds for classifications levels should be modelled
from prognostic outcomes for survival and long-term morbidities in a way that would
guide ongoing management. Examples of the arbitrary nature of thresholds in the most
recent NICHD skeletal definition of BPD are the different inspired oxygen thresholds
for infants on nasal cannulae compared to oxygen hood, and inconsistencies in
whether threshold values belong to the lower or higher category.
2.3.3. Failure to consider altitude in assessment of BPD:
The availability of oxygen in inspired gas mixtures is dependent on altitude (Table 4)
(Baillie, 2010; Peacock, 1998). The role of altitude in the assessment of BPD using
current definitions is revealed by examination of the alveolar gas equation. The
simplified version of the alveolar gas equation equals 𝑃𝑎𝑂2 = 𝑃𝐼𝑂2 − 𝑃𝑎𝐶𝑂2
𝑅, where
PaO2 and PaCO2 are the partial pressure of O2 and CO2 in the arterial blood,
respectively. PIO2 is the partial inspired oxygen pressure and R is the respiratory
exchange ratio (Curran-Everett, 2006). PIO2 decreases with an increase in altitude: a
lower PIO2 results in a decrease in PaO2 and subsequently in SpO2 (Table 4).

26
Therefore, the incidence of BPD increases with increasing altitude above sea level,
unless adequate adjustment is made for the PIO2 (Britton, 2012; Gulliver et al., 2018).

27
Table 4. Oxygen availability dependent on altitude above sea level.
2.3.4. Interpretation of chest radiographs
Abnormal chest radiograph findings were the most important factor of the initial
definition of BPD described by Northway in 1967. Serial chest radiographs showed
the progress of the disease (Northway et al., 1967). However, the radiologic changes
did not follow a strict pattern with an increase of survival of younger preterm infants,
and were therefore abolished in the 1988 and 2001 definitions (Alan H Jobe, 2006; A.
H. Jobe & Bancalari, 2001; Shennan et al., 1988). Surprisingly, the 2018 revision
reintroduces a requirement for radiographic confirmation of parenchymal lung disease
in the definition (E. A. Jensen & Wright, 2018). An explanation for this reversion is
not provided, but radiographic changes may have been included to exclude diagnosis
of BPD from increased ventilation and oxygen requirements due solely to
extrapulmonary factors such as cardiac, airway, respiratory muscles pathology or
respiratory control.
2.3.5. BPD definitions as a benchmarking tool for neonatal intensive care
units
Pitfalls 1 - 4 above lead to differences in how BPD is assessed globally resulting
directly from non-standardised SpO2 target range, non-inclusion of altitude as an
important determinant of PIO2 and inconsistencies in the interpretation of chest x-rays.
Altitude (m) Barometric
pressure
(kPa)
Barometric
pressure
(mmHg)
FIO2 PIO2
(kPa)
% Oxygen
availability
0 (sea level) 101 760 0.21 21 100
200 99 743 0.21 20.8 98
500 96 718 0.21 20.2 94
1000 90 679 0.21 18.9 89
2000 81 604 0.21 17.0 80
PIO2 = FIO2 (barometric pressure - 47 mmHg), where PIO2 is partial pressure of
inspired oxygen and FIO2 is fractional inspired oxygen.
28
Consequently, the current definitions do not provide a useful tool for clinical
benchmarking between neonatal units from different geographic regions.
2.3.6. Time-points for diagnosis of BPD and assessment of its severity:
Debate continues regarding appropriate time-points for diagnosis of BPD, and for the
assessment of its severity. The requirement for treatment with supplemental oxygen
for at least 28 d in the 2001 NICHD definition was interpreted variably as 28 total
days of oxygen support or oxygen support at day 28, including either any supplemental
oxygen on any of those days or at least 12 hours supplemental oxygen on any day
defined as a day of oxygen therapy. Furthermore, this stipulation precluded diagnostic
classification of an infant prior to 28 d, and hence had limited utility as a criterion for
institution of higher-order therapies. The recent revised NICHD definition of BPD
removed the requirement for 28 days of oxygen therapy prior to 36 weeks PMA, which
both allows for earlier diagnosis of BPD in infants dying before 28 d (A. H. Jobe &
Bancalari, 2017), and eliminates the problem of different interpretations of the
terminology “at least 28 d” (Ellsbury et al., 2002).
BPD severity is currently assessed at 36 weeks’ PMA (Higgins et al., 2018; A. H. Jobe
& Bancalari, 2001), but when to best assess BPD severity remains unclear. Isayama
showed that the assessment of BPD severity at 40 weeks’ PMA had a higher predictive
value for long-term negative pulmonary and neurosensory outcomes at 18 – 21
months’ corrected age (Isayama et al., 2017). However, neither 36 weeks’ or 40
weeks’ PMA are ideal time points, as a high percentage of infants are already
discharged or transferred from tertiary level neonatal intensive care units by that age.
Consequently, infants can be over- or under-classified as follow-up data are often
missing after transfer to a regional unit (A. H. Jobe & Bancalari, 2017; Poindexter,
Feng, et al., 2015). The most recent NICHD classification retains the 36 w PMA time-
point, acknowledging the movement of infants from the diagnostic centre beyond this
time.
2.3.7. Lack of distinction between underlying pathophysiologies of BPD
Infants requiring invasive ventilation, N-CPAP, NIPPV or nasal cannula with flows
above 3 L/min are categorized as having BPD independent a requirement for

29
supplemental oxygen by the most recent suggested BPD definition (Higgins et al.,
2018). The dependency on respiratory support without the need for supplemental
oxygen is most likely an indicator of small and/or large airway pathology, or of
disrupted control of breathing and secondary obstructive airways consequent to
primary central apnoea. Similarly, it is possible that some infants receiving minimal
pressure nasal cannula support may only have an oxygen deficiency arising from
reversible atelectasis that is consequent to airway collapse. The clinical management
and future implications of each of these conditions is different, and is confused by a
non-specific collective diagnosis of BPD that mixes pulmonary and non-pulmonary
pathology into the definition of BPD. This pitfall persists in the most recent revision
of the classification despite the ill-defined requirement for radiographic confirmation
of parenchymal lung disease (e.g., when?; for how long?).
2.3.8. Poor predictive value of current definitions for future respiratory
morbidity and responsiveness to therapy.
The predictive value for long-term pulmonary outcomes of the most recent proposed
revision of the BPD definition is unknown but most likely will be plagued by the same
issues facing earlier definitions. The 2001 BPD definition and the physiological
classification proposed by Walsh have poor predictive value for long-term pulmonary
outcomes (Onland et al., 2013; Poindexter, Feng, et al., 2015), as infants with and
without BPD experience negative pulmonary long-term negative sequelae
(Ehrenkranz et al., 2005; Fawke et al., 2010; J. et al., 2015; S. J. Simpson et al., 2017;
Shannon J. Simpson et al., 2018; Urs et al., 2018). A composite outcome of respiratory
support and oxygen therapy at 40 weeks’ PMA had the highest predictive value for
long-term pulmonary and neurosensory outcomes (Isayama et al., 2017). However, as
respiratory support might reflect abnormal central nervous system function, the higher
predictive value for negative neurosensory outcomes is not surprising. Alternatively,
it may be a consequence of repeated hypoxia due to obstructive apnoea associated
with airway disorders, unrelated to parenchymal pathology. Retrospective evaluations
of the predictive value of objective neonatal variables for adverse later respiratory
outcomes may inform new definitions. Such variables would require validation across
multiple cohort sets, and may vary for different adverse respiratory outcomes.
30
Predictive variables informed by later adverse outcomes would enhance planning for
appropriate clinical follow-up and early intervention after hospital discharge.
2.4. The way forward: A dynamic definition of BPD based on
pathophysiology?
2.4.1. Desired features of a new definition of BPD
A new definition of BPD should strive to meet multiple goals: the definition should
incorporate simple objective functional assessments ideally performed bedside by
clinical staff to facilitate global uptake; further, the definition should be simple to
interpret and apply, reflect the underlying pathophysiology of the disease and be
adaptable to different stages of an evolutionary disease process. More than one bedside
assessment tool may be necessary to achieve these objectives. The assessment tools
require sufficient sensitivity to detect small improvements or deteriorations in disease
severity at the population level (for evaluation of efficacy of new therapies); and
additionally be sufficiently repeatable and reproducible to identify deterioration or
improvement at the individual level. Finally, the assessment tool and ultimately the
severity classifications within the definition of BPD, should have a high predictive
value for negative pulmonary long-term sequelae to identify infants at high risk, guide
parent discussions and prescribe treatment and follow-up options (2018; A. H. Jobe &
Bancalari, 2017). Meeting the objective of a dynamic definition, adaptable to different
stages of the disease, requires flexibility in time-points of assessment according to the
goal of classification at each stage. Identification of simple tests that can be applied in
this dynamic fashion is key to achievement of these priorities. A tool that fulfils these
criteria could be used for benchmarking neonatal units across the world and for the
assessment of BPD in epidemiologic studies (Ehrenkranz et al., 2005).
2.4.2. A proposed new measure of the severity of BPD at the parenchymal
level
Shift of the oxyhaemoglobin dissociation curve addresses many of the desired features
of a new definitive test for the presence and severity of BPD. Shift was first measured
by Smith and Jones in neonates with pulmonary failure (Smith et al., 2001). Shift is a
continuous measure of pulmonary gas exchange capacity and can be assessed non-
invasively at any PMA (Jones et al., 2000; Lockwood et al., 2014; Sapsford et al.,
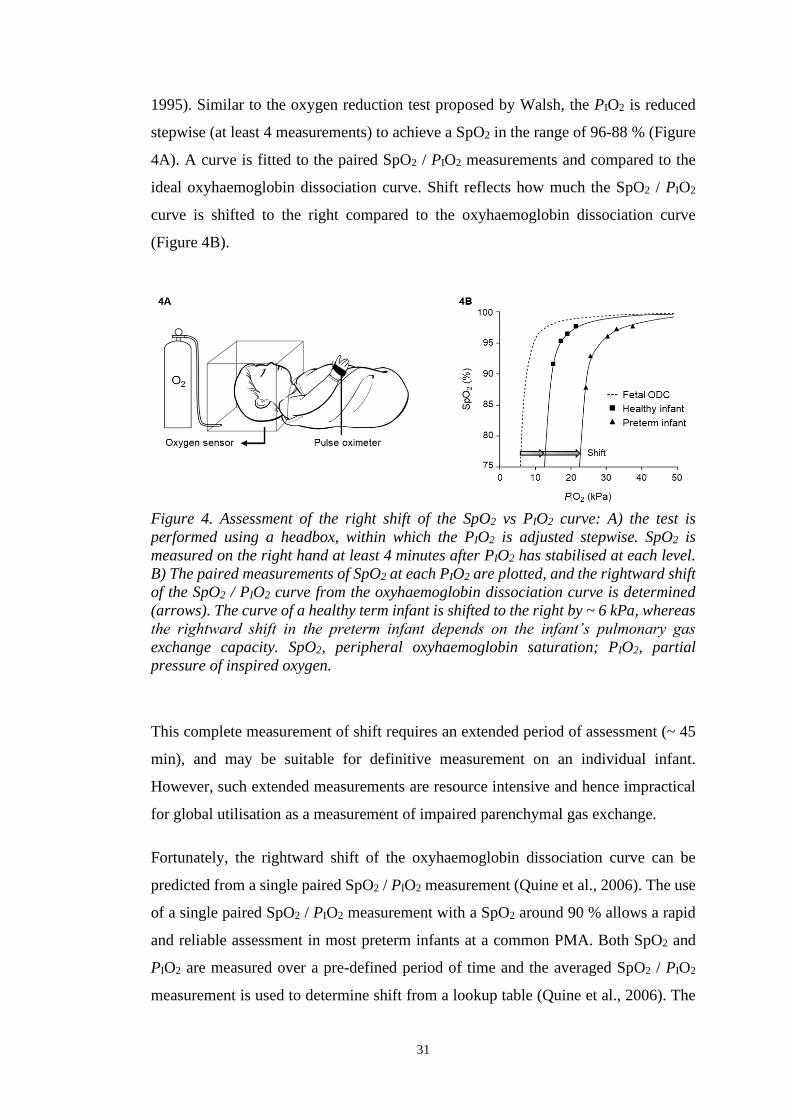
31
1995). Similar to the oxygen reduction test proposed by Walsh, the PIO2 is reduced
stepwise (at least 4 measurements) to achieve a SpO2 in the range of 96-88 % (Figure
4A). A curve is fitted to the paired SpO2 / PIO2 measurements and compared to the
ideal oxyhaemoglobin dissociation curve. Shift reflects how much the SpO2 / PIO2
curve is shifted to the right compared to the oxyhaemoglobin dissociation curve
(Figure 4B).
Figure 4. Assessment of the right shift of the SpO2 vs PIO2 curve: A) the test is
performed using a headbox, within which the PIO2 is adjusted stepwise. SpO2 is
measured on the right hand at least 4 minutes after PIO2 has stabilised at each level.
B) The paired measurements of SpO2 at each PIO2 are plotted, and the rightward shift
of the SpO2 / PIO2 curve from the oxyhaemoglobin dissociation curve is determined
(arrows). The curve of a healthy term infant is shifted to the right by ~ 6 kPa, whereas
the rightward shift in the preterm infant depends on the infant’s pulmonary gas
exchange capacity. SpO2, peripheral oxyhaemoglobin saturation; PIO2, partial
pressure of inspired oxygen.
This complete measurement of shift requires an extended period of assessment (~ 45
min), and may be suitable for definitive measurement on an individual infant.
However, such extended measurements are resource intensive and hence impractical
for global utilisation as a measurement of impaired parenchymal gas exchange.
Fortunately, the rightward shift of the oxyhaemoglobin dissociation curve can be
predicted from a single paired SpO2 / PIO2 measurement (Quine et al., 2006). The use
of a single paired SpO2 / PIO2 measurement with a SpO2 around 90 % allows a rapid
and reliable assessment in most preterm infants at a common PMA. Both SpO2 and
PIO2 are measured over a pre-defined period of time and the averaged SpO2 / PIO2
measurement is used to determine shift from a lookup table (Quine et al., 2006). The

32
current look-up table for shift from a single paired SpO2 / PIO2 measurement published
by Quine et al. in 2006 is based on the adult oxyhaemoglobin dissociation curve and
only allows determination of shift in infants with a SpO2 ≤94 % at a PIO2 21 kPa
(Quine et al., 2006). A look-up table for infants with SpO2 >94 %, independent of the
PIO2 is needed to avoid hypoxic testing for the determination of shift in infants
breathing room air.
The use of shift for objective assessment of the pulmonary parenchymal disruption in
BPD has at least five key advantages. 1) The single paired measurement of SpO2 and
PIO2 is a simple assessment with global applicability requiring minimal resources. 2)
Shift is independent of differences in oxygen prescribing policies across neonatal units
and is independent of altitude, as PIO2 reflects the FIO2 adjusted for altitude above sea
level, as exemplified in Table 4) Shift can be measured whilst preterm infants are on
invasive and non-invasive respiratory support, hence has potential to be used across
the evolution of BPD as a prospective determinant of BPD, as well as at more
traditional assessment time-points. The theoretical impact of ventilator pressures on
the calculation of shift are negligible compared to the impact of atmospheric pressure
at different altitudes. When respiratory support is maintaining airway patency, the shift
measurement will determine the gas exchange capacity of the parenchyma, rather than
the consequences of airway collapse. 4) As a continuous outcome measure, shift
potentially offers improved sensitivity for detection of change in disease severity at
both individual and population levels. 5) Finally, shift of the oxyhaemoglobin
dissociation curve offers a physiological assessment of BPD disease severity at the
parenchymal level and would therefore add valuable information to the current BPD
definitions.
Despite the apparent advantages of using shift of the SpO2 versus PIO2 curve for
equitable determination of parenchymal diseases severity, more research is required
before shift can be incorporated meaningfully into a future definition of BPD.
Research studies need to explore the impact of invasive and non-invasive ventilator
pressures and flows on the derived measures of shift and capacity for pulmonary gas
exchange (Iyer et al., 2016; Lampland et al., 2009). Reference values for different
respiratory support modes may be required. Short-term repeatability and reliability of
shift need to be assessed to identify its utility for tracking disease severity at the

33
individual level, and the long-term prognostic value of shift requires long-term follow-
up studies. Establishment of reference ranges for shift across the full range of PMA
and/or PNA could enable early identification of preterm infants with evolving severe
BPD who might benefit from novel and potentially life-saving interventions. Future
versions of the look-up table for the single paired measurement of SpO2 and PIO2 will
likely adjust shift values for fetal haemoglobin to facilitate more accurate estimation
of shift prior to term, and expand the table to include estimations of shift for infants
with SpO2 > 90 % when breathing air.
2.5. Conclusion
The current BPD definitions including the oxygen reduction test proposed by Walsh
lead to misclassifications of preterm infants with and without BPD, and do not allow
reliable prediction of adverse long-term pulmonary outcomes. Right shift of SpO2 /
PIO2 curve is a continuous objective variable of pulmonary gas exchange capacity that
is independent of oxygen prescribing policies across neonatal units and altitude.
Assessing pulmonary gas exchange capacity in preterm infants allows an improved
understanding of the underlying pathophysiology of BPD. However, BPD is most
likely a compound of cardiac complications, diseases of the conductive airways,
immaturity of the respiratory muscles and immature control of breathing. Similar
functional tests should aim to identify their respective contribution to BPD.
Nevertheless, the assessment of shift of the SpO2 / PIO2 curve could be used globally
for the assessment of disease severity in preterm infants with BPD. The simplified
assessment of shift from a single paired SpO2 / PIO2 measurement could be used as a
benchmarking tool for neonatal units and also as an outcome variable for clinical trials
investigating BPD in preterm infants.
2.6. Acknowledgements
We would like to thank Jane Choi for the help with the design of Figure 4.
34
CHAPTER 3
SIMPLIFIED BEDSIDE ASSESSMENT OF
PULMONARY GAS EXCHANGE IN VERY PRETERM
INFANTS AT 36 WEEKS’ POSTMENSTRUAL AGE
Preface:
We developed and validated a method to assess shift of the
oxyhaemoglobin saturation versus inspired oxygen pressure curve as a
marker of pulmonary gas exchange in preterm infants. The manuscript
entitled ‘Physiology and predictors of impaired gas exchange in infants
with bronchopulmonary dysplasia’ provides general knowledge on
pulmonary gas exchange and why a simplified assessment of pulmonary
gas exchange is needed.
We submitted this manuscript to Thorax in February 2020 and received
the reviewer comments in May 2020. The manuscript was resubmitted in
November 2020 and accepted for publication in January 2021. The final
version is embedded in the appendix A3.
35
3. SIMPLIFIED BEDSIDE ASSESSMENT OF
PULMONARY GAS EXCHANGE IN VERY PRETERM
INFANTS AT 36 WEEKS’ POSTMENSTRUAL AGE
Benjamin Stoecklin MDa,b,c*, Y. Jane Choia*, Abhijeet Rakshasbhuvankar FRACPa,b,
Jenny Svedenkrans MDd,e, J. Gareth Jones MDf, J. Jane Pillow PhD a,b
Affiliations:
a School of Human Sciences, University of Western Australia, Perth, Australia;
b King Edward Memorial Hospital, Perth, Australia;
c Department of Neonatology, University Children’s Hospital Basel (UKBB), Basel,
Switzerland
d Department of Clinical Science, Intervention and Technology, Division of
Paediatrics, Karolinska Institutet, Stockholm, Sweden;
e Department of Neonatal Medicine, Karolinska University Hospital, Stockholm,
Sweden;
f University Department of Anaesthesia, Addenbrookes Hospital, Cambridge, United
Kingdom
*joint first author
Corresponding author: Benjamin Stoecklin, Department of Neonatology, University
Children’s Hospital Basel (UKBB), Spitalstrasse 33, 4056 Basel, Switzerland.
Word count: 2766

36
3.1. Abstract
3.1.1. Introduction
Rightward shift of the oxyhaemoglobin saturation versus inspired oxygen pressure
curve is a marker of pulmonary gas exchange. Shift can be predicted from a single
paired oxyhaemoglobin saturation versus inspired oxygen pressure measurement. We
aimed to develop and validate a prediction table for shift based on fetal haemoglobin,
applicable across different altitudes and across the severity spectrum of
bronchopulmonary dysplasia.
3.1.2. Methods
Very preterm infants had an oxygen reduction test at 36 weeks’ postmenstrual age.
Shift was derived from at least three paired oxyhaemoglobin saturation versus inspired
oxygen pressure measurements. Resultant values referenced to fetal haemoglobin
were regressed linearly to calculate the prediction table. The table was validated in a
second infant cohort using Bland-Altman analysis.
3.1.3. Results
The table was established from 219 infants at a median (IQR) 354 (345 – 360) weeks’
postmenstrual age. Linear regression showed Shift=48.6-SpO2*0.4 in infants
breathing room air. The table was validated against 63 infants at a median (IQR) 360
(356 – 362) weeks’ postmenstrual age. Mean difference (95 % CI) between the
predicted and measured shift was 2.1 (-0.8, 4.9) % with wide limits of agreement (-
20.7 %, 24.8 %).
3.1.4. Discussion
Shift predicted from a single paired oxyhaemoglobin saturation versus inspired
oxygen pressure measurement is accurate at a population but not individual level. Our
prediction table offers a simple, continuous outcome measure of pulmonary gas
exchange across the severity spectrum of neonatal lung disease useful for clinical
benchmarking and as a continuous outcome measure for clinical trials.
37
Key Messages
What is the key question? Can a single paired oxyhaemoglobin saturation (SpO2) vs.
inspired oxygen pressure (PIO2) measurement predict the rightward shift of the SpO2
vs. PIO2 curve as a severity measure for bronchopulmonary dysplasia (BPD).
What is the bottom line? Our observational study established and validated a table
that predicts shift of the SpO2 vs PIO2 curve accurately at a population level from a
single paired SpO2 and PIO2 measurement in very preterm infants.
Why read on? The simple, globally applicable prediction table for rightward shift of
the SpO2 vs PIO2 curve facilitates simple and equitable bedside assessment of BPD
severity, and a sensitive and specific clinical outcome measure.

38
3.2. Introduction
Bronchopulmonary dysplasia (BPD) is characterised by impaired development of
alveoli and pulmonary capillaries. The cardinal feature of BPD is impaired pulmonary
gas exchange. A continuous measure of pulmonary gas exchange impairment is
essential for benchmarking purposes and as an outcome for clinical research studies
(Hines et al., 2017; A. H. Jobe et al., 2019). However, the traditional measures of
pulmonary gas exchange are either technically difficult (A-a nitrogen difference), or
impossible such as the multiple inert gas elimination technique (MIGET) in infants
(Corbet et al., 1975; Hand et al., 1990; Roca et al., 1994). Assessment of rightward
shift of the oxyhaemoglobin saturation (SpO2) vs. inspired oxygen pressure (PIO2)
curve relative to the oxyhaemoglobin dissociation curve (ODC) has transformed the
assessment of BPD severity by providing a sensitive and non-invasive measure of
impaired pulmonary gas exchange across the full spectrum of BPD severity
(Svedenkrans et al., 2019a). Moreover, shift of the SpO2 vs. PIO2 can be assessed daily
to monitor pulmonary gas exchange (Smith & Jones, 2001).
The PIO2 vs. SpO2 curve is constructed by a simultaneous measurement of SpO2 and
PIO2 while PIO2 is changed stepwise (Jones & Jones, 2000; Lockwood et al., 2014;
Quine et al., 2006; Rowe et al., 2010). Using the oxyhaemoglobin dissociation curve
(ODC) as a reference, a reduced VA/Q is reflected by rightward shift of the SpO2 vs.
PIO2 curve as the PIO2 – PaO2 gradient increases (Quine et al., 2006; Sapsford &
Jones, 1995). Increased right-to-left shunt moves the curve downwards. Rightward
shift is highly correlated with the PIO2 required to achieve a SpO2 of 90 %, whereas
shunt is less well correlated with this endpoint (Quine et al., 2006). Healthy adults
have a rightward shift of approximately 6 kPa due to the carbon dioxide in the alveolus
and R, the gas exchange ratio (PCO2/R) (Jones & Jones, 2000). Shift in term infants
measured at day three of life is equal to 5.5 kPa (Dassios et al., 2017).
A comprehensive shift test involves multiple paired measurements of SpO2 and PIO2,
which often necessitates use of hypoxic gas mixtures to test infants breathing air. As
such, the comprehensive test is unsuitable for wide-scale implementation in routine
clinical practice (Jones et al., 2015; Kjaergaard et al., 2003; Quine et al., 2006; Rowe
et al., 2010; Sapsford & Jones, 1995) (Figure 5). However, rightward shift of the SpO2
vs. PIO2 curve was successfully derived from a single paired measurement of SpO2
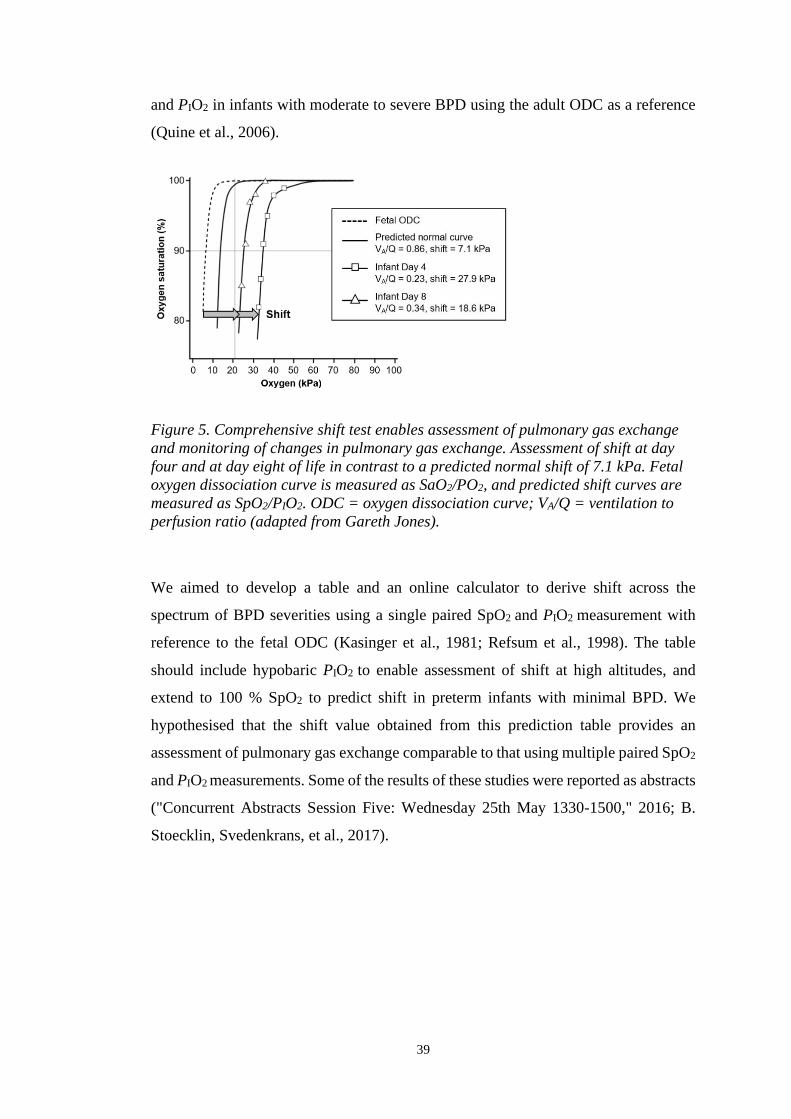
39
and PIO2 in infants with moderate to severe BPD using the adult ODC as a reference
(Quine et al., 2006).
Figure 5. Comprehensive shift test enables assessment of pulmonary gas exchange
and monitoring of changes in pulmonary gas exchange. Assessment of shift at day
four and at day eight of life in contrast to a predicted normal shift of 7.1 kPa. Fetal
oxygen dissociation curve is measured as SaO2/PO2, and predicted shift curves are
measured as SpO2/PIO2. ODC = oxygen dissociation curve; VA/Q = ventilation to
perfusion ratio (adapted from Gareth Jones).
We aimed to develop a table and an online calculator to derive shift across the
spectrum of BPD severities using a single paired SpO2 and PIO2 measurement with
reference to the fetal ODC (Kasinger et al., 1981; Refsum et al., 1998). The table
should include hypobaric PIO2 to enable assessment of shift at high altitudes, and
extend to 100 % SpO2 to predict shift in preterm infants with minimal BPD. We
hypothesised that the shift value obtained from this prediction table provides an
assessment of pulmonary gas exchange comparable to that using multiple paired SpO2
and PIO2 measurements. Some of the results of these studies were reported as abstracts
("Concurrent Abstracts Session Five: Wednesday 25th May 1330-1500," 2016; B.
Stoecklin, Svedenkrans, et al., 2017).
40
3.3. Methods
The study was conducted in two phases. Firstly, we derived a prediction table for shift
of the SpO2 vs. PIO2 curve based on data analysed from infants enrolled in an
observational study (ACTRN12613001062718). Secondly, the prediction table was
validated in a separate cohort of infants, enrolled in a randomised controlled trial
(ACTRN12616000408482). The only difference in the enrolment criteria of the two
studies was the gestational age. Infants enrolled in the observational study were born
< 32 weeks’ gestation, whereas infants enrolled in the randomised controlled trial were
born < 28 weeks’ gestation. Infants with congenital malformations were excluded
from the studies. Written informed consent for assessment of pulmonary gas exchange
was obtained for each infant as part of the respective study. Each clinical study
received ethics approval from the Women and Newborn Health Service Human
Research Ethics Committee (HREC: 1883EW and 20130193EW respectively) and the
University of Western Australia (RA/3/1/5942 and RA/4/1/426, respectively). Studies
were conducted in the Neonatal Clinical Care Unit at the King Edward Memorial
Hospital in Perth, Western Australia.
3.3.1. Development of the prediction table:
Infants (n = 219) contributing gas exchange data to the development of the prediction
table were recruited between the 21st of July 2013 and the 8th of January 2017 as
described (Svedenkrans et al., 2019a). We assessed rightward shift of the SpO2 vs.
PIO2 curve by the comprehensive shift test recording multiple paired SpO2 vs. PIO2
measurements (Svedenkrans et al., 2019a). Shift of the SpO2 vs. PIO2 curve relative to
the fetal oxyhaemoglobin dissociation curve was derived using an algorithm
(Lockwood et al., 2014).
Shift values in the prediction table were calculated using a series of linear regressions.
The equation derived from shift versus the required PIO2 to achieve a SpO2 range of
86 – 94 % was used to calculate shift at a given PIO2. Subsequently, the shift values
in the table were calculated from the equation of shift at a given PIO2 versus the
measured SpO2. A detailed description of the methodology is shown in the online
supplement.
41
3.3.2. Validation of the prediction table:
The prediction table based on the fetal ODC was validated using data collected from
a separate group of extremely preterm infants. These infants had both the 15-minute
bedside assessment (single paired average SpO2 and PIO2) with shift estimated from
our prediction table, and a comprehensive shift test (multiple paired SpO2 and PIO2)
with shift of the SpO2 vs. PIO2 curve estimated using the computer algorithm as
described above. Preterm infants were eligible for the validation study if they were 1)
born at King Edward Memorial Hospital; 2) enrolled in a randomised controlled trial
using shift as an outcome variable; 3) not enrolled in the cohort of infants used to
calculate the table; and 4) had a 15-minute bedside single paired SpO2 and PIO2
measurement within 7 days of the comprehensive shift test without a change in the
respiratory support or PIO2 in the intervening period. Infants participating in the
validation study were recruited between 7th January 2016 and 5th April 2018.
A Bland-Altman plot was used to quantify the agreement between the 15-minute
bedside assessment and the comprehensive shift test. The data are presented as a
percentage difference plot with 95 % confidence intervals of the mean bias and the
limits of agreement. Acceptable limits of agreement were defined a priori as ± 20 %
of the mean shift value.
3.3.3. Study size and potential source of bias
The prediction table for shift is based on 219 very preterm infants enrolled in a
prospective observational study. For the validation study we aimed to recruit a
minimum of 60 extremely preterm infants who were also enrolled in a randomised
controlled trial (ACTRN12616000408482). The data from both studies were analysed
twice by two independent investigators, and reanalysed a third time by both
investigators together in case of discrepancy in the results.
3.3.4. Statistical methods
Study data were collected and managed using Research Electronic Data Capture
(REDCap) software hosted at the University of Western Australia (Paul A. Harris et
al., 2009). The prediction table for shift was calculated from linear regression of data
obtained from the observational cohort (n = 219). Shift values calculated from the

42
prediction table using the 15-minute bedside single paired SpO2 vs. PIO2 were
compared against the comprehensive shift test using a Bland-Altman plot. Data were
analysed statistically using SPSS software (v25, IBM, USA). A p-value < 0.05 was
considered significant. Descriptive statistics are reported as mean and standard
deviation (SD) for parametric data and median and interquartile range (IQR) for non-
parametric data.

43
3.4. Results
The recruitment process and the demographic and clinical characteristics of the study
population used for the development of the prediction table were described previously
(Svedenkrans et al., 2019a). Infants were tested at a median (IQR) age of 354 (345 –
360) w PMA. The baseline characteristics of the 219 infants enrolled in the
observational study are reported in Table 5 alongside characteristics of the infants
enrolled in the validation study.
Table 5. Summary characteristics of both cohorts of infants.
Primary
Cohort
n = 219
Validation
Cohort
n = 63
p - value
Male n (%) 138 (63.0) 32 (48.5) 0.035
Gestational age (w) 27.9 (3.6) 26.6 (2.0) < 0.0005
Birth weight (kg) 1.07 0.3 0.86 0.2 < 0.0005
PMA at test (w) 35.4 (1.3) 36.0 (0.5) < 0.0005
Weight at test (kg) 2.3 0.4 2.5 0.4 0.019
Haemoglobin at test (g/dl) 10.6 1.8 10.7 1.2 0.602
Mechanical ventilation (d) 0.6 (4.9) 2.3 (11.0) < 0.0005
Non-invasive ventilation (d) 43.3 (53.5) 60.3 (18.9) < 0.0005
Duration oxygen therapy (d) 5.0 (56.2) 44.2 (60.9) < 0.0005
Bronchopulmonary dysplasia n (%) 86 (39) 38 (60) 0.003
Summary characteristics of infants born at King Edward Memorial Hospital,
between 7th January 2016 and 5th April 2018 who had both the comprehensive
shift test and 15-minute bedside assessment. Results are shown as median (IQR) or
mean SD. The primary cohort refers to the very preterm infants, whose data
were used for the calculation of the table. The validation cohort refers to the
extremely preterm infants enrolled for validation of the table. PMA –
postmenstrual age

44
The accuracy of predicted shift depends on the position of the single SpO2 vs. PIO2
measurement on the oxyhaemoglobin dissociation curve. Measurements with SpO2
values > 94 % are located close to the plateau of the curve, whereas measurements
with SpO2 values < 94 % are located on the steep part of the curve. The coefficient of
determination (R2) between shift and SpO2 decreases at higher SpO2 levels, leading to
an inherent fall in the prediction accuracy of shift. All values in Table 6 are derived
from infants breathing room air at sea level (PIO2 = 20 kPa). PIO2 = FiO2 x (barometric
pressure – saturated water vapour pressure), therefore FiO2 0.21 is equal to 20 kPa
PIO2.
3.4.1. Prediction table for shift
The prediction table for the estimation of shift derived from the fetal oxyhaemoglobin
dissociation curve is reported in Table 7. A single individual shift calculator and a bulk
calculator are provided in the supplementary material of this manuscript.
Table 6. Shift dependent on SpO2 in infants breathing room air at sea level (PIO2
= 20 kPa).
SpO2 (%) in air (20 kPa) Shift (kPa) R2 p-value
86 14.4 0.99 < 0.0001
88 13.3 0.98 < 0.0001
90 12.7 0.97 < 0.0001
92 12.1 0.92 < 0.0001
94 11.2 0.83 < 0.0001
96 10.3 0.75 < 0.0001
98 9.5 0.63 < 0.0001
R2 – coefficient of determination

45
Table 7. Prediction table for shift from a single paired SpO2 vs. PIO2 measurement.
SpO2 (%)
PIO2
(kPa) 85 86 87 88 89 90 91 92 93 94 95 96 97 98 99 100
14 8.3 8.2 8.1 8.0 7.9 7.8 7.7 7.6 7.5 7.3
15 9.4 9.2 9.1 8.9 8.8 8.6 8.4 8.3 8.1 8.0 7.8
16 10.3 10.1 10.0 9.8 9.7 9.5 9.4 9.2 9.0 8.9 8.7 8.6
17 11.4 11.2 11.0 10.7 10.5 10.3 10.1 9.9 9.7 9.5 9.2 9.0 8.8
18 12.5 12.2 11.9 11.7 11.4 11.1 10.9 10.6 10.3 10.0 9.8 9.5 9.2 9.0
19 13.6 13.3 12.9 12.6 12.3 11.9 11.6 11.3 10.9 10.6 10.3 9.9 9.6 9.3 8.9
20 14.7 14.3 13.9 13.5 13.1 12.7 12.3 11.9 11.5 11.1 10.7 10.3 9.9 9.5 9.1 8.7
21 15.7 15.3 14.9 14.4 14.0 13.6 13.1 12.7 12.3 11.8
22 16.8 16.3 15.8 15.3 14.9 14.4 13.9 13.4 12.9 12.4
23 17.9 17.3 16.8 16.3 15.7 15.2 14.7 14.1 13.6 13.0
24 19.0 18.4 17.8 17.2 16.6 16.0 15.4 14.8 14.2 13.7
25 20.0 19.4 18.8 18.1 17.5 16.8 16.2 15.5 14.9 14.3
26 21.1 20.4 19.7 19.0 18.3 17.6 16.9 16.3 15.6 14.9
27 22.2 21.4 20.7 20.0 19.2 18.5 17.7 17.0 16.2 15.5
28 23.3 22.5 21.7 20.9 20.1 19.3 18.5 17.7 16.9 16.1
29 24.4 23.5 22.6 21.8 20.9 20.1 19.2 18.4 17.5 16.7
30 25.4 24.5 23.6 22.7 21.8 20.9 20.0 19.1 18.2 17.3
Shaded shift values measured in room air (PIO2 = 20 kPa) > 97 SpO2 are estimates,
as every SpO2 > 97 % in room air is considered normal in healthy term infants. The
table does not provide predicted shift values for infants with SpO2 > 94 % whilst
requiring oxygen (PIO2 > 20 kPa), as the oxygen in these infants should be reduced
to achieve SpO2 closer to 90 % for a more accurate prediction of shift (extended
table with 95 % confidence intervals in the online supplement).
3.4.2. Validation of the prediction table
A total of 63 infants in the validation cohort underwent both the 15-minute bedside
assessment and the comprehensive shift test. Median (range) date difference between
the two tests was 0 (- 5.0 – 3.0) days. Summary characteristics of preterm infants
enrolled in the validation study and significant differences between infants enrolled in
the observational study compared to the validation study are shown in Table 5.
The linear correlation between shift derived from the 15-minute bedside assessment
and shift assessed by the comprehensive test was statistically significant (R2 = 0.83, p

46
< 0.0001) (Figure 6). Bland-Altman analysis showed a non-significant mean bias (95
% CI) between the 15-minute bedside assessment and the comprehensive shift test of
0.24 (-0.13, 0.61). The limits of agreement extended from -2.68 to 2.92, which just
exceeded our prespecified acceptable limits of agreement of ± 20 %. (Figure 7).
Figure 6. Scatter plot: shift assessed by the 15-minute test dependent on shift assessed
by the comprehensive test. R2 = 0.83; p < 0.0001.
Figure 7. Plot of differences between the 15-minute bedside assessment and the
comprehensive shift test, expressed as percentage difference from the mean of two
tests. Each open circle denotes a single infant. Solid black line = mean; dotted line =
95 % CI of the mean; dashed line = limits of agreement (1.96 SD).
47
3.5. Discussion
Impaired pulmonary gas exchange is the fundamental disorder in infants with BPD.
Gas exchange can be assessed on a daily basis in a non-invasive and quantitative
manner (Dassios et al., 2015; Jones & Jones, 2000; Quine et al., 2006; Svedenkrans et
al., 2019a). In contrast, BPD definitions based on oxygen dependency are a qualitative
assessment of the disease. Different qualitative BPD definitions are currently used in
neonatal units and as endpoints in clinical trials (Hines et al., 2017). The use of
different definitions makes it difficult to benchmark neonatal units, to compare
interventional clinical trial outcomes and to interpret study results (Hines et al., 2017).
We showed that VA/Q measured from multiple paired samples of SpO2 and PIO2 is
reflected by the degree of rightward shift of the SpO2 vs. PIO2 curve and can be
predicted from a single paired SpO2 vs. PIO2 measurement (Svedenkrans et al., 2019a).
We developed a prediction table and an online calculator for shift of the SpO2 vs. PIO2
curve. The prediction table enables bedside assessment of pulmonary gas exchange in
preterm infants. The table is applicable across the full spectrum of BPD severity, can
be used equitably in neonatal units at differing altitudes and is based on fetal
haemoglobin. The PIO2 range of the table extends from as low as 14 kPa to 95 kPa.
The extension to as low as 14 kPa enables estimation of shift from the prediction table
in infants breathing room air up to an altitude of 3 000 m above sea level (Baillie,
2010; B. Stoecklin et al., 2018). For an example, 0.21 FIO2 (room air) is equal to 15.6
kPa PIO2 in a neonatal unit in Mexico City at 2 250m altitude. Conversely, a FIO2 of
1.0 is equal to 95 kPa PIO2 at sea level, hence the upper limit of 95 kPa PIO2 in the
prediction table.
The shift values in our table are based on the fetal ODC as a reference. The switch
from fetal to adult haemoglobin occurs around 42 – 44 weeks independent of the
infant’s gestational age (Refsum et al., 1998) or number of prior blood transfusions
(Bard et al., 1982; Berglund et al., 2014; Shiao et al., 2006). The use of fetal
haemoglobin as the reference is justified further in the online supplement.
Validation of the table showed no bias and no mean difference between shift values
estimated from the prediction table and shift values derived from the comprehensive
shift test, indicating that the prediction table is useful for assessing pulmonary gas

48
exchange at a population level. However, the limits of agreement exceeded the
predefined criterion of ± 20 %. The ± 20 % acceptability criterion for the Bland-
Altman analysis was based on the fall in prediction accuracy of shift at SpO2 levels >
94 % (as shown in Table 6), and on the accuracy of the SpO2 probe (± 3 %) and the
portable oxygen sensor (± 2 %). Bland-Altman limits of agreement exceeding the
prespecified ± 20 % acceptability criterion indicate that a single measure of shift
derived from the prediction table is not an accurate measure of pulmonary gas
exchange at the individual level. Even though the 15-minute bedside assessment of
shift does not allow assessment of right-to-left shunt, we could rule out shunt as an
explanatory factor for the wide limits of agreement. Nevertheless, as the limits of
agreement were close to the predefined acceptable limits, future refinements to the
method might improve the prediction of shift at an individual level. The 15-minute
test remains useful at an individual level for an objective screening and identification
of infants who may benefit from subsequently undergoing a comprehensive shift test.
The SpO2 at which shift of the SpO2 vs. PIO2 curve was predicted is key to
understanding these wide limits of agreement. A single point measurement on the
plateau of the curve (i.e., high SpO2) can have multiple solutions at the steep part of
the curve (Quine et al., 2006) (Figure 5). Predicted shift values from SpO2 > 94 %
when breathing room air are therefore only estimates, and require a comprehensive
shift test to more accurately assess shift.
Preterm infants with shift values > 20 kPa may also benefit from the comprehensive
measurement of shift using a headbox (Svedenkrans et al., 2019a). The comprehensive
measurements of shift using a headbox provides additional information including
assessment of right-to-left shunt, VA/Q and the possibility of identifying the presence
of multiple gas exchange compartments in the lung (Jones et al., 2015). Hence,
undertaking a comprehensive shift test would provide more accurate evaluation of
pulmonary gas exchange for the effect of treatment, future prognosis and planning of
clinical follow-up at an individual level (Svedenkrans et al., 2019a).
The strengths of our study include the large sample size, the reflection of the whole
spectrum of BPD severity, adjustment for altitude in the predicted shift values and the
use of developmentally appropriate fetal haemoglobin as a reference. In contrast to the
comprehensive test, our prediction table for shift allows clinicians to assess pulmonary
49
gas exchange impairment from a simple bedside assessment using widely accessible
SpO2 monitoring, without the need of hypobaric testing in preterm infants at 36 w
PMA. Paired measurements of SpO2 vs. PIO2 can be taken bedside by any health care
provider at any time of the day to promote benchmarking of neonatal respiratory
outcomes after preterm birth.
A limitation of our study is that shift values derived from a single paired SpO2 vs. PIO2
measurement using the prediction table are less accurate at an individual level. The
accuracy decreases especially in infants with SpO2 > 94 %. We also validated our
prediction table with a slightly more immature group of preterm infants than used for
the development of the prediction table. Moreover, the infants of the validation study
were four days older at test compared to the infants measured for the table
development (36 w PMA vs. 35.4 w PMA). However, shift values do not decrease
significantly between 35 w and 36 w PMA (Svedenkrans et al., 2019a).
The use of different BPD definitions in clinical trials makes the interpretation and the
comparison between the trials difficult. In contrast to the qualitative assessments of
BPD, we and other groups showed previously how pulmonary gas exchange and BPD
severity can be assessed in a quantitative manner. Simultaneous measurements of
SpO2 and PIO2 enable quantification of pulmonary gas exchange. However, the
comprehensive test requires multiple measurements of SpO2 and PIO2 and is therefore
not suitable for daily clinical practice.

50
3.6. Conclusion and future directions
Rightward shift of the SpO2 vs. PIO2 curve relative to the oxyhaemoglobin
dissociation curve provides a non-invasive, and continuous population level outcome
measure for pulmonary gas exchange in infants across the spectrum of BPD severity.
Our prediction table for shift is based on fetal haemoglobin as appropriate for < 42 w
GA and is therefore suited for the assessment of pulmonary gas exchange at 36 w
PMA. The prediction table is deliberately limited to 85 – 94 % SpO2 (except for 20
kPa) reflecting less accurate prediction of shift at SpO2 > 94 %. Further research is
required to evaluate whether our method can be refined. The 15- minute bedside
assessment allows accurate prediction of shift in preterm infants at a population level.
Therefore, the bedside assessment is suitable as a benchmarking tool for assessing
pulmonary gas exchange in infants with BPD across neonatal intensive care units, as
well as for assessing treatment outcomes of clinical interventions in large randomised
controlled trials.
3.7. Acknowledgements
The authors would like to acknowledge the research nurses Natasha Mackay-Coghill
and Amanda Woods, as well as all the included infants and their parents. We
acknowledge Dr Patricia Woods for the coordination of the ANZNN shift test at the
King Edward Memorial Hospital.
3.7.1. Funding source
All phases of this study were supported by the University of Western Australia and
the Women and Newborn Health Service of Western Australia. Funded by National
Health and Medical Research Council (NHMRC) of Australia (GNT1047689,
GNT1057514) and the Metropolitan Health Research Infrastructure Fund (MHRIF).
Dr Stoecklin was supported by the Swiss National Science Foundation
(P2BSP3_158837) and a Research Training Program scholarship, The University of
Western Australia. Dr Svedenkrans was supported by The Swedish Society of
Medicine, The Samaritan Foundation, The Princess Lovisa Memory Foundation, The
Society of Child Care (Sällskapet Barnavård), and The Fernstrom Foundation. Prof
Pillow was supported by a NHMRC Senior Research Fellowship (RF1077691).

51
CHAPTER 4
DIAPHRAGM FUNCTION IN VERY PRETERM
INFANTS AT 36 WEEKS’ POSTMENSTRUAL AGE
Preface:
Preterm infants with bronchopulmonary dysplasia have impaired
pulmonary gas exchange and often exhibit laboured breathing during
quiet sleep. Data on diaphragmatic contractility and work of the
diaphragm in preterm infants during quiet sleep are scarce. We
investigated diaphragm function in 182 very preterm infants at 36
weeks’ postmenstrual age.
This manuscript will be submitted to Pediatric Pulmonology in August
2020.

52
4. DIAPHRAGM FUNCTION IN VERY PRETERM
INFANTS AT 36 WEEKS’ POSTMENSTRUAL AGE
*Benjamin Stoecklin MD a,b, *Zeena Al-Obaidi c, Jenny Svedenkrans PhD b,d, Gavin
Pinniger a, J. Jane Pillow PhD a,b,g
Affiliations:
aSchool of Human Sciences, University of Western Australia, Perth, Australia;
bNeonatal Clinical Care Unit, King Edward Memorial Hospital, Perth, Australia;
cMedical School, University of Western Australia, Perth, Australia;
dDepartment of Clinical Science, Intervention and Technology, Division of
Pediatrics, Karolinska Institutet, Stockholm, Sweden;
eDepartment of Neonatal Medicine, Karolinska University Hospital, Stockholm,
Sweden;
g Telethon Kids Institute, Perth, Western Australia
*joint first authors
Funding sources: All phases of this study were supported by the University of
Western Australia and the Women and Newborn Health Service of Western
Australia. Funded by National Health and Medical Research Council (NHMRC) of
Australia (GNT1047689, GNT1057514) and the Metropolitan Health Research
Infrastructure Fund (MHRIF). Dr Stoecklin was supported by the Swiss National
Science Foundation (P2BSP3_158837) and a Research Training Program
scholarship, The University of Western Australia. Dr Svedenkrans was supported by
The Swedish Society of Medicine, The Samaritan Foundation, The Princess Lovisa
Memory Foundation, The Society of Child Care (Sällskapet Barnavård), and The
Fernstrom Foundation. Prof Pillow was supported by a NHMRC Senior Research
Fellowship (RF1077691).
Corresponding author: Benjamin Stoecklin, Department of Neonatology,
University Children’s Hospital Basel (UKBB), Spitalstrasse 33, 4056 Basel.
Switzerland.
Phone: +41 61 704 12 12. [email protected]
Key words: prematurity, bronchopulmonary dysplasia, respiratory muscle function
Running title: Diaphragm function in very preterm infants
Word Count: 3495

53
4.1. Abstract
4.1.1. Objectives
Understanding how bronchopulmonary dysplasia and adverse antenatal and postnatal
exposures influence diaphragm function in very preterm infants.
4.1.2. Working hypothesis
We hypothesized that diaphragm function during spontaneous breathing is impaired
in infants with bronchopulmonary dysplasia (BPD). Moreover, we hypothesised that
diaphragm function is influenced by adverse antenatal and postnatal exposures.
4.1.3. Methodology
Diaphragm function was assessed in a single centre, prospective observational study
in very preterm infants. Infants were assessed during quiet sleep at 36 weeks’
postmenstrual age (PMA). Respiratory flow and transdiaphragmatic pressure (Pdi)
were measured. Transdiaphragmatic pressure was normalized to tidal volume
(Pdi/VT). Diaphragmatic work of breathing per minute was calculated from the
inspiratory pressure time integral (PTIdi) and respiratory rate. Factors predictive for
each outcome were identified from multivariable regression. BPD was assessed using
the NIH classification 2001.
4.1.4. Results
Very preterm infants (n=182) were measured at a median (IQR) 35.6 (1.3) weeks’
PMA. Pdi/VT was higher in infants with BPD (p=0.007) and PTIdi·min-1 lower
(p=0.022) compared to infants without BPD. Multivariable regression analysis
showed average early postnatal energy intake was a positive predictor for both Pdi/VT
(R2=0.12, p=0.007) and PTIdi·min-1 (R2=0.06, p=0.001). Birthweight Z score was a
negative predictor for Pdi/VT (R2=0.08, p<0.0001). Gestation, chorioamnionitis and
duration of mechanical ventilation did not contribute to the final model.
4.1.5. Conclusions
Infants with BPD exhibited improved diaphragm contractile force and lower
diaphragmatic work of breathing per minute compared to infants without BPD.

54
Diaphragmatic contractile function was increased by improved intrauterine growth.
Increased early postnatal nutritional energy content decreased diaphragmatic
contractile efficiency and increased diaphragmatic work of breathing.
4.2. Introduction
The diaphragm is the primary respiratory muscle responsible for generating and
maintaining the force needed for sufficient pulmonary gas exchange (Karisnan et al.,
2017; Poole et al., 1997). Diaphragm dysfunction is one of the suspected causes for
respiratory failure in preterm infants (Keens et al., 1978). Current understanding of
how antenatal and postnatal factors contribute to diaphragmatic dysfunction mostly
arises from animal models. These factors include the relatively hyperoxic environment
compared to the hypoxic in utero environment, infections, poor intrauterine and
postnatal growth, corticosteroid therapy and mechanical ventilation (Karisnan et al.,
2017; Lavin et al., 2013; Lewis et al., 1986; Prakash et al., 1993; Song et al., 2018;
Song, Karisnan, et al., 2013; Song, Pinniger, et al., 2013; Urs et al., 2018). Mechanical
ventilation, although life-saving, causes ventilator-induced diaphragmatic dysfunction
(VIDD) characterised by muscle atrophy and myofibril injury (Jaber, Jung, et al.,
2011; Sassoon et al., 2002; Vassilakopoulos et al., 2004). VIDD is described in
ventilated animals, and in ventilated adults and children (Jaber, Jung, et al., 2011;
Petrof et al., 2016; Powers et al., 2002; Vassilakopoulos & Petrof, 2004).
The preterm infant diaphragm has fewer slow-acting type I muscle term fibres
compared to the diaphragm of healthy term counterparts (Lavin et al., 2013). The
slow-acting type I muscle fibres prevent fatigue, resulting in better tolerance of
respiratory loads (Javen et al., 1996; Keens et al., 1978). Type I muscle fibres increase
with postmenstrual age (PMA), resulting in an increased type I : type II muscle fibre
ratio, with advancing postnatal maturation. Moreover, the immature muscle is
comprised predominantly of type IIA fibres, which are fast oxidative and relatively
fatigue resistant fibres, whereas the fatiguable type IIB and type IIX fibres typically
appear post-term (Song et al., 2014). Consequently, the different combinations of
muscle fibres in the preterm infants leads to a weaker but at the same time a more
fatigue resistant diaphragm (Lavin et al., 2013).

55
Few studies report on diaphragmatic function in premature infants, and existing
studies have low sample sizes (Bhat et al., 2016; Gabriel Dimitriou et al., 2003; G.
Dimitriou et al., 2001). No reported studies systematically analyse the contribution of
antenatal and postnatal factors to diaphragm function in very premature infants prior
to discharge home. Moreover, data comparing diaphragm function in infants with and
without bronchopulmonary dysplasia (BPD) are scarce. Bronchopulmonary dysplasia
is the most common respiratory complication after preterm birth and affects between
10 % and 25 % of all very preterm infants (Gortner et al., 2011). Infants with BPD
exhibit labored breathing and are often dependent on respiratory support for a
prolonged period of time. Duration of mechanical ventilation and gestational age are
the key predictors for the severity of BPD (Higgins et al., 2018; Poets et al., 2018).
Likewise, mechanical ventilation and gestational age play a key role in VIDD (Jaber,
Jung, et al., 2011). Therefore, logical extension of these findings suggests that infants
with BPD may have impaired diaphragmatic function.
Diaphragm function in infants can be assessed with different methods. Measurements
during tidal breathing, spontaneous crying or with phrenic nerve stimulation are
described in the literature (Gabriel Dimitriou et al., 2003; G. Dimitriou et al., 2001).
Key variables of interest are contractile force generated by the diaphragm, and
diaphragmatic work of breathing. Work of breathing is determined by the pressure and
volume characteristics of the respiratory system. The work performed by the
diaphragm and the accessory respiratory muscles must be sufficient to overcome the
elastic recoil of the chest wall and the tendency of the lungs to collapse. Moreover, the
force generated by the respiratory muscle is needed to overcome the resistance to
airflow. Work of breathing increases with increased resistance to airflow, decreased
compliance or with increased respiratory rate (Bader et al., 1955). We would therefore
expect higher work of breathing in sicker and/or more premature infants if the
distribution of work between the diaphragm and accessory muscles, and the muscle
fibre composition are the same.
We aimed to measure tidal volume (VT) and transdiaphragmatic pressure (Pdi), to
understand the efficiency of contractile force (Pdi normalized to tidal volume) and the
diaphragmatic work of breathing. Pdi and the diaphragmatic work were assessed

56
during tidal breathing in unsedated sleeping very preterm infants with and without
BPD at 36 w PMA.
Our primary hypothesis is that diaphragm function is impaired during spontaneous
breathing in infants with BPD. Moreover, our secondary hypothesis is that diaphragm
function in very preterm infants at 36 w PMA can be predicted from intrauterine
growth, gestational age, postnatal nutrition and duration of respiratory support.

57
4.3. Methods
4.3.1. Study design
We designed a prospective observational study to characterise transdiaphragmatic
pressure and diaphragmatic work of breathing in unsedated, very preterm infants. The
study was approved by the Women and Newborn Health Service Human Research
Ethics Committee (HREC:1883EW and 20130193EW) and the University of Western
Australia (RA/3/1/5942) in Perth, Western Australia.
4.3.2. Study infants and recruitment
Very preterm infants were recruited from the Neonatal Critical Care Unit at King
Edward Memorial Hospital for Women (KEMH) in Perth. Informed consent was
obtained from the parents prior to enrolment in the study.
Infants eligible for the study were born between 21st of July 2013 and 27th of January
2017 at < 32 weeks’ gestation. All included infants were part of the Preterm Infant
Functional and Clinical Outcomes (PIFCO) study (ACTRN12613001062718l).
Exclusion criteria were major congenital malformations and no parental consent. The
recruitment and study enrolment process are shown in Figure 8. Bronchopulmonary
dysplasia was defined as oxygen dependency > 28 days according to the NIH
definition published in 2001 (A. H. Jobe & Bancalari, 2001).
Study data were collected and managed using Research Electronic Data Capture
(REDCap) software hosted at The University of Western Australia. REDCap is a
secure, web-based application designed to support data capture for research studies
(Paul A. Harris et al., 2009).
4.3.3. Measurement of breathing pattern and diaphragm function
Measurements were obtained at 36 weeks’ PMA in unsedated infants assessed at least
30 minutes after the last feed, in a supine position, and during behaviourally
determined quiet sleep (Prechtl, 1974).
Airflow (mL/s) was measured using an ultrasonic flow meter (Exhalyser D,
EcoMedics, Duernten, Switzerland) attached to a silicone mask. The ultrasonic flow
58
meter was calibrated against the flow generated during 20 mL volume excursions
obtained at a rate of approximately 60 excursions/min using a calibration syringe
(5510 Series, Hans Rudolph Inc, USA). Tidal volume was derived from the integral
of the flow waveform. Respiratory rate was determined from the number of
breaths/minute.
Transdiaphragmatic pressure (Pdi) was recorded using a 2 F (0.67 mm) dual tipped
pressure transducer (Mikro-Tip® Transducer, Millar Instrumental Inc. Houston,
Texas/USA) with the pressure sensors spaced five centimetres apart. The distal
pressure sensor was placed in the stomach and the proximal pressure sensor in the
oesophagus. The pressure signals generated were recorded using the Powerlab data
acquisition system and displayed in real time on LabChart Pro® software. Forced
manoeuvres and phrenic nerve stimulation were not used.
Pdi was determined as the average waveform amplitude from a minimum of 10 breaths
during tidal breathing. Breaths with different inspiratory and expiratory volumes, sighs
and breaths during periodic breathing were excluded from the analysis. Pdi was
normalised to tidal volume to provide a relative measure of the efficiency of
diaphragm contractile force (Pdi/VT). The product of the respiratory rate and the
average breath-to-breath pressure time integral of the inspiratory transdiaphragmatic
pressure (PTIdi) was calculated as a proxy for the inspiratory diaphragmatic work
performed each minute (PTIdi·min-1).
4.3.4. Statistical analysis
Data were analysed within SPSS (v25·0·0·0; IBM Corp, USA). Parametric data are
presented as mean ± standard deviation (SD), non-parametric data as median and
interquartile range (IQR). Diaphragm function in infants with BPD and without BPD
was compared using Mann-Whitney U test. Potential predictive antenatal and
postnatal factors were assessed for collinearity using variance inflation factor. Factors
collinear with gestation were regressed against gestation, and the unstandardized
residuals were saved as the independent effect of each exposure. Univariate analysis
was performed to determine which of these antenatal and postnatal factors were
associated with efficiency of contractile force and diaphragmatic work of breathing.
Factors identified as significantly associated with the outcome variables (Pdi/VT and

59
PTIdi·min-1), were subjected to stepwise linear regression to identify the key
independent predictors of efficiency of diaphragmatic contractile force, and work of
breathing per minute. A p-value < 0.05 was considered statistically significant.
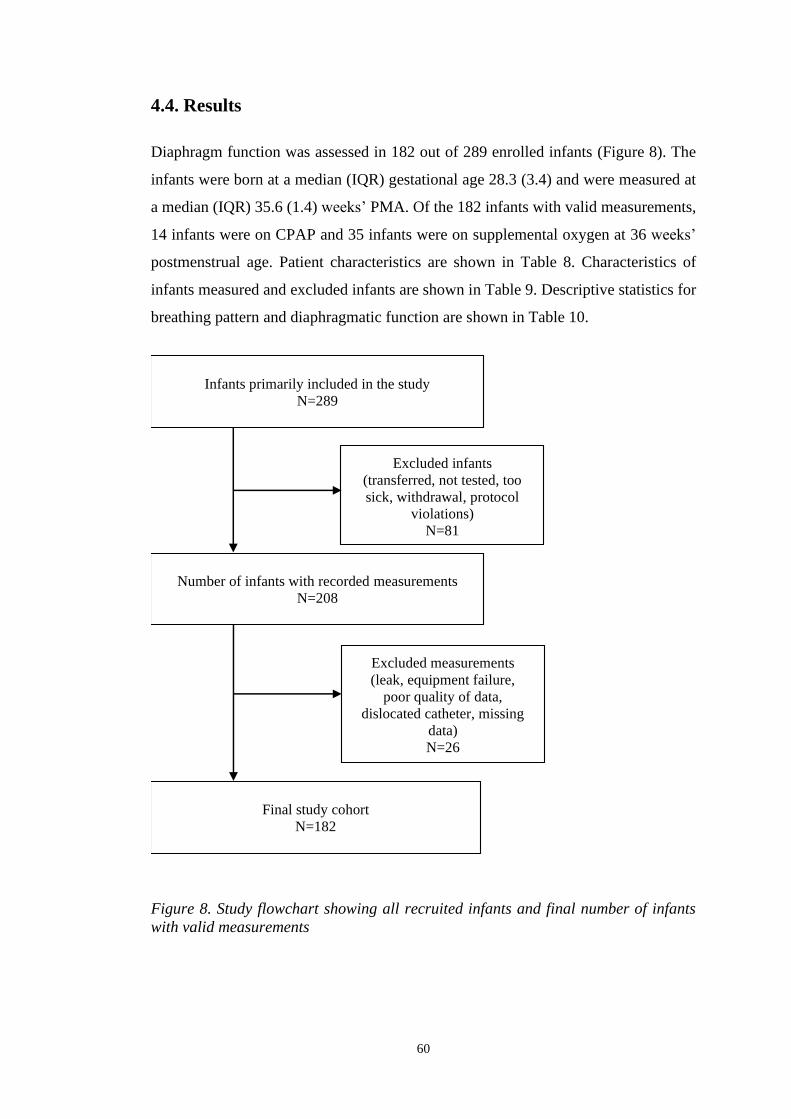
60
4.4. Results
Diaphragm function was assessed in 182 out of 289 enrolled infants (Figure 8). The
infants were born at a median (IQR) gestational age 28.3 (3.4) and were measured at
a median (IQR) 35.6 (1.4) weeks’ PMA. Of the 182 infants with valid measurements,
14 infants were on CPAP and 35 infants were on supplemental oxygen at 36 weeks’
postmenstrual age. Patient characteristics are shown in Table 8. Characteristics of
infants measured and excluded infants are shown in Table 9. Descriptive statistics for
breathing pattern and diaphragmatic function are shown in Table 10.
Figure 8. Study flowchart showing all recruited infants and final number of infants
with valid measurements
Infants primarily included in the study N=289
Excluded infants
(transferred, not tested, too
sick, withdrawal, protocol
violations) N=81
Final study cohort N=182
Number of infants with recorded measurements N=208
Excluded measurements
(leak, equipment failure,
poor quality of data,
dislocated catheter, missing
data)
N=26

61
Table 8. Perinatal characteristics of all measured infants.
all measured
infants n=182
no BPD
n=121
BPD
n=61
p-value (95 % CI), χ2
Male 110 (60.4) 73 (60.3) 37 (60.6) 0.966 (0.002)
Gestational age (w)* 28.3 (3.4) 29.3 (2.7) 25.1 (2.6) < 0.01 (-4.15, 3.00)
Age at test (d)* 53 (29) 40 (21) 74 (20) < 0.01 (-27.0, 36.0)
Postmenstrual age at test (w)* 35.6 (1.28) 35.1 (1.1) 36.1 (1.2) < 0.01 (-0.71, 1.28)
Birth weight (g)* 1050 (501) 1170 (483) 800 (258) < 0.01 (-464, -300)
Birth weight z-score 0.04 (± 0.85) -0.05 (± 0.81) 0.22 (± 0.89) 0.039 (0.01, 0.53)
36w PMA weight (g)* 2306 (666) 2215 (501) 2622 (497) < 0.01 (280, 528)
36w PMA weight z-score -0.69 (± 0.92) -0.80 (± 0.91) -0.46 (± 0.91) 0.026 (-0.04, 0.6)
36w PMA length (cm) 44.2 (± 2.2) 44.0 (± 2.2) 44.7 (± 2.1) 0.047 (0.01, 1.38)
36w PMA length z-score -0.95 (± 0.88) -0.88 (± 0.91) -1.13 (± 0.8) 0.079 (-0.51, 0.03)
Any maternal steroids 179 (97.3) 117 (96.7) 60 (98.4) 0.516 (0.422)
Choriamnionitis 97 (52.7) 56 (46.3) 40 (65.7) 0.014 (6.065)
Mechanical ventilation (d)* 1.0 (4.0) 0.0 (1.0) 12.0 (28.0) < 0.01 (6.0, 16.0)
Non-invasive ventilation (d)* 38.8 (52.0) 14.8 (38.0) 66.0 (22.5) < 0.01 (38, 51)
Supplemental oxygen (d)* 3.2 (46) 0.4 (3.1) 67.0 (55.9) < 0.01 (56, 76)
Any surfactant 131 (72.0) 70 (57.9) 61 (100) < 0.01 (35.72)
Any postnatal steroids 8 (4.4) 0 (0.0) 8 (14.3) < 0.01 (16.60)
Data are shown as mean (SD), *median (IQR) or n (%). BPD, bronchopulmonary dysplasia; χ 2, Chi-squares; w, weeks; d, days; g, gram;
cm, centimetres
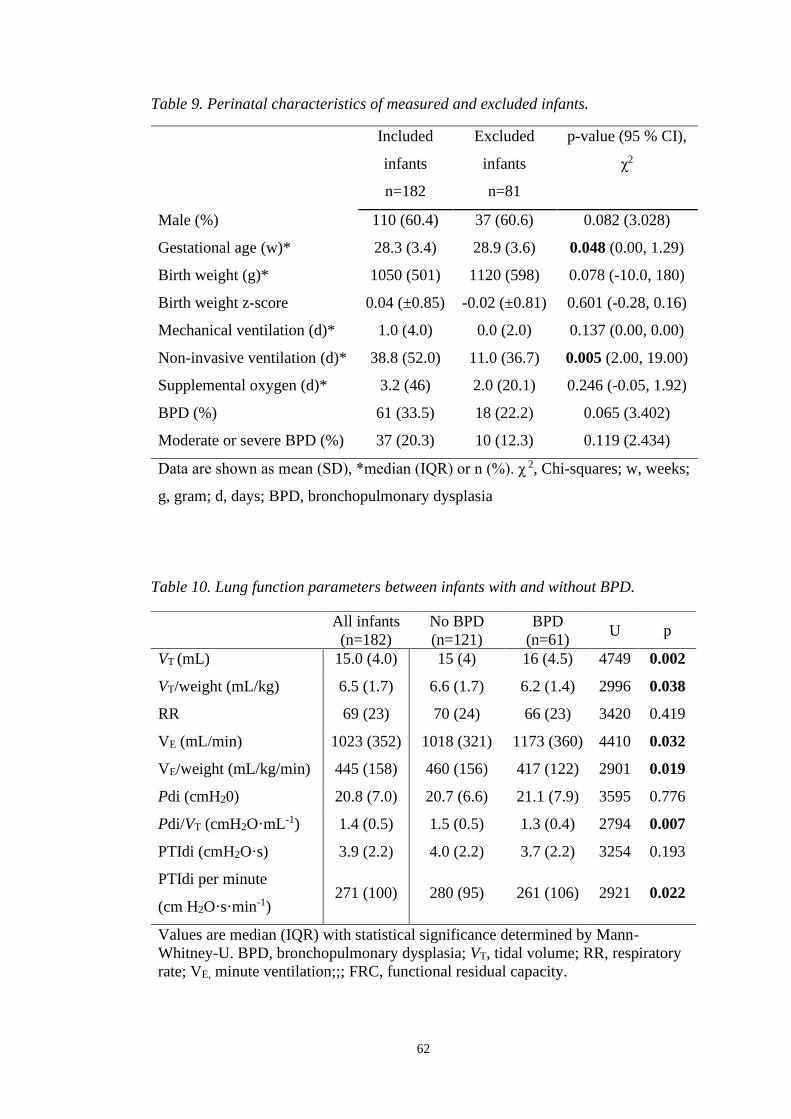
62
Table 9. Perinatal characteristics of measured and excluded infants.
Included
infants
n=182
Excluded
infants
n=81
p-value (95 % CI),
χ2
Male (%) 110 (60.4) 37 (60.6) 0.082 (3.028)
Gestational age (w)* 28.3 (3.4) 28.9 (3.6) 0.048 (0.00, 1.29)
Birth weight (g)* 1050 (501) 1120 (598) 0.078 (-10.0, 180)
Birth weight z-score 0.04 (±0.85) -0.02 (±0.81) 0.601 (-0.28, 0.16)
Mechanical ventilation (d)* 1.0 (4.0) 0.0 (2.0) 0.137 (0.00, 0.00)
Non-invasive ventilation (d)* 38.8 (52.0) 11.0 (36.7) 0.005 (2.00, 19.00)
Supplemental oxygen (d)* 3.2 (46) 2.0 (20.1) 0.246 (-0.05, 1.92)
BPD (%) 61 (33.5) 18 (22.2) 0.065 (3.402)
Moderate or severe BPD (%) 37 (20.3) 10 (12.3) 0.119 (2.434)
Data are shown as mean (SD), *median (IQR) or n (%). χ 2, Chi-squares; w, weeks;
g, gram; d, days; BPD, bronchopulmonary dysplasia
Table 10. Lung function parameters between infants with and without BPD.
All infants
(n=182)
No BPD
(n=121)
BPD
(n=61) U p
VT (mL) 15.0 (4.0) 15 (4) 16 (4.5) 4749 0.002
VT/weight (mL/kg) 6.5 (1.7) 6.6 (1.7) 6.2 (1.4) 2996 0.038
RR 69 (23) 70 (24) 66 (23) 3420 0.419
VE (mL/min) 1023 (352) 1018 (321) 1173 (360) 4410 0.032
VE/weight (mL/kg/min) 445 (158) 460 (156) 417 (122) 2901 0.019
Pdi (cmH20) 20.8 (7.0) 20.7 (6.6) 21.1 (7.9) 3595 0.776
Pdi/VT (cmH2O·mL-1) 1.4 (0.5) 1.5 (0.5) 1.3 (0.4) 2794 0.007
PTIdi (cmH2O·s) 3.9 (2.2) 4.0 (2.2) 3.7 (2.2) 3254 0.193
PTIdi per minute
(cm H2O·s·min-1) 271 (100) 280 (95) 261 (106) 2921 0.022
Values are median (IQR) with statistical significance determined by Mann-
Whitney-U. BPD, bronchopulmonary dysplasia; VT, tidal volume; RR, respiratory
rate; VE, minute ventilation;;; FRC, functional residual capacity.

63
VT/kg increased significantly as gestational age decreased (R2 = 0.026, p = 0.030). VT
was significantly higher in infants with BPD (p = 0.002). However, adjusted VT per
weight was significantly lower in infants with BPD compared to infants without BPD.
The coefficient of variation of VT in infants with BPD was 18.5 % compared to 18.6
% infants without BPD. Respiratory rate (RR) was equal between infants with and
without BPD and did not correlate with gestational age (R2 = 0.009; p = 0.210). Infants
with BPD had a lower Pdi/VT (Figure 9A) and lower PTIdi·min-1 compared to infants
without BPD (Figure 9B). The coefficient of variation in Pdi in infants with BPD was
27.5 % compared to 25.2 % infants without BPD.
Figure 9. Pdi/VT and PTIdi·min-1 in infants with and without BPD.
4.4.1. Univariate analysis
Variables related to respiratory support were collinear with gestational age. Therefore,
prior to performing the univariate analysis, we calculated unstandardised residuals for
mechanical ventilation, non-invasive ventilation, duration of respiratory support and
oxygen therapy against gestational age and used the unstandardised residuals as
independent measures of respiratory support and oxygen therapy.
Pdi/VT was positively associated with gestational age, and negatively associated with
weight z-score at birth, average energy and protein intake over the first 28 days of life,
duration of respiratory support and a diagnosis of BPD.
Diaphragmatic inspiratory work of breathing per minute (PTIdi·min-1) was positively
associated with gestational age and average energy and protein intake over the first 28

64
days of life, and negatively associated with the duration of respiratory support and
BPD.
4.4.2. Multivariable regression
Weight Z score at birth and average energy intake over the first month of age were
significant predictors of Pdi/VT, but together accounted for only 11.9 % of the
variability in Pdi/VT (Table 11). An increase of one weight Z score at birth decreased
Pdi/VT by -0.143 cm H2O·mL-1 (R2 = 0.08, p < 0.0001). An increase of one
kilocalorie/day increased Pdi/VT by 0.006 cm H2O·mL-1 (R2 = 0.12, p = 0.007).
Average energy intake was the sole predictor for the inspiratory work of breathing
performed by the diaphragm each minute. However, average energy intake accounted
for only 6 % of the variability in PTIdi·min-1 (Table 11). An increase of one
kilocalorie/day increased PTIdi·min-1 of 1.6 cmH2O·s·min-1 (R2 = 0.06, p = 0.001).
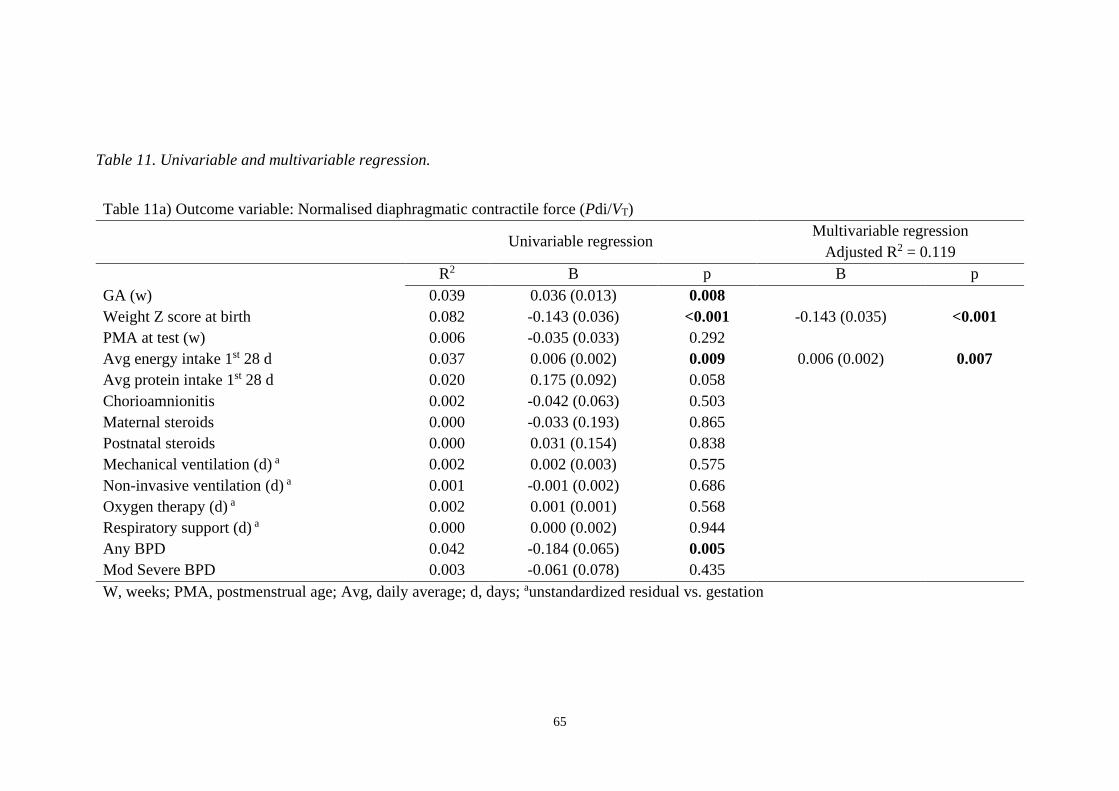
65
Table 11. Univariable and multivariable regression.
Table 11a) Outcome variable: Normalised diaphragmatic contractile force (Pdi/VT)
Univariable regression
Multivariable regression
Adjusted R2 = 0.119
R2 B p B p
GA (w) 0.039 0.036 (0.013) 0.008
Weight Z score at birth 0.082 -0.143 (0.036) <0.001 -0.143 (0.035) <0.001
PMA at test (w) 0.006 -0.035 (0.033) 0.292
Avg energy intake 1st 28 d 0.037 0.006 (0.002) 0.009 0.006 (0.002) 0.007
Avg protein intake 1st 28 d 0.020 0.175 (0.092) 0.058
Chorioamnionitis 0.002 -0.042 (0.063) 0.503
Maternal steroids 0.000 -0.033 (0.193) 0.865
Postnatal steroids 0.000 0.031 (0.154) 0.838
Mechanical ventilation (d) a 0.002 0.002 (0.003) 0.575
Non-invasive ventilation (d) a 0.001 -0.001 (0.002) 0.686
Oxygen therapy (d) a 0.002 0.001 (0.001) 0.568
Respiratory support (d) a 0.000 0.000 (0.002) 0.944
Any BPD 0.042 -0.184 (0.065) 0.005
Mod Severe BPD 0.003 -0.061 (0.078) 0.435
W, weeks; PMA, postmenstrual age; Avg, daily average; d, days; aunstandardized residual vs. gestation
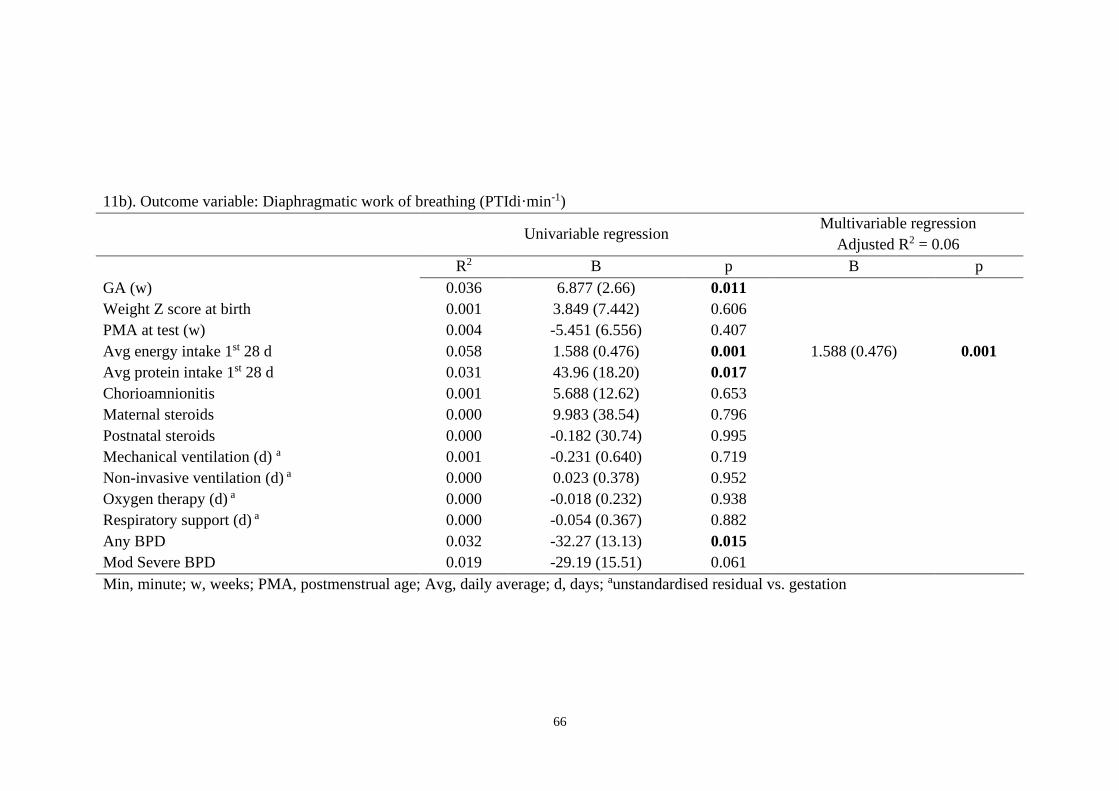
66
11b). Outcome variable: Diaphragmatic work of breathing (PTIdi·min-1)
Univariable regression
Multivariable regression
Adjusted R2 = 0.06
R2 B p B p
GA (w) 0.036 6.877 (2.66) 0.011
Weight Z score at birth 0.001 3.849 (7.442) 0.606
PMA at test (w) 0.004 -5.451 (6.556) 0.407
Avg energy intake 1st 28 d 0.058 1.588 (0.476) 0.001 1.588 (0.476) 0.001
Avg protein intake 1st 28 d 0.031 43.96 (18.20) 0.017
Chorioamnionitis 0.001 5.688 (12.62) 0.653
Maternal steroids 0.000 9.983 (38.54) 0.796
Postnatal steroids 0.000 -0.182 (30.74) 0.995
Mechanical ventilation (d) a 0.001 -0.231 (0.640) 0.719
Non-invasive ventilation (d) a 0.000 0.023 (0.378) 0.952
Oxygen therapy (d) a 0.000 -0.018 (0.232) 0.938
Respiratory support (d) a 0.000 -0.054 (0.367) 0.882
Any BPD 0.032 -32.27 (13.13) 0.015
Mod Severe BPD 0.019 -29.19 (15.51) 0.061
Min, minute; w, weeks; PMA, postmenstrual age; Avg, daily average; d, days; aunstandardised residual vs. gestation
67
4.5. Discussion
We measured recorded tidal volume, respiratory rate and diaphragm contractile
function during spontaneous breathing and quiet sleep in 182 unsedated very preterm
infants with and without BPD at 36 weeks’ PMA. We aimed to identify if a diagnosis
of BPD was associated with impaired diaphragm function, and if common adverse
antenatal and postnatal exposures were predictive for diaphragm function prior to
initial hospital discharge. Contrary to our expectation, infants with BPD exhibited
more efficient diaphragmatic contractile function (Pdi/VT) and had lower
diaphragmatic work of breathing per minute (PTIdi·min-1) than infants without BPD.
Variability in VT and Pdi between infants with and without BPD was minimal and are
therefore unlikely to have contributed to our findings. Whereas both gestation and
early postnatal caloric intake were predictive of diaphragmatic contractile function,
these factors only explained 11.9 % of the variability in this outcome variable.
Similarly, early postnatal caloric intake was the only predictive perinatal factor
associated with diaphragmatic workload, but accounted for only 6 % of the variability
in PTIdi·min-1. Hence, these measures of diaphragm function during tidal breathing
are highly variable in premature infants.
We expected that infants with BPD and infants with prolonged duration of respiratory
support would need to generate a higher contractile force per unit tidal volume (low
efficiency of contractile force) and to exhibit increased work of breathing per minute
compared to infants without BPD and infants with less exposure to mechanical
respiratory support. Similarly, we expected less mature infants, and those with reduced
caloric intake to also show poor efficiency and increased diaphragmatic work of
breathing. However, in the univariate regression analysis infants born more premature,
those receiving less caloric intake in the first month of life, infants with BPD and
infants who required prolonged respiratory support exhibited more efficient
contractile function and lower diaphragmatic work of breathing than their more
mature, healthier counterparts. Moreover, infants with BPD had less efficient
breathing patterns compared to infants without BPD as evidenced by significantly
increased minute ventilation, directly contradicting our findings on efficiency of
diaphragm contractile function and diaphragmatic work of breathing per minute. The
reason for this apparent contradiction warrants exploration.

68
The improved contractile function (Pdi/VT) and diaphragmatic work of breathing
(PTIdi·min-1) in infants with BPD could be related to a lower chest wall compliance.
We investigated chest wall compliance in another cohort of very preterm infants and
found a lower chest wall compliance in infants with moderate and severe BPD
compared to infants without BPD (unpublished observations, see Chapter 5.4). A
lower chest wall compliance (stiffer chest wall) may improve efficiency of breathing
by reducing chest wall distortion during tidal breathing, and therefore explain the
higher diaphragm efficiency and reduced diaphragmatic workload in the more
premature infants including those with BPD.
A decreased Pdi/VT and PTIdi·min-1 in infants with BPD does not necessarily mean a
decrease in the work of breathing as our measurements were confined to assessment
of diaphragmatic contractile efficiency and work of breathing. In infants with BPD a
higher proportion of the VT could be generated by the accessory respiratory muscles.
We are not able to confirm that finding as we did not assess the accessory respiratory
muscles in this study.
Moreover, antenatally nutrition deprived rat pups have a significantly less type II
fibres in their diaphragms (Prakash et al., 1993) compared to controls. In our cohort,
infants with BPD had a higher weight Z-score at birth indicating improved nutrition
in utero compared to infants without BPD. Perhaps, infants with BPD have a higher
content of type IIA muscle fibres, which are strong and non-fatiguable and explain the
more efficient contractile force and decreased diaphragmatic workload.
Our finding that weight Z score at birth is a significant negative predictive factor for
Pdi/VT in the multivariable analysis indicates more efficient breathing in infants with
improved intrauterine growth. A direct comparison with animal data is difficult, as the
investigators of the animal studies assessed muscle strength and not efficiency of
contractile function after intrauterine growth restriction in rat pups. Nevertheless, they
found decreased diaphragm muscle strength following intrauterine growth restriction
in rat pups (Prakash et al., 1993).
Pdi/VT and PTIdi·min-1 both increased (i.e., less efficient contractile function and
increased work) with increasing average energy intake over the first month of age. In
our cohort, energy intake/kg correlated positively with gestational age and was

69
decreased in infants with BPD. As such the more efficient diaphragm contractility and
decreased diaphragmatic workload in infants with BPD could again be explained by
the lower chest wall compliance or the contribution of the force generated by the
accessory muscles towards VT in these infants.
Nevertheless, this finding appears contradictory given that improved birthweight Z
score was a predictor for improved diaphragm contractile efficiency, and prior reports
that postnatal nutrition deprivation in rats leads to a decrease in diaphragm muscle
strength (Lewis et al., 1986). Similar findings of a negative effect of impaired nutrition
on diaphragmatic function are observed in young patients with cystic fibrosis, women
with anorexia, and undernourished adult patients (Dureuil et al., 1998; Hart et al.,
2004; Murciano et al., 1994). However, our infants received enough calories to grow
and gain weight and were born during early lung development, which might explain
the discrepancy between the literature and our findings. Moreover, we assessed
diaphragm contractile efficiency and diaphragmatic workload and not diaphragm
muscle strength, which again could explain the different findings.
We could not find any correlation relationship between antenatal and postnatal steroid
exposure and diaphragm function. Moreover, we could not find any correlation
between invasive respiratory support and diaphragm dysfunction at 36 weeks’ PMA.
Studies in adult animals show clearly that controlled mechanical ventilation leads to
VIDD characterised by muscle atrophy and myofibril injury (Jaber, Jung, et al., 2011;
Liang et al., 2019; Powers et al., 2002). Similar findings were reported in long-term
ventilated children and in ventilated adults (Jaber, Jung, et al., 2011; Petrof & Hussain,
2016). In contrast to these studies, preterm infants receive assisted ventilation, which
preserves spontaneous respiratory activity (Futier et al., 2008). Spontaneous
respiratory activity markedly reduces the incidence and severity of VIDD. Animal
studies and studies in human adults were performed whilst the animal or the human-
being were still ventilated or had just come off mechanical ventilation (Liang et al.,
2019). As such, a possible explanation is that VIDD resolves over time. The infants
enrolled in our study were off mechanical ventilation for a mean (± SD) duration of
47 (± 15) days before the assessment. Furthermore, except for a limited number of
infants (n = 16), the included infants were off continuous positive airway pressure
(CPAP) for a mean (± SD) duration of 20 (± 14) days before testing. Diaphragm

70
function was not different between infants on CPAP compared to infants without
CPAP.
Our study has some limitations. The diaphragm function was measured using a face
mask and an ultrasonic flowmeter. We have potentially overestimated diaphragm
function due to increased resistance when using the equipment compared to infants
breathing without additional impedance. However, measurements during tidal
breathing without the face mask were highly variable, making a sensible analysis of
these data impossible. Despite the continuous real time recording via LabChart Pro®
software, we had to exclude six of our recordings due to dislocation of the catheter
during the measurements. We excluded another six infants from the analyses due to
leak at the face mask. Even though the leak would probably have minimal effect on
diaphragm function, Pdi could no longer be accurately normalised to the measured
tidal volume.
A comparison between the reported animal studies and our study is challenging. In
animal models, maximum diaphragmatic force and muscle fatigue were assessed
(Lavin et al., 2013). We investigated diaphragm function during spontaneous
breathing and did not focus on maximum force or fatigue. The assessment of
maximum force and phrenic nerve stimulation are difficult to perform in preterm
infants. Nevertheless, Dimitriou et al. stimulated the phrenic nerve in infants and found
a positive correlation between diaphragmatic pressure production and gestational age
(Gabriel Dimitriou et al., 2003). We might have missed associations between
diaphragm function and antenatal and postnatal factors as the differences in diaphragm
function may only be evident when maximum force is generated.
There are various strengths of our study, one of which is the large sample size. To the
best of our knowledge, this is the largest study to investigate diaphragm function in
very preterm infants at 36 weeks’ PMA. Additionally, we measured our infants during
quiet sleep without sedation, and diaphragm function was assessed over a period of at
least 10 stable breaths. All infants were measured with a microtip dual pressure
catheter. The dual tip pressure catheter (Mikro-Tip® Transducer, Millar Instrumental
Inc. Houston, Texas/USA) and the simultaneous real time recording via LabChart
Pro® software enabled continuous assessment of the correct position of the catheter.

71
4.6. Conclusion
In conclusion we found no evidence that diaphragm function is decreased in infants
born more premature or in infants with BPD. Diaphragmatic force measured as Pdi/VT
increased with improved intrauterine growth in very preterm infants measured at 36
weeks’ PMA. Increased postnatal energy intake over the first month of age led to a
decrease in diaphragm function. Moreover, infants with increased dependency on
mechanical ventilation did not show a decrease in diaphragm function, which could
be related to the time interval between extubation and the assessment. Overall, even
though weight Z score at birth and average caloric intake were statistically significant
predictors of diaphragm contractile function, they only accounted for 11.9 % of the
variability in Pdi/VT while caloric intake accounted for only 6 % for the variability in
diaphragmatic work of breathing per minute. Diaphragm function in very premature
infants is likely influenced by additional as yet unknown antenatal and postnatal
factors.

72
CHAPTER 5
RESPIRATORY AND CHEST WALL MECHANICS IN
VERY PRETERM INFANTS
Preface:
We found decreased efficiency of diaphragm contractile force and
diaphragmatic work of breathing in infants with bronchopulmonary
dysplasia and we suspected these findings could be related to a stiffer
chest wall compliance in these infants. We therefore explored the static
compliance of the chest wall in preterm infants with and without
bronchopulmonary dysplasia. Available data on the static compliance of
the chest wall date back to the pre-surfactant era and have limited
relevance for infants born in the post-surfactant era. We assessed static
compliance of the respiratory system, the lung and the chest wall and
related these measurements to breathing variables in 23 very preterm
infants at 36 weeks’ postmenstrual age.
This manuscript will be submitted to the Journal of Applied Physiology
(JAP) in August 2020.

73
5. RESPIRATORY AND CHEST WALL MECHANICS
IN VERY PRETERM INFANTS
Stoecklin B.a,b,c, Veneroni C.d, Choi J.a, Pillow J.J.a,e, Dellaca R.d
Affiliations:
a School of Human Sciences, University of Western Australia, Perth, Australia;
b King Edward Memorial Hospital, Perth, Australia;
c Department of Neonatology, University Children’s Hospital Basel (UKBB), Basel,
Switzerland
d Dipartimento di Elettronica, Informazione e Bioingegneria – DEIB, Politecnico di
Milano University, Milan, Italy
e Telethon Kids Institute, Perth, Western Australia
Corresponding author: Benjamin Stoecklin, Department of Neonatology, University
Children’s Hospital Basel (UKBB), Spitalstrasse 33, 4056 Basel, Switzerland.
Word count: 3491
74
5.1. Abstract
5.1.1. Introduction
Data on static compliance of the chest wall (Ccw) in preterm infants are scarce. We
characterised the static compliance of the lung (Cl) and Ccw to determine their relative
contribution to static compliance of the respiratory system (Crs). We also aimed to
investigate how the severity of bronchopulmonary dysplasia (BPD) influenced these
compliances in very preterm infants at 36 weeks’ postmenstrual age (PMA).
5.1.2. Methods
Airway opening pressure, esophageal pressure, and tidal volume (VT) were measured
simultaneously during a short apnoea evoked by the Hering–Breuer reflex. We
computed tidal breathing variables, lung resistance (Rl) and dynamic lung compliance
(Cl,dyn), inspiratory capacity (IC), and Crs, Cl and Ccw. Functional residual capacity was
assessed by the multiple breath washout technique (FRCmbw). Breathing variables,
compliances and lung volumes were adjusted for body weight.
5.1.3. Results
Twenty-three preterm infants born at 27.2 ± 2.0 weeks’ gestational age (GA) were
studied at 36.6 ± 0.6 weeks’ PMA. Infants with moderate or severe BPD had decreased
FRCmbw/kg (p=0.044), IC (p=0.005) and Cl,dyn. Rl was increased in infants with BPD.
Infants with BPD (n=11) had decreased Crs (p=0.013), Cl (p=0.019), and Ccw (p=0.027)
compared to infants without BPD. Ccw is approximately three times higher than Cl
independent of the presence of BPD. Minute ventilation increased as Crs and Cl
increased, VT/kg increased as Ccw increased.
5.1.4. Conclusion
Infants with moderate or severe BPD have reduced static compliance of the lung and
chest wall. Decreased Ccw in infants with moderate-severe BPD can be explained by
an elevated FRC secondary to gas trapping.
75
5.2. Introduction
Bronchopulmonary dysplasia (BPD) is one of the most common complications
following preterm birth and leads to long-term negative respiratory sequelae (Higgins
et al., 2018; Shannon J. Simpson et al., 2018). Preterm birth interrupts normal lung
development in utero, which is one of the key risk factors for the development of BPD
(Kotecha, 2000). The characteristics of BPD have changed since surfactant was
introduced in the early 1990s (Robertson & Halliday, 1998). The so-called ‘old’ BPD
affected less premature infants and was characterized by the damage of the airways,
whereas the ‘new’ BPD is a consequence of interrupted lung development and
characterized by fewer and simplified alveoli (Alan H Jobe, 2006; Alan J. Jobe, 1999).
The structural changes in the lung tissue affect the mechanical properties of the
respiratory system. Changes in the mechanical properties are reflected by lower
compliance of the lung (Cl) and the overall respiratory system (Crs) in infants with
BPD compared to infants without BPD (Gappa et al., 2006). The lower Crs in infants
with BPD persists at least up until 12 months of age (Merth et al., 1997). Thus, the
link between abnormal lung development and changes in the elastic properties of the
lung is well-established. However, whether BPD also leads to structural changes in
the chest wall and if these changes further decrease Crs remains unknown.
While several studies report data for Crs and Cl in preterm infants (de Winter et al.,
2000; Gappa et al., 2006; Merth et al., 1997; Morley et al., 1991), published data on
Ccw are relatively scarce and refer to infants born prior to the routine administration of
surfactant to preterm infants with respiratory distress (Davis et al., 1988; T. Gerhardt
et al., 1980; Heldt et al., 1987; Papastamelos et al., 1995). Stiffening of the chest wall
with increasing postmenstrual age (PMA) suggested by two studies (T. Gerhardt &
Bancalari, 1980; Papastamelos et al., 1995) is attributed to developmental changes,
including the ossification of the ribs and altered configuration of the thorax
(Papastamelos et al., 1995).
Factors suggesting an altered Ccw in preterm infants with BPD compared to infants
without BPD include a higher incidence of metabolic bone disease (Gaio et al., 2018),
increased chest wall distortion (Allen et al., 1991; Carlo et al., 1982; Neto et al., 1995)
and differences in the configuration of the chest after 8 months of life. These
76
differences are likely due to different operating lung volumes (De Boeck et al., 1994;
Edwards et al., 1987). Survivors of BPD have a flatter chest compared to infants
without BPD at 12 months corrected age (Breysem et al., 1997; De Boeck et al., 1994).
We hypothesised that infants with BPD have a stiffer chest wall compared to infants
without BPD, which will contribute to the decreased Crs seen in infants with BPD. We
aimed to characterise static Cl and Ccw and to determine their relative contribution to
Crs in very preterm infants at 36 weeks’ PMA. We further aimed to investigate how
the severity of BPD influenced these compliances. Moreover, we aimed to understand
the relationship between changes in compliance with breathing variables and lung
volumes in infants with and without BPD.
5.3. Methods
5.3.1. Study design
We designed a prospective observational study to assess the relative contributions of
the lung and the chest wall to the compliance of the respiratory system in very preterm
infants. The study was approved by the Women and Newborn Health Service Human
Research Ethics Committee (HREC:1883EW and 20130193EW) and the University
of Western Australia (RA/4/1/5942 and RA/4/1/426).
5.3.2. Study population and data management
Infants were recruited from the Neonatal Intensive Care Unit at King Edward
Memorial Hospital for Women (KEMH). All included infants were part of the Preterm
Infant Functional and Clinical Outcomes (PIFCO) study (ACTRN12613001062718l).
Infants eligible for the study were born between 23rd of July 2017 and 12th of May
2018 < 32 weeks’ gestation. The sample size was not pre-defined, but was aimed to
have sufficient infant numbers to provide an indication of magnitude of effect size
relating to lung disease. Infants with congenital malformations were excluded from
the study. Written informed consent was obtained from the parents prior to enrolment
into the study. Study data were collected and managed using Research Electronic Data
Capture (REDCap) software hosted at the University of Western Australia (Paul A.
Harris et al., 2009).

77
5.3.3. Assessment of bronchopulmonary dysplasia
Bronchopulmonary dysplasia was assessed according to the NIH definition published
in 2001 (A. H. Jobe & Bancalari, 2001). Infants dependent on oxygen for more than
28 days were classified as having BPD. The severity of BPD was assessed based on
oxygen requirements or the need for positive pressure ventilation at 36 weeks’ PMA.
5.3.4. Experimental protocol and measurements
The assessment was performed at 36 weeks’ PMA. Infants were fed at least 30 minutes
before the test and studied during unsedated quiet sleep in a supine position. Infants
requiring continuous positive pressure ventilation or humidified high flow were taken
of respiratory support during the assessment. The respiratory assessment included the
measurement of FRC, breathing pattern variables, thoraco-abdominal asynchrony
during quiet breathing, and static Crs, Cl and Ccw.
Functional residual capacity (FRC). We measured FRCmbw using the multiple-breath
washout (MBW) technique with 4 % sulfur hexafluoride (SF6) as a tracer gas using an
ultrasonic flowmeter (Exhalyzer D, EcoMedics AG, Switzerland) and analyzed using
Wbreath version 3.28. The technique was described in detail by Schibler et al. in 2002
(Schibler et al., 2002). Each infant had at least three FRCmbw measurements performed
and the technical acceptability was ascertained using published guidelines (Frey,
Stocks, Coates, et al., 2000; Frey, Stocks, Sly, et al., 2000).
Breathing pattern. Breathing parameters and paradoxical breathing, defined as the
fraction of the inspiratory/expiratory time during which AB and the RC move in
opposite directions were measured by respiratory inductance plethysmography (RIP)
(Bicore II, CareFusion, California/USA; QDC Pro-Disposable Belt, Nox Medical,
USA). RIP was calibrated with a pneumotachograph prior to the assessment. Twenty
stable continuous breaths were recorded using a custom-made metal screen
pneumotachograph connected to a differential pressure transducer (Honeywell
26PCAFA6D) attached to a silicone face mask (size 00, Laerdal, Medical
AS/Norway). Prior to the assessment, the pneumotachograph was calibrated to the
flow generated during 20 mL volume excursions at a rate of 60 per minute using a
calibration syringe (5510 Series, Hans Rudolph Inc, USA).

78
Static compliances. Crs, Cl and Ccw were measured during short apneas provoked via
the Hering–Breuer reflex. The Hering–Breuer reflex was triggered by two to four rapid
manual inflations at an inspiratory pressure of 20 cmH2O using a Neopuff™ Infant
Resuscitator (Fisher&Paykel Healthcare/New Zealand). The positive inspiratory
pressure of 20 cmH2O was released to a defined positive end-expiratory pressure of 5
cmH2O after the Hering–Breuer reflex was triggered. Airway opening flow was
measured by a metal screen pneumotachograph connected to a differential pressure
transducer (Honeywell 26PCAFA6D) attached to a silicone face mask (size 00,
Laerdal, Medical AS/Norway). Airway opening pressure (Pao) was measured by a
pressure transducer (Honeywell 26PCAFA6D) via a side port in the filter attached to
the facemask. The proximal and the distal pressure transducer of a dual tipped pressure
transducer (Mikro-Tip® Transducer, Millar Instrumental Inc. Houston, Texas/USA)
were placed in the esophagus and in the stomach respectively. The correct positioning
of the pressure transducer was verified by the operator monitoring the tracings. All
measurements were recorded by Powerlab data acquisition system with LabChart
Pro® (ADInstruments, Sydney/Australia) software and stored for later analysis.
5.3.5. Data analysis
Changes in lung volume during quiet breathing were computed from the abdominal
(AB) and thoracic (RC) displacements measured by RIP. An identified local maxima
and minima on the volume signal during at least 10 breaths of quiet breathing and
computed respiratory rate (RR), tidal volume (VT), minute ventilation (VE), maximal
expiratory flow, percentage contribution of the abdomen to VT (% AB) and
paradoxical breathing.
Technically acceptable apneas were selected manually. Lung volume was obtained by
flow integration. Pleural pressure changes were estimated to be equal to esophageal
pressure changes. Compliances were calculated as:
Crs = ∆V / ∆ Pao, (1),
Cl = ∆V / ∆ (Pao – Ppl) (2), and
Ccw = ∆V / ∆ Ppl (3)

79
where ∆ V is the change in volume between 20 cmH2O and a positive end-expiratory
pressure of 5 cmH2O, and ∆ Pao and ∆ Ppl are the corresponding changes in airway
opening and pleural pressures, respectively (Grinnan et al., 2005).
Inspiratory capacity (IC) was estimated by the change in volume between the end-
expiratory lung volume (estimated as the mean volume of three end-expiratory points
during quite breathing at zero end-expiratory pressure) to the volume reached when a
positive inspiratory pressure of 20 cmH2O was applied.
Volume and compliance values were adjusted for body weight at time of the test. Data
analysis was performed in Matlab (2019b, The MathWorks, Natick,
Massachusetts/USA).
5.3.6. Statistical analysis
Data were tested for normality using the Kolmogorov–Smirnov test and reported as
mean ± standard deviation (SD) or as median and interquartile range (IQR) according
to their distribution. Differences in demographics, breathing pattern and compliances
between infants with and without BPD were compared using Student’s t-test or Mann-
Whitney test as appropriate for data distribution (Student, 1908). Differences in
compliance between BPD severity were compared using one-way ANOVA
(Bonferroni post-hoc analysis). Postnatal factors collinear with gestational age (GA)
were identified using variance inflation factor. These factors were regressed against
GA and the unstandardized residuals used as independent factors of GA in the
univariate and multivariable regression analyses. We used univariate regression
analyses to identify which antenatal and postnatal factors are associated with
compliance. Statistically significant factors were entered into the stepwise
multivariable regression analysis to identify independent variables associated with
compliance at 36 weeks’ PMA. A p-value < 0.05 was considered statistically
significant. Data were analysed within SPSS (v25·0·0·0; IBM Corp, USA).
80
5.4. Results
A total of 23 patients were studied including 12 infants without BPD and 11 infants
with BPD. Of the infants with BPD, four infants had mild BPD and seven infants
moderate or severe BPD. The demographics of studied infants are shown in Table 12.
Infants with BPD had a lower GA and birthweight and required mechanical ventilation
for longer compared to infants without BPD.
5.4.1. Breathing parameters and lung volumes between infants with and
without BPD
Tidal breathing variables and lung volumes for infants with and without BPD are
shown in Table 13. FRC/kg and IC/kg were lower in infants with BPD compared to
infants without BPD.
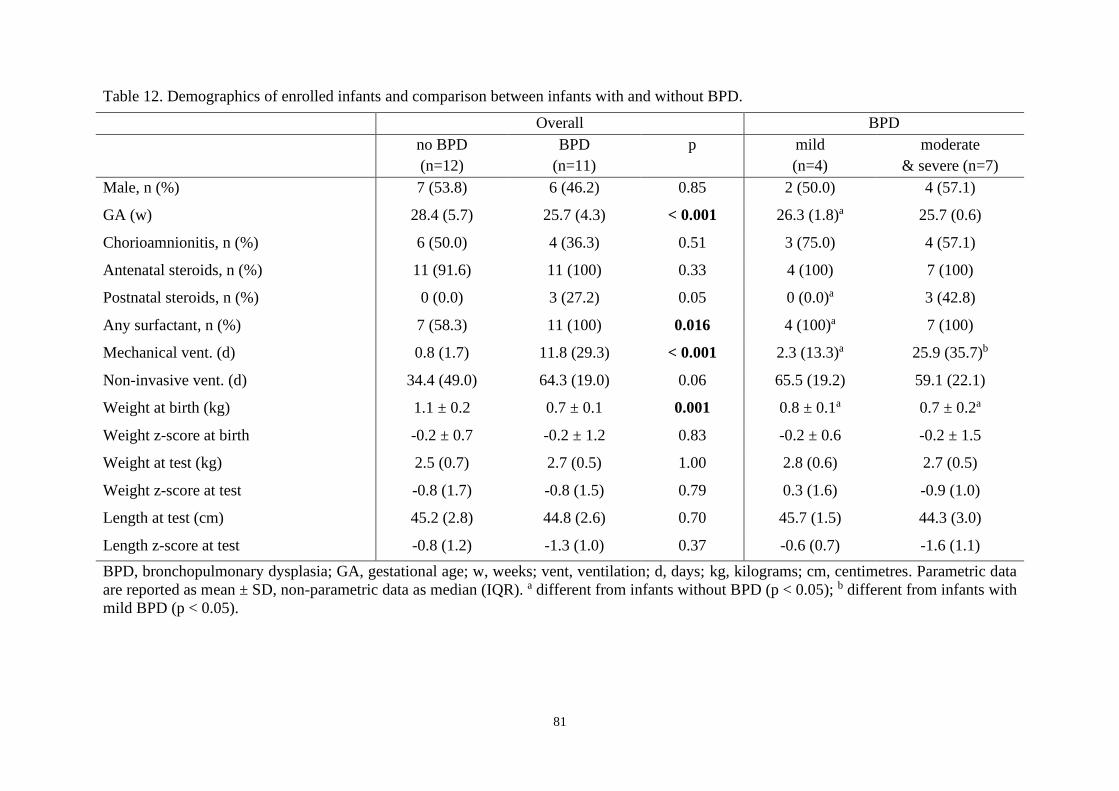
81
Table 12. Demographics of enrolled infants and comparison between infants with and without BPD.
Overall BPD
no BPD
(n=12)
BPD
(n=11)
p mild
(n=4)
moderate
& severe (n=7)
Male, n (%) 7 (53.8) 6 (46.2) 0.85 2 (50.0) 4 (57.1)
GA (w) 28.4 (5.7) 25.7 (4.3) < 0.001 26.3 (1.8)a 25.7 (0.6)
Chorioamnionitis, n (%) 6 (50.0) 4 (36.3) 0.51 3 (75.0) 4 (57.1)
Antenatal steroids, n (%) 11 (91.6) 11 (100) 0.33 4 (100) 7 (100)
Postnatal steroids, n (%) 0 (0.0) 3 (27.2) 0.05 0 (0.0)a 3 (42.8)
Any surfactant, n (%) 7 (58.3) 11 (100) 0.016 4 (100)a 7 (100)
Mechanical vent. (d) 0.8 (1.7) 11.8 (29.3) < 0.001 2.3 (13.3)a 25.9 (35.7)b
Non-invasive vent. (d) 34.4 (49.0) 64.3 (19.0) 0.06 65.5 (19.2) 59.1 (22.1)
Weight at birth (kg) 1.1 ± 0.2 0.7 ± 0.1 0.001 0.8 ± 0.1a 0.7 ± 0.2a
Weight z-score at birth -0.2 ± 0.7 -0.2 ± 1.2 0.83 -0.2 ± 0.6 -0.2 ± 1.5
Weight at test (kg) 2.5 (0.7) 2.7 (0.5) 1.00 2.8 (0.6) 2.7 (0.5)
Weight z-score at test -0.8 (1.7) -0.8 (1.5) 0.79 0.3 (1.6) -0.9 (1.0)
Length at test (cm) 45.2 (2.8) 44.8 (2.6) 0.70 45.7 (1.5) 44.3 (3.0)
Length z-score at test -0.8 (1.2) -1.3 (1.0) 0.37 -0.6 (0.7) -1.6 (1.1)
BPD, bronchopulmonary dysplasia; GA, gestational age; w, weeks; vent, ventilation; d, days; kg, kilograms; cm, centimetres. Parametric data
are reported as mean ± SD, non-parametric data as median (IQR). a different from infants without BPD (p < 0.05); b different from infants with
mild BPD (p < 0.05).

82
Table 13. Tidal breathing and lung volume variables. Comparison between infants with and without BPD.
Overall BPD
no BPD
(n=12)
BPD
(n=11)
p mild
(n=4)
moderate & severe (n=7)
VT / weight (mL/kg) 5.4 ±1.7 4.2 ±1.5 0.076 4.6 ±1.9 4.0 ±1.3
TI/Ttot % 45.0 ±3.64 45.3 ±4.0 0.819 43.6 ±5.44 46.3 ±2.94
RR / min. 71 ±15 77 ±14 0.352 81 ±18 75 ±12
VE (mL/min/kg) 357 (109) 329 (132) 0.190 344 (125) 261 (116)
FRCmbw / weight (mL/kg) 22.6 ±2.5 20 ±3.3 0.044 19.8 ±5.0 20.1 ±2.3
IC (mL/kg) 8.8 ±2.4b 6.1 ±1.7 0.005 6.8 ±1.8 5.7 ±1.6a
Abd. compartment (%) 77.2 ±23.6 77.4 ±35.8 0.989 92.5 ±30.0 68.7 ±38.0
TI paradox. breathing (%) 36.4 ±22.2 43.9 ±22.3 0.426 57.1 ±10.7 36.3 ±24.2
TE paradox. breathing (%) 30.2 ±17.8a 38.8 ±20.8 0.298 54.7 ±13.8a 29.7 ±19.0
Rdyn (cmH2O·s/L)/kg 30.9 ±15.5b 46.6 ±29.7 0.101 21.1 ±14.3 61.2 ±26.1a,b
Cl,dyn (mL/cmH2O/kg) 0.9 ±0.3b 0.7 ±0.4 0.259 1.0 ±0.4 0.5 ±0.2a,b
Peak expiratory flow (mL/s) 28.7 (9.8) 22.6 (14.0) 0.260 29.4 (15.7) 21.8 (7.0)
TPTEF/TE 0.42 ±0.08 0.39 ±0.06 0.303 0.40 ±0.08 0.39 ±0.05
BPD, bronchopulmonary dysplasia; VT, tidal volume; mL, millilitre; kg, kilograms; RR, respiratory rate; TI, inspiratory time per breath; Ttot,
total time per breath; min, minute; VE, minute ventilation; FRCmbw, functional residual capacity measured by multiple breath washout; IC,
Inspiratory capacity; Abd, abdominal; TE, expiratory time per breath; R, airway resistance; Cldyn, dynamic lung compliance; s, second; TPTEF;
time to peak expiratory flow; a different from infants without BPD (p < 0.05); b different from infants with mild BPD (p < 0.05).

83
5.4.2. Compliance in infants with and without BPD
Measurements were well tolerated by all infants. Median (IQR) overall Crs, Cl, and
Ccw normalised to body weight were 0.69 (0.6), 0.95 (1.0) and 3.0 (2.4) mL/cmH2O/kg
respectively. Ccw/weight was approximately three times higher compared to Cl/
weight.
Crs, Cl and Ccw were significantly lower in infants with BPD compared to infants
without BPD (Figure 10).
Figure 10. Crs, Cl, and Ccw were statistically significantly lower in infants with BPD
compared to infants without BPD (Mann-Whitney U).
We compared the compliances between BPD severity subgroups divided into no BPD,
mild BPD and a subgroup consisting of infants with moderate or severe BPD. The Crs
and Cl were significantly lower in infants with moderate or severe BPD but not in
infants with mild BPD, compared to infants without BPD. Ccw was equal between
infants with moderate or severe BPD and infants without BPD (p = 0.056) (Figure 11).
Ccw/Cl ratio was 2.9 ± 1.3 in infants without BPD, 2.8 ± 1.2 in infants with mild BPD
and 3.1 ± 0.8 in infants with moderate or severe BPD (p = 0.9). Hence, across the
groups Crs is approximately 73 % of Cl.
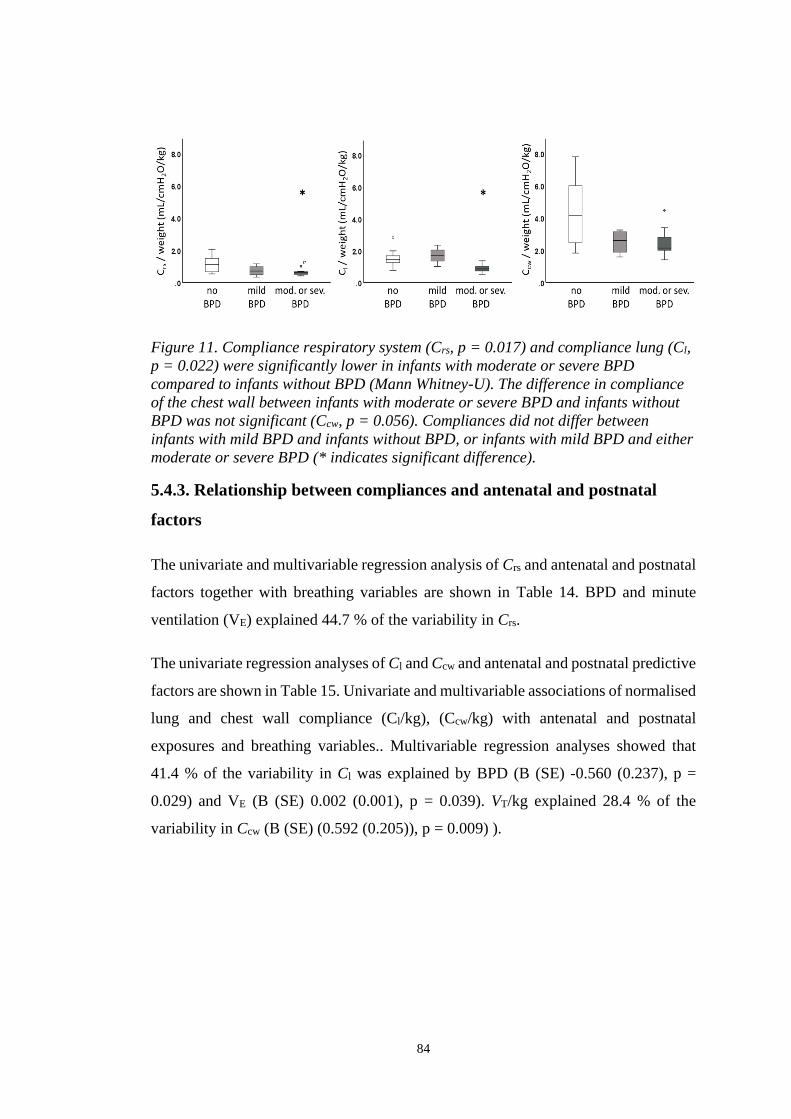
84
Figure 11. Compliance respiratory system (Crs, p = 0.017) and compliance lung (Cl,
p = 0.022) were significantly lower in infants with moderate or severe BPD
compared to infants without BPD (Mann Whitney-U). The difference in compliance
of the chest wall between infants with moderate or severe BPD and infants without
BPD was not significant (Ccw, p = 0.056). Compliances did not differ between
infants with mild BPD and infants without BPD, or infants with mild BPD and either
moderate or severe BPD (* indicates significant difference).
5.4.3. Relationship between compliances and antenatal and postnatal
factors
The univariate and multivariable regression analysis of Crs and antenatal and postnatal
factors together with breathing variables are shown in Table 14. BPD and minute
ventilation (VE) explained 44.7 % of the variability in Crs.
The univariate regression analyses of Cl and Ccw and antenatal and postnatal predictive
factors are shown in Table 15. Univariate and multivariable associations of normalised
lung and chest wall compliance (Cl/kg), (Ccw/kg) with antenatal and postnatal
exposures and breathing variables.. Multivariable regression analyses showed that
41.4 % of the variability in Cl was explained by BPD (B (SE) -0.560 (0.237), p =
0.029) and VE (B (SE) 0.002 (0.001), p = 0.039). VT/kg explained 28.4 % of the
variability in Ccw (B (SE) (0.592 (0.205)), p = 0.009) ).

85
Table 14. Outcome variable: Normalised respiratory system compliance (Crs/weight).
Univariate regression Multivariable regression
Adjusted R2 = 0.447
R2 B p B p
GA (w) 0.145 0.088 (0.047) 0.073
Weight Z score at birth 0.021 0.072 (0.108) 0.514
PMA at test (w) 0.076 -0.209 (0.159) 0.203
Chorioamnionitis 0.017 -0.119 (0.197) 0.552
Any surfactant 0.009 0.101 (0.238) 0.675
Mechanical vent. (d)a 0.002 -0.005 (0.002) 0.850
Non-invasive vent. (d)a 0.043 -0.006 (0.006) 0.341
Respiratory support (d)a 0.026 -0.004 (0.005) 0.467
Oxygen therapy (d)a 0.108 -0.004 (0.002) 0.125
Any BPD 0.284 -0.482 (0.167) 0.009 -0.383 (0.156) 0.023
Mod Severe BPD 0.178 -0.414 (0.194) 0.045
VT/weight (mL/kg) 0.157 0.110 (0.056) 0.061
VE (mL/min/kg) 0.279 0.002 (0.001) 0.010 0.002 (0.001) 0.025
FRCmbw (mL/kg) 0.102 0.047 (0.031) 0.138
IC (mL/kg) 0.007 0.015 (0.041) 0.710
Peak exp. flow (mL/s) 0.133 0.019 (0.011) 0.088
GA, gestational age; w, weeks; PMA, postmenstrual age; vent, ventilation; d, days; BPD, bronchopulmonary dysplasia; VT, tidal volume; mL,
millilitres; kg, kilograms; FRCmbw, functional residual capacity measured by multiple breath washout; IC, inspiratory capacity; s, seconds; aunstandardized residual vs. gestation.

86
Table 15. Univariate and multivariable associations of normalised lung and chest wall compliance (Cl/kg), (Ccw/kg) with antenatal and
postnatal exposures and breathing variables.
(Cl/kg) (Ccw/kg)
R2 B p R2 B p
GA (w) 0.200 0.153 (0.067) 0.033 0.058 0.223 (0.195) 0.267
Weight Z score at birth 0.009 0.071 (0.160) 0.662 0.030 0.344 (0.429) 0.431
PMA at test (w) 0.103 -0.360 (0.231) 0.135 0.016 -0.377 (0.655) 0.571
Chorioamnionitis 0.024 -0.210 (0.291) 0.478 0.016 -0.458 (0.788) 0.567
Any surfactant 0.000 -0.024 (0.354) 0.947 0.053 1.012 (0.929) 0.289
Mechanical vent. (d)a 0.000 -0.000 (0.013) 0.985 0.012 -0.017 (0.035) 0.623
Non-invasive vent. (d)a 0.048 -0.009 (0.009) 0.316 0.007 -0.009 (0.025) 0.712
Respiratory support (d)a 0.037 -0.007 (0.008) 0.377 0.000 0.000 (0.022) 0.982
Oxygen therapy (d)a 0.083 -0.005 (0.003) 0.183 0.129 -0.016 (0.009) 0.092
Any BPD* 0.271 -0.696 (0.249) 0.011 0.261 -1.847 (0.678) 0.013
Mod Severe BPD 0.193 -0.638 (0.285) 0.036 0.124 -1.380 (0.801) 0.100
VT/weight (mL/kg)** 0.105 0.134 (0.085) 0.131 0.284 0.592 (0.205) 0.009
VE (mL/min/kg)* 0.250 0.003 (0.001) 0.015 0.245 0.007 (0.003) 0.016
FRCmbw (mL/kg) 0.106 -0.071 (0.045) 0.129 0.081 0.168 (0.124) 0.188
IC (mL/kg) 0.010 0.028 (0.060) 0.648 0.014 0.088 (0.162) 0.591
Peak exp. flow (mL/s) 0.115 0.027 (0.016) 0.113 0.103 0.068 (0.044) 0.136
GA, gestational age; w, weeks; PMA, postmenstrual age; vent, ventilation; d, days; BPD, bronchopulmonary dysplasia; VT, tidal
volume; mL, millilitres; kg, kilograms; FRCmbw, functional residual capacity measured by multiple breath washout; IC, inspiratory
capacity; s, seconds; aunstandardized residual vs. gestation; * BPD and VE were the only predictors in the multivariable regression
analysis with the outcome variable Cl/kg; ** VT/weight was the only predictor in the multivariable regression analysis with the
outcome variable Ccw/kg.

87
5.5. Discussion
We measured the static mechanical properties of the respiratory system and its
compartments Ccw and Cl together with the breathing pattern and lung volumes in
preterm infants at 36 weeks’ PMA. Data on chest wall compliance in preterm infants
are scarce with available data dating back to the pre-surfactant era (Davis et al., 1988;
T. Gerhardt & Bancalari, 1980; Heldt & McIlroy, 1987), limiting their relevance to
infants born today. The main findings of our study include: 1) infants with BPD have
a lower Ccw compared to infants without BPD; 2) the decrease in Crs in infants with
BPD is a consequence not only of a decreased Cl but also of a decreased Ccw despite
Crs being mainly determined by Cl; 3) infants with BPD have a reduced weight
adjusted inspiratory capacity (IC/kg) and lung volume (FRCmbw/kg) compared to
preterm infants without BPD and 4) decreased compliances (Crs, Cl and Ccw) were
associated with reduced VE/kg and VT/kg.
We found infants with moderate or severe BPD had reduced dynamic lung compliance
and increased airway resistance. ). Dynamic lung compliance was 50 % and resistance
200 % in infants with moderate or severe BPD compared to values obtained in infants
without BPD, which is also consistent with previous reports (Tilo Gerhardt et al.,
1987).
Our finding that Ccw is three times Cl is in line with the current literature from the pre-
surfactant era (T. Gerhardt & Bancalari, 1980; Papastamelos et al., 1995). We report
similar values for Ccw as Davis et al. in preterm infants and Papastamelos et al. in term
infants (Davis et al., 1988; Papastamelos et al., 1995). However, we found lower Ccw
compared to the observations made by Gerhardt et al. in preterm infants at 36 weeks’
PMA (5.3 mL/cmH2O/kg versus 3.0 mL/cmH2O/kg) (T. Gerhardt & Bancalari, 1980).
Infants measured by Gerhardt were on average five weeks’ more mature at birth (mean
gestational age 32.0 weeks versus 27.2 weeks gestation). Furthermore, they were
measured within two weeks after birth compared to a mean postnatal age of 9.4 ± 2.3
weeks of infants’ measurements obtained in our study. These differences are relevant
as Ccw decreases with increasing PMA (T. Gerhardt & Bancalari, 1980). Postmenstrual
age was not associated with Ccw in our cohort, however, a possible explanation for the
absence of this association could be that our infants were measured within a tight range

88
of two weeks PMA. The difference in gestation is unlikely to explain the lower Ccw,
as the range in gestation in our infants was > 8 weeks and there was no association
between gestation and Ccw. Additionally, all infants measured by Gerhardt et al. were
intubated at the time of the test and none of them received surfactant. Hence, the lower
Ccw seen in our infants may be the result of several factors including the differences in
postnatal age at test, differences in the methodology of the measurements (intubated
versus self-ventilating infants), and differences in the use of surfactant. Moreover, the
lower Ccw in our infants compared to the infants reported from the pre-surfactant era
could be explained by the steadily decreasing incidence of metabolic bone disease in
premature infants over the past decades due to advances in enteral nutrition
(Vachharajani et al., 2009).
Chest wall compliance was lower in infants with BPD compared to infants without
BPD. Previous studies reported a flatter chest seen in infants with BPD compared to
infants without BPD at 12 months corrected age (Breysem et al., 1997; De Boeck et
al., 1994). The authors of these studies suggested the flatter chest might be related to
a decreased Cl resulting in an indrawing of the rib cage caused by the contraction of
the diaphragm (Breysem et al., 1997; De Boeck et al., 1994). Differences in chest wall
structure are also attributed to metabolic bone disease in infants with BPD (De Boeck
et al., 1994). We did not compare laboratory indices of metabolic bone disease
between infants with and without BPD. However, all of the included infants in our
study were fed with a milk fortifier to increase cholecalciferol, calcium and
phosphorus intake and therefore to prevent metabolic bone disease. Furthermore, the
ossification process of the chest wall is not complete at 36 weeks’ PMA and it is
unlikely that permanent changes in the chest wall structure are already present
(Papastamelos et al., 1995).
Other possible explanations for a decreased Ccw at this young age include altered lung
volumes: either a reduction in total lung capacity (TLC) consequent to restrictive lung
pathology, or increased FRC as a result of gas trapping. Margraf et al. reported reduced
lung internal surface area in infants with BPD in the pre- surfactant era, but did not
measure TLC (Margraf et al., 1991). Apart from this study, we could not find any data
on reduced TLC in infants with BPD. Robin et al. found that TLC is comparable
between infants with BPD and without BPD older than eight months of age (Robin et

89
al., 2004). In contrast, several studies suggest presence of gas trapping in infants with
BPD: increases in FRC and residual volume as a percentage of TLC were reported
after eight months of life (Filbrun et al., 2011; Robin et al., 2004). A decrease in
FRCmbw and higher thoracic area on chest x-rays assessed simultaneously were
reported in the first days of life in infants who subsequently developed BPD. The
paradoxical finding of a lower FRCmbw and a higher thoracic area on chest x- rays
could indicate gas trapping (May et al., 2009). Trapped gas cannot be measured by
FRCmbw as the washout techniques only allow measurements of the ventilated lung
volume at FRC. One study reported that FRC measured by body plethysmography
(FRCpleth) was significantly increased in infants with BPD at 36 weeks’ PMA (p <
0.001), whilst FRCmbw was decreased in infants with BPD at 36 weeks’ PMA (Wauer
et al., 1998a). Furthermore, FRC measured by imaging was higher in infants with BPD
compared to infants without BPD at 39 weeks’ PMA (Yoder et al., 2019).
We report lower FRCmbw/kg in infants with moderate or severe BPD compared to
infants without BPD, which is consistent with previous reports (Hulskamp et al., 2009;
Latzin et al., 2009). However, we also found a lower IC/kg in infants with BPD
compared to infants without BPD. A decreased IC/kg indicates increased FRC in
infants with BPD, if the hypothesis that TLC is similar between infants with BPD and
without BPD holds true. Considering that FRC = TLC – IC and that we found a
decreased IC/kg in infants with BPD it is possible that we underestimated FRC (Leith
et al., 1999). Moreover, measurements of FRC adjusted for weight are only reliable if
the weights of different groups are distributed equally around a common mean.
However, infants with BPD are relatively heavy for their length. The trend towards
adecreased VT/kg in infants with BPD is an additional indicator for an increased FRC
in these infants. Similar or slightly decreased VT/kg in infants with BPD are in line
with the current literature (Hulskamp et al., 2009; Latzin et al., 2009; Mello et al.,
2015).
Crs and Cl were studied extensively in preterm infants with and without BPD in the
pre- and the post-surfactant era (5, 6, 23). Our Crs and Cl values are in line with data
reported in the literature (C. May et al., 2011). Moreover, our findings of a decreased
Crs and Cl in infants with moderate or severe BPD agrees with the current literature
(Tilo Gerhardt et al., 1987; Caroline May et al., 2011; Merth et al., 1997).

90
Infants with BPD had a lower Crs, Cl and Ccw compared to infants without BPD.
However, we could not find any difference in VE/kg or VT/kg between the two groups.
The results of the multiple linear regression analysis indicated a decrease in VE/kg or
VT/kg as the compliances decreased. Following the equation VT = ∆Pes * C infants with
a lower compliance must generate more pressure than infants with a higher compliance
in order to achieve the same VT/kg. We therefore conclude that infants with BPD
generate a greater pressure with their respiratory muscles compared to infants without
BPD. These findings are consistent with the increased contractile function of the
diaphragm we measured in very preterm infants with BPD compared to very preterm
infants without BPD at 36 weeks’ PMA (unpublished data).
5.5.1. Limitations
Limitations of our study include the small sample size. We were limited to
measurement of 23 infants in this study due to time limitations and recruitment
difficulties. We experienced technical difficulties with the measurements in three
infants and were unable to analyse their data. We suspect the statistically not
significant differences in Ccw (p = 0.056) between infants with moderate or severe
BPD and infants without BPD is due to a statistical type II error. We were unable to
perform body plethysmography measurements to compare our FRCmbw with in order
to confirm our speculations on trapped gas and therefore an incorrectly low FRCmbw
in infants with BPD.
5.5.2. Strengths
We are the first group to report data on static Crs, Cl and Ccw in preterm infants with
and without BPD in the post-surfactant era. Our comprehensive assessment of
compliances in relation to tidal breathing parameters and lung volumes enables a
thorough understanding of the compliances in very preterm infants with and without
BPD.
5.6. Conclusions
We found that the reduced Crs found in infants with BPD born in the post-surfactant
era results not only from structural alterations of the lung but from a decrease of both
Cl and Ccw. Ccw is approximatively three times Cl: Crs is mainly determined by Cl. The

91
lower Ccw in infants with BPD could be explained by an increased FRC due to gas
trapping rather than by changes in mechanical properties of chest wall tissues.
Nevertheless, the lower Ccw adds to the detrimental effects of gas trapping in infants
with BPD by increasing the work of breathing. The prolonged dependency on
respiratory support in infants with BPD compared to infants without BPD might be a
reflection of the increased work of breathing in these infants.

92
CHAPTER 6
GENERAL DISCUSSION

93
6. GENERAL DISCUSSION
6.1. Introduction
In my PhD studies I revisited the definitions of bronchopulmonary dysplasia and
focussed on the pitfalls of the current definition. The findings reported in the review
article (Chapter 2) and the manuscript published in the American Journal of
Respiratory and Critical Care Medicine, on which I was joint first author
((Svedenkrans et al., 2019a); Appendix 2) highlighted the value of the shift
measurement to quantify severity of impaired gas exchange in infants with BPD.
Quine et al. had simplified the assessment of shift to show that a single paired
measurement of SpO2 and PIO2 was accurate for shift determination (Quine et al.,
2006). However, the table published by Quine et al. was based on infants with
moderate or severe BPD and on adult haemoglobin which is inappropriate for infants
at 36 weeks’ postmenstrual age. The switch from fetal to adult haemoglobin occurs
independent of gestation around 44 weeks’ postmenstrual age (Bard & Prosmanne,
1982). The table is therefore not suited to assess the full range of respiratory morbidity
in preterm infants. Our review and prior study presented the opportunity to develop
and validate an extended simplified test covering the full range of respiratory
morbidity in preterm infants and using neonatal haemoglobin as a reference (Chapter
3).
Preterm infants with BPD and impaired pulmonary gas exchange often exhibit
laboured breathing at rest. I focused on the efficiency of diaphragm contractility and
work performed by the diaphragm during quiet breathing in infants with and without
BPD (Chapter 4). Eventually, I focussed on how the static compliance of the
respiratory system, the lung and the chest wall contribute to dysfunctional breathing
in infants with BPD (Chapter 5). Data on diaphragm function and chest wall
compliance in preterm infants with and without BPD are scarce. To the best of my
knowledge, I present the largest observational study on diaphragm function during
tidal breathing during unsedated quiet sleep in preterm infants with and without BPD.
The study on the chest wall compliance is presented in Chapter 5. I present data on
static compliance of the respiratory system, the lung and the chest wall. There is
currently no data available on static chest wall compliance in infants born in the post-
surfactant era.

94
6.2. Chapter 2 and 3. The definition of bronchopulmonary dysplasia
and a simplified bedside assessment of pulmonary gas exchange
More than 50 years have passed since BPD was first described by Northway et al in
1967 and up until today the search for an improved definition of BPD is ongoing
(Bancalari et al., 2019; Northway et al., 1967). The conundrum about the definition of
BPD has not ended since we published our review article in early 2019 (Bhandari,
2019; Isayama et al., 2019; Erik A. Jensen et al., 2019; A. H. Jobe & Abman, 2019;
Stoecklin et al., 2019; Thebaud et al., 2019). The ongoing debate is remarkable,
considering that optimal therapeutic strategies depend on the accuracy of the definition
of a disease. Interestingly, the definition of BPD used clinically is based on the
treatment of the disease, which is per se counterintuitive and probably the principal
flaw of the definition. We highlighted a number of additional pitfalls when using the
current definition of BPD and proposed a physiologically-based definition of the
disease instead. Right shift, VA/Q and shunt of the SpO2 vs. PIO2 curve in relation to
the oxyhaemoglobin dissociation curve are measures of pulmonary gas exchange.
Shift, VA/Q and shunt are suited to assess disease severity in preterm infants with BPD.
I was joint first author of our published study of right shift, VA/Q, and shunt derived
from multiple SpO2 versus PIO2 measurements in 219 very preterm infants
(Svedenkrans et al., 2019a). These studies, performed during quiet sleep using a
headbox (Figure 4) found that shift of the SpO2 vs. PIO2 curve enables assessment of
BPD severity at 36 weeks’ postmenstrual age. Shunt is mainly present in infants with
severe BPD. Thébaud et al. mentioned our physiology based assessment in their
review article on BPD as an improved assessment of the physiological test proposed
by Walsh et al., but questioned whether the bedside assessment could be used outside
a research setting (Thebaud et al., 2019; Walsh et al., 2003; Walsh et al., 2004).
Moreover, the importance of this forerunner study was highlighted by Jobe et al., who
suggested that this physiological test was their preferred approach to assess BPD
severity and asked for a simplified bedside assessment of shift of the SpO2 vs. PIO2
curve in May 2019 (A. H. Jobe & Abman, 2019).
Quine et al. presented such a test in 2006, but as mentioned above the test was based
on data suffering from moderate or severe BPD and they used adult haemoglobin as
the reference curve. Therefore, an extended table covering the full range of disease

95
severity and based on fetal haemoglobin is required to accurately assess pulmonary
gas exchange in preterm infants at 36 weeks’ postmenstrual age. The development of
such a simplified bedside assessment of shift that could be implemented as a
component of routine clinical practice was the aim of my first study. Using a similar
approach described by Quine et al I developed a prediction table for shift of the SpO2
vs. PIO2 curve based on the data of the 219 infants reported in Svedenkrans et al
(Svedenkrans et al., 2019a). The same study comprises the validation of the prediction
table in a different cohort of extremely preterm infants (n = 63). The prediction table
for shift of the SpO2 vs. PIO2 curve enables bedside assessment of shift by recording
the data from the patient monitor without the need for any additional devices.
Moreover, the infant does not have to be disturbed, as the data are recorded during
quiet sleep. Simultaneous measurements of SpO2 and FIO2 are collected over a
duration of 15 minutes at one minute intervals. FIO2 needs to be converted into PIO2
using the equation PIO2 = FiO2 x (barometric pressure – saturated water vapour
pressure). The measurements are subsequently averaged to a single paired SpO2 versus
PIO2 measurement, which is the basis for the prediction of shift from our table (Table
7, extended version Table 33).
In summary, we show that the prediction table is accurate at a population level and the
bedside assessment allows screening for and identification of infants who have
increased right shift and who may require the more comprehensive assessment of
pulmonary gas exchange using a headbox. The assessment of pulmonary gas exchange
at the bedside can be used across the world independent of altitude. Moreover, the
results can be used as an outcome measure for clinical trials and for benchmarking
purposes in neonatal intensive care units. The simplified bedside assessment of
pulmonary gas exchange can be used outside the research setting, which was one of
the concerns mentioned by Thébaud et al. in late 2019 (Thebaud et al., 2019). I also
developed an excel file with a look up function for the shift value dependent on the
entered single paired SpO2 vs. PIO2 measurement. The excel file can be used to look
up shift from the prediction table up to 100 infants at the same time and could be
extended upon request. This tool is especially valuable in research settings or in large
neonatal intensive care units, where the data of many infants have to be analysed
within a short period of time.

96
The study on the simplified bedside assessment of pulmonary gas exchange in preterm
infants with and without BPD has two main limitations. Most importantly, the shift
values derived from a single paired SpO2 vs. PIO2 measurement are less accurate at an
individual level than the more comprehensive headbox assessment using multiple
paired SpO2 vs. PIO2 measurements. In other words, the simplified bedside assessment
is suited for benchmarking purposes in neonatal units across the world, but the results
from an individual preterm infant need to be treated cautiously. We recommend using
the simplified assessment for objective screening and identification of infants who
may benefit from the comprehensive assessment of pulmonary gas exchange.
However, the Australian and New Zealand Neonatal Network has already
implemented the bedside assessment for benchmarking purposes at 36 weeks’
postmenstrual age. A second limitation is decreasing accuracy of the prediction of shift
at SpO2 values > 94 %. This limitation is explained by the natural shape of the
oxyhaemoglobin dissociation curve. The oxyhaemoglobin dissociation curve
resembles an almost vertical line at SpO2 < 94%, followed by a curve at SpO2 94 % -
96 %, which subsequently ends in horizontal line at SpO2 > 97 % (Figure 4). A reliable
prediction of a vertical line is mathematically possible, whereas a minimum of three
points are required to predict a curve. These limitations lead to the future directions
and potential new research projects for this bedside test.
6.2.1. Future directions: Definition of bronchopulmonary dysplasia and
the assessment of pulmonary gas exchange
Future research should aim for a simplified and more accurate assessment of shift at
an individual level. The development of such a tool would enable a continuous
assessment of BPD severity. A continuous assessment of BPD severity is a long –
desired feature for any new BPD definition. Currently most clinical trials define BPD
as a binary outcome based on either oxygen dependency ≥ 28 days or on oxygen
dependency at 36 weeks’ postmenstrual age (Ciuffini et al., 2018; Gomez Pomar et
al., 2018). Interestingly, these assessments date back to the NIH workshops on BPD
held in 1979 and 2001 and to the Shennan definition published in 1988 (A. H. Jobe &
Bancalari, 2001; Shennan et al., 1988; "Workshop on bronchopulmonary dysplasia.
Sponsored by the Division of Lung Diseases. National Heart, Lung, and Blood
Institute, National Institutes of Health," 1979). The use of a categorical or a binary
97
BPD definition as an outcome variable in clinical trials has several drawbacks
including: a) loss of information, b) reduction in statistical power and c) increasing
risk of false positive results (Altman et al., 2006). Therefore, a continuous outcome
measure for BPD would facilitate reflection of the whole spectrum of the disease and
enable smaller studies without the loss of valuable information.
A second important aim of future work is to investigate whether the assessment of
pulmonary gas exchange at 36 weeks’ postmenstrual age predicts long-term sequelae
in preterm infants with BPD. One of the pitfalls of current BPD definitions is the lack
of accuracy in the prediction of long-term negative outcomes (Ciuffini et al., 2018;
Onland et al., 2013; Poindexter, Feng, et al., 2015; Poindexter & Jobe, 2015). So far,
prediction of long-term outcomes was never investigated prior to implementation of
any previous BPD definition.
Eventually, in my next project I will investigate whether the simplified bedside
assessment of pulmonary gas exchange can be used as a prediction tool for BPD. I
have therefore collected sequential weekly data sets and used the prediction table
developed in Chapter 3 to estimate right shift in 32 extremely preterm infants from
birth until 4 weeks of age. The preliminary data from this follow-up study suggest that
a shift value of 13.3 kPa at one week of age predicts BPD with a sensitivity of 73.7 %
and a specificity of 92.3 % (AUC:0.85, p = 0.001). Moreover, a shift value of 14.3 kPa
at one week of life predicts moderate and severe BPD at 36 weeks’ postmenstrual age
with 66.7% sensitivity and 78.3% specificity (AUC:0.76, p = 0.026). These data were
presented at the congress of joint European Neonatal Societies (jENS) in Maastricht
in September 2019 ("3rd Congress of Joint European Neonatal Societies (jENS
2019)," 2019) (Appendix 2.7). Moreover, I was to give an oral presentation at the
Australian and New Zealand Perinatal Society (PSANZ) conference in Sydney in
April 2020. Unfortunately, the conference was cancelled due to the SARS-CoV-2
pandemic (Appendix 2.7).
Eventually, future studies are required to investigate the reproducibility of the test
results when the test is performed on consecutive days. A high reproducibility of the
test would further support the implementation and routine use of the test in clinical
practice.

98
The clinical value of the test was recognised by the Australian and New Zealand
Neonatal Network (ANZNN), who instituted it into routine follow up for preterm
infants as part of clinical benchmarking. I was awarded the competitive Emerge Health
Neonatal Research Award in 2019 by the Australian and New Zealand Neonatal
Network for my work on the prediction table of shift. Moreover, shift was used in the
enteral vitamin A administration trial for the prevention of BPD (EVARO;
(Rakshasbhuvankar et al., 2017).

99
6.3. Chapter 4: Diaphragm function in very preterm infants at 36
weeks’ postmenstrual age
In the second study of my PhD I investigated the impact of ante- and postnatal factors
on diaphragm function in very preterm infants at 36 weeks’ postmenstrual age. We
assessed diaphragm contractility and work performed by the diaphragm during quiet
sleep in a subset of 182 preterm infants of the cohort of infants reported in Svedenkrans
et al (Svedenkrans et al., 2019a). We subsequently related the measures of diaphragm
function to breathing parameters, such as tidal volume, respiratory rate and minute
ventilation. We used a dual-tipped pressure transducer with the distal transducer
placed in the stomach and the proximal transducer placed in the oesophagus to assess
transdiaphragmatic pressure and work of the diaphragm (Figure 12).
Transdiaphragmatic pressure (Pdi) was calculated from the average waveform
amplitude of at least 10 breaths. Breaths with different inspiratory and expiratory
volumes, sighs and breaths during periodic breathing were excluded from the analysis.
The average pressure-time integral of the transdiaphragmatic pressure (PTIdi) during
inspiration represents the work performed by the diaphragm. Pdi was adjusted for tidal
Figure 12. Position of the two tips of the pressure transducer.

100
volume (Pdi/VT) and PTIdi for respiratory rate (PTIdi•min-1) as a proxy for diaphragm
work performed per minute.
Our hypotheses were based on findings from animal studies, infants and from human
adult patients (Gabriel Dimitriou et al., 2003; G. Dimitriou et al., 2001; Hutten et al.,
2010; Jaber, Jung, et al., 2011; Knisely et al., 1988; Levine et al., 2008; Liang et al.,
2019; Song et al., 2014; Vassilakopoulos & Petrof, 2004). These studies arose in part
from observations made by my colleagues using the preterm ovine model at the
Preclinical Intensive Care Research Unit (PICRU) at the University of Western
Australia (Karisnan et al., 2017; Lavin et al., 2013; Song, Karisnan, et al., 2013; Song
& Pillow, 2013; Song, Pinniger, et al., 2013).
We hypothesised that infants with BPD will have decreased diaphragm efficiency and
exert increased diaphragm work per minute compared to their healthier counterparts.
Moreover, we hypothesised that prematurity, poor intrauterine growth, decreased
postnatal nutrition and increased duration of respiratory support and oxygen therapy
will lead to impaired diaphragm contractility and increased work performed by the
diaphragm at 36 weeks’ postmenstrual age.
In summary, we found a less compliant chest wall in infants with BPD (Chapter 5).
Moreover, we found decreased postnatal caloric intake improved efficiency of
diaphragm contractile function and decreased diaphragmatic workload. A possible
explanation for this finding is the less compliant chest wall in the infants with less
caloric intake. According to our findings in the diaphragm study, infants with BPD
received less calories within the first 28 days of life. A lower chest wall compliance
would decrease chest wall distortion during breathing and could explain the decrease
in Pdi/VT and PTIdi•min-1. Another potential explanation are differences in muscle
fibre composition, such that infants with BPD have a higher content in type IIA fibres,
which are stronger and less fatiguable. Improved antenatal nutrition in rat pubs leads
to a higher content in type II muscle fibres and our infants with BPD had higher weight
Z-scores at birth compared to infants without BPD indicating improved intrauterine
growth.
Efficiency of diaphragm contractile function measured as Pdi/VT improved in infants
with improved intrauterine growth.
101
However, even though postnatal caloric intake and intrauterine growth were
statistically significant predictors of diaphragm contractile function and diaphragmatic
work of breathing at 36 weeks’ postmenstrual age, their contribution to diaphragm
function was minimal. Moreover, we found no evidence that diaphragm function is
decreased in infants born more premature or in infants with BPD. In contrast, infants
with BPD had improved efficiency of the diaphragm and decreased work
diaphragmatic work of breathing. We suspect these findings are again related to the
decrease in chest wall compliance in infants with BPD and potentially due to an
increased activity of the accessory respiratory muscles. Moreover, infants with
increased dependency on mechanical ventilation did not show a decrease in diaphragm
function, which could be related to the time interval between extubation and the
assessment. We therefore conclude that so far unexplored antenatal and postnatal
factors influence diaphragm function in preterm infants at 36 weeks’ postmenstrual
age.
A limitation of our study is, that we measured diaphragm contractility and work
performed by the diaphragm whilst the infants were breathing through a facemask
attached to an ultrasonic flowmeter. We have, therefore, potentially overestimated
diaphragm function due to increased resistance when using the equipment compared
to infants breathing without additional impedance. However, measurements recorded
during tidal breathing without the face mask were highly variable, making a sensible
analysis of these data impossible.
6.3.1. Future directions for the assessment of diaphragm function in
preterm infants
Ventilator induced diaphragm dysfunction (VIDD) was described in animals, in
children and human adult patients (Glau et al., 2018; Jaber, Jung, et al., 2011; Jaber,
Petrof, et al., 2011; Liang et al., 2019). However, all of these studies were conducted
whilst the animal or the adult patient was either on mechanical ventilation or was
measured shortly after extubation. Our study was performed at 36 weeks’
postmenstrual age and our infants were off mechanical ventilation for a mean of 47 (±
15) days before the assessment. We cannot exclude VIDD in our infants. However,
our findings indicate that diaphragm function assessed at 36 weeks’ postmenstrual age
is similar between infants who were mechanically ventilated and infants who were

102
not. Nevertheless, our physiologic assessment does not allow us to rule out structural
damage in the muscle fibres of the diaphragm of infants who were mechanically
ventilated.
We suspect VIDD might be less pronounced in preterm infants compared to children
and adults. In one study, full mechanical ventilation was compared with pressure
support ventilation in rats (Futier et al., 2008). During full mechanical ventilation the
diaphragm and respiratory muscles are inactive, whereas during pressure support
ventilation diaphragm activity is preserved. Rats on pressure support ventilation
showed a reduction in ventilation – induced proteolysis and inhibition of protein
synthesis potentially leading to decreased VIDD (Futier et al., 2008). In a study
performed in children admitted to a paediatric intensive care unit, diaphragm function
assessed by ultrasound correlated positively with the spontaneous breathing effort
during mechanical ventilation (Glau et al., 2018). Preterm infants are rarely on full
mechanical ventilation and most ventilatory modes used in preterm infants preserve
spontaneous breathing and therefore diaphragm activity (van Kaam et al., 2019).
Nevertheless, whether VIDD is present and of clinical importance in preterm infants
warrants further investigations.
Prolonged corticoid steroid exposure in rats leads to diaphragm muscle atrophy and
reduced isometric force (van Balkom et al., 1997). Data on postnatal steroid exposure
and diaphragm function in preterm infants are limited, as postnatal steroids are only
used as a rescue therapy in infants with evolving severe BPD. The effects of postnatal
steroid exposure on diaphragm function could be explored in a future adequately
powered matched case/controlled study.
103
6.4. Chapter 5: Respiratory and chest wall mechanics in very
preterm infants
In the third study of my PhD, I investigated the static compliance of the respiratory
system (Crs), the lung (Cl) and chest wall compliance (Ccw). Data on static Crs, Cl and
Ccw are scarce in preterm infants with and without BPD. Moreover, data on Ccw date
back to the pre- surfactant era (T. Gerhardt & Bancalari, 1980; Heldt & McIlroy,
1987). We measured static Crs, Cl and Ccw during a short apnoea provoked by the
Hering- Breuer reflex, whilst the infants were asleep. We did not use any sedation. We
kept the maximum positive inspiratory pressure stable at 20 cm H2O and released the
pressure to a positive end- expiratory pressure of 5 cm H20. Pleural pressure was
measured as shown in Figure 12. Lung volume was measured indirectly by respiratory
inductance plethysmography. Crs, Cl and Ccw were calculated using the equations Crs
= ∆V / ∆ Pao, Cl = ∆V / ∆ (Pao – Ppl) and Ccw = ∆V / ∆ Ppl, where ∆V is the change in
lung volume, ∆ Pao the change in pressure at the mouth and ∆ Ppl the change in pleural
pressure between the positive inspiratory pressure and positive end – expiratory
pressure.
We hypothesised that static Crs, Cl and Ccw are decreased in infants with BPD
compared to infants without BPD.
To the best of our knowledge, this is the first study in the post- surfactant era to
investigate static Crs, Cl and Ccw in preterm infants with and without BPD at 36 weeks’
postmenstrual age. Gerhardt et al. and Heldt et al. described Ccw in infants born in the
pre- surfactant era, but these data have limited relevance to infants born in the post-
surfactant era (T. Gerhardt & Bancalari, 1980; Heldt & McIlroy, 1987).
In contrast to our results, Gerhardt et al. reported a much higher Ccw in their cohort of
preterm infants but a similar relationship between Ccw and Cl with the Ccw three times
higher than the Cl. We suspect the higher Ccw reported by Gerhardt et al. is a result of
several factors including differences in postnatal age at test, differences in the
methodology of the measurements (intubated versus self-ventilating infants), and
differences in the use of surfactant. Heldt reported slightly lower Ccw, but measured
the static Ccw during an occlusion at end-expiration without prior inflation of the lung.
In other words, the maximum intrathoracic volume in the infants studied by Heldt et

104
al. was lower compared to our cohort of infants, which might explain the lower Ccw.
In contrast to previous studies, we related our findings to breathing parameters and
lung volumes measured in the same cohort of infants. We measured tidal volume,
respiratory rate and minute ventilation as well as functional residual capacity,
inspiratory capacity and markers of paradoxical breathing.
In summary, we found that the reduced Crs in infants with BPD born in the post-
surfactant era is a result of a decrease in Cl and Ccw. The decreased Ccw in infants with
BPD is likely due to an increased functional residual capacity due to gas trapping
rather than changes in mechanical properties of chest wall tissues. The lower Ccw adds
to the detrimental effects of gas trapping in infants with BPD by increasing the work
of breathing. The prolonged dependency on respiratory support in infants with BPD
compared to infants without BPD might be a reflection of the increased work of
breathing in these infants. Moreover, our results of the multiple linear regression
analysis indicated a decrease in VE/kg or VT/kg as the compliances decreased. VT/kg
was equal between infants with BPD and infants without BPD. Based on the equation
VT = ∆Pes * C we conclude that infants with BPD generate a greater pressure with their
respiratory muscles compared to infants without BPD in order to achieve the same
VT/kg. These findings are consistent with the increased contractile function of the
diaphragm we measured in very preterm infants with BPD compared to very preterm
infants without BPD at 36 weeks’ PMA (Chapter 4.4.).
Limitations of our study include the limited sample size. We were only able to measure
23 very preterm infants at 36 weeks’ postmenstrual age due to time constraints. Many
parents declined the measurements due to the provoked apnoea and the need for the
introduction of a pressure transducer into the oesophagus. Moreover, we were unable
to measure three infants due to technical issue related to the equipment.
6.4.1. Future directions: Assessment of chest wall compliance in preterm
infants
Future research should focus on the underlying cause for a lower Ccw in infants with
moderate and severe BPD compared to infants without BPD. However, even though
the difference in Ccw is statistically significant, I do not think that the Ccw is playing a
key role in the pathophysiology of BPD and the related breathing disorder. We know

105
that the Crs and Cl are lower in infants with BPD. The results of our study are in line
with these findings. As mentioned above measurements of Ccw are complex and
invasive and I think it will be very difficult to measure Ccw in a large cohort of infants.
Hence, while these data are informative, these measurements are unlikely to play a
role in routine clinical management or disease characterisation outside the research
setting.
106
6.5. Limitations of my PhD studies
Partitioned measurements of lung and chest wall compliance can be obtained using
single or multiple occlusion techniques, weighted spirometry or low-frequency forced
oscillation technique (Gappa et al., 2001; Merth et al., 1997; Pillow et al., 2005).
Independent of the method used, the respiratory muscles need to be relaxed during the
measurements. Pleural pressure is estimated either from a pressure measurement at the
airway opening (single and multiple occlusion techniques, weighted spirometry)
during zero flow or a pressure measurement in the oesophagus.
Forced oscillation technique (FOT) was first described by DuBois et al. in 1956
(Dubois et al., 1956). A loudspeaker is used to produce a pressure wave that is applied
to the airway via a face mask. The resultant changes in flow dependent on the
frequency applied can be measured at the airway opening (Frey, 2005; Hantos et al.,
2015; Pillow et al., 2005). Impedance describes the response of the respiratory system
to the pressure wave dependent on the frequency applied (Frey, 2005). Impedance
contains the values of resistance of the respiratory system, the compliance and the
inertance (Frey, 2005). Therefore, using FOT allows partitioning of the signal and
calculation of the compliance. Low-frequency oscillations (1-2 Hz) are used to
investigate tissue compliance including the chest wall, but are only possible during a
short apnoea provoked by the Hering- Breuer reflex (Frey, 2005).
An advantage of the FOT technique compared to other methods is the option to further
distinguish between the airway and tissue impedance when applying a pseudo-random
noise with a range of frequencies to the airway. We were measuring FOT using a
frequency range between 1 – 12 Hz dependent on the frequency. The lower end of the
frequency range provides information on the tissue and the higher end of the frequency
range information on the airways (Frey, 2005).
We aimed to assess the compliance of the chest wall using the low- frequency FOT.
We managed to perform FOT measurements in 70 infants out of 85 very preterm
infants at 36 weeks’ postmenstrual age. In the remaining 15 infants we were unable to
evoke the Hering-Breuer reflex or the apnoea provoked was too short to perform the
measurements. We experienced unforeseen difficulties related to the signal to noise
ratio (heart beat and low frequency oscillations) in the final analysis of the data and

107
were unable to partition our measurements into compliance of the respiratory system,
lung and chest wall. As such we were only able to report data on the whole respiratory
system and the lung but not the chest wall. I presented these data at the European
Respiratory Society meeting in Milan in Italy in 2017 (B. Stoecklin, Simpson, et al.,
2017) (Appendix A2.3).
We subsequently changed the methodology and measured the static compliance of the
respiratory system, the lung and the chest wall during a short apnoea evoked by the
Hering-Breuer reflex. Infants were positioned supine and quietly asleep, whilst we
were applying a positive inspiratory pressure of 20 cm H2O. Once the Hering- Breuer
reflex was triggered, we released the pressure to a positive end- expiratory pressure of
5 cmH2O. Pressure measurements at the airway opening and in the oesophagus were
recorded simultaneously and used to calculate static compliance of the respiratory
system, the lung and the chest wall (the method is described in more detail in Chapter
5.3.4.). Using this method, we were assuming a constant compliance across different
volumes reflected by a linear pressure volume curve and we were assuming that
change in oesophageal pressure is equal to pleural pressure, which is correct as long
as there is no leak and zero flow. However, despite the successful use of this method,
we were only able to measure 23 preterm infants due to time limitations.

108
6.6. How does the research presented enhance current knowledge
I present a comprehensive review of the definitions of BPD since the disease was first
described in 1967 (Northway et al., 1967). The review article was published in the
journal Paediatric Respiratory Reviews (Stoecklin et al., 2019). The review article
includes an extensive list of pitfalls of the current BPD definitions and provides the
background information needed to understand why a physiological based definition is
superior to a treatment based definition. Writing a list with the pitfalls of the current
BPD definitions is per se nothing extraordinary, as many authors have expressed their
concerns when using currently available BPD definitions (Bhandari, 2019; Ehrenkranz
et al., 2005; Gomez Pomar et al., 2018; A. H. Jobe & Bancalari, 2017; A. H. Jobe &
Steinhorn, 2017; Poindexter & Jobe, 2015). However, the combination of a review of
BPD definitions, together with the list of pitfalls and the proposed new definition of
BPD is novel. Moreover, I do not stop with the suggestion for a new BPD definition,
but describe a potential assessment in Chapter 3.
I present a bedside assessment of pulmonary gas exchange in preterm infants in
Chapter 3. BPD is a multifactorial disease and clinicians urgently need a tool to better
assess the underlying pathophysiology of BPD. The assessment of pulmonary gas
exchange either by the oxygen reduction test or the bedside assessment is a first step
in this direction. As an example, infants breathing room air, but are dependent on
positive airway pressure ventilation have most likely a different pathophysiology
compared to infants who require a high amount of oxygen without positive airway
pressure ventilation at 36 weeks’ postmenstrual age. However, currently both infants
will be categorised as having severe BPD. Shift of the SpO2 vs PIO2 curve enables
distinction between these two infants and might help to tailor and enhance therapy in
these infants.
We expect our prediction table for right shift will be considered an important tool for
clinicians aiming to quantify severity of BPD, and will be considered as an element of
a future functional definition of BPD. Thébaud et al. mentioned the oxygen reduction
test in his extensive review article on BPD published in late 2019, but was doubtful
about the applicability in clinical practice (Thebaud et al., 2019). We agree, that the
comprehensive oxygen reduction test is not suited for daily use in the clinical setting
and we have therefore, developed the simplified bedside assessment of pulmonary gas
109
enabling clinicians around the world to perform the test in the clinical setting (Chapter
3). Jobe et al. suggested the assessment of pulmonary gas exchange could be combined
with other physiologic parameters such as CO2 elimination and maybe even magnetic
resonance imaging (MRI) (A. H. Jobe & Abman, 2019).
I present data on diaphragm contractility and work performed by the diaphragm during
quiet sleep, which are so far not available in the literature. Moreover, this is the largest
study on diaphragm function in preterm infants at 36 weeks’ postmenstrual age. We
deliberately chose to measure diaphragm contractility and work performed by the
diaphragm during quiet sleep, as preterm infants with BPD and with impaired
pulmonary gas exchange exhibit laboured breathing during rest. We found more
efficient contractile force and lower diaphragmatic work of breathing in infants with
BPD, which appears controversial given that infants with BPD are showed alterations
in their breathing pattern including a higher minute ventilation. We suspect that our
findings are related to an increased activity of the accessory respiratory muscles and a
decreased compliance of the chest wall in these infants.
In the last study of my PhD, I present data on the static compliance of the chest wall
in infants with and without BPD. This is the first study reporting static chest wall
compliance in the post- surfactant era. We assessed 23 infants and found a decreased
chest wall compliance in infants with BPD. These findings are in line with our findings
on diaphragm function. We suspect the decrease in chest wall compliance is a result
of a higher functional residual capacity due to gas trapping and potentially of a sign of
increased activity of the accessory respiratory muscles.
Overall, the findings of a decreased diaphragm contractile force and diaphragmatic
work of breathing can be explained by the stiffer chest wall in these infants. As
mentioned in the introduction, the chest wall acts as an anker for the respiratory
muscles. Therefore, the stiffer chest wall would lead to a more efficient diaphragm
activity during rest measured as contractile force and diaphragmatic work of breathing.
However, whether the chest wall is stiff enough to withhold the diaphragm activity
during increased respiratory demand such as sucking or respiratory tract infections
cannot be answered with our data. A potential way to answer such questions is the
assessment of diaphragm function using forced manoeuvres such as phrenic nerve
stimulation.

110
6.7. Future directions
My main aim was to characterise the breathing disorder present in infants with BPD.
I measured pulmonary gas exchange, diaphragm function and the compliance of the
chest wall. Moreover, I measured the right ventricular function of the heart in a subset
of infants, but these data are preliminary and not yet ready for publication hence
beyond the scope of this thesis (Appendix 2.4 and 2.5). I have also measured tidal
breathing parameters and lung volumes in the majority of infants. The results of all
these studies build the foundation for the final analysis in which I will investigate how
each factor contributes to the breathing disorder present in infants with BPD.
Looking at the data I collected and analysed so far, I can conclude that a) we have
developed a promising bedside assessment of pulmonary gas exchange suited for
preterm infants up until 44 weeks’ postmenstrual age, however, the bedside
assessment requires refinement, before it can be used at an individual level; b)
Diaphragmatic contractility and work performed by the diaphragm during quiet sleep
are decreased in infants with BPD. However, we potentially missed valuable
information on maximum force of the diaphragm, as we did not use any forced
manoeuvres such as phrenic nerve stimulation; c) The static Ccw seems to contribute
minimally to the breathing disorder present in infants with BPD, but might explain the
decreased diaphragmatic contractility and work performed by the diaphragm in infants
with BPD.
6.8. Summary and Conclusion
The novel findings in this thesis include a) a thorough rationale for a physiology based
rather than a treatment based definition of BPD; b) the development of a bedside
assessment of pulmonary gas exchange that can be used to assess BPD severity in a
physiological way and enables clinicians to assess pulmonary gas exchange on a daily
basis. Moreover, the bedside assessment is suited for benchmarking purposes of
neonatal units across the world; c) Increased efficiency of diaphragm contractile force
and decreased diaphragmatic work of breathing in infants with BPD, which seems
controversial, but ; d) the first measurements of static chest wall compliance in infants
born in the post- surfactant era show a decreased compliance of the chest wall in

111
infants with BPD, which potentially explains the enhanced efficiency of diaphragm
contractile force and decreased diaphragmatic work in infants with BPD.

112
CHAPTER 7
REFERENCES

113
7. REFERENCES
3rd Congress of Joint European Neonatal Societies (jENS 2019). (2019). Pediatric
Research, 86(1), 1-64. doi:10.1038/s41390-019-0521-6
Albertine, K. H., Jones, G. P., Starcher, B. C., Bohnsack, J. F., Davis, P. L., Cho, S.
C., . . . Bland, R. D. (1999). Chronic lung injury in preterm lambs.
Disordered respiratory tract development. Am J Respir Crit Care Med,
159(3), 945-958. doi:10.1164/ajrccm.159.3.9804027
Allan, D. W., & Greer, J. J. (1997). Embryogenesis of the phrenic nerve and
diaphragm in the fetal rat. J Comp Neurol, 382(4), 459-468.
doi:10.1002/(sici)1096-9861(19970616)382:4<459::aid-cne3>3.0.co;2-1
Allen, J. L., Greenspan, J. S., Deoras, K. S., Keklikian, E., Wolfson, M. R., &
Shaffer, T. H. (1991). Interaction between chest wall motion and lung
mechanics in normal infants and infants with bronchopulmonary dysplasia.
Pediatric Pulmonology, 11(1), 37-43. doi:10.1002/ppul.1950110107
Alphonse, R. S., Rajabali, S., & Thébaud, B. (2012). Lung Injury in Preterm
Neonates: The Role and Therapeutic Potential of Stem Cells. Antioxidants &
Redox Signaling, 17(7), 1013-1040. doi:10.1089/ars.2011.4267
Altman, D. G., & Royston, P. (2006). The cost of dichotomising continuous
variables. BMJ (Clinical research ed.), 332(7549), 1080-1080.
doi:10.1136/bmj.332.7549.1080
Ambalavanan, N., Carlo, W. A., D'Angio, C. T., McDonald, S. A., Das, A.,
Schendel, D., . . . Human Development Neonatal Research, N. (2009).
Cytokines associated with bronchopulmonary dysplasia or death in extremely
low birth weight infants. Pediatrics, 123(4), 1132-1141.
doi:10.1542/peds.2008-0526
Babata, K., & McGuirl, J. (2018). Are we ready to modify our definition of
bronchopulmonary dysplasia (BPD) to improve prognostication? J Perinatol,
38(3), 203-205. doi:10.1038/s41372-017-0012-8
Bader, M. E., & Bader, R. A. (1955). The work of breathing. Am J Med, 18(6), 851-
854. doi:10.1016/0002-9343(55)90168-6
Baillie, J. K. (2010). www.altitude.org.
Bains, K. N. S., Kashyap, S., & Lappin, S. L. (2020). Anatomy, Thorax, Diaphragm.
In StatPearls. Treasure Island (FL): StatPearls Publishing
Copyright © 2020, StatPearls Publishing LLC.
Bamat, N., Ghavam, S., Liu, Y., DeMauro, S. B., Jensen, E. A., Roberts, R., . . .
Kirpalani, H. (2015). Reliability of a Noninvasive Measure of V./Q.
Mismatch for Bronchopulmonary Dysplasia. Ann Am Thorac Soc, 12(5),
727-733. doi:10.1513/AnnalsATS.201410-462OC

114
Bancalari, E., Abdenour, G. E., Feller, R., & Gannon, J. (1979). Bronchopulmonary
dysplasia: clinical presentation. J Pediatr, 95(5 Pt 2), 819-823.
Bancalari, E., Claure, N., & Sosenko, I. R. (2003). Bronchopulmonary dysplasia:
changes in pathogenesis, epidemiology and definition. Semin Neonatol, 8(1),
63-71.
Bancalari, E., & del Moral, T. (2001). Bronchopulmonary dysplasia and surfactant.
Biol Neonate, 80 Suppl 1, 7-13. doi:10.1159/000047170
Bancalari, E., & Jain, D. (2018). Bronchopulmonary Dysplasia: Can We Agree on a
Definition? Am J Perinatol, 35(6), 537-540. doi:10.1055/s-0038-1637761
Bancalari, E., & Jain, D. (2019). Bronchopulmonary Dysplasia: 50 Years after the
Original Description. Neonatology, 115(4), 384-391. doi:10.1159/000497422
Baraldi, E., & Filippone, M. (2007). Chronic lung disease after premature birth. N
Engl J Med, 357(19), 1946-1955. doi:10.1056/NEJMra067279
Bard, H., & Prosmanne, J. (1982). Postnatal fetal and adult hemoglobin synthesis is
preterm infants whose birth weight was less than 1,000 grams. J Clin Invest,
70(1), 50-52. doi:10.1172/jci110602
Berger, T. M., Fontana, M., & Stocker, M. (2013). The journey towards lung
protective respiratory support in preterm neonates. Neonatology, 104(4), 265-
274. doi:10.1159/000354419
Berglund, S. K., Lindberg, J., Westrup, B., & Domellof, M. (2014). Effects of iron
supplements and perinatal factors on fetal hemoglobin disappearance in LBW
infants. Pediatr Res, 76(5), 477-482. doi:10.1038/pr.2014.116
Bhandari, V. (2019). Designing a better definition of bronchopulmonary dysplasia.
Pediatric Pulmonology, 54(6), 678-679. doi:10.1002/ppul.24305
Bhat, P., Peacock, J. L., Rafferty, G. F., Hannam, S., & Greenough, A. (2016).
Prediction of infant extubation outcomes using the tension-time index.
Archives of Disease in Childhood - Fetal and Neonatal Edition, 101(5),
F444-F447. doi:10.1136/archdischild-2015-309264
Bland, R. D. (2005). Neonatal chronic lung disease in the post-surfactant era. Biol
Neonate, 88(3), 181-191. doi:10.1159/000087581
Blencowe, H., Cousens, S., Oestergaard, M. Z., Chou, D., Moller, A. B., Narwal, R.,
. . . Lawn, J. E. (2012). National, regional, and worldwide estimates of
preterm birth rates in the year 2010 with time trends since 1990 for selected
countries: a systematic analysis and implications. Lancet, 379(9832), 2162-
2172. doi:10.1016/S0140-6736(12)60820-4
Boddy, K., & Dawes, G. S. (1975). Fetal breathing. Br Med Bull, 31(1), 3-7.
doi:10.1093/oxfordjournals.bmb.a071237

115
Breysem, L., Smet, M. H., Van Lierde, S., Devlieger, H., & De Boeck, K. (1997).
Bronchopulmonary dysplasia: correlation of radiographic and clinical
findings. Pediatr Radiol, 27(8), 642-646. doi:10.1007/s002470050203
Britton, J. R. (2012). Altitude, oxygen and the definition of bronchopulmonary
dysplasia. J Perinatol, 32(11), 880-885. doi:10.1038/jp.2012.6
Burri, P. H. (2006). Structural Aspects of Postnatal Lung Development – Alveolar
Formation and Growth. Neonatology, 89(4), 313-322.
Carlo, W. A., Martin, R. J., Versteegh, F. G., Goldman, M. D., Robertson, S. S., &
Fanaroff, A. A. (1982). The effect of respiratory distress syndrome on chest
wall movements and respiratory pauses in preterm infants. American Review
of Respiratory Disease, 126(1), 103-107.
Chawanpaiboon, S., Vogel, J. P., Moller, A.-B., Lumbiganon, P., Petzold, M.,
Hogan, D., . . . Gülmezoglu, A. M. (2019). Global, regional, and national
estimates of levels of preterm birth in 2014: a systematic review and
modelling analysis. The Lancet Global Health, 7(1), e37-e46.
doi:10.1016/S2214-109X(18)30451-0
Cheong, J. L., & Doyle, L. W. (2012). Increasing rates of prematurity and
epidemiology of late preterm birth. In (Vol. 48, pp. 784-788). Melbourne,
Australia: Blackwell Publishing Asia.
Cheong, J. L. Y., & Doyle, L. W. (2018). An update on pulmonary and
neurodevelopmental outcomes of bronchopulmonary dysplasia. Semin
Perinatol, 42(7), 478-484. doi:10.1053/j.semperi.2018.09.013
Chow, S. S. W., Creighton, P., Chambers, G. M., & Lui, K. (2019). Report of the
Australian and New Zealand Neonatal Network 2017. Sydney: ANZNN.
Ciuffini, F., Robertson, C. F., & Tingay, D. G. (2018). How best to capture the
respiratory consequences of prematurity? European Respiratory Review,
27(147), 170108. doi:10.1183/16000617.0108-2017
Clugston, R. D., & Greer, J. J. (2007). Diaphragm development and congenital
diaphragmatic hernia. Semin Pediatr Surg, 16(2), 94-100.
doi:10.1053/j.sempedsurg.2007.01.004
Coalson, J. J., Winter, V., & deLemos, R. A. (1995). Decreased alveolarization in
baboon survivors with bronchopulmonary dysplasia. Am J Respir Crit Care
Med, 152(2), 640-646. doi:10.1164/ajrccm.152.2.7633720
Concurrent Abstracts Session Five: Wednesday 25th May 1330-1500. (2016).
Journal of Paediatrics and Child Health, 52(S2), 105-124.
doi:doi:10.1111/jpc.13194_4
116
Corbet, A. J., Ross, J. A., & Beaudry, P. H. (1975). The effect of age on arterial--
alveolar nitrogen difference in normal adults. Can J Physiol Pharmacol,
53(1), 63-66.
Costeloe, K. L., Hennessy, E. M., Haider, S., Stacey, F., Marlow, N., & Draper, E. S.
(2012). Short term outcomes after extreme preterm birth in England:
comparison of two birth cohorts in 1995 and 2006 (the EPICure studies).
BMJ, 345, e7976. doi:10.1136/bmj.e7976
Curran-Everett, D. (2006). A classic learning opportunity from Fenn, Rahn, and Otis
(1946): the alveolar gas equation. Advances in Physiology Education, 30(2),
58-62. doi:10.1152/advan.00076.2005
Curstedt, T., Halliday, H. L., & Speer, C. P. (2015). A Unique Story in Neonatal
Research: The Development of a Porcine Surfactant. Neonatology, 107(4),
321-329.
Dassios, T., Ali, K., Rossor, T., & Greenough, A. (2017). Ventilation/perfusion ratio
and right to left shunt in healthy newborn infants. J Clin Monit Comput,
31(6), 1229-1234. doi:10.1007/s10877-016-9969-7
Dassios, T., Curley, A., Morley, C., & Ross-Russell, R. (2015). Using Measurements
of Shunt and Ventilation-to-Perfusion Ratio to Quantify the Severity of
Bronchopulmonary Dysplasia. Neonatology, 107(4), 283-288.
doi:10.1159/000376567
Davis, G. M., Coates, A. L., Papageorgiou, A., & Bureau, M. A. (1988). Direct
measurement of static chest wall compliance in animal and human neonates.
Journal of Applied Physiology, 65(3), 1093-1098.
doi:10.1152/jappl.1988.65.3.1093
De Boeck, K., Smith, J., Van Lierde, S., Van Gijsel, D., & Devlieger, H. (1994). Flat
chest in survivors of bronchopulmonary dysplasia. Pediatric Pulmonology,
18(2), 104-107. doi:10.1002/ppul.1950180209
De Troyer, A., & Boriek, A. M. (2011). Mechanics of the respiratory muscles.
Compr Physiol, 1(3), 1273-1300. doi:10.1002/cphy.c100009
de Winter, J. P., Merth, I. T., Brand, R., & Quanjer, P. H. (2000). Functional residual
capacity and static compliance during the first year in preterm infants treated
with surfactant. Am J Perinatol, 17(7), 377-384. doi:10.1055/s-2000-13446
Dimitriou, G., Greenough, A., Moxham, J., & Rafferty, G. F. (2003). Influence of
maturation on infant diaphragm function assessed by magnetic stimulation of
phrenic nerves. Pediatric Pulmonology, 35(1), 17-22.
doi:10.1002/ppul.10209
Dimitriou, G., Greenough, A., Rafferty, G. F., & Moxham, J. (2001). Effect of
maturity on maximal transdiaphragmatic pressure in infants during crying.
117
Am J Respir Crit Care Med, 164(3), 433-436.
doi:10.1164/ajrccm.164.3.2004176
Donley, E., Holme, M., & Loyd, J. (2020). Anatomy, Thorax, Wall Movements. In.
Retrieved from https://www.ncbi.nlm.nih.gov/books/NBK526023/
Doyle, L. W., Carse, E., Adams, A.-M., Ranganathan, S., Opie, G., & Cheong, J. L.
Y. (2017). Ventilation in Extremely Preterm Infants and Respiratory
Function at 8 Years. New England Journal of Medicine, 377(4), 329-337.
doi:10.1056/NEJMoa1700827
Doyle, L. W., Davis, P. G., Morley, C. J., McPhee, A., & Carlin, J. B. (2006). Low-
Dose Dexamethasone Facilitates Extubation Among Chronically Ventilator-
Dependent Infants: A Multicenter, International, Randomized, Controlled
Trial. Pediatrics, 117(1), 75-83. doi:10.1542/peds.2004-2843
Dubois, A. B., Brody, A. W., Lewis, D. H., & Burgess, B. F., Jr. (1956). Oscillation
mechanics of lungs and chest in man. J Appl Physiol, 8(6), 587-594.
doi:10.1152/jappl.1956.8.6.587
Dureuil, B., & Matuszczak, Y. (1998). Alteration in nutritional status and diaphragm
muscle function. Reprod Nutr Dev, 38(2), 175-180.
doi:10.1051/rnd:19980204
Edwards, D. K., & Hilton, S. W. (1987). Flat chest in chronic bronchopulmonary
dysplasia. American Journal of Roentgenology, 149(6), 1213-1216.
doi:10.2214/ajr.149.6.1213
Ehrenkranz, R. A., Walsh, M. C., Vohr, B. R., Jobe, A. H., Wright, L. L., Fanaroff,
A. A., . . . Human Development Neonatal Research, N. (2005). Validation of
the National Institutes of Health consensus definition of bronchopulmonary
dysplasia. Pediatrics, 116(6), 1353-1360. doi:10.1542/peds.2005-0249
Ellsbury, D. L., Acarregui, M. J., McGuinness, G. A., & Klein, J. M. (2002).
Variability in the use of supplemental oxygen for bronchopulmonary
dysplasia. J Pediatr, 140(2), 247-249. doi:10.1067/mpd.2002.121933
Fawke, J., Lum, S., Kirkby, J., Hennessy, E., Marlow, N., Rowell, V., . . . Stocks, J.
(2010). Lung function and respiratory symptoms at 11 years in children born
extremely preterm: the EPICure study. Am J Respir Crit Care Med, 182(2),
237-245. doi:10.1164/rccm.200912-1806OC
Filbrun, A. G., Popova, A. P., Linn, M. J., McIntosh, N. A., & Hershenson, M. B.
(2011). Longitudinal measures of lung function in infants with
bronchopulmonary dysplasia. Pediatr Pulmonol, 46(4), 369-375.
doi:10.1002/ppul.21378
Frey, U. (2005). Forced oscillation technique in infants and young children. Paediatr
Respir Rev, 6(4), 246-254. doi:10.1016/j.prrv.2005.09.010

118
Frey, U., Stocks, J., Coates, A., Sly, P., & Bates, J. (2000). Specifications for
equipment used for infant pulmonary function testing. ERS/ATS Task Force
on Standards for Infant Respiratory Function Testing. European Respiratory
Society/ American Thoracic Society. Eur Respir J, 16(4), 731-740.
doi:10.1034/j.1399-3003.2000.16d28.x
Frey, U., Stocks, J., Sly, P., & Bates, J. (2000). Specification for signal processing
and data handling used for infant pulmonary function testing. ERS/ATS Task
Force on Standards for Infant Respiratory Function Testing. European
Respiratory Society/American Thoracic Society. Eur Respir J, 16(5), 1016-
1022. doi:10.1183/09031936.00.16510160
Futier, E., Constantin, J. M., Combaret, L., Mosoni, L., Roszyk, L., Sapin, V., . . .
Bazin, J. E. (2008). Pressure support ventilation attenuates ventilator-induced
protein modifications in the diaphragm. Crit Care, 12(5), R116.
doi:10.1186/cc7010
Gaio, P., Verlato, G., Daverio, M., Cavicchiolo, M. E., Nardo, D., Pasinato, A., . . .
Baraldi, E. (2018). Incidence of metabolic bone disease in preterm infants of
birth weight <1250 g and in those suffering from bronchopulmonary
dysplasia. Clinical Nutrition ESPEN, 23, 234-239.
doi:https://doi.org/10.1016/j.clnesp.2017.09.008
Gappa, M., Colin, A. A., Goetz, I., & Stocks, J. (2001). Passive respiratory
mechanics: the occlusion techniques. European Respiratory Journal, 17(1),
141-148.
Gappa, M., Pillow, J. J., Allen, J., Mayer, O., & Stocks, J. (2006). Lung function
tests in neonates and infants with chronic lung disease: lung and chest-wall
mechanics. Pediatr Pulmonol, 41(4), 291-317. doi:10.1002/ppul.20380
Geiger, P. C., Cody, M. J., Macken, R. L., & Sieck, G. C. (2000). Maximum specific
force depends on myosin heavy chain content in rat diaphragm muscle fibers.
Journal of Applied Physiology, 89(2), 695-703.
doi:10.1152/jappl.2000.89.2.695
Gerhardt, T., & Bancalari, E. (1980). Chestwall compliance in full-term and
premature infants. Acta Paediatr Scand, 69(3), 359-364. doi:10.1111/j.1651-
2227.1980.tb07093.x
Gerhardt, T., Hehre, D., Feller, R., Reifenberg, L., & Bancalari, E. (1987). Serial
determination of pulmonary function in infants with chronic lung disease.
The Journal of Pediatrics, 110(3), 448-456.
doi:https://doi.org/10.1016/S0022-3476(87)80516-4
Gibson, A. M., Reddington, C., McBride, L., Callanan, C., Robertson, C., & Doyle,
L. W. (2015). Lung function in adult survivors of very low birth weight, with
and without bronchopulmonary dysplasia. Pediatr Pulmonol, 50(10), 987-
994. doi:10.1002/ppul.23093

119
Glau, C. L., Conlon, T. W., Himebauch, A. S., Yehya, N., Weiss, S. L., Berg, R. A.,
& Nishisaki, A. (2018). Progressive Diaphragm Atrophy in Pediatric Acute
Respiratory Failure. Pediatr Crit Care Med, 19(5), 406-411.
doi:10.1097/PCC.0000000000001485
Gomez Pomar, E., Concina, V. A., Samide, A., Westgate, P. M., & Bada, H. S.
(2018). Bronchopulmonary Dysplasia: Comparison Between the Two Most
Used Diagnostic Criteria. Frontiers in Pediatrics, 6(397).
doi:10.3389/fped.2018.00397
Gortner, L., Misselwitz, B., Milligan, D., Zeitlin, J., Kollée, L., Boerch, K., . . .
Draper, E. (2011). Rates of Bronchopulmonary Dysplasia in Very Preterm
Neonates in Europe: Results from the MOSAIC Cohort. Neonatology, 99(2),
112-117.
Grinnan, D. C., & Truwit, J. D. (2005). Clinical review: Respiratory mechanics in
spontaneous and assisted ventilation. Critical Care, 9(5), 472.
doi:10.1186/cc3516
Gulliver, K., & Yoder, B. A. (2018). Bronchopulmonary dysplasia: effect of altitude
correction and role for the Neonatal Research Network Prediction Algorithm.
J Perinatol, 38(8), 1046-1050. doi:10.1038/s41372-018-0113-z
Hall, G. L., Verheggen, M., & Stick, S. M. (2007). Assessing fitness to fly in young
infants and children. Thorax, 62(3), 278-279. doi:10.1136/thx.2006.071118
Hand, I. L., Shepard, E. K., Krauss, A. N., & Auld, P. A. (1990). Ventilation-
perfusion abnormalities in the preterm infant with hyaline membrane disease:
a two-compartment model of the neonatal lung. Pediatr Pulmonol, 9(4), 206-
213.
Hantos, Z., Czövek, D., Gyurkovits, Z., Szabó, H., Maár, B. A., Radics, B., . . . Sly,
P. D. (2015). Assessment of respiratory mechanics with forced oscillations in
healthy newborns. Pediatric Pulmonology, 50(4), 344-352.
doi:10.1002/ppul.23103
Harris, P. A., Taylor, R., Thielke, R., Payne, J., Gonzalez, N., & Conde, J. G. (2009).
Research electronic data capture (REDCap)—A metadata-driven
methodology and workflow process for providing translational research
informatics support. Journal of Biomedical Informatics, 42(2), 377-381.
doi:http://dx.doi.org/10.1016/j.jbi.2008.08.010
Harris, P. A., Taylor, T., Thielke, R., Payne, J., Gonzalez, N., & Conde, J. G. (2009).
Research electronic data capture (REDCap) - A metadata-driven
methodology and workflow process for providing translational research
informatics support. J Biomed Inform, 42(2), 377-381.
Hart, N., Tounian, P., Clément, A., Boulé, M., Polkey, M. I., Lofaso, F., & Fauroux,
B. (2004). Nutritional status is an important predictor of diaphragm strength
120
in young patients with cystic fibrosis. Am J Clin Nutr, 80(5), 1201-1206.
doi:10.1093/ajcn/80.5.1201
Heldt, G. P., & McIlroy, M. B. (1987). Dynamics of chest wall in preterm infants.
Journal of Applied Physiology, 62(1), 170-174.
doi:10.1152/jappl.1987.62.1.170
Herbison, G. J., Jaweed, M. M., & Ditunno, J. F. (1982). Muscle fiber types. Arch
Phys Med Rehabil, 63(5), 227-230.
Hermansen, C. L., & Mahajan, A. (2015). Newborn Respiratory Distress. Am Fam
Physician, 92(11), 994-1002.
Higgins, R. D., Jobe, A. H., Koso-Thomas, M., Bancalari, E., Viscardi, R. M.,
Hartert, T. V., . . . Raju, T. N. K. (2018). Bronchopulmonary Dysplasia:
Executive Summary of a Workshop. J Pediatr, 197, 300-308.
doi:10.1016/j.jpeds.2018.01.043
Hines, D., Modi, N., Lee, S. K., Isayama, T., Sjors, G., Gagliardi, L., . . .
International Network for Evaluating Outcomes of, N. (2017). Scoping
review shows wide variation in the definitions of bronchopulmonary
dysplasia in preterm infants and calls for a consensus. Acta Paediatr, 106(3),
366-374. doi:10.1111/apa.13672
Hislop, A. A., Wigglesworth, J. S., Desai, R., & Aber, V. (1987). The effects of
preterm delivery and mechanical ventilation on human lung growth. Early
Hum Dev, 15(3), 147-164.
Hulskamp, G., Lum, S., Stocks, J., Wade, A., Hoo, A. F., Costeloe, K., . . . Pillow, J.
J. (2009). Association of prematurity, lung disease and body size with lung
volume and ventilation inhomogeneity in unsedated neonates: a multicentre
study. Thorax, 64(3), 240-245. doi:10.1136/thx.2008.101758
Husain, A. N., Siddiqui, N. H., & Stocker, J. T. (1998). Pathology of arrested acinar
development in postsurfactant bronchopulmonary dysplasia. Human
Pathology, 29(7), 710-717. doi:10.1016/S0046-8177(98)90280-5
Hutten, G. J., van Eykern, L. A., Latzin, P., Thamrin, C., van Aalderen, W. M., &
Frey, U. (2010). Respiratory muscle activity related to flow and lung volume
in preterm infants compared with term infants. Pediatr Res, 68(4), 339-343.
doi:10.1203/PDR.0b013e3181eeeaf4
Ibrahim, J., & Bhandari, V. (2018). The definition of bronchopulmonary dysplasia:
an evolving dilemma. Pediatr Res. doi:10.1038/s41390-018-0167-9
Isayama, T., Lee, S. K., Yang, J., Lee, D., Daspal, S., Dunn, M., . . . Canadian
Neonatal Follow-Up Network, I. (2017). Revisiting the Definition of
Bronchopulmonary Dysplasia: Effect of Changing Panoply of Respiratory
Support for Preterm Neonates. JAMA Pediatr, 171(3), 271-279.
doi:10.1001/jamapediatrics.2016.4141
121
Isayama, T., & Shah, P. S. (2019). Need for an International Consensus on the
Definition of Bronchopulmonary Dysplasia. Am J Respir Crit Care Med,
200(10), 1323-1324. doi:10.1164/rccm.201906-1127LE
Iyer, N. P., & Mhanna, M. J. (2016). Association Between High-Flow Nasal Cannula
and End-Expiratory Esophageal Pressures in Premature Infants. Respiratory
Care, 61(3), 285-290. doi:10.4187/respcare.04317
J., S. S., L., H. G., & C., W. A. (2015). Lung function following very preterm birth
in the era of ‘new’ bronchopulmonary dysplasia. Respirology, 20(4), 535-
540. doi:doi:10.1111/resp.12503
Jaber, S., Jung, B., Matecki, S., & Petrof, B. J. (2011). Clinical review: ventilator-
induced diaphragmatic dysfunction--human studies confirm animal model
findings! Crit Care, 15(2), 206. doi:10.1186/cc10023
Jaber, S., Petrof, B. J., Jung, B., Chanques, G., Berthet, J. P., Rabuel, C., . . .
Matecki, S. (2011). Rapidly progressive diaphragmatic weakness and injury
during mechanical ventilation in humans. Am J Respir Crit Care Med,
183(3), 364-371. doi:10.1164/rccm.201004-0670OC
Jansen, A. H., & Chernick, V. (1991). Fetal breathing and development of control of
breathing. J Appl Physiol (1985), 70(4), 1431-1446.
doi:10.1152/jappl.1991.70.4.1431
Javen, I., Williams, N. A., Young, I. R., Luff, A. R., & Walker, D. (1996). Growth
and differentiation of fast and slow muscles in fetal sheep, and the effects of
hypophysectomy. J Physiol, 494 ( Pt 3), 839-849.
doi:10.1113/jphysiol.1996.sp021537
Jensen, E. A., Dysart, K., Gantz, M. G., McDonald, S., Bamat, N. A., Keszler, M., . .
. DeMauro, S. B. (2019). The Diagnosis of Bronchopulmonary Dysplasia in
Very Preterm Infants. An Evidence-based Approach. Am J Respir Crit Care
Med, 200(6), 751-759. doi:10.1164/rccm.201812-2348OC
Jensen, E. A., & Wright, C. J. (2018). Bronchopulmonary Dysplasia: The Ongoing
Search for One Definition to Rule Them All. J Pediatr, 197, 8-10.
doi:10.1016/j.jpeds.2018.02.047
Jobe, A. H. (2006). The new BPD. NeoReviews, 7(10), e531-e545.
Jobe, A. H. (2011). The new bronchopulmonary dysplasia. Curr Opin Pediatr, 23(2),
167-172. doi:10.1097/MOP.0b013e3283423e6b
Jobe, A. H., & Abman, S. H. (2019). Bronchopulmonary Dysplasia: A Continuum of
Lung Disease from the Fetus to the Adult. Am J Respir Crit Care Med,
200(6), 659-660. doi:10.1164/rccm.201904-0875ED
122
Jobe, A. H., & Bancalari, E. (2001). Bronchopulmonary dysplasia. Am J Respir Crit
Care Med, 163(7), 1723-1729. doi:10.1164/ajrccm.163.7.2011060
Jobe, A. H., & Bancalari, E. H. (2017). Controversies about the definition of
bronchopulmonary dysplasia at 50 years. Acta Paediatr, 106(5), 692-693.
doi:10.1111/apa.13775
Jobe, A. H., & Steinhorn, R. (2017). Can We Define Bronchopulmonary Dysplasia?
J Pediatr, 188, 19-23. doi:10.1016/j.jpeds.2017.06.064
Jobe, A. J. (1999). The new BPD: an arrest of lung development. Pediatr Res, 46(6),
641-643.
Jobe, A. J. (1999). The New BPD: An Arrest of Lung Development. Pediatric
Research, 46, 641.
Jones, J. G., & Jones, S. E. (2000). Discriminating between the effect of shunt and
reduced VA/Q on arterial oxygen saturation is particularly useful in clinical
practice. J Clin Monit Comput, 16(5-6), 337-350.
Jones, J. G., Lockwood, G. G., Fung, N., Lasenby, J., Ross-Russell, R. I., Quine, D.,
& Stenson, B. J. (2015). Influence of pulmonary factors on pulse oximeter
saturation in preterm infants. Arch Dis Child Fetal Neonatal Ed.
doi:10.1136/archdischild-2015-308675
Jones, J. G., Lockwood, G. G., Fung, N., Lasenby, J., Ross-Russell, R. I., Quine, D.,
& Stenson, B. J. (2016). Influence of pulmonary factors on pulse oximeter
saturation in preterm infants. Arch Dis Child Fetal Neonatal Ed, 101(4),
F319-322. doi:10.1136/archdischild-2015-308675
Joshi, S., & Kotecha, S. (2007). Lung growth and development. Early Human
Development, 83(12), 789-794.
doi:https://doi.org/10.1016/j.earlhumdev.2007.09.007
Karisnan, K., Mahzabin, T., Bakker, A. J., Song, Y., Noble, P. B., Pillow, J. J., &
Pinniger, G. J. (2017). Gestational age at time of in utero lipopolysaccharide
exposure influences the severity of inflammation-induced diaphragm
weakness in lambs. Am J Physiol Regul Integr Comp Physiol,
ajpregu.00150.02017. doi:10.1152/ajpregu.00150.2017
Kasinger, W., Huch, R., & Huch, A. (1981). In vivo oxygen dissociation curve for
whole fetal blood: fitting the Adair equation and blood gas nomogram. Scand
J Clin Lab Invest, 41(7), 701-707.
Keens, T. G., Bryan, A. C., Levison, H., & Ianuzzo, C. D. (1978). Developmental
pattern of muscle fiber types in human ventilatory muscles. J Appl Physiol
Respir Environ Exerc Physiol, 44(6), 909-913.
doi:10.1152/jappl.1978.44.6.909

123
Kinsella, J. P., Greenough, A., & Abman, S. H. (2006). Bronchopulmonary
dysplasia. Lancet, 367(9520), 1421-1431. doi:10.1016/S0140-
6736(06)68615-7
Kitterman, J. A. (1996). The effects of mechanical forces on fetal lung growth. Clin
Perinatol, 23(4), 727-740.
Kjaergaard, S., Rees, S., Malczynski, J., Nielsen, J. A., Thorgaard, P., Toft, E., &
Andreassen, S. (2003). Non-invasive estimation of shunt and ventilation-
perfusion mismatch. Intensive Care Med, 29(5), 727-734.
doi:10.1007/s00134-003-1708-0
Knisely, A. S., Leal, S. M., & Singer, D. B. (1988). Abnormalities of diaphragmatic
muscle in neonates with ventilated lungs. J Pediatr, 113(6), 1074-1077.
Kotecha, S. (2000). Lung growth: implications for the newborn infant. Archives of
Disease in Childhood - Fetal and Neonatal Edition, 82(1), F69-F74.
doi:10.1136/fn.82.1.F69
Lampland, A. L., Plumm, B., Meyers, P. A., Worwa, C. T., & Mammel, M. C.
(2009). Observational Study of Humidified High-Flow Nasal Cannula
Compared with Nasal Continuous Positive Airway Pressure. The Journal of
Pediatrics, 154(2), 177-182.e172.
doi:https://doi.org/10.1016/j.jpeds.2008.07.021
Latzin, P., Roth, S., Thamrin, C., Hutten, G. J., Pramana, I., Kuehni, C. E., . . . Frey,
U. (2009). Lung volume, breathing pattern and ventilation inhomogeneity in
preterm and term infants. PLoS One, 4(2), e4635.
doi:10.1371/journal.pone.0004635
Lavin, T., Song, Y., Bakker, A. J., McLean, C. J., Macdonald, W. A., Noble, P. B., .
. . Pinniger, G. J. (2013). Developmental changes in diaphragm muscle
function in the preterm and postnatal lamb. Pediatr Pulmonol, 48(7), 640-
648. doi:10.1002/ppul.22762
Leith, D. E., & Brown, R. (1999). Human lung volumes and the mechanisms that set
them. Eur Respir J, 13(2), 468-472. doi:10.1183/09031936.99.13246899
Levine, S., Nguyen, T., Taylor, N., Friscia, M. E., Budak, M. T., Rothenberg, P., . . .
Shrager, J. B. (2008). Rapid disuse atrophy of diaphragm fibers in
mechanically ventilated humans. N Engl J Med, 358(13), 1327-1335.
doi:10.1056/NEJMoa070447
Lewis, M. I., Sieck, G. C., Fournier, M., & Belman, M. J. (1986). Effect of
nutritional deprivation on diaphragm contractility and muscle fiber size.
Journal of Applied Physiology, 60(2), 596-603.
doi:10.1152/jappl.1986.60.2.596
Liang, F., Emeriaud, G., Rassier, D. E., Shang, D., Gusev, E., Hussain, S. N. A., . . .
Petrof, B. J. (2019). Mechanical ventilation causes diaphragm dysfunction in

124
newborn lambs. Critical care (London, England), 23(1), 123-123.
doi:10.1186/s13054-019-2409-6
Liggins, G. C., & Howie, R. N. (1972). A CONTROLLED TRIAL OF
ANTEPARTUM GLUCOCORTICOID TREATMENT FOR PREVENTION
OF THE RESPIRATORY DISTRESS SYNDROME IN PREMATURE
INFANTS. Pediatrics, 50(4), 515-525.
Liggins, G. C., Vilos, G. A., Campos, G. A., Kitterman, J. A., & Lee, C. H. (1981).
The effect of spinal cord transection on lung development in fetal sheep. J
Dev Physiol, 3(4), 267-274.
Lockwood, G. G., Fung, N. L., & Jones, J. G. (2014). Evaluation of a computer
program for non-invasive determination of pulmonary shunt and ventilation-
perfusion mismatch. J Clin Monit Comput, 28(6), 581-590.
doi:10.1007/s10877-014-9554-x
Mahle, W. T., Martin, G. R., Beekman, R. H., Morrow, W. R., Rosenthal, G. L.,
Snyder, C. S., . . . Tweddell, J. S. (2012). Endorsement of Health and Human
Services Recommendation for Pulse Oximetry Screening for Critical
Congenital Heart Disease. Pediatrics, 129(1), 190-192.
doi:10.1542/peds.2011-3211
Margraf, L. R., Tomashefski, J. F., Jr., Bruce, M. C., & Dahms, B. B. (1991).
Morphometric analysis of the lung in bronchopulmonary dysplasia. Am Rev
Respir Dis, 143(2), 391-400. doi:10.1164/ajrccm/143.2.391
Marshall, D. D., Kotelchuck, M., Young, T. E., Bose, C. L., Kruyer, L., & O'Shea, T.
M. (1999). Risk factors for chronic lung disease in the surfactant era: a North
Carolina population-based study of very low birth weight infants. North
Carolina Neonatologists Association. Pediatrics, 104(6), 1345-1350.
doi:10.1542/peds.104.6.1345
May, C., Kennedy, C., Milner, A. D., Rafferty, G. F., Peacock, J. L., & Greenough,
A. (2011). Lung function abnormalities in infants developing
bronchopulmonary dysplasia. Arch Dis Child, 96(11), 1014-1019.
doi:10.1136/adc.2011.212332
May, C., Kennedy, C., Milner, A. D., Rafferty, G. F., Peacock, J. L., & Greenough,
A. (2011). Lung function abnormalities in infants developing
bronchopulmonary dysplasia. Archives of Disease in Childhood, 96(11),
1014-1019. doi:10.1136/adc.2011.212332
May, C., Prendergast, M., Salman, S., Rafferty, G. F., & Greenough, A. (2009).
Chest radiograph thoracic areas and lung volumes in infants developing
bronchopulmonary dysplasia. Pediatr Pulmonol, 44(1), 80-85.
doi:10.1002/ppul.20952
Mayer, S., Metzger, R., & Kluth, D. (2011). The embryology of the diaphragm.
Semin Pediatr Surg, 20(3), 161-169. doi:10.1053/j.sempedsurg.2011.03.006
125
McEvoy, C. T., & Aschner, J. L. (2015). The Natural History of Bronchopulmonary
Dysplasia (BPD): The Case for Primary Prevention. Clinics in perinatology,
42(4), 911-931. doi:10.1016/j.clp.2015.08.014
McEvoy, C. T., Jain, L., Schmidt, B., Abman, S., Bancalari, E., & Aschner, J. L.
(2014). Bronchopulmonary dysplasia: NHLBI Workshop on the Primary
Prevention of Chronic Lung Diseases. Ann Am Thorac Soc, 11 Suppl 3,
S146-153. doi:10.1513/AnnalsATS.201312-424LD
Mello, R. R., Silva, K. S., Costa, A. M., & Ramos, J. R. (2015). Longitudinal
assessment of the lung mechanics of very low birth weight preterm infants
with and without bronchopulmonary dysplasia. Sao Paulo Med J, 133(5),
401-407. doi:10.1590/1516-3180.2014.00101812
Merrell, A. J., & Kardon, G. (2013). Development of the diaphragm -- a skeletal
muscle essential for mammalian respiration. FEBS J, 280(17), 4026-4035.
doi:10.1111/febs.12274
Merth, I. T., de Winter, J. P., Zonderland, H. M., Borsboom, G. J., & Quanjer, P. H.
(1997). Pulmonary function in infants with neonatal chronic lung disease
with or without hyaline membrane disease at birth. Eur Respir J, 10(7), 1606-
1613. doi:10.1183/09031936.97.10071606
Morley, C. J., & Greenough, A. (1991). Respiratory compliance in premature babies
treated with artificial surfactant (ALEC). Archives of Disease in Childhood,
66(4), 467-471. doi:10.1136/adc.66.4.467
Morrow, L. A., Wagner, B. D., Ingram, D. A., Poindexter, B. B., Schibler, K.,
Cotten, C. M., . . . Abman, S. H. (2017). Antenatal Determinants of
Bronchopulmonary Dysplasia and Late Respiratory Disease in Preterm
Infants. Am J Respir Crit Care Med, 196(3), 364-374.
doi:10.1164/rccm.201612-2414OC
Murciano, D., Rigaud, D., Pingleton, S., Armengaud, M. H., Melchior, J. C., &
Aubier, M. (1994). Diaphragmatic function in severely malnourished patients
with anorexia nervosa. Effects of renutrition. Am J Respir Crit Care Med,
150(6 Pt 1), 1569-1574. doi:10.1164/ajrccm.150.6.7952616
Neto, G. S., Gerhardt, T., Claure, N., Duara, S., & Bancalari, E. (1995). Effect of
chestwall distortion on the measurement of pulmonary mechanics in preterm
infants. Pediatric Pulmonology, 20(1), 34-39. doi:10.1002/ppul.1950200107
Northway, W. H., Jr., Rosan, R. C., & Porter, D. Y. (1967). Pulmonary disease
following respirator therapy of hyaline-membrane disease.
Bronchopulmonary dysplasia. N Engl J Med, 276(7), 357-368.
doi:10.1056/NEJM196702162760701
O'Dea, C. A., Logie, K., Maiorana, A., Wilson, A. C., Pillow, J. J., Banton, G. L., . . .
Hall, G. L. (2018). Increased prevalence of expiratory flow limitation during

126
exercise in children with bronchopulmonary dysplasia. ERJ Open Res, 4(4).
doi:10.1183/23120541.00048-2018
Onland, W., Debray, T. P., Laughon, M. M., Miedema, M., Cools, F., Askie, L. M., .
. . Offringa, M. (2013). Clinical prediction models for bronchopulmonary
dysplasia: a systematic review and external validation study. BMC Pediatr,
13, 207. doi:10.1186/1471-2431-13-207
Papastamelos, C., Panitch, H. B., England, S. E., & Allen, J. L. (1995).
Developmental changes in chest wall compliance in infancy and early
childhood. Journal of Applied Physiology, 78(1), 179-184.
doi:10.1152/jappl.1995.78.1.179
Parker, R. A., Lindstrom, D. P., & Cotton, R. B. (1996). Evidence from twin study
implies possible genetic susceptibility to bronchopulmonary dysplasia. Semin
Perinatol, 20(3), 206-209. doi:10.1016/s0146-0005(96)80049-8
Peacock, A. J. (1998). Oxygen at high altitude. BMJ : British Medical Journal,
317(7165), 1063-1066.
Petrof, B. J., & Hussain, S. N. (2016). Ventilator-induced diaphragmatic
dysfunction: what have we learned? Curr Opin Crit Care, 22(1), 67-72.
doi:10.1097/MCC.0000000000000272
Pillow, J. J., Stocks, J., Sly, P. D., & Hantos, Z. (2005). Partitioning of Airway and
Parenchymal Mechanics in Unsedated Newborn Infants. Pediatric Research,
58(6), 1210-1215. doi:10.1203/01.pdr.0000185273.86320.13
Poets, C. F., & Lorenz, L. (2018). Prevention of bronchopulmonary dysplasia in
extremely low gestational age neonates: current evidence. Archives of
Disease in Childhood - Fetal and Neonatal Edition, 103(3), F285-F291.
doi:10.1136/archdischild-2017-314264
Poindexter, B. B., Feng, R., Schmidt, B., Aschner, J. L., Ballard, R. A., Hamvas, A.,
. . . Respiratory Outcomes, P. (2015). Comparisons and Limitations of
Current Definitions of Bronchopulmonary Dysplasia for the Prematurity and
Respiratory Outcomes Program. Ann Am Thorac Soc, 12(12), 1822-1830.
doi:10.1513/AnnalsATS.201504-218OC
Poindexter, B. B., & Jobe, A. H. (2015). The Diagnostic Conundrum of
Bronchopulmonary Dysplasia. J Pediatr, 167(3), 517-518.
doi:10.1016/j.jpeds.2015.06.029
Poole, D. C., Sexton, W. L., Farkas, G. A., Powers, S. K., & Reid, M. B. (1997).
Diaphragm structure and function in health and disease. Med Sci Sports
Exerc, 29(6), 738-754.
Powers, S. K., Shanely, R. A., Coombes, J. S., Koesterer, T. J., McKenzie, M., Van
Gammeren, D., . . . Dodd, S. L. (2002). Mechanical ventilation results in

127
progressive contractile dysfunction in the diaphragm. J Appl Physiol (1985),
92(5), 1851-1858. doi:10.1152/japplphysiol.00881.2001
Prakash, Y. S., Fournier, M., & Sieck, G. C. (1993). Effects of prenatal
undernutrition on developing rat diaphragm. J Appl Physiol (1985), 75(3),
1044-1052. doi:10.1152/jappl.1993.75.3.1044
Prechtl, H. F. (1974). The behavioural states of the newborn infant (a review). Brain
Res, 76(2), 185-212. doi:10.1016/0006-8993(74)90454-5
Priante, E., Moschino, L., Mardegan, V., Manzoni, P., Salvadori, S., & Baraldi, E.
(2016). Respiratory Outcome after Preterm Birth: A Long and Difficult
Journey. Am J Perinatol, 33(11), 1040-1042. doi:10.1055/s-0036-1586172
Quine, D., Wong, C. M., Boyle, E. M., Jones, J. G., & Stenson, B. J. (2006). Non-
invasive measurement of reduced ventilation:perfusion ratio and shunt in
infants with bronchopulmonary dysplasia: a physiological definition of the
disease. Arch Dis Child Fetal Neonatal Ed, 91(6), F409-414.
doi:adc.2006.095406 [pii]
10.1136/adc.2006.095406
Rakshasbhuvankar, A., Patole, S., Simmer, K., & Pillow, J. J. (2017). Enteral
vitamin A for reducing severity of bronchopulmonary dysplasia in extremely
preterm infants: a randomised controlled trial. BMC Pediatr, 17(1), 204.
doi:10.1186/s12887-017-0958-x
Refsum, H. E., Bechensteen, A. G., & Lindemann, R. (1998). Shift from fetal to
adult hemoglobin production in a preterm infant after exchange transfusion: a
quantitative approach. Pediatr Hematol Oncol, 15(5), 431-435.
Rehman, S., & Bacha, D. (2020). Embryology, Pulmonary. In S. Publishing (Ed.).
Retrieved from https://www.ncbi.nlm.nih.gov/books/NBK544372/
Reiterer, F., Schwaberger, B., Freidl, T., Schmolzer, G., Pichler, G., & Urlesberger,
B. (2016). Lung-protective ventilatory strategies in intubated preterm
neonates with RDS. Paediatr Respir Rev. doi:10.1016/j.prrv.2016.10.007
Resnick, S. M., Hall, G. L., Simmer, K. N., Stick, S. M., & Sharp, M. J. (2008). The
hypoxia challenge test does not accurately predict hypoxia in flight in ex-
preterm neonates. Chest, 133(5), 1161-1166. doi:10.1378/chest.07-2375
Roberts, D., Brown, J., Medley, N., & Dalziel, S. R. (2017). Antenatal
corticosteroids for accelerating fetal lung maturation for women at risk of
preterm birth. Cochrane Database of Systematic Reviews(3).
doi:10.1002/14651858.CD004454.pub3
Robertson, B., & Halliday, H. L. (1998). Principles of surfactant replacement.
Biochimica et Biophysica Acta (BBA) - Molecular Basis of Disease, 1408(2),
346-361. doi:https://doi.org/10.1016/S0925-4439(98)00080-5

128
Robin, B., Kim, Y.-J., Huth, J., Klocksieben, J., Torres, M., Tepper, R. S., . . .
Goldstein-Filbrun, A. (2004). Pulmonary function in bronchopulmonary
dysplasia. Pediatric Pulmonology, 37(3), 236-242. doi:10.1002/ppul.10424
Roca, J., & Wagner, P. D. (1994). Contribution of multiple inert gas elimination
technique to pulmonary medicine. 1. Principles and information content of
the multiple inert gas elimination technique. Thorax, 49(8), 815-824.
doi:10.1136/thx.49.8.815
Roe, P. G., & Jones, J. G. (1993). Analysis of factors which affect the relationship
between inspired oxygen partial pressure and arterial oxygen saturation. Br J
Anaesth, 71(4), 488-494. doi:10.1093/bja/71.4.488
Rowe, L., Jones, J. G., Quine, D., Bhushan, S. S., & Stenson, B. J. (2010). A
simplified method for deriving shunt and reduced VA/Q in infants. Arch Dis
Child Fetal Neonatal Ed, 95(1), F47-52. doi:adc.2009.160010 [pii]
10.1136/adc.2009.160010
Sahni, R., Ammari, A., Suri, M. S., Milisavljevic, V., Ohira-Kist, K., Wung, J. T., &
Polin, R. A. (2005). Is the new definition of bronchopulmonary dysplasia
more useful? J Perinatol, 25(1), 41-46. doi:10.1038/sj.jp.7211210
Sapsford, D. J., & Jones, J. G. (1995). The PIO2 vs. SpO2 diagram: a non-invasive
measure of pulmonary oxygen exchange. Eur J Anaesthesiol, 12(4), 375-386.
Sassoon, C. S., Caiozzo, V. J., Manka, A., & Sieck, G. C. (2002). Altered diaphragm
contractile properties with controlled mechanical ventilation. J Appl Physiol
(1985), 92(6), 2585-2595. doi:10.1152/japplphysiol.01213.2001
Schiaffino, S., Gorza, L., Sartore, S., Saggin, L., Ausoni, S., Vianello, M., . . . Lomo,
T. (1989). Three myosin heavy chain isoforms in type 2 skeletal muscle
fibres. J Muscle Res Cell Motil, 10(3), 197-205. doi:10.1007/BF01739810
Schibler, A., Hall, G. L., Businger, F., Reinmann, B., Wildhaber, J. H., Cernelc, M.,
& Frey, U. (2002). Measurement of lung volume and ventilation distribution
with an ultrasonic flow meter in healthy infants. Eur Respir J, 20(4), 912-
918. doi:10.1183/09031936.02.00226002
Schmidt , B., Roberts , R. S., Davis , P., Doyle , L. W., Barrington , K. J., Ohlsson ,
A., . . . Tin , W. (2006). Caffeine Therapy for Apnea of Prematurity. New
England Journal of Medicine, 354(20), 2112-2121.
doi:10.1056/NEJMoa054065
Schulzke, S. M., & Pillow, J. J. (2010). The management of evolving
bronchopulmonary dysplasia. Paediatric Respiratory Reviews, 11(3), 143-
148. doi:https://doi.org/10.1016/j.prrv.2009.12.005
Scott, W., Stevens, J., & Binder–Macleod, S. A. (2001). Human Skeletal Muscle
Fiber Type Classifications. Physical Therapy, 81(11), 1810-1816.
doi:10.1093/ptj/81.11.1810

129
Sefton, E. M., Gallardo, M., & Kardon, G. (2018). Developmental origin and
morphogenesis of the diaphragm, an essential mammalian muscle. Dev Biol,
440(2), 64-73. doi:10.1016/j.ydbio.2018.04.010
Shennan, A. T., Dunn, M. S., Ohlsson, A., Lennox, K., & Hoskins, E. M. (1988).
Abnormal Pulmonary Outcomes in Premature Infants: Prediction From
Oxygen Requirement in the Neonatal Period. Pediatrics, 82(4), 527-532.
Shiao, S. Y., & Ou, C. N. (2006). Accurate measurements of fetal hemoglobin for
neonates with different gestational ages. Hemoglobin, 30(4), 419-435.
doi:10.1080/03630260600867883
Simpson, S. J., Logie, K. M., O'Dea, C. A., Banton, G. L., Murray, C., Wilson, A.
C., . . . Hall, G. L. (2017). Altered lung structure and function in mid-
childhood survivors of very preterm birth. Thorax, 72(8), 702-711.
doi:10.1136/thoraxjnl-2016-208985
Simpson, S. J., Turkovic, L., Wilson, A. C., Verheggen, M., Logie, K. M., Pillow, J.
J., & Hall, G. L. (2018). Lung function trajectories throughout childhood in
survivors of very preterm birth: a longitudinal cohort study. The Lancet Child
& Adolescent Health, 2(5), 350-359.
Smith, H. L., & Jones, J. G. (2001). Non-invasive assessment of shunt and
ventilation/perfusion ratio in neonates with pulmonary failure. Arch Dis
Child Fetal Neonatal Ed, 85(2), F127-132.
Song, Y., Dahl, M., Leavitt, W., Alvord, J., Bradford, C. Y., Albertine, K. H., &
Pillow, J. J. (2018). Vitamin A Protects the Preterm Lamb Diaphragm
Against Adverse Effects of Mechanical Ventilation. Front Physiol, 9, 1119.
doi:10.3389/fphys.2018.01119
Song, Y., Demmer, D. L., Pinniger, G. J., Lavin, T., MacMillan, M. V., Pillow, J. J.,
& Bakker, A. J. (2014). Effect of maternal steroid on developing diaphragm
integrity. PLoS One, 9(3), e93224. doi:10.1371/journal.pone.0093224
Song, Y., Karisnan, K., Noble, P. B., Berry, C. A., Lavin, T., Moss, T. J., . . . Pillow,
J. J. (2013). In utero LPS exposure impairs preterm diaphragm contractility.
Am J Respir Cell Mol Biol, 49(5), 866-874. doi:10.1165/rcmb.2013-0107OC
Song, Y., & Pillow, J. J. (2013). Developmental regulation of molecular signalling in
fetal and neonatal diaphragm protein metabolism. Exp Biol Med (Maywood),
238(8), 913-922. doi:10.1177/1535370213494562
Song, Y., Pinniger, G. J., Bakker, A. J., Moss, T. J., Noble, P. B., Berry, C. A., &
Pillow, J. J. (2013). Lipopolysaccharide-induced weakness in the preterm
diaphragm is associated with mitochondrial electron transport chain
dysfunction and oxidative stress. PLoS One, 8(9), e73457.
doi:10.1371/journal.pone.0073457
130
Stoecklin, Simpson, S. J., & Pillow, J. J. (2019). Bronchopulmonary dysplasia:
Rationale for a pathophysiological rather than treatment based approach to
diagnosis. Paediatr Respir Rev, 32, 91-97. doi:10.1016/j.prrv.2018.12.002
Stoecklin, B., Simpson, S., Hall, G., Hantos, Z., & Pillow, J. (2017). Low-frequency
oscillatory mechanics in very preterm infants with and without
Bronchopulmonary Dysplasia. European Respiratory Journal, 50(suppl 61),
PA2074. doi:10.1183/1393003.congress-2017.PA2074
Stoecklin, B., Simpson, S. J., & Pillow, J. J. (2018). Bronchopulmonary dysplasia:
rationale for a pathophysiological rather than treatment based approach to
diagnosis. Paediatric Respiratory Reviews.
doi:https://doi.org/10.1016/j.prrv.2018.12.002
Stoecklin, B., Svedenkrans, J., Jones, G., & Pillow, J. (2017). Shift in very preterm
infants with oxyhaemoglobin saturation >94% in room air. European
Respiratory Journal, 50(suppl 61), OA3424. doi:10.1183/1393003.congress-
2017.OA3424
Stoll, B. J., Hansen, N. I., Bell, E. F., Shankaran, S., Laptook, A. R., Walsh, M. C., .
. . Human Development Neonatal Research, N. (2010). Neonatal outcomes of
extremely preterm infants from the NICHD Neonatal Research Network.
Pediatrics, 126(3), 443-456. doi:10.1542/peds.2009-2959
Stoll, B. J., Hansen, N. I., Bell, E. F., Walsh, M. C., Carlo, W. A., Shankaran, S., . . .
Higgins, R. D. (2015). Trends in Care Practices, Morbidity, and Mortality of
Extremely Preterm Neonates, 1993–2012. JAMA, 314(10), 1039-1051.
doi:10.1001/jama.2015.10244
Strueby, L., & Thebaud, B. (2014). Advances in bronchopulmonary dysplasia.
Expert Rev Respir Med, 8(3), 327-338. doi:10.1586/17476348.2014.899907
Student. (1908). The probable error of a mean. Biometrika, 1-25.
Svedenkrans, J., Stoecklin, B., Jones, J. G., Doherty, D. A., & Pillow, J. J. (2019a).
Physiology and Predictors of Impaired Gas Exchange in Infants with
Bronchopulmonary Dysplasia. Am J Respir Crit Care Med, 200(4), 471-480.
doi:10.1164/rccm.201810-2037OC
Svedenkrans, J., Stoecklin, B., Jones, J. G., Doherty, D. A., & Pillow, J. J. (2019b).
Physiology and Predictors of Impaired Gas Exchange in Infants with
Bronchopulmonary Dysplasia. Am J Respir Crit Care Med.
doi:10.1164/rccm.201810-2037OC
Sweet, D. G., Carnielli, V., Greisen, G., Hallman, M., Ozek, E., Te Pas, A., . . .
Halliday, H. L. (2019). European Consensus Guidelines on the Management
of Respiratory Distress Syndrome - 2019 Update. Neonatology, 115(4), 432-
450. doi:10.1159/000499361

131
Taghizadeh, A., & Reynolds, E. O. (1976). Pathogenesis of bronchopulmonary
dysplasia following hyaline membrane disease. The American Journal of
Pathology, 82(2), 241-264.
Tan, S., Szatkowski, L., Moreton, W., Fiaschi, L., McKeever, T., Gibson, J., &
Sharkey, D. (2020). Early childhood respiratory morbidity and antibiotic use
in ex-preterm infants: A primary care population-based cohort study.
European Respiratory Journal, 2000202. doi:10.1183/13993003.00202-2020
Thebaud, B., Goss, K. N., Laughon, M., Whitsett, J. A., Abman, S. H., Steinhorn, R.
H., . . . Jobe, A. H. (2019). Bronchopulmonary dysplasia. Nat Rev Dis
Primers, 5(1), 78. doi:10.1038/s41572-019-0127-7
Tooley, W. H. (1979). Epidemiology of bronchopulmonary dysplasia. J Pediatr,
95(5 Pt 2), 851-858.
Trembath, A., & Laughon, M. M. (2012). Predictors of bronchopulmonary dysplasia.
Clin Perinatol, 39(3), 585-601. doi:10.1016/j.clp.2012.06.014
Tyson, J. E., Wright, L. L., Oh, W., Kennedy, K. A., Mele, L., Ehrenkranz, R. A., . .
. Fanaroff, A. A. (1999). Vitamin A supplementation for extremely-low-
birth-weight infants. National Institute of Child Health and Human
Development Neonatal Research Network. N Engl J Med, 340(25), 1962-
1968. doi:10.1056/NEJM199906243402505
Urs, R., Kotecha, S., Hall, G. L., & Simpson, S. J. (2018). Persistent and progressive
long-term lung disease in survivors of preterm birth. Paediatr Respir Rev.
doi:10.1016/j.prrv.2018.04.001
Vachharajani, A. J., Mathur, A. M., & Rao, R. (2009). Metabolic Bone Disease of
Prematurity. NeoReviews, 10(8), e402-e411. doi:10.1542/neo.10-8-e402
van Balkom, R. H., Dekhuijzen, P. N., Folgering, H. T., Veerkamp, J. H., Fransen, J.
A., & van Herwaarden, C. L. (1997). Effects of long-term low-dose
methylprednisolone on rat diaphragm function and structure. Muscle Nerve,
20(8), 983-990. doi:10.1002/(sici)1097-4598(199708)20:8<983::aid-
mus8>3.0.co;2-2
van Kaam, A. H., De Luca, D., Hentschel, R., Hutten, J., Sindelar, R., Thome, U., &
Zimmermann, L. J. I. (2019). Modes and strategies for providing
conventional mechanical ventilation in neonates. Pediatr Res.
doi:10.1038/s41390-019-0704-1
Van Marter, L. J., Allred, E. N., Pagano, M., Sanocka, U., Parad, R., Moore, M., . . .
Leviton, A. (2000). Do Clinical Markers of Barotrauma and Oxygen Toxicity
Explain Interhospital Variation in Rates of Chronic Lung Disease?
Pediatrics, 105(6), 1194-1201. doi:10.1542/peds.105.6.1194
van Rossem, M. C., van de Loo, M., Laan, B. J., de Sonnaville, E. S. V., Tamminga,
P., van Kaam, A. H., & Onland, W. (2015). Accuracy of the Diagnosis of
132
Bronchopulmonary Dysplasia in a Referral-Based Health Care System. The
Journal of Pediatrics, 167(3), 540-544.e541.
doi:https://doi.org/10.1016/j.jpeds.2015.05.008
Vassilakopoulos, T., & Petrof, B. J. (2004). Ventilator-induced diaphragmatic
dysfunction. Am J Respir Crit Care Med, 169(3), 336-341.
doi:10.1164/rccm.200304-489CP
Vyas, J., & Kotecha, S. (1997). Effects of antenatal and postnatal corticosteroids on
the preterm lung. Arch Dis Child Fetal Neonatal Ed, 77(2), F147-150.
doi:10.1136/fn.77.2.f147
Walsh, M. C., Wilson-Costello, D., Zadell, A., Newman, N., & Fanaroff, A. (2003).
Safety, reliability, and validity of a physiologic definition of
bronchopulmonary dysplasia. J Perinatol, 23(6), 451-456.
doi:10.1038/sj.jp.7210963
Walsh, M. C., Yao, Q., Gettner, P., Hale, E., Collins, M., Hensman, A., . . . Human
Development Neonatal Research, N. (2004). Impact of a physiologic
definition on bronchopulmonary dysplasia rates. Pediatrics, 114(5), 1305-
1311. doi:10.1542/peds.2004-0204
Wauer, R. R., Maurer, T., Nowotny, T., & Schmalisch, G. (1998a). Assessment of
functional residual capacity using nitrogen washout and plethysmographic
techniques in infants with and without bronchopulmonary dysplasia.
Intensive Care Medicine, 24(5), 469-475. doi:10.1007/s001340050598
Wauer, R. R., Maurer, T., Nowotny, T., & Schmalisch, G. (1998b). Assessment of
functional residual capacity using nitrogen washout and plethysmographic
techniques in infants with and without bronchopulmonary dysplasia.
Intensive Care Med, 24(5), 469-475. doi:10.1007/s001340050598
Widness, J. A., Kuruvilla, D. J., Mock, D. M., Matthews, N. I., Nalbant, D., Cress,
G. A., . . . Veng-Pedersen, P. (2015). Autologous Infant and Allogeneic
Adult Red Cells Demonstrate Similar Concurrent Post-Transfusion Survival
in Very Low Birth Weight Neonates. J Pediatr, 167(5), 1001-1006.
doi:10.1016/j.jpeds.2015.08.028
Workshop on bronchopulmonary dysplasia. Sponsored by the Division of Lung
Diseases. National Heart, Lung, and Blood Institute, National Institutes of
Health. (1979). J Pediatr, 95(5 Pt 2), 1-9, 815-920.
www.embryology.ch. (2008, 20.08.2008). Retrieved from www.embryology.ch
Yoder, L. M., Higano, N. S., Schapiro, A. H., Fleck, R. J., Hysinger, E. B., Bates, A.
J., . . . Woods, J. C. (2019). Elevated lung volumes in neonates with
bronchopulmonary dysplasia measured via MRI. Pediatr Pulmonol, 54(8),
1311-1318. doi:10.1002/ppul.24378

133
CHAPTER 8
APPENDICES

134
8. APPENDICES
A1. Physiology and predictors of impaired gas exchange in infants
with bronchopulmonary dysplasia
*Jenny Svedenkrans PhDa,b,c, *Benjamin Stoecklin MDa,d,e, J. Gareth Jones FRCPf,
Dorota A. Doherty PhDg, J. Jane Pillowa,d PhD
DOI: 10.1164/rccm.201810-2037OC,
Affiliations: a Centre for Neonatal Research and Education, University of Western Australia, Perth,
Australia; b Department of Clinical Science, Intervention and Technology, Division of Pediatrics,
Karolinska Institutet, Stockholm, Sweden; c Department of Neonatal Medicine, Karolinska University Hospital, Stockholm,
Sweden; d School of Human Sciences, University of Western Australia, Perth, Australia; e Neonatal Clinical Care Unit, King Edward Memorial Hospital, Perth, Australia; f University Department of Anaesthesia, Addenbrooke’s Hospital, Cambridge,
United Kingdom; g Division of Obstetrics and Gynaecology, Medical School, University of Western
Australia, Perth, Australia
*joint first authors
Address correspondence to:
Assoc Prof Jane Pillow,
School of Human Sciences,
M309 The University of Western Australia,
35 Stirling Highway, Crawley 6009, Western Australia, Australia
Ph: +61864883318
Funding source: All phases of this study were supported by the University of
Western Australia and the Women and Newborn Health Service of Western
Australia. Funded by National Health and Medical Research Council (NHMRC) of
Australia (GRT1047689, GRT1057514) and the Metropolitan Health Research
Infrastructure Fund (MHRIF). Prof Pillow was supported by a NHMRC Senior
Research Fellowship (GRT1077691). Dr Svedenkrans was supported by The
Swedish Society of Medicine, The Samaritan Foundation, The Princess Lovisa
Memory Foundation, The Society of Child Care (Sällskapet Barnavård), and The
Fernstrom Foundation. Dr Stoecklin was supported by the Swiss National Science
Foundation (P2BSP3_158837) and a Research Training Program scholarship, The
University of Western Australia.
Short running head: Physiology of impaired gas exchange in BPD
Descriptor: 14.3
135
Manuscript Body Word Count: 3430
At a Glance Commentary:
Scientific Knowledge on the Subject: Assessment of impaired gas exchange may
provide a continuous outcome measure for sensitive and equitable determination of
severity of bronchopulmonary dysplasia (BPD). Previous gas exchange studies in
BPD infants used small cohorts and targeted moderate-severe BPD. These studies
show right shift of the peripheral oxyhemoglobin saturation (SpO2) versus inspired
oxygen partial pressure (PIO2) curve and reduced ventilation-perfusion ratio reliably
predict hypoxaemia in preterm infants breathing air, and further, that many infants
also have a right-left shunt.
What This Study Adds to the Field: We provide measures of right shift,
ventilation/perfusion and shunt, across the full spectrum of lung disease in a large
(n=219) group of preterm infants. Shift increases and ventilation/perfusion decreases
with increased severity of BPD as defined by the NICHD classification of BPD. Shunt
is primarily a feature of infants with moderate-severe BPD who require supplemental
oxygen. Non-invasive bedside assessment of shift, ventilation/perfusion and shunt
provide physiological continuous outcome measures of severity of respiratory disease
in very preterm infants with/without BPD independent of altitude and unit practices.
Routine analysis of the SpO2/PIO2 curve may improve accuracy of BPD severity
classification and provide a sensitive continuous outcome measure for clinical trials
evaluating pulmonary outcomes.
*This article has an online data supplement, which is accessible from this issue's table
of content online at www.atsjournals.org
Contributors' Statements:
Dr J Svedenkrans collected and analysed the data, interpreted the data, drafted the
initial manuscript, performed literature search, drafted the figures, and approved the
final manuscript as submitted. Dr B Stoecklin assisted with the REDCap database
design and development, collected and analysed the data, interpreted the data,
reviewed and revised the manuscript, and approved the final manuscript as submitted.
Prof JG Jones developed the algorithms used for the calculation of shunt, shift and
VA/Q, reviewed and revised the manuscript, and approved the final manuscript as
submitted. Prof D Doherty contributed to the overall study design and successful
funding, advised on the statistical approach, reviewed the statistical analyses,
reviewed and approved the final manuscript as submitted. Assoc/Prof J J Pillow was
the principal investigator obtaining funding, leading study design including
development of the REDCap database, obtained the study funding, verified all
statistical calculations, interpreted the data, critically reviewed and revised the
manuscript, and approved the final manuscript as submitted.

136
A1.2. Abstract
A1.2.1. Rationale
A sensitive outcome measure for infants with bronchopulmonary dysplasia would
facilitate clinical benchmarking, enhance epidemiological understanding, evaluation
of clinical interventions, and outcome prediction.
A1.2.2. Objectives
Non-invasive assessment of pulmonary gas exchange in preterm infants with and
without bronchopulmonary dysplasia to grade disease severity and to identify
determinants of impaired gas exchange.
A1.2.3. Methods
Prospective observational study in very preterm infants. Inspired oxygen pressure was
decreased stepwise to achieve oxygen saturation from 95-86%. Right shift,
ventilation/perfusion ratio and right-left shunt were derived from the resulting oxygen
dissociation curve and compared to current disease severity classification. Potential
determinants of shift, ventilation/perfusion and shunt were identified using principal
components analysis and multiple linear regression.
A1.2.4. Measurements and Main Results
219 infants with median (IQR) gestation of 280(260-290) weeks had a valid study at
354(347-393) weeks’ postmenstrual age. Shift increased and ventilation/perfusion
decreased as severity of bronchopulmonary dysplasia increased. Infants with
moderate-severe disease also had increased shunt. Extent of impaired gas exchange
overlapped between severity groups. Infants requiring mechanical support but no
supplemental oxygen at 36 weeks’ postmenstrual age had similar values of shift,
ventilation/perfusion and shunt to preterm infants without bronchopulmonary
dysplasia. Lower gestation and increased duration of invasive ventilation
independently predicted increased shift, decreased ventilation/perfusion and increased
shunt. Shift was the most sensitive and specific index of the severity of
bronchopulmonary dysplasia.
A1.2.5. Conclusions
Most infants with bronchopulmonary dysplasia have impaired oxygenation quantified
by a simple, sensitive bedside test. The current definition of severe bronchopulmonary
dysplasia includes infants with minimal or no impairment of oxygenation.
Abstract Word Count: 250
Key words for indexing: infant, premature; ventilation, mechanical; oximetry;
ventilation-perfusion ratio; oxygen inhalation therapy.

137
A1.3. Introduction
Bronchopulmonary dysplasia (BPD) is a respiratory disorder in preterm infants
characterised by impaired development of alveoli and pulmonary capillaries. Impaired
development of the lung parenchyma may have life-long implications for respiratory
health (Bancalari et al., 2003). In this regard, and oddly without mentioning arterial
oxyhemoglobin saturation (SaO2), the National Institute of Child Health and
Development (NICHD) defined BPD in 2001 as a need for supplemental oxygen for
at least 28 days. Again without mention of SaO2, the NICHD defined severity of BPD
in very preterm infants by the level of supplemental oxygen required at 36 weeks’
postmenstrual age (PMA). The definition of severe BPD includes a need for pressure
support regardless of PIO2. The odd conclusion is that following these criteria, infants
breathing air have mild BPD; moderate BPD is a PIO2 of 22-29 kPa, and severe BPD
is a PIO2 ≥ 30 kPa or pressure respiratory support, even without supplemental oxygen
(A. H. Jobe & Bancalari, 2001).
Walsh and colleagues added another confusing dimension by proposing an alternative
“physiological” BPD classification (Walsh et al., 2003), that ultimately defined BPD
as “a SpO2 ≥ 90 % at 36 w PMA (Walsh et al., 2004)”; confusing because SpO2 in
healthy infants is ≥ 96 %. Hence the Walsh definition misclassifies infants with a mild
impairment of oxygenation as normal.
More recently, a NICHD workshop on BPD in 2016 proposed a revised definition of
BPD (Higgins et al., 2018). However, the suggested definition of BPD continues to
define BPD by its treatment rather than by functional or pathophysiological basis, and
does not address the limitations of the old 2001 definition outlined above.
An alternative, non-invasive approach for assessing pulmonary outcomes after
preterm birth measures SpO2 when PIO2 is reduced stepwise, and from the shape and
position of the SpO2 vs PIO2 curve derives the right shift from the position of the
oxyhemoglobin dissociation curve, reduced ventilation/perfusion ratio (VA/Q), and
shunt Error! Reference source not found. (Roe et al., 1993; Sapsford & Jones, 1
995). This approach was initially described in 1993,(Roe & Jones, 1993) then first
applied to neonates in 2001(Smith & Jones, 2001). Subsequently, shift of the SpO2 vs
PIO2 curve was used to determine the PIO2 needed to achieve a SpO2 between 86 %
138
and 94 %, as an objective measure of BPD severity in infants with moderate to severe
BPD (Quine et al., 2006). Previous studies in preterm infants are limited by the small
cohort size (≤32 infants) (Bamat et al., 2015; Dassios et al., 2015; Quine et al., 2006;
Rowe et al., 2010), a focus on infants with moderate to severe BPD, (Bamat et al.,
2015; Quine et al., 2006; Rowe et al., 2010) and compensation for adult rather than
fetal hemoglobin (Bamat et al., 2015; Dassios et al., 2015; Quine et al., 2006; Rowe
et al., 2010). Full utility and application of the SpO2 vs PIO2 approach requires
application of the methodology across the full range of severity of BPD.
We derived the right shift of the SpO2 vs PIO2 curve, reduced VA/Q, and right to left
shunt in a large cohort of preterm infants representing the NICHD spectrum of BPD
severity: we used paired measurements of SpO2 and PIO2 at 36 weeks’ postmenstrual
age in 219 infants less than 32 weeks’ gestation. We ascertained the factors that might
influence impaired gas exchange at 36 weeks’ postmenstrual age. We hypothesised
that a) this approach would highlight the inconsistencies between the NICHD BPD
classification levels and functional impairment of oxygenation; and that b) gestation
and duration of invasive ventilation would be the primary independent factors
influencing shift of the SpO2 vs. PIO2 curve at 36 w postmenstrual age, whilst the
presence of significant right to left shunt would be restricted to infants with moderate
to severe BPD as defined by the NICHD (A. H. Jobe & Bancalari, 2001).

139
A1.4. Methods
A1.4.1. Study design and ethics approval
This study was a prospective evaluation of BPD severity in unsedated preterm infants
at 36 w postmenstrual age. The study was approved by the Women and Newborn
Health Service Human Research Ethics Committee (HREC: 1883EW and
20130193EW) and the University of Western Australia (RA/4/1/5942 and
RA/4/1/426).
A1.4.2. Study participants
Preterm infants were recruited from the Neonatal Critical Care Unit at King Edward
Memorial Hospital for Women in Perth, Western Australia (KEMH) Error! R
eference source not found.. Eligible infants were those born at KEMH before 32 w
gestation between 21st of July, 2013 and 8th of January, 2017 with informed consent
from a parent or guardian. All included infants were a part of the Preterm Infant
Functional and Clinical Outcomes (PIFCO) study (ACTRN12613001062718l).
Infants were excluded if they had a major congenital malformation.
A1.4.3. Outcome assessment
Infants were tested at 36 w PMA or immediately prior to hospital discharge, whichever
occurred sooner. Infants who were intubated, or clinically unstable at 36 w PMA were
tested within three weeks, as soon as clinical instability had resolved. Infants were
studied supine during sleep, or during quiet consciousness.
A1.4.4. Paired measurements of SpO2 and PIO2
All studies were obtained at sea level at which the percentage of inspired oxygen
closely approximates PIO2 (kPa). Inspired oxygen concentration was measured using
a calibrated oxygen analyser (Model: AX-300, Teledyne Analytical Instr. California).
SpO2 was measured from the infant’s right hand (MasimoSET® Radical-7™, Masimo
Corporation, Frenchs Forest/NSW); a valid SpO2 measurement was defined as a good
pulse wave form on the monitor without movement artefact. Measurements of SpO2
and PIO2 were recorded digitally (Powerlab, ADInstruments, Bella Vista, NSW) and
monitored and analysed within LabChart (v7, ADInstruments).
140
The test was usually performed using a head box with a continuous fresh gas flow of
6 L/min commencing at the prescribed PIO2. Infants receiving CPAP or humidified
high flow with supplemental oxygen above 25 kPa were tested bedside using
adjustments to the air/oxygen blender whilst continuing on the prescribed respiratory
support with a closed mouth.
PIO2 was reduced in ~5 steps of 1-3 kPa, to achieve SpO2 ranging from ~95-86 %.
Average SpO2 and PIO2 were determined from a one minute recording obtained four
minutes after each change in PIO2. PIO2 was decreased below 21 kPa for infants with
a SpO2 of ≥ 90 % in air, by mixing air (20·8 kPa O2) with a mixture of 14 kPa oxygen
in nitrogen (BOC, Perth, Western Australia, Australia). The lowest permissible PIO2
and SpO2 were 14 kPa and 86 % respectively. Hemoglobin was determined from a
capillary or venous blood gas obtained within three days of the study.
The SpO2 vs PIO2 curve was plotted from paired values of SpO2 and PIO2 and
compared to the expected SpO2 vs PIO2 curve, using the neonatal oxyhemoglobin
dissociation curve as reference (see Figure A1.10.1.). Shift, VA/Q and right to left
shunt were derived using the Lockwood algorithm, which derives results for each
dataset from both 1) a two compartment model (shunt, shift and VA/Q of a single
homogeneous ventilated compartment) and 2) a three compartment model (shunt,
VA/Q for each of two homogeneous ventilated compartments and the relative
perfusion of each ventilated lung region) (Lockwood et al., 2014). The current
hemoglobin level was incorporated in the computations.
A1.4.5. Data management and statistical methods
Recruitment and study data were collected prospectively and managed using Research
Electronic Data Capture (REDCap) software hosted at The University of Western
Australia (P.A. Harris et al., 2009). Analysis included all infants with a valid study.
Descriptive statistics are presented as mean (SD) for variables with normal distribution
and with median (IQR) for variables without normal distribution. Infant characteristics
(excluded and tested) were performed using t-test, Mann-Whitney U-test and chi2-test,
as appropriate. The relation between the outcome variables (shift, VA/Q and shunt)
and the infant’s NICHD BPD classification were determined using one way ANOVA.
The threshold level that optimised sensitivity and specificity for defining mild,
141
moderate or severe BPD was calculated from a receiver operating curve as
√(1 − Sensitivity)2 + (1 − Specificity)2.
Potential explanatory variables for the outcome variables of shift, VA/Q and shunt
were examined for normal distribution (Shapiro-Wilk) and collinearity (Variance
Inflation Factor). Skewed data were transformed to meet assumptions required for
linear regression. Postnatal explanatory variables collinear with maturity at birth were
regressed against gestation, and the unstandardized residuals saved as an independent
linear measure of the variable of interest.
Potential independent perinatal factors influencing shift, VA/Q and shunt were
identified from univariate regression. Principal component analysis was used to
identify key variance factors (Eigenvalue >1·0) within the cohort and to address
residual multiple collinearity between potential explanatory variables. The factor with
the highest score of the rotated component matrix and least overlap with other factors
was selected for stepwise multiple linear regression. Model fit is reported as adjusted
R2. Effect size is reported as B (95 % CI). Statistical significance was defined as
p<0·05. Data were analysed using SPSS (v25; IBM Corp, USA).
142
A1.5. Results
A1.5.1. Cohort description
The flow pathway describing eligibility, recruitment and enrolment into the study is
shown in Figure 14. Characteristics of eligible, recruited and studied infants are shown
in Table 17. Studied infants are further characterised according to NICHD BPD
severity classification in Table 16.
A1.5.2. Relation of oxygen dissociation curve outcome variables to
NICHD BPD Severity Classification
Tests were completed within 25-30 minutes (5 steps of 5 min each). A valid test was
obtained from each infant tested. Shift, VA/Q and shunt derived from the neonatal
oxyhemoglobin curve are shown according to NICHD BPD classification in Figure
15; the median (IQR) shift, VA/Q and shunt are presented in Table 20 (online data
supplement). Data from all included infants were best fitted to a two compartment
model, indicative of homogeneous gas exchange (Lockwood et al., 2014). Outcomes
using the adult oxyhemoglobin curve as a reference are provided in Table 21 (online
data supplement) for comparative purposes.
Shift was increased and VA/Q was decreased in infants with mild, moderate or severe
BPD compared to no BPD, and for infants with severe BPD compared to mild BPD.
Shift was also increased in moderate compared to mild BPD. The difference in shift
and VA/Q between infants with moderate and severe BPD was not statistically
significant.
To understand the basis for the overlap in 95 % confidence intervals between moderate
and severe BPD, we characterised the severe BPD group (n=33) according to oxygen
requirement alone: 3 infants had received less than 28 d supplemental oxygen and
were not receiving supplemental oxygen at 36 w PMA; 3 had received at least 28 d
supplemental oxygen but were not receiving supplemental oxygen at 36 w PMA; 11
received at least 28 d supplemental oxygen but were requiring less than 30 % oxygen
at 36 w PMA; with the remaining 16 infants all requiring at least 30 % oxygen at 36
w PMA. Severe BPD infants not requiring supplemental oxygen at 36 w PMA had
significantly lower shift and higher VA/Q values than the severe BPD infants requiring
143
oxygen (Table 20, online data supplement). Infants classified as having severe BPD
by the NICHD criteria who were not receiving oxygen at 36 w PMA had shift and
VA/Q values that were not statistically different to infants with no BPD (p = 0.175 and
p = 0.389 respectively), suggesting absence of significant parenchymal pathology
despite their BPD classification.
Shunt was increased in infants with severe BPD compared to infants with no BPD or
mild BPD, and in infants with moderate BPD compared to infants with no BPD. There
was no difference in shunt between infants with no BPD or mild BPD, or between
moderate and severe BPD. Shunt in infants with severe BPD not requiring oxygen at
36 w PMA (Table 20, online data supplement) was not significantly different from
shunt in infants with no BPD or mild BPD (p = 1.0 and p = 1.0). There was no
difference in shunt between infants classified as severe BPD requiring or not requiring
supplemental oxygen (p = 0.153).
Shift was the outcome variable with the greatest area under the curve as an indicator
of the presence of any BPD or moderate-severe BPD on ROC analysis (Table 18).
Restriction of the ROC analysis to define a threshold shift value for moderate to severe
BPD according to requirement for supplemental oxygen at 36 w PMA alone resulted
in a small increase in the threshold shift level, with increased sensitivity and increased
specificity. Specificity of the ROC was lower for the threshold shift value
discriminating between infants with no BPD and any BPD.
A1.5.3. Univariate Analyses for Potential Explanatory Variables and
Principle Components Analyses
Univariate analyses of antenatal factors, perinatal characteristics, markers of disease
severity, nutrition, growth and maturity at test relative to shift, VA/Q and shunt are
shown in Table 23 (online data supplement). A graph of shift versus both gestation
and duration of ventilation relative to oxygen requirements at 36 w PMA is shown in
Figure 16 (online data supplement). Principal components analysis identified multi-
collinearity between these variables and grouped potential influential perinatal factors
into four key factors defining postnatal nutrition (average daily protein, fluid and
caloric intake over the first month of life), postnatal illness severity (duration of
mechanical ventilation, postnatal steroids and airleak), maturation at birth (gestation),

144
and health status at test (non-invasive ventilation and postmenstrual age at test) as
shown in Table 23 (online data supplement).
A1.5.4. Multiple linear Regression
Shift and VA/Q were principally defined by gestational age and duration of mechanical
ventilation Table 19: together these explanatory variable accounted for 34.4 % of the
variability in shift and 23.7 % of the variability in VA/Q. Shunt was principally defined
by duration of mechanical ventilation, and to a lesser extent by gestation, which
together accounted for 19.2 % of the total variability in measurement of shunt (Table
19).
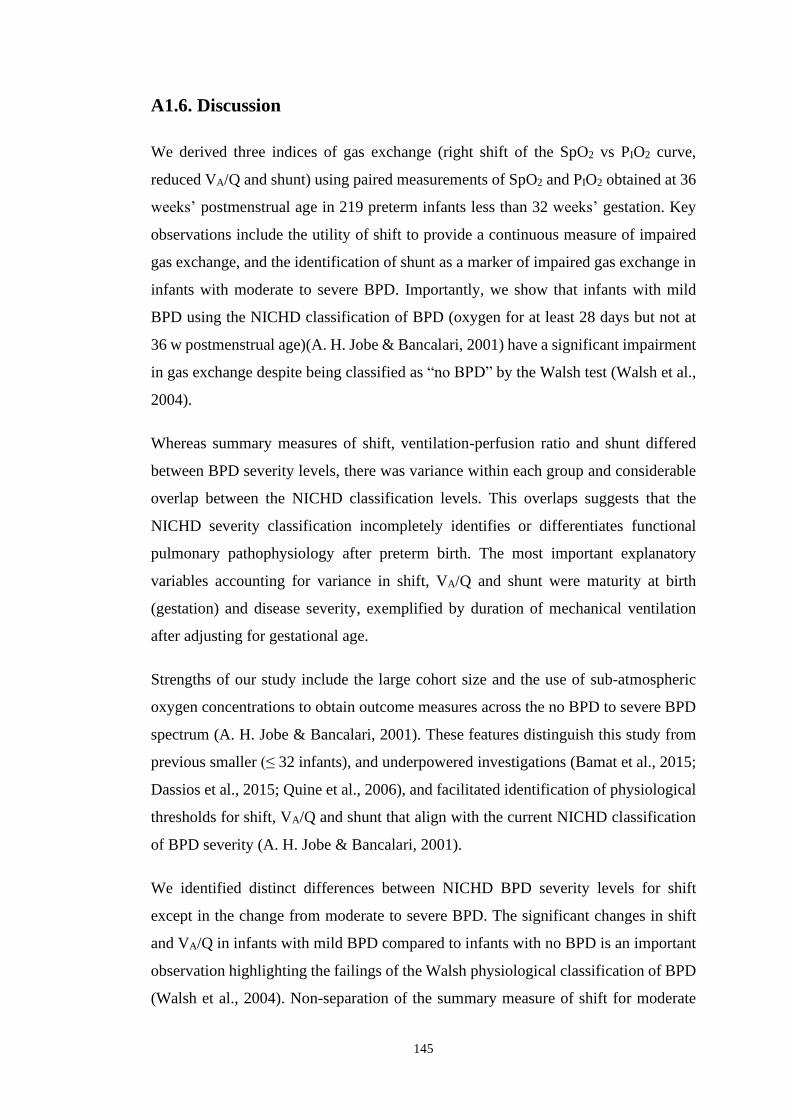
145
A1.6. Discussion
We derived three indices of gas exchange (right shift of the SpO2 vs PIO2 curve,
reduced VA/Q and shunt) using paired measurements of SpO2 and PIO2 obtained at 36
weeks’ postmenstrual age in 219 preterm infants less than 32 weeks’ gestation. Key
observations include the utility of shift to provide a continuous measure of impaired
gas exchange, and the identification of shunt as a marker of impaired gas exchange in
infants with moderate to severe BPD. Importantly, we show that infants with mild
BPD using the NICHD classification of BPD (oxygen for at least 28 days but not at
36 w postmenstrual age)(A. H. Jobe & Bancalari, 2001) have a significant impairment
in gas exchange despite being classified as “no BPD” by the Walsh test (Walsh et al.,
2004).
Whereas summary measures of shift, ventilation-perfusion ratio and shunt differed
between BPD severity levels, there was variance within each group and considerable
overlap between the NICHD classification levels. This overlaps suggests that the
NICHD severity classification incompletely identifies or differentiates functional
pulmonary pathophysiology after preterm birth. The most important explanatory
variables accounting for variance in shift, VA/Q and shunt were maturity at birth
(gestation) and disease severity, exemplified by duration of mechanical ventilation
after adjusting for gestational age.
Strengths of our study include the large cohort size and the use of sub-atmospheric
oxygen concentrations to obtain outcome measures across the no BPD to severe BPD
spectrum (A. H. Jobe & Bancalari, 2001). These features distinguish this study from
previous smaller (≤ 32 infants), and underpowered investigations (Bamat et al., 2015;
Dassios et al., 2015; Quine et al., 2006), and facilitated identification of physiological
thresholds for shift, VA/Q and shunt that align with the current NICHD classification
of BPD severity (A. H. Jobe & Bancalari, 2001).
We identified distinct differences between NICHD BPD severity levels for shift
except in the change from moderate to severe BPD. The significant changes in shift
and VA/Q in infants with mild BPD compared to infants with no BPD is an important
observation highlighting the failings of the Walsh physiological classification of BPD
(Walsh et al., 2004). Non-separation of the summary measure of shift for moderate
146
and severe BPD was due in part to the inclusion of infants classified as severe BPD
with requirement for mechanical respiratory support but no, minimal, or moderate
impairment of gas exchange, as illustrated in Figure 16. We did not include a measure
of airway function or control of breathing in our assessment. However, the need for
ongoing positive pressure in this subset of infants may have an alternative
physiological basis than parenchymal lung disease. The pathophysiological basis of
respiratory support requirements is an important consideration for future development
of a BPD classification to inform ongoing clinical management and outcome
prediction.
Recruitment was biased to target a higher proportion of more immature infants than
observed in a geographic cohort of preterm births before 32 weeks. However, the even
spread of gestational age and disease severity across the cohort improved study power
to identify the primary explanatory factors defining the magnitude of our outcome
variables.
The studies were well tolerated by all infants. Hypoxic gas mixtures are used routinely
pre-flight for assessment of need for supplemental oxygen during air travel, including
our preterm infant population (Hall et al., 2007; Resnick et al., 2008). Stepwise
reduction of PIO2 commencing the test with a SpO2 of at least 94 %, ensured sufficient
measurements were obtained to describe the upper inflection of the SpO2 vs. PIO2
curve. Infants on pressure support and a PIO2 > 25 % remained on pressure support
during the test, to avoid precipitating clinical instability. Maintenance of pressure
support in the face of oxygen requirement ensured we captured the gas exchange
capacity of the infant without confounding by small airway collapse. Whereas the
theoretical impact of commonly used continuous positive airway pressures (5-8
cmH2O) on pressure of inspired oxygen is negligible, the effect of such positive
pressure on shift, VA/Q and shunt needs formal evaluation.
The algorithm used to calculate shift, VA/Q and shunt adjusts for current hemoglobin
level. These outcome measures were derived using a reference curve based on fetal
rather than adult hemoglobin. The fetal curve lies to the left of the adult curve and
accounts for the differences between reported values of shift and VA/Q in our
population and those reported previously (Quine et al., 2006). Our approach is justified
as the neonatal curve produced better fit to our data and the level of HbF is related

147
mostly to postmenstrual age rather than gestation and the number of previous blood
transfusions received (Bard & Prosmanne, 1982; Berglund et al., 2014). Compared to
the cohort described by Jones et al, all of our data was best fitted to a two-compartment
model, indicating homogeneous lung disease across the whole cohort, independent of
disease severity. Non requirement of three-compartment modelling in our study may
suggest a different population group (Jones et al., 2016), or may indicate stenting of
the airways and reduction of airway obstruction resulting from the use of CPAP or
humidified high flow in infants with severe BPD.
Our finding that gestation is the principal independent determinant of shift and VA/Q
and also influences shunt confirms current understanding of the negative impact of
premature transition to ex utero life on growth and development of the lung. These
determinants of shift and VA/Q differ from those reported by Dassios et al (Dassios et
al., 2015). However, their smaller study (n = 24) was undertaken across a wider range
of postmenstrual age (29-36 w), did not consider collinearity between potential
influential factors (e.g. gestation and birth weight; postmenstrual age and study
weight), and did not include regression analysis to identify independent associations.
Illness severity defined by the duration of invasive ventilation not accounted for by
gestation was also an important independent contributor to impaired gas exchange.
Taken together, we conclude that treatments that reduce illness severity and decrease
postnatal co-morbidity may achieve significant improvements in pulmonary
outcomes.
Although VA/Q is derived from shift, the latter had higher sensitivity and specificity
for threshold values than either VA/Q or shunt. Accordingly, shift may provide the best
diagnostic index for assessing disease severity as a clinical benchmarking tool or as a
sensitive outcome determinant for clinical trials. Importantly, shift may be determined
from single paired measurements of SpO2 and PIO2 without the need for an extended
oxygen reduction test as undertaken in this study. Hence, shift of the oxyhemoglobin
dissociation curve offers the ease of a simple, rapid and quantitative bedside
assessment of impaired gas exchange that is easily adjusted for altitude (Quine et al.,
2006).
Our study has several limitations. Our endpoint selection of 36 w PMA precludes
comparison of preterm outcomes against those obtained in a healthy term cohort.

148
Previously published outcomes for shift, VA/Q and shunt for term born infants at a
median 3 days postnatal age indicate lower shift, higher VA/Q and similarly low values
of shunt relative to the preterm infants without BPD in our study.(Dassios et al., 2017)
Although measurements in these term infants were analysed using a reference curve
accounting for adult rather than fetal hemoglobin, they may also indicate potential for
improvement in gas exchange with more advanced lung development and/or
maturation.
Secondly, tests were performed at a slightly lower postmenstrual age in clinically
stable infants compared to more immature and sicker babies due to early discharge or
inter-hospital transfers. This spread of postmenstrual age may have reduced
differences between different disease severity levels. However, post-menstrual age
had a non-significant contribution to the regression model and hence the effect of this
bias is likely minimal within the current study.
A1.7. Conclusions
Shift of the SpO2 vs PIO2 curve, VA/Q and shunt provide a simple and safe continuous
physiological outcome measure for quantifying the full range of severity of lung
disease in very and extremely preterm infants at 36 weeks’ postmenstrual age,
independent of altitude and local oxygen prescribing protocols. The presence or
absence of these functional impairments are described poorly by the current BPD
classifications, which perplexingly define BPD severity from non-standardised,
clinician prescribed treatment using arbitrary thresholds. Even preterm infants with no
BPD have mild impairment of gas exchange at 36 weeks’ postmenstrual age. Infants
with mild BPD have worse gas exchange than preterm infants with no BPD, despite
classification as no BPD according to the Walsh physiological classification of BPD
(Walsh et al., 2004). Further, evidence of increased shunt in infants with moderate to
severe BPD may signal a need for incorporating cardiological follow-up into planning
for healthcare after initial hospital discharge.
Future studies should evaluate the repeatability and reproducibility of these measures,
evaluate the use of this technique to quantify improvement or deterioration in gas
exchange over time, identify its utility for clinical benchmarking, and as a sensitive
outcome to assess the effect of clinical interventions on lung development.

149
A1.8. Acknowledgements
The authors would like to acknowledge the research nurses Natasha Mackay-Coghill,
and Amanda Woods, Honours students Zeena Al-Obaidi and Jane Choi, and all the
included infants, and their parents. We would like to acknowledge Dr GG Lockwood
for kindly providing the computer program used for analysis of shift, VA/Q and shunt.
We also acknowledge the important preliminary studies undertaken by Dr Alex Wood
in 2011, the data from which contributed to obtaining the funding for this grant and
development of the measurement protocol. Ms Nash Kahn is thanked for her assistance
with database design, development and management.
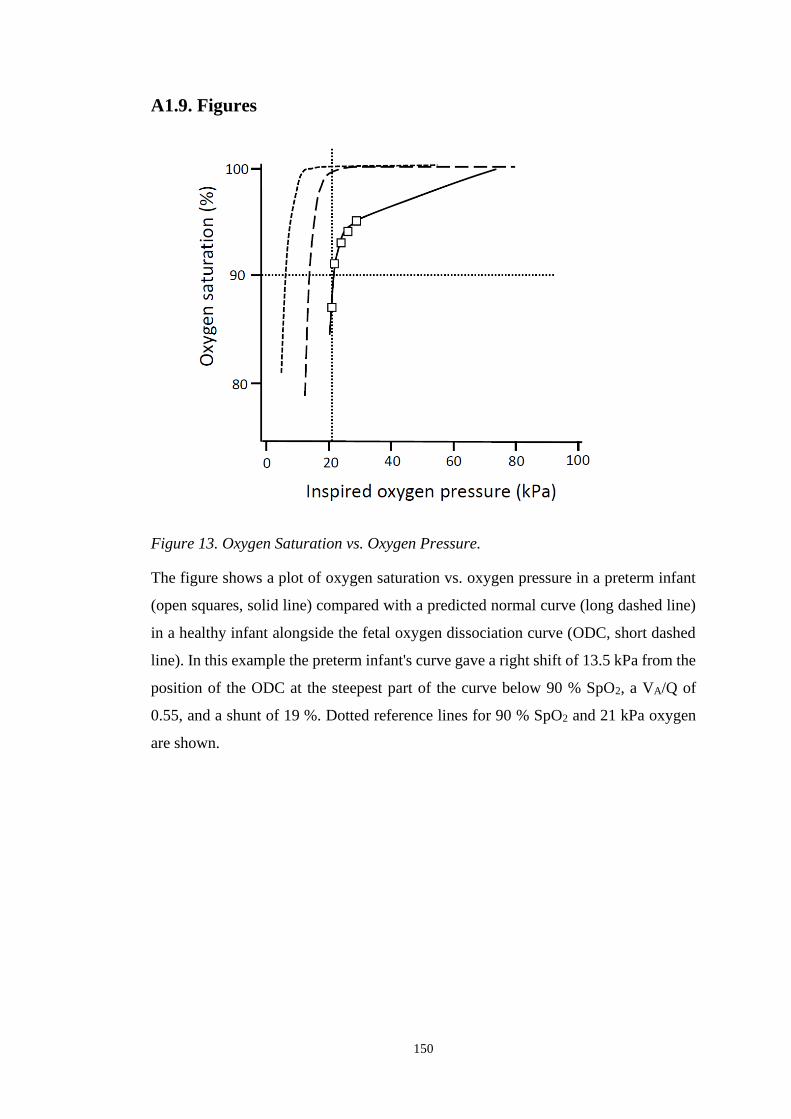
150
A1.9. Figures
Figure 13. Oxygen Saturation vs. Oxygen Pressure.
The figure shows a plot of oxygen saturation vs. oxygen pressure in a preterm infant
(open squares, solid line) compared with a predicted normal curve (long dashed line)
in a healthy infant alongside the fetal oxygen dissociation curve (ODC, short dashed
line). In this example the preterm infant's curve gave a right shift of 13.5 kPa from the
position of the ODC at the steepest part of the curve below 90 % SpO2, a VA/Q of
0.55, and a shunt of 19 %. Dotted reference lines for 90 % SpO2 and 21 kPa oxygen
are shown.
151
Figure 14. Flowchart describing the inclusion pathway of the studied infants.
Of 1088 infants born during the study period, 43 had major congenital malformations,
leaving 1045 eligible infants. Parents of 508 infants were not approached, and parental
consent was not given for an additional 248 infants, resulting in 289 infants enrolled.
219 of the 291 enrolled infants had a completed test. Reasons for non-completion of
the test included early transfer to another hospital (n = 59), deceased or too sick to be
tested (n = 6), withdrawal of consent prior to study (n = 1), and other (n = 4).

152
Figure 15. Shift, VA/Q and shunt for included infants relative to NICHD BPD
classification. Mean values and 95 % confidence intervals for A) shift, B) VA/Q, and
C) shunt for infants with no BPD, mild BPD, moderate BPD and severe BPD.
Accompanying dot plot shows the spread of individual measurements.

153
A1.10. Tables
Table 16. Comparison of patient demographics for eligible and recruited infant subpopulations.
Included in the PIFCO cohort p value (95 % CI)
all eligible infants
n=1045
not enrolled
n=756
enrolled
n=289
tested
n=219
not tested
n=70
not enrolled vs
enrolled
tested vs
not tested
male (n, % male) 600 (57·4) 415 (54.9) 185 (64·0) 138 (63·0) 47 (67·1) 0·008 0·531
GA (median, IQR) 29·3 (27·1,31·0) 30·0 (27·0,31·0) 28·0 (26·0,30·0) 28.0 (26·0, 9·0) 29·0 (27·0,31·0) <0·001 (1·0,2·0)* 0·001 (0·0,2·0)*
BW (mean, SD) 1217 (401) 1260 (415) 1104 (336) 1070 (318) 1209 (369) <0·001 (103·2,210·4)^ 0·002 (49·3,237·0)^
BW z-score (mean, SD) 0.01 (0·89) 0·00 (0·90) 0·01 (0·86) 0·02 (0·87) -0.01 (0·83) 0·877 (-0·130,0·111)^ 0·799 (-0·260,0·198)^
Any choriamnionitis (n, %) 153 (14·6) 109 (14·4) 44 (15·2) 37 (16·9) 7 (10·0) 0·741 0·162
Any antenatal steroid (n,%) 1002 (95·9) 721 (95·4) 281 (97·2) 212 (96·8) 69 (98·6) 0·175 0·433
Any postnatal steroids (n, %) 49 (4·7) 33 (4·4) 16 (5·5) 14 (6·4) 2 (2·9) 0·423 0·260
MV (d; median, IQR) 0·3 (0·0·18) 0·3 (0·0, 1·6) 0·5 (0, 3·5) 0·6 (0, 4·9) 0·15 (0·0, 1·0) <0·001 (-0·30, 0·00)* 0·005 (-0·5, 0·0)*
Moderate to severe BPD (n, %) 136 (13·0) 70 (9·3) 66 (22·8) 57 (26·0) 9 (12·9) <0·001 0·022
GA – Gestational age, BW – Birth weight, BPD – Bronchopulmonary dysplasia; MV – mechanical ventilation; * Mann-Whitney U Test, ^t-test.
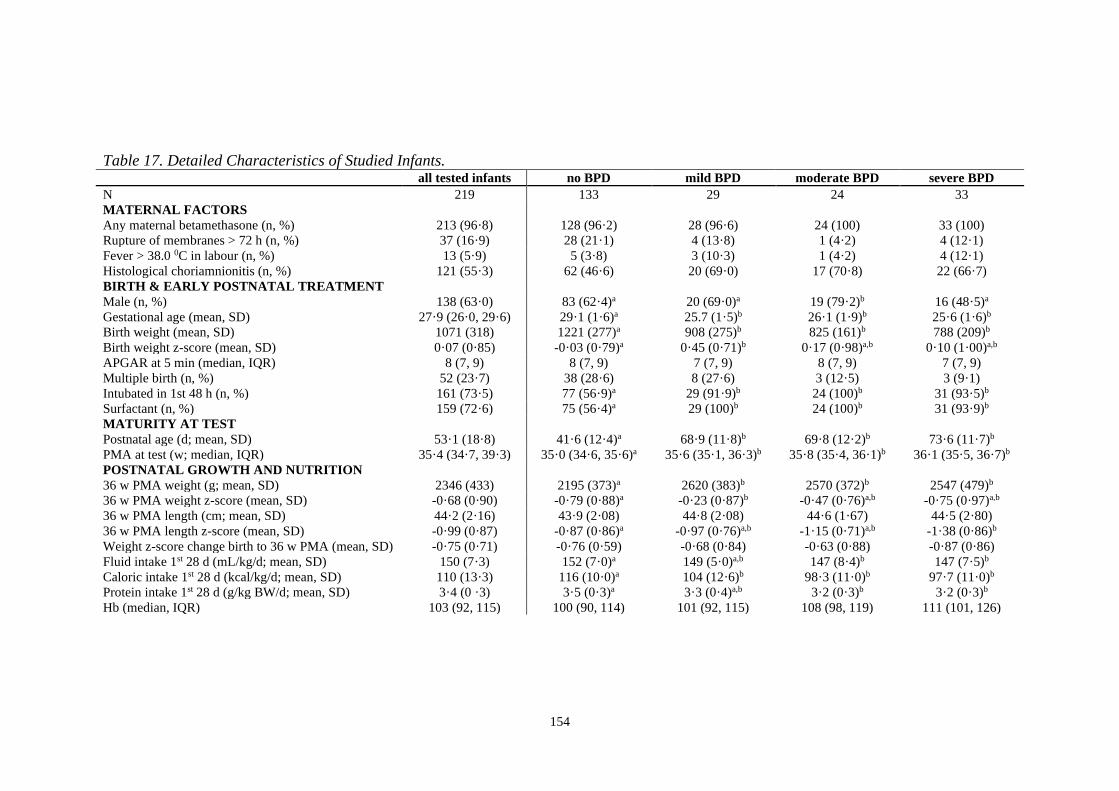
154
Table 17. Detailed Characteristics of Studied Infants. all tested infants no BPD mild BPD moderate BPD severe BPD
N 219 133 29 24 33
MATERNAL FACTORS
Any maternal betamethasone (n, %) 213 (96·8) 128 (96·2) 28 (96·6) 24 (100) 33 (100)
Rupture of membranes > 72 h (n, %) 37 (16·9) 28 (21·1) 4 (13·8) 1 (4·2) 4 (12·1)
Fever > 38.0 0C in labour (n, %) 13 (5·9) 5 (3·8) 3 (10·3) 1 (4·2) 4 (12·1)
Histological choriamnionitis (n, %) 121 (55·3) 62 (46·6) 20 (69·0) 17 (70·8) 22 (66·7)
BIRTH & EARLY POSTNATAL TREATMENT
Male (n, %) 138 (63·0) 83 (62·4)a 20 (69·0)a 19 (79·2)b 16 (48·5)a
Gestational age (mean, SD) 27·9 (26·0, 29·6) 29·1 (1·6)a 25.7 (1·5)b 26·1 (1·9)b 25·6 (1·6)b
Birth weight (mean, SD) 1071 (318) 1221 (277)a 908 (275)b 825 (161)b 788 (209)b
Birth weight z-score (mean, SD) 0·07 (0·85) -0·03 (0·79)a 0·45 (0·71)b 0·17 (0·98)a,b 0·10 (1·00)a,b
APGAR at 5 min (median, IQR) 8 (7, 9) 8 (7, 9) 7 (7, 9) 8 (7, 9) 7 (7, 9)
Multiple birth (n, %) 52 (23·7) 38 (28·6) 8 (27·6) 3 (12·5) 3 (9·1)
Intubated in 1st 48 h (n, %) 161 (73·5) 77 (56·9)a 29 (91·9)b 24 (100)b 31 (93·5)b
Surfactant (n, %) 159 (72·6) 75 (56·4)a 29 (100)b 24 (100)b 31 (93·9)b
MATURITY AT TEST
Postnatal age (d; mean, SD) 53·1 (18·8) 41·6 (12·4)a 68·9 (11·8)b 69·8 (12·2)b 73·6 (11·7)b
PMA at test (w; median, IQR) 35·4 (34·7, 39·3) 35·0 (34·6, 35·6)a 35·6 (35·1, 36·3)b 35·8 (35·4, 36·1)b 36·1 (35·5, 36·7)b
POSTNATAL GROWTH AND NUTRITION
36 w PMA weight (g; mean, SD) 2346 (433) 2195 (373)a 2620 (383)b 2570 (372)b 2547 (479)b
36 w PMA weight z-score (mean, SD) -0·68 (0·90) -0·79 (0·88)a -0·23 (0·87)b -0·47 (0·76)a,b -0·75 (0·97)a,b
36 w PMA length (cm; mean, SD) 44·2 (2·16) 43·9 (2·08) 44·8 (2·08) 44·6 (1·67) 44·5 (2·80)
36 w PMA length z-score (mean, SD) -0·99 (0·87) -0·87 (0·86)a -0·97 (0·76)a,b -1·15 (0·71)a,b -1·38 (0·86)b
Weight z-score change birth to 36 w PMA (mean, SD) -0·75 (0·71) -0·76 (0·59) -0·68 (0·84) -0·63 (0·88) -0·87 (0·86)
Fluid intake 1st 28 d (mL/kg/d; mean, SD) 150 (7·3) 152 (7·0)a 149 (5·0)a,b 147 (8·4)b 147 (7·5)b
Caloric intake 1st 28 d (kcal/kg/d; mean, SD) 110 (13·3) 116 (10·0)a 104 (12·6)b 98·3 (11·0)b 97·7 (11·0)b
Protein intake 1st 28 d (g/kg BW/d; mean, SD) 3·4 (0 ·3) 3·5 (0·3)a 3·3 (0·4)a,b 3·2 (0·3)b 3·2 (0·3)b
Hb (median, IQR) 103 (92, 115) 100 (90, 114) 101 (92, 115) 108 (98, 119) 111 (101, 126)
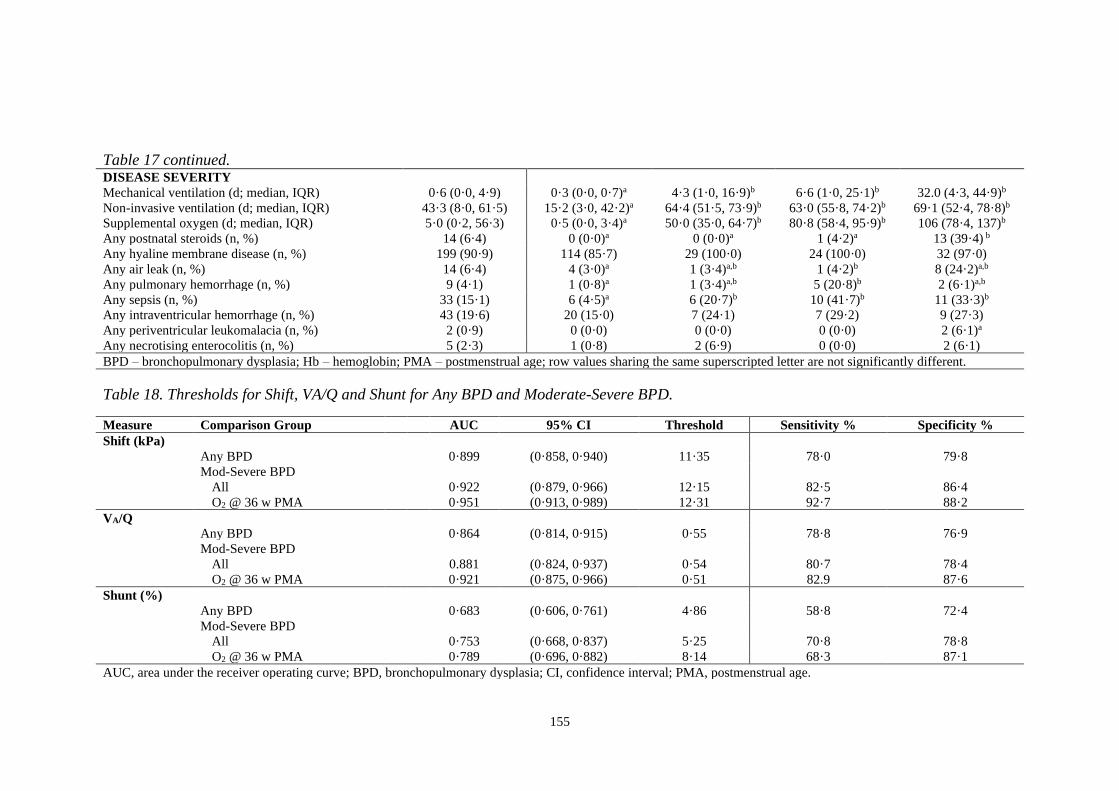
155
Table 18. Thresholds for Shift, VA/Q and Shunt for Any BPD and Moderate-Severe BPD.
Measure Comparison Group AUC 95% CI Threshold Sensitivity % Specificity %
Shift (kPa)
Any BPD 0·899 (0·858, 0·940) 11·35 78·0 79·8
Mod-Severe BPD
All 0·922 (0·879, 0·966) 12·15 82·5 86·4
O2 @ 36 w PMA 0·951 (0·913, 0·989) 12·31 92·7 88·2
VA/Q
Any BPD 0·864 (0·814, 0·915) 0·55 78·8 76·9
Mod-Severe BPD
All 0.881 (0·824, 0·937) 0·54 80·7 78·4
O2 @ 36 w PMA 0·921 (0·875, 0·966) 0·51 82.9 87·6
Shunt (%)
Any BPD 0·683 (0·606, 0·761) 4·86 58·8 72·4
Mod-Severe BPD
All 0·753 (0·668, 0·837) 5·25 70·8 78·8
O2 @ 36 w PMA 0·789 (0·696, 0·882) 8·14 68·3 87·1
AUC, area under the receiver operating curve; BPD, bronchopulmonary dysplasia; CI, confidence interval; PMA, postmenstrual age.
Table 17 continued.
DISEASE SEVERITY
Mechanical ventilation (d; median, IQR) 0·6 (0·0, 4·9) 0·3 (0·0, 0·7)a 4·3 (1·0, 16·9)b 6·6 (1·0, 25·1)b 32.0 (4·3, 44·9)b
Non-invasive ventilation (d; median, IQR) 43·3 (8·0, 61·5) 15·2 (3·0, 42·2)a 64·4 (51·5, 73·9)b 63·0 (55·8, 74·2)b 69·1 (52·4, 78·8)b
Supplemental oxygen (d; median, IQR) 5·0 (0·2, 56·3) 0·5 (0·0, 3·4)a 50·0 (35·0, 64·7)b 80·8 (58·4, 95·9)b 106 (78·4, 137)b
Any postnatal steroids (n, %) 14 (6·4) 0 (0·0)a 0 (0·0)a 1 (4·2)a 13 (39·4) b
Any hyaline membrane disease (n, %) 199 (90·9) 114 (85·7) 29 (100·0) 24 (100·0) 32 (97·0)
Any air leak (n, %) 14 (6·4) 4 (3·0)a 1 (3·4)a,b 1 (4·2)b 8 (24·2)a,b
Any pulmonary hemorrhage (n, %) 9 (4·1) 1 (0·8)a 1 (3·4)a,b 5 (20·8)b 2 (6·1)a,b
Any sepsis (n, %) 33 (15·1) 6 (4·5)a 6 (20·7)b 10 (41·7)b 11 (33·3)b
Any intraventricular hemorrhage (n, %) 43 (19·6) 20 (15·0) 7 (24·1) 7 (29·2) 9 (27·3)
Any periventricular leukomalacia (n, %) 2 (0·9) 0 (0·0) 0 (0·0) 0 (0·0) 2 (6·1)a
Any necrotising enterocolitis (n, %) 5 (2·3) 1 (0·8) 2 (6·9) 0 (0·0) 2 (6·1)
BPD – bronchopulmonary dysplasia; Hb – hemoglobin; PMA – postmenstrual age; row values sharing the same superscripted letter are not significantly different.

156
Table 19. Multivariable Analyses.
Outcome Variable Explanatory Variables Adjusted R2 Coefficient (B) SE 95 % CI p value
Right shift (kPa) Constant 32·3 2·535 27·3, 37·3 <0·0001
Gestational age (w) 0·192 -0·732 0·091 -0·91, -0·55 <0·0001
Duration of mechanical ventilation (d)* 0·152 0·130 0·018 0·09, 0·17 <0·0001
VA/Q Constant -0·187 0·094 -0·407, 0·032 0·094
Gestational age (w) 0·162 0·021 0·003 0·013, 0·028 <0·0001
Duration of mechanical ventilation (d)* 0·063 -0·003 0·001 -0·004, -0·001 <0·0001
Average daily protein 1st 28 d (g/kg) 0·012 0·057 0·.027 0·003, 0·110 0.038
Shunt (%) Constant 24.5 4·99 14.7, 34.4 <0·0001
Duration of mechanical ventilation (d)* 0·136 0·209 0·035 0·137, 0·274 <0·0001
Gestational age (w) 0·056 -0·703 0·181 -1·057, -0·348 0·0001
SE, standard error; CI, confidence interval. *unstandardised residual of regression against gestational age.
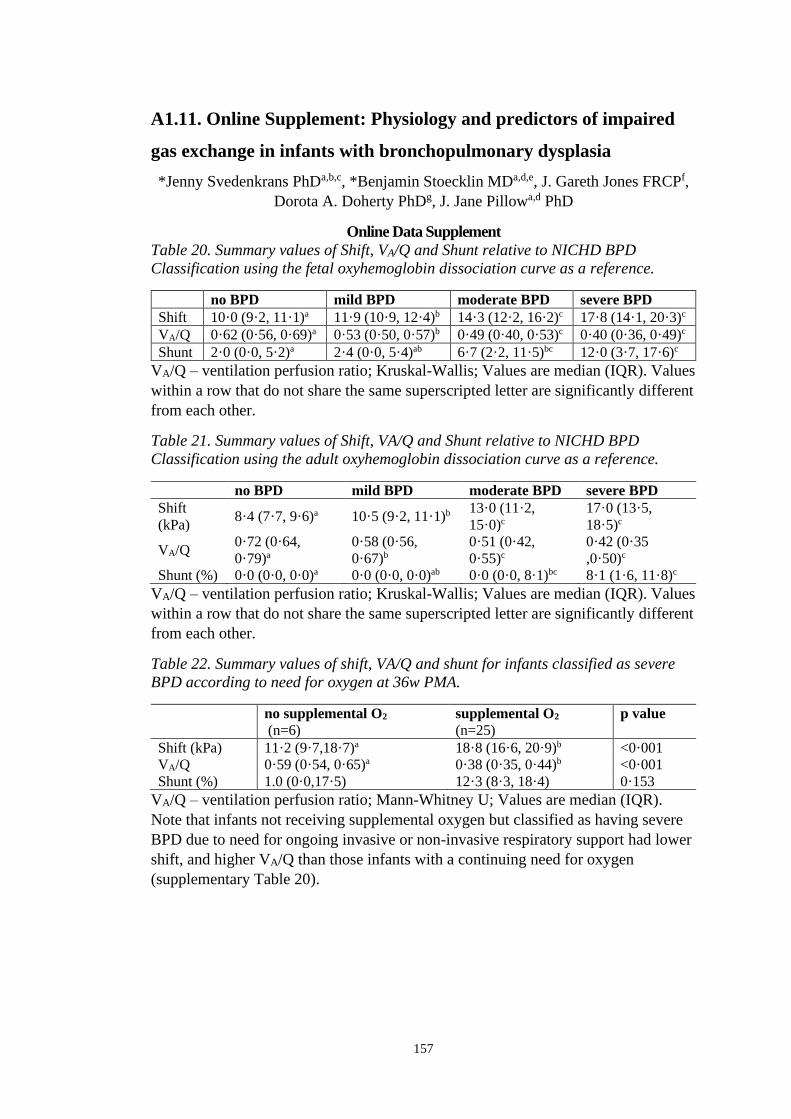
157
A1.11. Online Supplement: Physiology and predictors of impaired
gas exchange in infants with bronchopulmonary dysplasia
*Jenny Svedenkrans PhDa,b,c, *Benjamin Stoecklin MDa,d,e, J. Gareth Jones FRCPf,
Dorota A. Doherty PhDg, J. Jane Pillowa,d PhD
Online Data Supplement
Table 20. Summary values of Shift, VA/Q and Shunt relative to NICHD BPD
Classification using the fetal oxyhemoglobin dissociation curve as a reference.
no BPD mild BPD moderate BPD severe BPD
Shift 10·0 (9·2, 11·1)a 11·9 (10·9, 12·4)b 14·3 (12·2, 16·2)c 17·8 (14·1, 20·3)c
VA/Q 0·62 (0·56, 0·69)a 0·53 (0·50, 0·57)b 0·49 (0·40, 0·53)c 0·40 (0·36, 0·49)c
Shunt 2·0 (0·0, 5·2)a 2·4 (0·0, 5·4)ab 6·7 (2·2, 11·5)bc 12·0 (3·7, 17·6)c
VA/Q – ventilation perfusion ratio; Kruskal-Wallis; Values are median (IQR). Values
within a row that do not share the same superscripted letter are significantly different
from each other.
Table 21. Summary values of Shift, VA/Q and Shunt relative to NICHD BPD
Classification using the adult oxyhemoglobin dissociation curve as a reference.
no BPD mild BPD moderate BPD severe BPD
Shift
(kPa) 8·4 (7·7, 9·6)a 10·5 (9·2, 11·1)b
13·0 (11·2,
15·0)c
17·0 (13·5,
18·5)c
VA/Q 0·72 (0·64,
0·79)a
0·58 (0·56,
0·67)b
0·51 (0·42,
0·55)c
0·42 (0·35
,0·50)c
Shunt (%) 0·0 (0·0, 0·0)a 0·0 (0·0, 0·0)ab 0·0 (0·0, 8·1)bc 8·1 (1·6, 11·8)c
VA/Q – ventilation perfusion ratio; Kruskal-Wallis; Values are median (IQR). Values
within a row that do not share the same superscripted letter are significantly different
from each other.
Table 22. Summary values of shift, VA/Q and shunt for infants classified as severe
BPD according to need for oxygen at 36w PMA.
no supplemental O2
(n=6)
supplemental O2
(n=25)
p value
Shift (kPa) 11·2 (9·7,18·7)a 18·8 (16·6, 20·9)b <0·001
VA/Q 0·59 (0·54, 0·65)a 0·38 (0·35, 0·44)b <0·001
Shunt (%) 1.0 (0·0,17·5) 12·3 (8·3, 18·4) 0·153
VA/Q – ventilation perfusion ratio; Mann-Whitney U; Values are median (IQR).
Note that infants not receiving supplemental oxygen but classified as having severe
BPD due to need for ongoing invasive or non-invasive respiratory support had lower
shift, and higher VA/Q than those infants with a continuing need for oxygen
(supplementary Table 20).

158
Table 23. Pearson correlations® of shift, VA/Q and shunt with potential explanatory factors.
Shift VA/Q Shunt
r p value r p value r p value
MATERNAL FACTORS
Any maternal betamethasone 0·074 0·278 -0·042 0·538 0·094 0·168
No. of courses maternal betamethasone -0·038 0·586 0·029 0·671 0·012 0·865
Rupture of membranes > 72 h -0·075 0·268 0·03 0·663 -0·046 0·5
Fever > 38.0 C in labour 0·065 0·34 0·014 0·84 0·053 0·433
Histological chorioamnionitis 0·055 0·416 -0·091 0·181 -0·098 0·149
BIRTH & EARLY POSTNATAL TREATMENT
Intubated in 1st 48 h 0·042 0·54 -0·024 0·723 0·075 0·267
Multiple birth? -0·095 0·162 0·088 0·193 -0·103 0·13
Male -0·082 0·228 0·066 0·328 0·062 0·362
APGAR at 5 -0·103 0·128 0·104 0·123 -0·105 0·122
Surfactant given 0·264 <0·0001 -0·237 <0·0001 0·186 0·006
Number of surfactant doses 0·257 <0·0001 -0·228 0·001 0·199 0·003
MATURITY
GA -0·43 <0·0001 0·421 <0·0001 -0·223 <0·001
Postmenstrual age at test 0·206 0·002 -0·189 0·005 0·205 0·002
Continues on next page

159
Table 23. continued GROWTH AND NUTRITION
Birth weight Z score 0·066 0·329 -0·05 0·461 0·061 0·370
Weight Z score at test 0·065 0·338 -0·057 0·406 0·036 0·594
Length Z score at test -0·097 0·156 0·092 0·180 -0·051 0·461
Weight z-score change birth to 36 w PMA 0·002 0·979 -0·010 0·879 -0·023 0·733
Average fluid intake 1st 28 d -0·282 <0·0001 0·229 0·001 -0·175 0·010
Average caloric intake 1st 28 d -0·451 <0·0001 0·409 <0·0001 -0·268 0·042
Average protein intake 1st 28 d -0·310 <0·0001 0·286 <0·0001 -0·138 <0·0001
DISEASE SEVERITY
Mechanical ventilation 0·584 <0·0001 -0·460 <0·001 0·432 <0·0001
Non-invasive ventilation 0·477 0·002 -0·450 0·005 0·298 0·003
Any postnatal steroids 0·470 <0·0001 -0·305 <0·0001 0·418 <0·0001
Total days of postnatal steroids 0·419 <0·0001 -0·250 <0·001 0·295 <0·0001
Any hyaline membrane disease 0·118 0·083 -0·112 0·098 0·155 0·022
Any airleak 0·344 <0·0001 -0·237 <0·001 0·139 0·040
Any pulmonary haemorrhage 0·147 0·030 -0·159 0·018 0·103 0·130
Any sepsis 0·258 <0·001 -0·276 <0·0001 0·151 0·026
Any intraventricular haemorrhage 0·017 0·804 0·010 0·883 0·039 0·563
Any periventricular leukomalacia 0·076 0·265 -0·082 0·226 0·104 0·126
Any necrotising enterocolitis 0·137* 0·043 -0·103 0·128 0·044 0·517
VA/Q – ventilation perfusion; PMA – postmenstrual age. Significant correlations are in bold font.

160
Gestation (w)
22 24 26 28 30 32
Shif
t (k
Pa)
0
10
20
30
40
Ventilation (d)
0 10 20 30 40 50 60 70
0
10
20
30
40
Figure 16. Major determinants of right shift of the SpO2/PIO2 curve. Figure shows
relation between measured right shift of the SpO2/PIO2 and gestation (left panel) and
duration of invasive ventilation (right panel). Symbols show NIH BPD classification:
no BPD (op circle); mild BPD (pink triangle); moderate BPD (brown square) and
severe BPD (diamond). The fill colour of the severe BPD diamond symbols are
coloured according to the whether infants required oxygen for less than 28 d (white)
or according to oxygen requirement at 36 w PMA in those infants requiring
supplemental oxygen for at least 28 d: air (pink), < 30 % (brown) and ≥ 30 % (blue).
The mean (95 % CI) for the no BPD group is shown as a solid (dashed) line for
reference. This figure highlights the heterogeneity of oxygen requirements in the
severe BPD group, in part accounting for the wide range of shift values in this
group.

161
Table 24. Rotated Principal Components Analysis Matrix.
Component
Right shift 1 2 3 4
Duration of ventilation* 0·864 -0·200 0·105 -0·082
Any postnatal steroids 0·817 -0·096 -0·207 -0·005
Any airleak 0·701 -0·034 -0·196 0·063
Average fluid intake 1st 28 d 0·062 0·767 0·062 -0·146
Average protein intake 1st 28 d -0·067 0·748 0·337 0·110
Average caloric intake 1st 28 d -0·251 0·639 0·593 0·047
Any NEC 0·109 -0·528 0·185 0·059
Any Sepsis 0·237 -0·467 -0·367 -0·067
Gestation -0·156 0·124 0·858 0·060
Any surfactant 0·012 -0·012 -0·774 0·157
Postmenstrual age at test 0·313 -0·123 -0·158 0·738
Duration of non-invasive ventilation* -0·495 -0·204 -0·099 0·673
Any pulmonary haemorrhage 0·127 -0·341 -0·214 -0·464
VA/Q
Duration of ventilation* 0·870 -0·198 -0·146 -0·077
Any postnatal steroids 0·818 -0·115 0·193 -0·011
Any airleak 0·70 -0·038 0·202 0·052
Average fluid intake 1st 28 d 0·037 0·817 -0·198 0057
Average protein intake 1st 28 d -0·083 0·827 0·095 -0·210
Average caloric intake 1st 28 d -0·259 0·713 -0·503 0·014
Any Sepsis 0·238 -0·484 0·338 -0·054
Gestation -0·148 0·217 -0·852 0·065
Any surfactant 0·006 -0·085 0·782 0·149
Postmenstrual age at test 0·324 -0·091 0·160 0·736
Duration of non-invasive ventilation* -0·482 -0·184 0·078 0·691
Any pulmonary haemorrhage 0·123 -0·377 0·181 -0·451
Shunt
Duration of ventilation* 0·880 -0·167 -0·096 0·120
Any postnatal steroids 0·810 -0·154 0·138 0·110
Any airleak 0·677 -0·092 0·147 0·038
Duration of non-invasive ventilation* -0·648 -0·138 -0·092 0·533
Average protein intake 1st 28 d -0·071 0·851 -0·132 0·089
Average caloric intake 1st 28 d -0·287 0·782 -0·329 -0·091
Average fluid intake 1st 28 d 0·058 0·774 0·225 0019
Any Sepsis 0·213 -0·553 0·310 -0·001
Number of surfactant doses 0·013 -0·001 0·784 0·033
Gestation -0·208 0·378 -0·677 -0·148
Postmenstrual age at test 0·193 -0·059 -0·002 0·852
Any hyaline membrane disease 0·004 -0·065 -0·081 -0·379
*unstandardized residual versus gestation; rotation method varimax with Kaiser normalization. Bold
font indicates significant factor used for multivariable linear regression.

162
A2. List of abstracts
A2.1. Validation of FiO2 derived by a portable inspired oxygen pressure
sensor (PSANZ Townsville, 2016)
Stoecklin B1, Svedenkrans J.2, Pillow J.J.1
1Centre for Neonatal Research and Education, University of Western Australia, Perth, WA, Australia 2Department of Neonatology, CLINTEC, Karolinska Institutet, Stockholm, Sweden
Email: [email protected]
A2.1.1. Background
In 2016 the Australian and New Zealand Neonatal Network (ANZNN) will introduce
ventilation:perfusion ratio (shift) of the oxyhaemoglobin dissociation curve as an
instrument to assess Bronchopulmonary Dysplasia. We compared the fractional
inspired oxygen values (FiO2) measured by a portable oxygen sensor (Teledyne
Analytical Instr. Model: AX-300) commonly used for the bedside measurements, with
the continuous FiO2 sensor device (OEM oxygen sensor; Item # X3014, Oxigraf Inc.)
used for infant lung function tests.
A2.1.2. Method
Paired FiO2 measurements were obtained in preterm infants < 32 w GA during
assessment of shunt and shift for determination of BPD severity by adjusting FiO2
stepwise from 0.14-0.5 to achieve peripheral oxyhaemoglobin saturations of 86-97%.
Comparison of FiO2 measured by the portable sensor with the measurements obtained
using the Oxigraf sensor we performed a Spearman’s correlation and a Bland-Altman
analysis.
A2.1.3. Results
181 comparisons of FiO2 values were obtained from 20 babies with median (range)
353 (341-373) weeks postmenstrual age. The median (range) FiO2 value from the
portable device was 0.182 (0.141-0.497) compared to the one derived by the Oxygraf
sensor 0.183 (0.14-0.487). The Spearman’s correlation coefficient was 0.964 (p<0.01).
Bland-Altman analysis revealed a mean (95% CI) difference of the two methods of -
0.0017 (-0.0027, -0.0007), with moderate limits of agreement (LOA: -0.0147,0.0113).
A2.1.4. Conclusions
The overestimation of FiO2 by the portable oxygen sensor compared with the gold
standard laboratory sensor was statistically significant but of negligible clinical
relevance. No systemic bias was evident. The portable oxygen sensor is suitable for
bedside assessments of shift.

163
A2.2. Shift in very preterm infants with oxyhaemoglobin saturation
>94% in room air (PSANZ Townsville 2016, European Respiratory
Society, Milan; Italy 2017)
Stoecklin B.1, Svedenkrans J.2, Jones JG.3, Pillow J.J.1 1Centre for Neonatal Research and Education, University of Western Australia, Perth, WA, Australia 2Department of Neonatology, CLINTEC, Karolinska Institutet, Stockholm, Sweden 3Department of Anaesthesia, Addenbrookes Hospital, Cambridge, United Kingdom
Email: [email protected]
A2.2.1. Background
Impaired gas exchange in infants with Bronchopulmonary Dysplasia (BPD) is
quantified by right shift and shunt of the oxyhaemoglobin saturation dissociation curve
(ODC). Shift and shunt are obtained by plotting inspired oxygen pressure (PiO2=FiO2
at sea level) against peripheral oxyhaemoglobin saturation (SpO2). A single recorded
pair of PiO2 and SpO2 obtained whilst SpO2 is between 86-94% is sufficient to predict
shift of the ODC (Quine et al, 2006). The ANZNN will introduce simplified shift for
infants <28w gestational age (GA) in 2016 but current prediction tables do not give
outcomes for infants with SpO2>94% in air (FiO2 0.21).
A2.2.2. Method
Infants <32w GA were tested at 36w postmenstrual age (PMA). PiO2 was adjusted
from 0.14-0.5 to achieve SpO2 86-98%. Shift and shunt were calculated from the ODC
of each infant using customised software (Quine et al. 2006). Predicted shift for infants
with SpO2 >94% in air was determined via linear regression of SpO2 in air vs.
calculated shift.
A2.2.3. Results
54 infants at median (range) 28 (234-315)w GA were tested at 353 (335-374)w PMA.
Median (range) SpO2 value in air was 95.7% (87.6-99%). SpO2/PiO2 were
significantly correlated (Spearman’s Rho -0.97,p<0.01). Shift values for SpO2 95-
100% in air were calculated from the linear regression (R2=0.80): shift = -0.773xPiO2+
83.504 (see Table 25).
A2.2.4. Conclusions
This table provides estimates of shift from a single paired SpO2/PiO2 measurement
for infants saturating >94% in air, facilitating disease severity quantification across all
BPD stages.
Table 25. Prediction table for shift at SpO2 > 94% in room air (21 kPa)
SpO2(%)/PiO2(21kPa) 95 96 97 98 99 100
Shift(kPa) 10.1 9.3 8.5 7.8 7.0 6.2
164
A2.3. Low-frequency oscillatory mechanics in very preterm infants with
and without Bronchopulmonary Dysplasia (European Respiratory
Society, Milan; Italy 2017)
Benjamin Stoecklin, Shannon Simpson, Graham Hall, Zoltan Hantos, Jane Pillow
Bronchopulmonary dysplasia (BPD) is characterised by inflammation in the
developing airways and lung parenchyma. The ability of low-frequency forced
oscillation technique (LFOT) to measure the impact of BPD on peripheral lung growth
and function is unknown.
We aimed to measure airway and pulmonary tissue mechanics in very preterm infants
with/without BPD. We hypothesised that BPD alters the pulmonary mechanical
properties compared to infants without BPD.
LFOT (1-12 Hz) was applied to unsedated preterm infants during a short apnoea (4-7
s) provoked via the Hering-Breuer reflex (1-4 rapid manual inflations). Peak inflation
pressure was 20cmH2O. Outcome variables were determined by fitting the constant
phase model to the data, and analysed using t-test and multiple linear regression.
70 of 85 infants had acceptable tests: [median (range) GA 286w (234-316)] at a median
(range) 355w (340-374) postmenstrual age. 25 infants had BPD (mild n=10, moderate
n=7, severe n=8) according to the NICHD criteria. Newtonian resistance (R) (mean
difference (SD): 3.88 (1.71); p 0.026) was significantly lower in infants with BPD than
infants without BPD. Presence of BPD did not impact tissue damping, elastance, or
hysteresivity. Length independently predicted all outcome variables. Duration of
nCPAP was independently associated with R.
In our cohort of infants, length rather than presence of BPD was the primary
determinant of parenchymal mechanics: our findings may be explained by similar
tissue mechanics in infants with/without BPD due to mild BPD, or that the effect size
of BPD on LFOT outcome variables is low. Funding: NHMRC
(1047689,1057514,1077691), MHRIF, Hungarian Scientific Research Grant #105403

165
A2.4. Longitudinal Changes in Right Ventricular Function in Very
Preterm Infants (PSANZ Auckland 2018)
Stoecklin B, Svedenkrans J, Pillow JJ, Gill A
A2.4.1. Background
The reported incidence of pulmonary hypertension (PH) in preterm infants with
bronchopulmonary dysplasia (BPD) varies between 15 ‐ 25 %. Right ventricular (RV)
function is impaired in PH. Longitudinal changes in RV function in very preterm
infants were assessed using echocardiography.
A2.4.2. Methods
Right ventricular function assessment included tricuspid annular plane systolic
excursion (TAPSE), tricuspid annular peak systolic velocity (S’), right ventricular
output (RVO) and myocardial performance index (MPI). Echocardiographs were
performed at 7 days and at 36 weeks postmenstrual age (PMA). BPD was categorised
according to the NICHD criteria.
A2.4.3. Results
46 infants with a median (range) 274 (240 ‐ 316) weeks gestation had an echocardiogram
at 7 days (5 ‐ 13 days) and at 352 weeks (336 ‐ 364 weeks) PMA. TAPSE increased over
time (mean difference (95% CI): 0.35 (0.31 – 0.40), p<0.001). The increase in TAPSE
over time was significantly larger in infants with BPD compared to infants without
BPD (mean difference (95% CI): 0.13 (0.02 – 0.23). Significant increases in S’
(paired‐t‐test; p<0.001) and RVO (Wilcoxon signed rank test; p=0.012) between 7
days and 36 weeks PMA were not related to BPD. MPI did not change with postnatal
maturation.
A2.4.4. Conclusions
RV function improves over time after very preterm birth. We speculate that more
marked improvement in RV function in BPD infants is due to depression of RV
function at day 7 due to persisting high pulmonary resistance. Funding: NHMRC
1047689,1057514,1077691, SNF, IPRF.
166
A2.5. Do We Overestimate the Incidence of Pulmonary Hypertension in
Preterm Infants with Bronchopulmonary Dysplasia? (PSANZ Auckland
2018)
Stoecklin B, Svedenkrans J, Pillow JJ, Gill A
A2.5.1. Background
Our aim was to assess the right ventricular function as a marker for pulmonary
hypertension (PH) in very preterm infants with and without bronchopulmonary
dysplasia (BPD) against the published incidence of 15 ‐ 25%.
A2.5.2. Methods
Preterm infants born <32 weeks gestational age (GA) were studied. Echocardiographic
assessments of right ventricular function at 36 weeks postmenstrual age (PMA)
included tricuspid regurgitant jet velocity (TRJV), septal shape, tricuspid annular
plane systolic excursion (TAPSE), right ventricular output (RVO) and right
myocardial performance index (MPI). BPD was categorised using the NICHD criteria.
Pulmonary gas exchange capacity was measured using shift of the SpO2/PIO2 curve.
A2.5.3. Results
Echocardiography was performed in 197 infants with a median GA 276 weeks (range
230 ‐ 316w) at 352 weeks (range 336 ‐ 382w) PMA. BPD was diagnosed in 73 infants
of the 197 infants. Trivial tricuspid regurgitation was detected in 65 infants with a
maximum TRJV of 2.5 m/s. The ventricular septum was flattened in 2 infants with
severe BPD and in 1 infant without BPD. No indices of right ventricular function
correlated with either BPD severity (TAPSE, p=0.1; RVO p=0.7; MPI, p=0.4) or shift
of the SpO2/PIO2 curve (TAPSE, p=0.1; RVO, p=0.3; MPI, p=0.4).
A2.5.4. Conclusions
We found minimal evidence of significant PH in our very preterm cohort suggesting
a lower incidence of PH than reported in the USA. This may be due to variation in
BPD severity and/or echocardiographic interpretation. Funding: NHMRC
1047689,1057514,1077691,SNF,IPRF.
167
A2.6. Shift of the SpO2/PIO2 curve assessed early in life enables prediction
of bronchopulmonary dysplasia in extremely preterm infants (jens
Maastricht, 2019)
Stoecklin B* 1,2,3, Panchal H* 1,2, Choi J 2,3, Pillow J J 1,2,3
1Neonatal Intensive Care Unit, King Edward Memorial Hospital for Women, Perth, Australia. 2Centre for Neonatal Research and Education, University of Western Australia, Perth, Australia. 3School of Human Sciences, University of Western Australia, Perth, Australia * Joint first authors Email: [email protected]
2.6.1. Background
Rightward shift of the peripheral arterial oxygen saturation (SpO2)/ and inspired
oxygen pressure (PIO2) curve is a sensitive marker of pulmonary gas exchange in
preterm infants. We hypothesised that rightward shift of the SpO2/PIO2 curve in the
first weeks of life is a predictor of bronchopulmonary dysplasia (BPD) at 36 weeks
(w) postmenstrual age (PMA).
2.6.2. Methods
This was a prospective observational study. Infants born at < 28 w gestation at the
King Edward Memorial Hospital in Western Australia between 21st August 2017 – 1st
April 2018 were eligible for inclusion. Rightward shift was assessed weekly from birth
until 36 w PMA by recording SpO2 and PIO2 at hourly intervals for 24 h. Right shift
was calculated from the paired SpO2/PIO2 values using a validated prediction table.
2.6.3. Results
32 extremely preterm infants with a median (range) gestational age of 26.4 (23.9–28.0)
w were studied. Infants with BPD were born at a lower gestation: Median (IQR)
gestation was 25.7 (25.1–26.6) w for the BPD group compared to 27.3 (26.6–27.4) w
for infants without BPD (p<0.001). Shift values in infants with BPD were significantly
higher compared to infants without BPD throughout week one to eight of life (all p
<=0.001, Mann-Whitney U tests). Receiver operating characteristic curve analysis
showed a shift value of 11.4 kPa at one week of age predicts BPD with 89.5%
sensitivity and 91.7% specificity (AUC:0.91, p<0.001). A shift value of 16.1 kPa at
one week of life predicts moderate and severe BPD at 36w PMA with 77.8%
sensitivity and 86.4% specificity (AUC:0.84, p=0.004). Shift at two weeks of life was
significantly correlated with shift at 36w PMA (R2 = 0.71, p<0.001).
2.6.4. Conclusion
Shift assessed at one week of age enables prediction of BPD at 36 weeks PMA.
Prediction of moderate and severe BPD should be treated with caution for the limited
number of infants included in the study. Nevertheless, infants with high shift values at
two weeks of age are at risk of moderate to severe BPD. Early detection of preterm
infants at risk for the development of BPD might benefit from targeted early
interventions.
Funding: Swiss National Science Foundation (P2BSP3_158837), (NHMRC
(1047689, 1057514, 1077691)
168
A2.7. Bronchopulmonary dysplasia can be predicted by early assessment
of shift of the SpO2 vs. PIO2 curve in extremely preterm infants (PSANZ
Sydney 2020, cancelled due to SARS-CoV-2 pandemic)
Stoecklin Benjamin* 1,2, Panchal Harshad* 1,2, Choi Jane 2,3, Pillow Jane J 1,2,3 1Neonatal Intensive Care Unit, King Edward Memorial Hospital for Women, Perth, Australia. 2School of Human Sciences, University of Western Australia, Perth, Australia; 3Telethon Kids Institute, Perth, Australia. * joint first authors
Email: [email protected]
A2.7.1. Background
We hypothesised that rightward shift of the SpO2 vs. PIO2 curve in the first weeks (w)
of life is a predictor of bronchopulmonary dysplasia (BPD) at 36 w postmenstrual age
(PMA).
A2.7.2. Methods
Prospective observational study. Infants born < 28 w gestation at the King Edward
Memorial Hospital in Western Australia between August 2017 – April 2018 were
eligible for inclusion. Rightward shift was assessed weekly from birth until 36 w PMA
by recording SpO2 and PIO2 at hourly intervals for 24 h. Right shift was calculated
from paired SpO2 vs. PIO2 values using a validated prediction table.
A2.7.3. Results
32 extremely preterm infants with a median (range) gestational age of 26.4 (23.9–28.0)
w were studied. Shift values in infants with BPD were significantly higher compared
to infants without BPD throughout the first eight weeks of life (all p<=0.001,Mann-
Whitney U tests). Receiver operating characteristic curve showed a shift value of 13.3
kPa at one week of age predicts BPD with 73.7% sensitivity and 92.3% specificity
(AUC:0.85,p=0.001). A shift value of 14.3 kPa at one week of life predicts moderate
and severe BPD at 36w PMA with 66.7% sensitivity and 78.3% specificity
(AUC:0.76,p=0.026).
A2.7.4. Conclusions
Shift assessed at one week of age enables prediction of BPD at 36 weeks PMA.
Prediction thresholds for moderate and severe BPD should be used cautiously until a
larger study popu
lation is recruited. Early detection of preterm infants at risk for the development of
BPD using the right shift SpO2 vs. PIO2 curve might enable targeted interventions.
Funding:NHMRC(GNT1047689,GNT1057514,RF1077691),MHRIF,SNSF
169
A3. Simplified bedside assessment of pulmonary gas exchange in
very preterm infants at 36 weeks’ postmenstrual age
Benjamin Stoecklin MDa,b,c*, Y. Jane Choia*, Abhijeet Rakshasbhuvankar
FRACPa,b, Jenny Svedenkrans PhDd,e, J. Gareth Jones MDf, J. Jane Pillow PhDa
Accepted for publication in Thorax: 15th January 2021
Affiliations:
a School of Human Sciences, University of Western Australia, Perth, Australia;
b King Edward Memorial Hospital, Perth, Australia;
c Department of Neonatology, University Children’s Hospital Basel (UKBB), Basel,
Switzerland
d Department of Clinical Science, Intervention and Technology, Division of
Paediatrics, Karolinska Institutet, Stockholm, Sweden;
e Department of Neonatal Medicine, Karolinska University Hospital, Stockholm,
Sweden;
f University Department of Anaesthesia, Addenbrookes Hospital, Cambridge, United
Kingdom
*joint first author
Corresponding author: Benjamin Stoecklin, Department of Neonatology, University
Children’s Hospital Basel (UKBB), Spitalstrasse 33, 4056 Basel, Switzerland.
Contributorship statement:
Dr Stoecklin collected and analysed the data, interpreted the data, assisted with the
REDCap database design and development, drafted the initial manuscript, performed
literature search, drafted the figures, and approved the final manuscript as submitted.
Ms Choi collected and analysed the data, interpreted the data, drafted the figures,
reviewed and revised the manuscript, and approved the final manuscript as submitted.
Dr Rakshasbhuvankar collected the data, reviewed and approved the final version of
the manuscript as submitted. Dr Svedenkrans collected the data, analysed the data,
reviewed and approved the final version of the manuscript as submitted. Prof JG Jones
developed the algorithms used for the calculation of shunt, shift and VA/Q, reviewed
and revised the manuscript, and approved the final manuscript as submitted.
Assoc/Prof J J Pillow was the principal investigator obtaining funding, leading study
design including development of the REDCap database, verified all statistical
calculations, interpreted the data, critically reviewed and revised the manuscript, and
approved the final manuscript as submitted.
Funding information:
All phases of this study were supported by the University of Western Australia and
the Women and Newborn Health Service of Western Australia. Funded by National

170
Health and Medical Research Council (NHMRC) of Australia (GNT1047689,
GNT1057514) and the Metropolitan Health Research Infrastructure Fund (MHRIF).
Dr Stoecklin was supported by the Swiss National Science Foundation
(P2BSP3_158837) and a Research Training Program scholarship, The University of
Western Australia. Dr Svedenkrans was supported by The Swedish Society of
Medicine, The Samaritan Foundation, The Princess Lovisa Memory Foundation, The
Society of Child Care (Sällskapet Barnavård), and The Fernstrom Foundation. Prof
Pillow was supported by a NHMRC Senior Research Fellowship (RF1077691).
Word count: 3247

171
A3.1. Abstract
A3.1.1. Introduction
Rightward shift of the oxyhaemoglobin saturation (SpO2) versus inspired oxygen
pressure (PIO2) curve is a marker of pulmonary gas exchange. Shift can be predicted
from a single paired SpO2 vs. PIO2 measurement. We aimed to develop and validate a
prediction table for shift based on fetal haemoglobin, applicable across different
altitudes and the severity spectrum of bronchopulmonary dysplasia.
A3.1.2. Methods
Very preterm infants had an oxygen reduction test at 36 weeks’ postmenstrual age.
Shift was derived from at least three paired SpO2 vs. PIO2 measurements using a
computer algorithm, with fetal oxygen dissociation curve as the reference. Resultant
shift values were analysed to calculate the prediction table. Accuracy of the prediction
table was validated in a separate cohort of infants using Bland-Altman analysis.
A.3.1.3. Results
We calculated the prediction table from shift data of 219 infants, tested at a median
(IQR) age of 354 (345–360) weeks’ postmenstrual age (PMA). Shift values greater than
10.1 kPa predicted bronchopulmonary dysplasia with 71 % sensitivity and 88 %
specificity. The median (IQR) age of 63 infants in the validation cohort was 360 (356
– 362) PMA. The mean difference (95 % CI) between predicted and measured shift
was 2.1 (-0.8, 4.9) % with wide limits of agreement (-20.7 %, 24.8 %).
A3.1.4. Discussion
Shift predicted from a single paired SpO2 vs. PIO2 measurement enables bedside
screening of lung disease severity in infants at high-risk of bronchopulmonary
dysplasia. The prediction table provides a simple alternative for lengthy physiologic
assessments of pulmonary gas exchange in neonates.
172
A3.1.5. Key Messages
What is the key question? Can a single paired oxyhaemoglobin saturation (SpO2) vs.
inspired oxygen pressure (PIO2) measurement predict the rightward shift of the SpO2
vs. PIO2 curve as a severity measure for bronchopulmonary dysplasia (BPD).
What is the bottom line? Our observational study established and validated a table that
correlates well with the conventional NIH definition of BPD; however, has wide limits
of agreement for predicting right-shift of the SpO2 vs. PIO2 curve.
Why read on? The simple, globally applicable prediction table for rightward shift of
the SpO2 vs. PIO2 curve facilitates simple and equitable bedside assessment of BPD
severity, and a sensitive and specific clinical measure for comparing respiratory
outcomes of infant cohorts.
173
A3.2. Introduction
Bronchopulmonary dysplasia (BPD) is characterised by impaired development of
alveoli and pulmonary capillaries. The cardinal feature of BPD is impaired pulmonary
gas exchange. A continuous measure of pulmonary gas exchange impairment is
essential for benchmarking purposes and as an outcome for clinical research studies
(Hines et al., 2017; A. H. Jobe & Abman, 2019). However, in infants, the traditional
measures of pulmonary gas exchange are either technically difficult (A-a nitrogen
difference), or impossible (e.g., the multiple inert gas elimination technique; MIGET)
(Corbet et al., 1975; Hand et al., 1990; Roca & Wagner, 1994). Assessment of
rightward shift of the oxyhaemoglobin saturation (SpO2) vs. inspired oxygen pressure
(PIO2) curve relative to the oxyhaemoglobin dissociation curve (ODC) has
transformed the assessment of BPD severity by providing a sensitive and non-invasive
measure of impaired pulmonary gas exchange across the full spectrum of BPD severity
(Svedenkrans et al., 2019b). Moreover, shift of the SpO2 vs. PIO2 can be assessed daily
to monitor pulmonary gas exchange (Smith & Jones, 2001).
The PIO2 vs. SpO2 curve is constructed using a comprehensive test by a simultaneous
measurement of SpO2 and PIO2 while the PIO2 is reduced in graded fashion using a
headbox (Jones & Jones, 2000; Lockwood et al., 2014; Quine et al., 2006; Rowe et al.,
2010). Using the oxyhaemoglobin dissociation curve (ODC) as a reference, a reduced
VA/Q is reflected by rightward shift of the SpO2 vs. PIO2 curve as the PIO2 – PaO2
gradient increases (Quine et al., 2006; Sapsford & Jones, 1995). Increased right-to-left
shunt displaces the curve downwards. Rightward shift is highly correlated with the
PIO2 required to achieve a SpO2 of 90 %, whereas shunt is less well correlated with
this endpoint (Quine et al., 2006). Healthy adults have a rightward shift of
approximately 6 kPa due to the carbon dioxide in the alveolus and R, the gas exchange
ratio (PaCO2/R) (Jones & Jones, 2000). Term infants at day three of life have a shift
of 5.5 kPa (Dassios et al., 2017).
The comprehensive shift test involves multiple paired measurements of SpO2 and
PIO2, which often necessitates use of hypoxic gas mixtures to assess infants breathing
room air. As such, the comprehensive test is not suitable for wide-scale
implementation in routine clinical practice (Jones et al., 2015; Kjaergaard et al., 2003;
Quine et al., 2006; Rowe et al., 2010; Sapsford & Jones, 1995) (Figure 17). Rightward
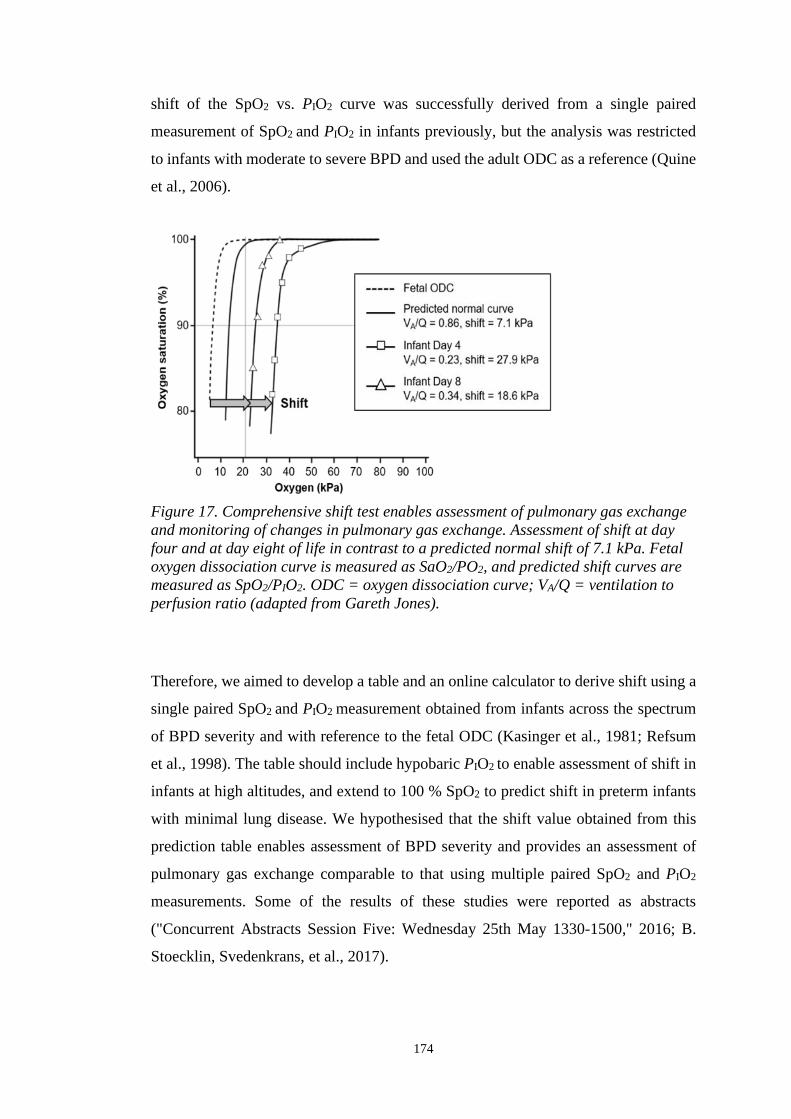
174
shift of the SpO2 vs. PIO2 curve was successfully derived from a single paired
measurement of SpO2 and PIO2 in infants previously, but the analysis was restricted
to infants with moderate to severe BPD and used the adult ODC as a reference (Quine
et al., 2006).
Figure 17. Comprehensive shift test enables assessment of pulmonary gas exchange
and monitoring of changes in pulmonary gas exchange. Assessment of shift at day
four and at day eight of life in contrast to a predicted normal shift of 7.1 kPa. Fetal
oxygen dissociation curve is measured as SaO2/PO2, and predicted shift curves are
measured as SpO2/PIO2. ODC = oxygen dissociation curve; VA/Q = ventilation to
perfusion ratio (adapted from Gareth Jones).
Therefore, we aimed to develop a table and an online calculator to derive shift using a
single paired SpO2 and PIO2 measurement obtained from infants across the spectrum
of BPD severity and with reference to the fetal ODC (Kasinger et al., 1981; Refsum
et al., 1998). The table should include hypobaric PIO2 to enable assessment of shift in
infants at high altitudes, and extend to 100 % SpO2 to predict shift in preterm infants
with minimal lung disease. We hypothesised that the shift value obtained from this
prediction table enables assessment of BPD severity and provides an assessment of
pulmonary gas exchange comparable to that using multiple paired SpO2 and PIO2
measurements. Some of the results of these studies were reported as abstracts
("Concurrent Abstracts Session Five: Wednesday 25th May 1330-1500," 2016; B.
Stoecklin, Svedenkrans, et al., 2017).

175
A3.3. Methods
The study was conducted in two phases. Firstly, we derived the prediction table for
shift of the SpO2 vs. PIO2 curve based on data analysed from infants enrolled in an
observational study (ACTRN12613001062718) (Svedenkrans et al., 2019a).
Secondly, the prediction table was validated in a separate cohort of infants, enrolled
in a randomised controlled trial (ACTRN12616000408482). The only difference in
the enrolment criteria of the two studies was the gestational age. Infants enrolled in
the observational study were born < 32 weeks’ gestation, whereas infants enrolled in
the randomised controlled trial were born < 28 weeks’ gestation. Infants with
congenital malformations were excluded from the studies. Written informed consent
for assessment of pulmonary gas exchange was obtained for each infant as part of the
respective study. Each clinical study received ethics approval from the Women and
Newborn Health Service Human Research Ethics Committee (HREC: 1883EW and
20130193EW respectively) and the University of Western Australia (RA/3/1/5942 and
RA/4/1/426, respectively). Studies were conducted in the Neonatal Clinical Care Unit
at the King Edward Memorial Hospital in Perth, Western Australia.
A3.3.1. Development of the prediction table
Infants (n = 219) contributing gas exchange data to the development of the prediction
table were recruited between the 21st of July 2013 and the 8th of January 2017 as
described (Svedenkrans et al., 2019b). We assessed rightward shift of the SpO2 vs.
PIO2 curve by the comprehensive shift test recording multiple paired SpO2 vs. PIO2
measurements (Figure 21, Table 30, online supplement) (Svedenkrans et al., 2019b).
Shift of the SpO2 vs. PIO2 curve relative to the fetal oxyhaemoglobin dissociation
curve was derived using an algorithm (Lockwood et al., 2014). The algorithm used a
two-compartment model of pulmonary gas exchange (shunt and one perfused
compartments) to analyse the relationship between inspired oxygen (FiO2) and SpO2
in terms of pulmonary shunt and ventilation - perfusion ratio (VA/Q). The algorithm
enables estimation of VA/Q and shunt based on paired values of SpO2 and PIO2 at
known haemoglobin content (Lockwood et al., 2014).
Rightward shift in the prediction table was calculated using a series of linear
regressions. The equation derived from shift (dependent) versus the required PIO2 to
176
achieve a SpO2 range of 86 – 94 % (independent) was used to calculate shift at a given
PIO2 (Error! Reference source not found., Table 31, online supplement).
Subsequently, the shift values in the table were calculated from the equation of shift
at a given PIO2 (dependent) versus the measured SpO2 (independent) (Figure 23, and
Table 33, online supplement). The methodology is described in more detail in the
online supplement.
A3.3.2. Validation of the prediction table
Shift was calculated for all infants using the prediction table and categorised based on
the NIH BPD classification published in 2001 (A. H. Jobe & Bancalari, 2001). Next,
threshold shift values to distinguish between infants with and without BPD, and
infants with moderate to severe BPD and without BPD were calculated using receiver
operating curve (ROC) analyses.
Finally, the prediction table was validated using data collected from a separate group
of extremely preterm infants. These infants had both the 15-minute bedside assessment
(single paired average SpO2 and PIO2) with shift estimated from our prediction table,
and a comprehensive shift test (multiple paired SpO2 and PIO2) with shift of the SpO2
vs. PIO2 curve estimated using the computer algorithm as described above. Preterm
infants were eligible for the validation study if they were 1) born at King Edward
Memorial Hospital; 2) enrolled in a randomised controlled trial using shift as an
outcome variable; 3) not enrolled in the cohort of infants used to calculate the table;
and 4) had a 15-minute bedside single paired SpO2 and PIO2 measurement within
seven days of the comprehensive shift test without a change in the respiratory support
or PIO2 in the intervening period. Infants participating in the validation study were
recruited between 7th January 2016 and 5th April 2018.
A Bland-Altman plot was used to quantify the agreement between the 15-minute
bedside assessment and the comprehensive shift test. The data are presented as a
percentage difference plot with 95 % confidence intervals of the mean bias and the
limits of agreement. Acceptable limits of agreement were defined a priori as ± 20 %
of the mean shift value.
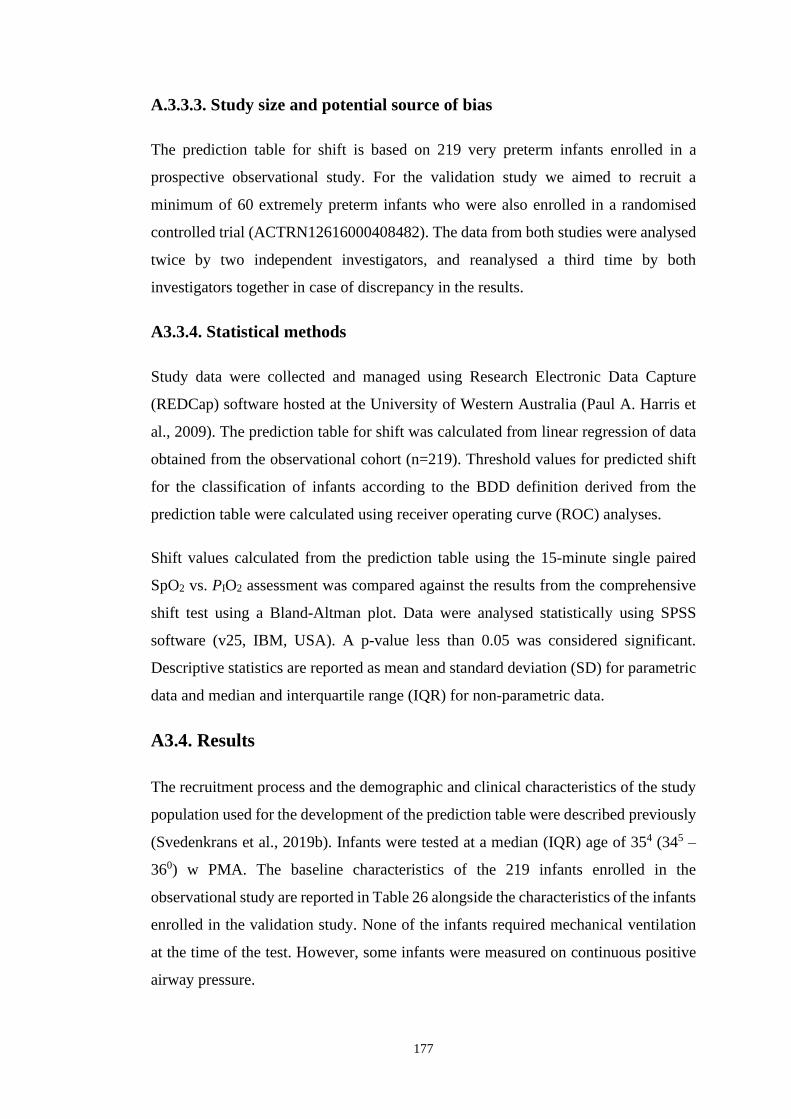
177
A.3.3.3. Study size and potential source of bias
The prediction table for shift is based on 219 very preterm infants enrolled in a
prospective observational study. For the validation study we aimed to recruit a
minimum of 60 extremely preterm infants who were also enrolled in a randomised
controlled trial (ACTRN12616000408482). The data from both studies were analysed
twice by two independent investigators, and reanalysed a third time by both
investigators together in case of discrepancy in the results.
A3.3.4. Statistical methods
Study data were collected and managed using Research Electronic Data Capture
(REDCap) software hosted at the University of Western Australia (Paul A. Harris et
al., 2009). The prediction table for shift was calculated from linear regression of data
obtained from the observational cohort (n=219). Threshold values for predicted shift
for the classification of infants according to the BDD definition derived from the
prediction table were calculated using receiver operating curve (ROC) analyses.
Shift values calculated from the prediction table using the 15-minute single paired
SpO2 vs. PIO2 assessment was compared against the results from the comprehensive
shift test using a Bland-Altman plot. Data were analysed statistically using SPSS
software (v25, IBM, USA). A p-value less than 0.05 was considered significant.
Descriptive statistics are reported as mean and standard deviation (SD) for parametric
data and median and interquartile range (IQR) for non-parametric data.
A3.4. Results
The recruitment process and the demographic and clinical characteristics of the study
population used for the development of the prediction table were described previously
(Svedenkrans et al., 2019b). Infants were tested at a median (IQR) age of 354 (345 –
360) w PMA. The baseline characteristics of the 219 infants enrolled in the
observational study are reported in Table 26 alongside the characteristics of the infants
enrolled in the validation study. None of the infants required mechanical ventilation
at the time of the test. However, some infants were measured on continuous positive
airway pressure.

178
The accuracy of predicted shift depends on the position of the single SpO2 vs. PIO2
measurement on the oxyhaemoglobin dissociation curve. Measurements with SpO2
values > 94 % are located close to the plateau of the curve, whereas measurements
with SpO2 values < 94 % are located on the steep part of the curve. The coefficient of
determination (R2) between shift and SpO2 decreases at higher SpO2 levels, leading to
an inherent fall in the prediction accuracy of shift. All values in Table 27 are derived
from infants breathing room air at sea level (PIO2 = 20 kPa). Since PIO2 = FiO2 x
(barometric pressure – saturated water vapour pressure), an FiO2 of 0.21 is equal to 20
kPa PIO2.
Table 26. Summary characteristics of both cohorts of infants.
Primary
Cohort
n = 219
Validation
Cohort
n = 63
p - value
Male n (%) 138 (63.0) 32 (48.5) 0.035
Gestational age (w) 27.9 (3.6) 26.6 (2.0) < 0.0005
Birth weight (kg) 1.07 0.3 0.86 0.2 < 0.0005
PMA at test (w) 35.4 (1.3) 36.0 (0.5) < 0.0005
Weight at test (kg) 2.3 0.4 2.5 0.4 0.019
Haemoglobin at test (g/dl) 10.6 1.8 10.7 1.2 0.602
Mechanical ventilation (d) 0.6 (4.9) 2.3 (11.0) < 0.0005
Non-invasive ventilation (d) 43.3 (53.5) 60.3 (18.9) < 0.0005
Oxygen therapy (d) 5.0 (56.2) 44.2 (60.9) < 0.0005
Bronchopulmonary dysplasia n (%) 86 (39) 38 (60) 0.003
Moderate or severe BPD n (%) 55 (25) 16 (25) 0.964
CPAP at test (n, %) 25 (12) 9 (14) 0.554
Summary characteristics of infants born at King Edward Memorial Hospital,
between 7th January 2016 and 5th April 2018 who had both the comprehensive shift
test and 15-minute bedside assessment. Results are shown as median (IQR) or
meanSD unless described otherwise. The primary cohort refers to the very
preterm infants, whose data were used for the calculation of the table. The
validation cohort refers to the extremely preterm infants enrolled for validation of
the table. PMA, postmenstrual age; CPAP, continuous positive airway pressure.
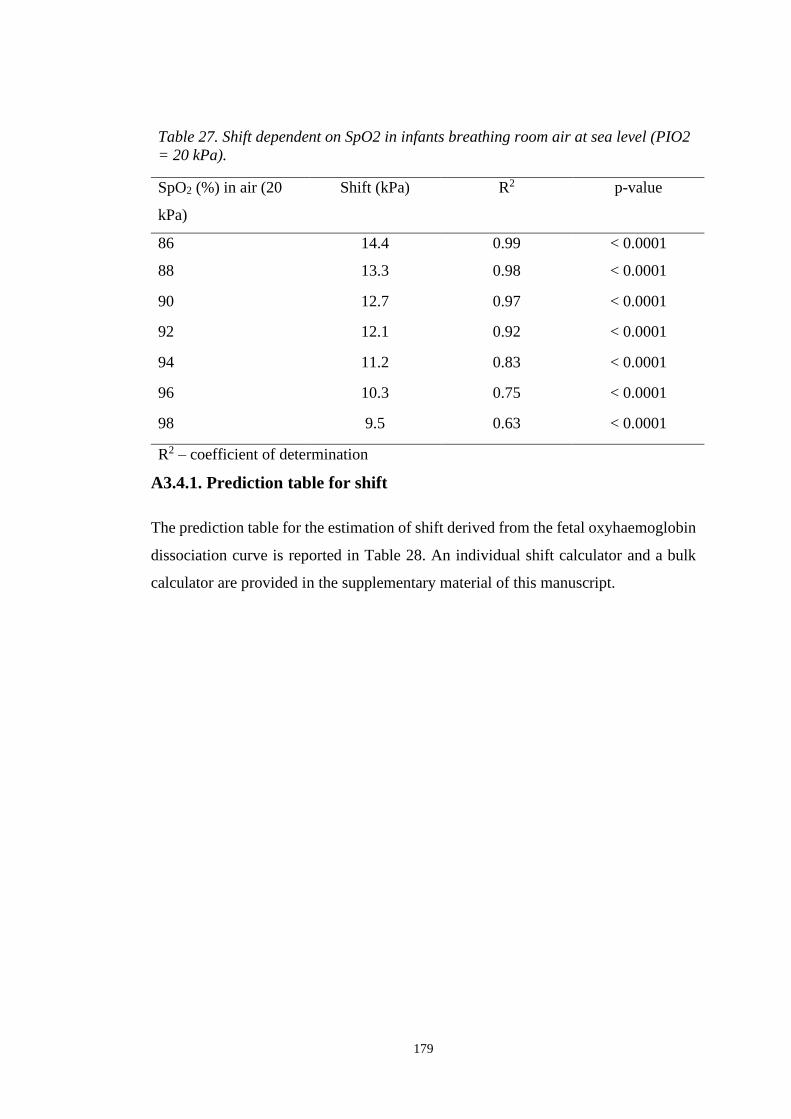
179
A3.4.1. Prediction table for shift
The prediction table for the estimation of shift derived from the fetal oxyhaemoglobin
dissociation curve is reported in Table 28. An individual shift calculator and a bulk
calculator are provided in the supplementary material of this manuscript.
Table 27. Shift dependent on SpO2 in infants breathing room air at sea level (PIO2
= 20 kPa).
SpO2 (%) in air (20
kPa)
Shift (kPa) R2 p-value
86 14.4 0.99 < 0.0001
88 13.3 0.98 < 0.0001
90 12.7 0.97 < 0.0001
92 12.1 0.92 < 0.0001
94 11.2 0.83 < 0.0001
96 10.3 0.75 < 0.0001
98 9.5 0.63 < 0.0001
R2 – coefficient of determination
180
Table 28. Prediction table for shift from a single paired SpO2 vs. PIO2 measurement.
SpO2 (%)
PIO2
(kPa) 85 86 87 88 89 90 91 92 93 94 95 96 97 98 99 100
14 8.3 8.2 8.1 8.0 7.9 7.8 7.7 7.6 7.5 7.3
15 9.4 9.2 9.1 8.9 8.8 8.6 8.4 8.3 8.1 8.0 7.8
16 10.3 10.1 10.0 9.8 9.7 9.5 9.4 9.2 9.0 8.9 8.7 8.6
17 11.4 11.2 11.0 10.7 10.5 10.3 10.1 9.9 9.7 9.5 9.2 9.0 8.8
18 12.5 12.2 11.9 11.7 11.4 11.1 10.9 10.6 10.3 10.0 9.8 9.5 9.2 9.0
19 13.6 13.3 12.9 12.6 12.3 11.9 11.6 11.3 10.9 10.6 10.3 9.9 9.6 9.3 8.9
20 14.7 14.3 13.9 13.5 13.1 12.7 12.3 11.9 11.5 11.1 10.7 10.3 9.9 9.5 9.1 8.7
21 15.7 15.3 14.9 14.4 14.0 13.6 13.1 12.7 12.3 11.8
22 16.8 16.3 15.8 15.3 14.9 14.4 13.9 13.4 12.9 12.4
23 17.9 17.3 16.8 16.3 15.7 15.2 14.7 14.1 13.6 13.0
24 19.0 18.4 17.8 17.2 16.6 16.0 15.4 14.8 14.2 13.7
25 20.0 19.4 18.8 18.1 17.5 16.8 16.2 15.5 14.9 14.3
26 21.1 20.4 19.7 19.0 18.3 17.6 16.9 16.3 15.6 14.9
27 22.2 21.4 20.7 20.0 19.2 18.5 17.7 17.0 16.2 15.5
28 23.3 22.5 21.7 20.9 20.1 19.3 18.5 17.7 16.9 16.1
29 24.4 23.5 22.6 21.8 20.9 20.1 19.2 18.4 17.5 16.7
30 25.4 24.5 23.6 22.7 21.8 20.9 20.0 19.1 18.2 17.3
Shaded shift values measured in room air (PIO2 = 20 kPa) > 97 SpO2 are estimates,
as every SpO2 > 97 % in room air is considered normal in healthy term infants. The
table does not provide predicted shift values for infants with SpO2 > 94 % whilst
requiring oxygen (PIO2 > 20 kPa), as the oxygen in these infants should be reduced
to achieve SpO2 closer to 90 % for a more accurate prediction of shift (extended
table with 95 % confidence intervals in the online supplement).
A3.4.2. Bedside assessment and NIH BPD definition
The differences in shift between infants with none or mild, mild or moderate and
moderate or severe BPD were statistically significant (Figure 18). Threshold values
for shift derived from the 15-minute bedside assessment for infants with mild, and
infants with moderate or severe BPD are shown in Table 29.

181
Figure 18. Shift assessed with the 15-minute bedside assessment in relation with the
NIH BPD definition published in 2001. Infants breathing room air on continuous
positive pressure ventilation (severe BPD) are not included in the graph.
Table 29. Thresholds for Shift (kPa) for Any BPD and Moderate-Severe BPD.
Comparison Group AUC 95 % CI Threshold Sensitivit
y
Specificit
y
Any BPD 0.84 (0.74,0.94) 10.10 71.1 % 88.0 %
Mod-Severe BPD
All 0.88 (0.74,1.00) 12.95 81.3 % 100 %
O2 @ 36 w
PMA
1.00 (1.00,1.00) 12.95 100 % 100 %
Any BPD = any baby classified as having mild, moderate or severe impairment
according to NIH BPD Classification (A. H. Jobe & Bancalari, 2001); Mod-Severe
BPD = any baby classified as moderate to severe BPD according to NIH BPD
definition; values for Moderate-Severe BPD are reported for the full cohort, as well as
for a subgroup of Moderate-Severe BPD that only included infant as moderate-severe
BPD if they required oxygen supplementation at 36 w PMA; PMA, postmenstrual age;
CI, confidence interval.
A3.4.3. Validation of the prediction table
A total of 63 infants in the validation cohort underwent both the 15-minute bedside
assessment and the comprehensive shift test. Median (range) date difference between
the two tests was 0 (-5.0, 3.0) days. Summary characteristics of preterm infants
enrolled in the validation study and significant differences between infants enrolled in
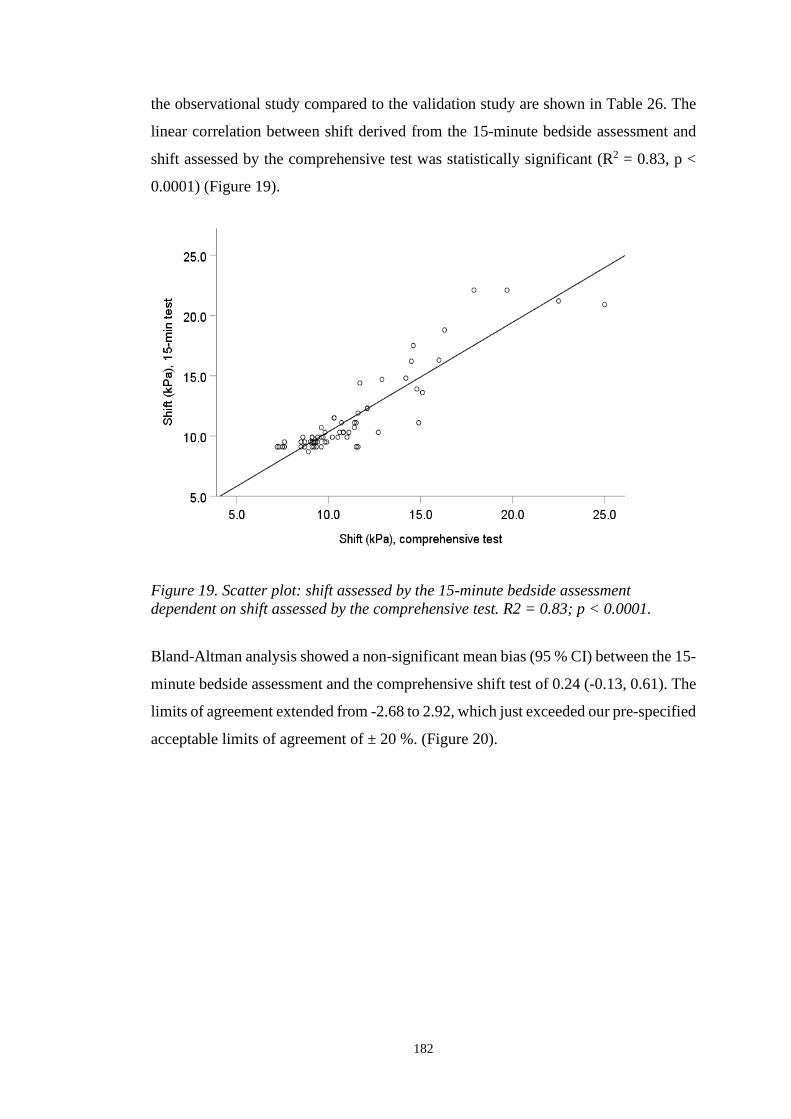
182
the observational study compared to the validation study are shown in Table 26. The
linear correlation between shift derived from the 15-minute bedside assessment and
shift assessed by the comprehensive test was statistically significant (R2 = 0.83, p <
0.0001) (Figure 19).
Bland-Altman analysis showed a non-significant mean bias (95 % CI) between the 15-
minute bedside assessment and the comprehensive shift test of 0.24 (-0.13, 0.61). The
limits of agreement extended from -2.68 to 2.92, which just exceeded our pre-specified
acceptable limits of agreement of ± 20 %. (Figure 20).
Figure 19. Scatter plot: shift assessed by the 15-minute bedside assessment
dependent on shift assessed by the comprehensive test. R2 = 0.83; p < 0.0001.

183
A3.5. Discussion
Impaired pulmonary gas exchange is the fundamental physiological disorder in infants
with BPD. Gas exchange can be assessed on a daily basis in a non-invasive and
quantitative manner (Dassios et al., 2015; Jones & Jones, 2000; Quine et al., 2006;
Svedenkrans et al., 2019b). In contrast, BPD definitions based on oxygen dependency
are a qualitative assessment of the disease. Different qualitative BPD definitions are
currently used in neonatal units and as endpoints in clinical trials (Hines et al., 2017).
The use of different definitions makes it difficult to benchmark neonatal units, to
compare interventional clinical trial outcomes and to interpret study results (Hines et
al., 2017).
We showed that VA/Q measured from multiple paired samples of SpO2 and PIO2 is
reflected by the degree of rightward shift of the SpO2 vs. PIO2 curve and can be
predicted from a single paired SpO2 vs. PIO2 measurement (Svedenkrans et al.,
2019b). We developed a prediction table and an online calculator for shift of the SpO2
vs. PIO2 curve. The prediction table enables bedside assessment of pulmonary gas
exchange in preterm infants. The table is applicable across the full spectrum of BPD
Figure 20. Plot of differences between the 15-minute bedside assessment and
the comprehensive shift test, expressed as percentage difference from the mean
of two tests. Each open circle denotes a single infant. Solid black line = mean;
dotted line = 95 % CI of the mean; dashed line = limits of agreement (1.96SD).

184
severity, can be used equitably in neonatal units at differing altitudes, and is based on
fetal haemoglobin. The PIO2 range of the table extends from as low as 14 kPa to 95
kPa. The extension to as low as 14 kPa enables estimation of shift from the prediction
table in infants breathing room air up to an altitude of 3 000 m above sea level (Baillie,
2010; B. Stoecklin et al., 2018). For an example, 0.21 FIO2 (room air) is equal to 15.6
kPa PIO2 in a neonatal unit in Mexico City at 2 250m altitude. Conversely, a FIO2 of
1.0 is equal to 95 kPa PIO2 at sea level, hence the upper limit of 95 kPa PIO2 in the
prediction table.
The shift values in our table are based on the fetal ODC as a reference. The switch
from fetal to adult haemoglobin occurs around 42 – 44 weeks independent of the
infant’s gestational age (Refsum et al., 1998) or number of prior blood transfusions
(Bard & Prosmanne, 1982; Berglund et al., 2014; Shiao & Ou, 2006). The use of fetal
haemoglobin as the reference is justified further in the online supplement.
A predicted shift value of 10.1 kPa enables the clinician to classify an infant as having
BPD with a sensitivity of 71 % and a specificity of 88 %. Moreover, a shift value of
12.95 kPa allows assessment of moderate or severe BPD with a sensitivity of 81 %
and a specificity of 100 %. Therefore, shift predicted from a single paired SpO2 vs.
PIO2 measurement enables assessment of BPD severity according to the currently used
BPD classification in an individual infant.
Validation of the table showed no bias and no mean difference between shift values
estimated from the prediction table and shift values derived from the comprehensive
shift test, indicating that the prediction table is useful for assessing pulmonary gas
exchange at a population level. However, the limits of agreement exceeded the
predefined criterion of ± 20 %. The ± 20 % acceptability criterion for the Bland-
Altman analysis was based on the fall in prediction accuracy of shift at SpO2 levels >
94 % (as shown in Table 2), and on the accuracy of the SpO2 probe (± 3 %) and the
portable oxygen sensor (± 2 %). Bland-Altman limits of agreement exceeding the
prespecified ± 20 % acceptability criterion indicates that a single measure of shift
derived from the prediction table is not sufficiently accurate to identify changes in
pulmonary gas exchange at the individual level. Even though the 15-minute bedside
assessment of shift does not allow assessment of right-to-left shunt, we could rule out
shunt as an explanatory factor for the wide limits of agreement (data available on

185
request). Nevertheless, as the limits of agreement were close to the predefined
acceptable limits, future refinements to the method might improve the prediction of
shift at an individual level. The 15-minute test remains useful at an individual level
for an objective screening and identification of infants who may benefit from
subsequently undergoing a comprehensive shift test. We also showed that the 15 min
test has high sensitivity and specificity for identification of infants with moderate-
severe BPD at an individual level.
The recorded SpO2 used to predict shift of the SpO2 vs. PIO2 curve from the table is
key to understanding these wide limits of agreement. A single point measurement on
the plateau of the curve (i.e., high SpO2) can have multiple solutions at the steep part
of the curve (Quine et al., 2006) (Figure 17). Predicted shift values from SpO2 > 94 %
when breathing room air are therefore only estimates, and require a comprehensive
shift test incorporating hypoxic gas mixtures to more accurately assess shift.
Preterm infants with shift values > 20 kPa may also benefit from the comprehensive
measurement of shift using a headbox (Svedenkrans et al., 2019b). The comprehensive
measurement of shift using a headbox provides additional information including
assessment of right-to-left shunt, VA/Q and the possibility of identifying the presence
of multiple gas exchange compartments in the lung (Jones et al., 2015). Hence,
undertaking a comprehensive shift test would provide more accurate evaluation of
pulmonary gas exchange for the effect of treatment, future prognosis and planning of
clinical follow-up at an individual level (Svedenkrans et al., 2019b).
The strengths of our study include the large sample size, use of an infant cohort that
reflected the whole spectrum of BPD severity, a table of predicted shift values that
allows for adjustment for altitude and the use of developmentally appropriate fetal
haemoglobin as a reference. In contrast to the comprehensive test, our prediction table
for shift allows clinicians to assess pulmonary gas exchange impairment from a simple
bedside assessment using widely accessible SpO2 monitoring, without the need of
hypobaric testing in preterm infants at 36 w PMA. Paired measurements of SpO2 vs.
PIO2 can be taken bedside by any health care provider at any time of the day to promote
benchmarking of neonatal respiratory outcomes after preterm birth. Moreover,
predicted shift values from a single paired SpO2 vs. PIO2 enable classification into
BPD severity grades at an individual level.

186
A limitation of our study is that shift values derived from a single paired SpO2 vs. PIO2
measurement using the prediction table are less accurate at an individual level. This
reduced accuracy of individual shift values limit utility for using the 15-minute shift
test to assess short-term changes in clinical condition. The accuracy decreases
especially in infants with SpO2 > 94 %. We also validated our prediction table with a
slightly more immature group of preterm infants than used for the development of the
prediction table. However, the rate of infants with moderate or severe BPD was equal
between groups. The infant cohort for the validation study was four days older at test
compared to the infants measured for the prediction table development (36 w PMA
vs. 35.4 w PMA). However, shift does not decrease significantly between 35 w and
36 w PMA (Svedenkrans et al., 2019b).
The use of different BPD definitions in clinical trials makes the interpretation and the
comparison between the trials difficult. In contrast to the qualitative assessments of
BPD, we and other groups showed previously how pulmonary gas exchange and BPD
severity can be assessed in a quantitative manner using a continuous outcome measure.
Simultaneous measurements of SpO2 and PIO2 enable quantification of pulmonary gas
exchange. However, the comprehensive test requires multiple measurements of SpO2
and PIO2 and is therefore not suitable for daily clinical practice.
A3.5. Conclusion and future directions
Rightward shift of the SpO2 vs. PIO2 curve relative to the oxyhaemoglobin
dissociation curve provides a non-invasive, and continuous population level outcome
measure for pulmonary gas exchange in infants across the spectrum of BPD severity.
Moreover, the bedside assessment is suitable for the classification of individual infants
into BPD severity grades according to the NIH BPD definition. Our prediction table
for shift is based on fetal haemoglobin as appropriate for < 42 w GA and is therefore
suited for the assessment of pulmonary gas exchange at 36 w PMA. The prediction
table is deliberately limited to 85 – 94 % SpO2 (except for 20 kPa) reflecting a fall in
accuracy of shift predictions at SpO2 above 94 %. Further research is required to
evaluate whether our method can be refined. The 15-minute bedside assessment allows
accurate prediction of shift in preterm infants at a population level. Therefore, the
bedside assessment is suitable as a benchmarking tool for assessing pulmonary gas
exchange in infants with BPD between neonatal intensive care units, as well as for

187
assessing treatment outcomes of clinical interventions in large randomised controlled
trials.
A3.6. Acknowledgements
The authors would like to acknowledge the research nurses Natasha Mackay-Coghill
and Amanda Woods, as well as all the included infants and their parents. We
acknowledge Dr Patricia Woods for the coordination of the ANZNN shift test at the
King Edward Memorial Hospital.

188
A4. Simplified bedside assessment of pulmonary gas exchange in
very preterm infants – online supplement
Figure 21 shows three simulated examples. The green curve reflects an infant born at
294 weeks’ gestation without BPD at 36 weeks’ postmenstrual age (sea level, FiO2
0.21 = PIO2 20 kPa). The blue curve shows an infant born at 283 weeks’ gestation
without BPD measured at high altitude (2 000 m, FiO2 0.21 = PIO2 16 kPa) and the
purple curve is derived from an infant born at 252 weeks’ gestation with BPD (sea
level FiO2 0.21 = PIO2 20 kPa). In each infant an individual SpO2 vs. PIO2 curve was
fitted to the paired SpO2 vs. PIO2 measurements and shift was calculated using
customised software. We used a hypobaric oxygen mixture for the comprehensive
shift test in the 219 infants (Svedenkrans et al., 2019a).
Pre-defined SpO2 levels at 86 %, 88 %, 90 %, 92 % and 94% and corresponding PIO2
and shift values were extracted from Figure 21 into Table 30 (only SpO2 88 % and 92
% are shown to produce a less crowded table).
Figure 21. Three different scenarios. Green curve = infant born 294 weeks’ gestation
without BPD; blue curve = infant born 283 weeks’ gestation measured at high
altitude; purple curve = infant born 252 weeks’ gestation with BPD. Red curve =
Fetal oxyhemoglobin dissociation. = paired measurements of SpO2/PIO2
recorded during full shift test. indicates shift.

189
Table 30. SpO2, PIO2 values and corresponding shift values extracted from Figure 21.
From each of the 219 infants shift at 86 %, 88 %, 90 %, 92 % and 94 % and the
according PIO2 were calculated (values in Table 30 are derived from the three
simulated infants). The values at 88 % and 92 % SpO2 are incorporated in the linear
regression analysis shown in Figure 22.
Table 31 shows shift values in room air at sea level (20 kPa PIO2) calculated with the
linear equations from Figure 22. A similar table was calculated for PIO2 between 14
kPa – 95 kPa.
Measurement SpO2 (%) FiO2 Altitude
(m)
PIO2
(kPa)
Shift (kPa)
A1 92 17 0 16 8.2
A2 88 16 0 15 8.2
B1 92 24 2000 18 10.8
B2 88 23 2000 17 10.8
C1 92 24 0 23 16.2
C2 88 23 0 22 16.2
Figure 22. Linear regression analyses with shift versus PIO2 required to achieve
SpO2 88 %, 90 %, 92 % and 94 %.
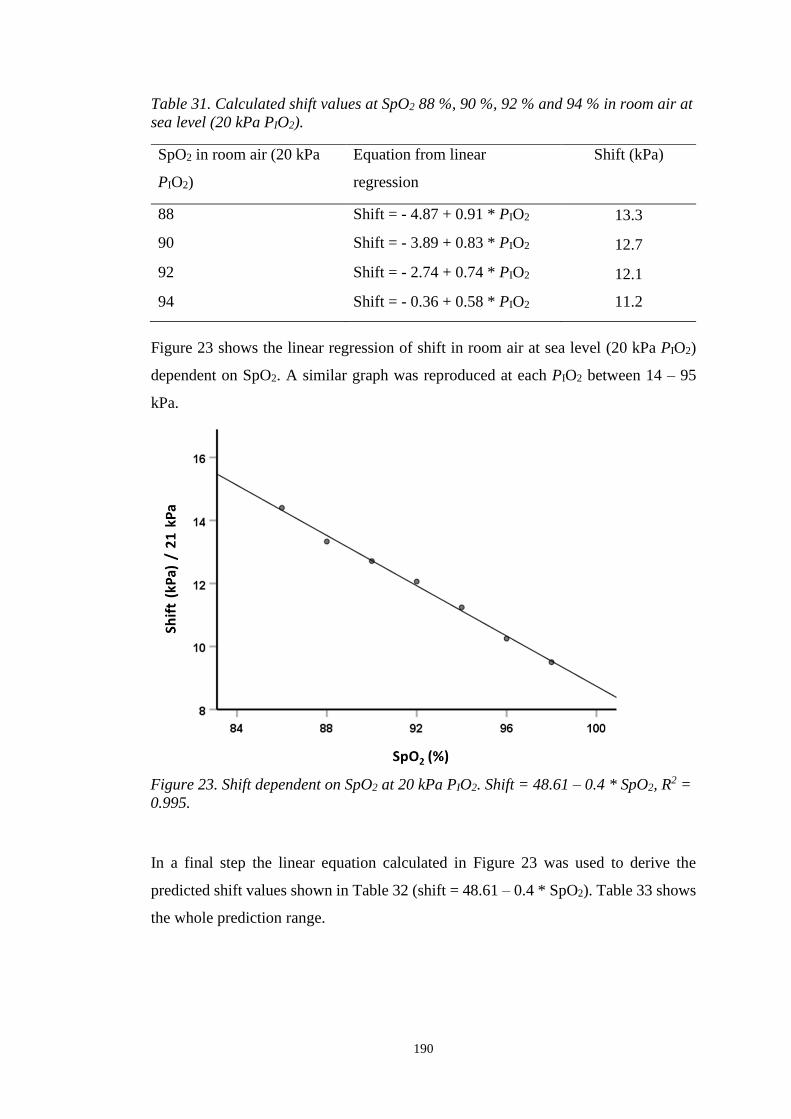
190
Table 31. Calculated shift values at SpO2 88 %, 90 %, 92 % and 94 % in room air at
sea level (20 kPa PIO2).
SpO2 in room air (20 kPa
PIO2)
Equation from linear
regression
Shift (kPa)
88 Shift = - 4.87 + 0.91 * PIO2 13.3
90 Shift = - 3.89 + 0.83 * PIO2 12.7
92 Shift = - 2.74 + 0.74 * PIO2 12.1
94 Shift = - 0.36 + 0.58 * PIO2 11.2
Figure 23 shows the linear regression of shift in room air at sea level (20 kPa PIO2)
dependent on SpO2. A similar graph was reproduced at each PIO2 between 14 – 95
kPa.
In a final step the linear equation calculated in Figure 23 was used to derive the
predicted shift values shown in Table 32 (shift = 48.61 – 0.4 * SpO2). Table 33 shows
the whole prediction range.
Figure 23. Shift dependent on SpO2 at 20 kPa PIO2. Shift = 48.61 – 0.4 * SpO2, R2 =
0.995.

191
Table 32. Prediction table for shift from a single paired SpO2 vs. PIO2 measurement
in room air at sea level. Shaded values are estimates (for details please refer to the
main manuscript).
SpO2 (%)
PIO2
(kPa) 85 86 87 88 89 90 91 92 93 94 95 96 97 98 99 100
20 14.7 14.3 13.9 13.5 13.1 12.7 12.3 11.9 11.5 11.1 10.7 10.3 9.9 9.5 9.1 8.7
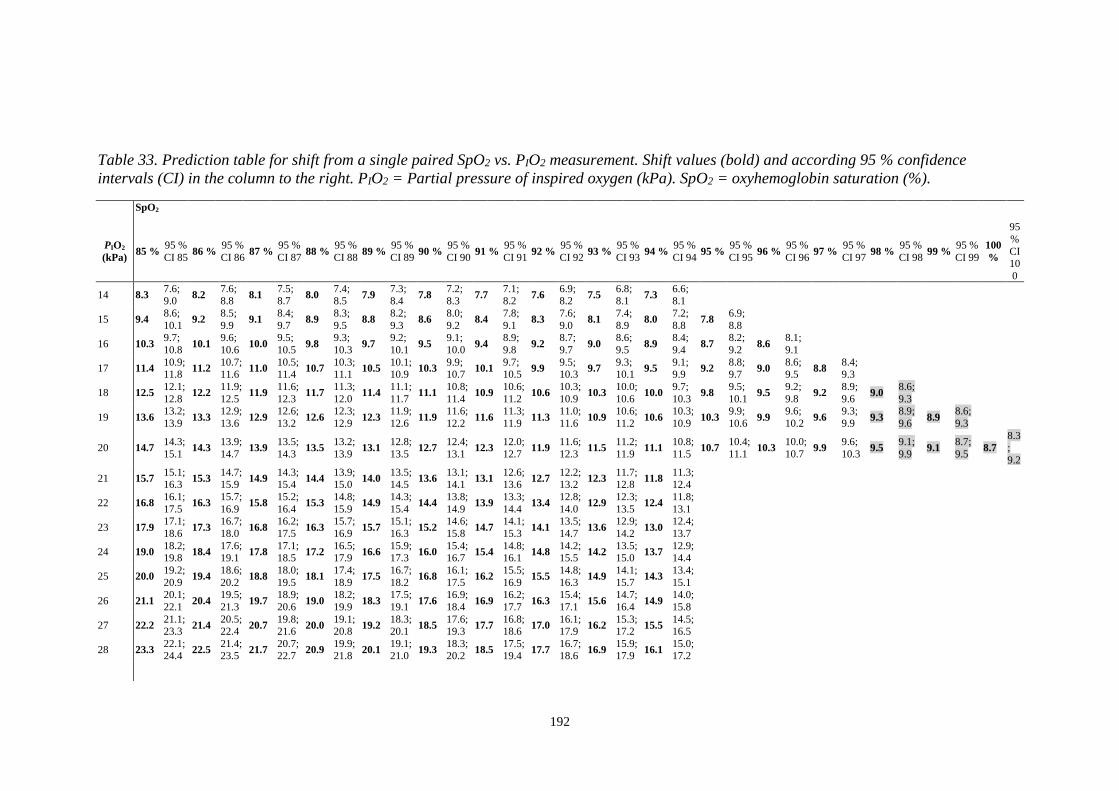
192
Table 33. Prediction table for shift from a single paired SpO2 vs. PIO2 measurement. Shift values (bold) and according 95 % confidence
intervals (CI) in the column to the right. PIO2 = Partial pressure of inspired oxygen (kPa). SpO2 = oxyhemoglobin saturation (%).
SpO2
PIO2
(kPa) 85 %
95 %
CI 85 86 %
95 %
CI 86 87 %
95 %
CI 87 88 %
95 %
CI 88 89 %
95 %
CI 89 90 %
95 %
CI 90 91 %
95 %
CI 91 92 %
95 %
CI 92 93 %
95 %
CI 93 94 %
95 %
CI 94 95 %
95 %
CI 95 96 %
95 %
CI 96 97 %
95 %
CI 97 98 %
95 %
CI 98 99 %
95 %
CI 99
100
%
95
%
CI 10
0
14 8.3 7.6; 9.0
8.2 7.6; 8.8
8.1 7.5; 8.7
8.0 7.4; 8.5
7.9 7.3; 8.4
7.8 7.2; 8.3
7.7 7.1; 8.2
7.6 6.9; 8.2
7.5 6.8; 8.1
7.3 6.6; 8.1
15 9.4 8.6;
10.1 9.2
8.5;
9.9 9.1
8.4;
9.7 8.9
8.3;
9.5 8.8
8.2;
9.3 8.6
8.0;
9.2 8.4
7.8;
9.1 8.3
7.6;
9.0 8.1
7.4;
8.9 8.0
7.2;
8.8 7.8
6.9;
8.8
16 10.3 9.7;
10.8 10.1
9.6;
10.6 10.0
9.5;
10.5 9.8
9.3;
10.3 9.7
9.2;
10.1 9.5
9.1;
10.0 9.4
8.9;
9.8 9.2
8.7;
9.7 9.0
8.6;
9.5 8.9
8.4;
9.4 8.7
8.2;
9.2 8.6
8.1;
9.1
17 11.4 10.9; 11.8
11.2 10.7; 11.6
11.0 10.5; 11.4
10.7 10.3; 11.1
10.5 10.1; 10.9
10.3 9.9; 10.7
10.1 9.7; 10.5
9.9 9.5; 10.3
9.7 9.3; 10.1
9.5 9.1; 9.9
9.2 8.8; 9.7
9.0 8.6; 9.5
8.8 8.4; 9.3
18 12.5 12.1;
12.8 12.2
11.9;
12.5 11.9
11.6;
12.3 11.7
11.3;
12.0 11.4
11.1;
11.7 11.1
10.8;
11.4 10.9
10.6;
11.2 10.6
10.3;
10.9 10.3
10.0;
10.6 10.0
9.7;
10.3 9.8
9.5;
10.1 9.5
9.2;
9.8 9.2
8.9;
9.6 9.0
8.6;
9.3
19 13.6 13.2;
13.9 13.3
12.9;
13.6 12.9
12.6;
13.2 12.6
12.3;
12.9 12.3
11.9;
12.6 11.9
11.6;
12.2 11.6
11.3;
11.9 11.3
11.0;
11.6 10.9
10.6;
11.2 10.6
10.3;
10.9 10.3
9.9;
10.6 9.9
9.6;
10.2 9.6
9.3;
9.9 9.3
8.9;
9.6 8.9
8.6;
9.3
20 14.7 14.3;
15.1 14.3
13.9;
14.7 13.9
13.5;
14.3 13.5
13.2;
13.9 13.1
12.8;
13.5 12.7
12.4;
13.1 12.3
12.0;
12.7 11.9
11.6;
12.3 11.5
11.2;
11.9 11.1
10.8;
11.5 10.7
10.4;
11.1 10.3
10.0;
10.7 9.9
9.6;
10.3 9.5
9.1;
9.9 9.1
8.7;
9.5 8.7
8.3;
9.2
21 15.7 15.1; 16.3
15.3 14.7; 15.9
14.9 14.3; 15.4
14.4 13.9; 15.0
14.0 13.5; 14.5
13.6 13.1; 14.1
13.1 12.6; 13.6
12.7 12.2; 13.2
12.3 11.7; 12.8
11.8 11.3; 12.4
22 16.8 16.1;
17.5 16.3
15.7;
16.9 15.8
15.2;
16.4 15.3
14.8;
15.9 14.9
14.3;
15.4 14.4
13.8;
14.9 13.9
13.3;
14.4 13.4
12.8;
14.0 12.9
12.3;
13.5 12.4
11.8;
13.1
23 17.9 17.1;
18.6 17.3
16.7;
18.0 16.8
16.2;
17.5 16.3
15.7;
16.9 15.7
15.1;
16.3 15.2
14.6;
15.8 14.7
14.1;
15.3 14.1
13.5;
14.7 13.6
12.9;
14.2 13.0
12.4;
13.7
24 19.0 18.2; 19.8
18.4 17.6; 19.1
17.8 17.1; 18.5
17.2 16.5; 17.9
16.6 15.9; 17.3
16.0 15.4; 16.7
15.4 14.8; 16.1
14.8 14.2; 15.5
14.2 13.5; 15.0
13.7 12.9; 14.4
25 20.0 19.2;
20.9 19.4
18.6;
20.2 18.8
18.0;
19.5 18.1
17.4;
18.9 17.5
16.7;
18.2 16.8
16.1;
17.5 16.2
15.5;
16.9 15.5
14.8;
16.3 14.9
14.1;
15.7 14.3
13.4;
15.1
26 21.1 20.1;
22.1 20.4
19.5;
21.3 19.7
18.9;
20.6 19.0
18.2;
19.9 18.3
17.5;
19.1 17.6
16.9;
18.4 16.9
16.2;
17.7 16.3
15.4;
17.1 15.6
14.7;
16.4 14.9
14.0;
15.8
27 22.2 21.1; 23.3
21.4 20.5; 22.4
20.7 19.8; 21.6
20.0 19.1; 20.8
19.2 18.3; 20.1
18.5 17.6; 19.3
17.7 16.8; 18.6
17.0 16.1; 17.9
16.2 15.3; 17.2
15.5 14.5; 16.5
28 23.3 22.1; 24.4
22.5 21.4; 23.5
21.7 20.7; 22.7
20.9 19.9; 21.8
20.1 19.1; 21.0
19.3 18.3; 20.2
18.5 17.5; 19.4
17.7 16.7; 18.6
16.9 15.9; 17.9
16.1 15.0; 17.2

193
SpO2
PIO2
85 % 95 %
CI 85 86 %
95 %
CI 86 87 %
95 %
CI 87 88 %
95 %
CI 88 89 %
95 %
CI 89 90 %
95 %
CI 90 91 %
95 %
CI 91 92 %
95 %
CI 92 93 %
95 %
CI 93 94 %
95 %
CI 94 95 %
95 %
CI 95 96 %
95 %
CI 96 97 %
95 %
CI 97 98 %
95 %
CI 98 99 %
95 %
CI 99
100
%
95
% CI
10
0
29 24.4 23.1;
25.6 23.5
22.3;
24.7 22.6
21.5;
23.7 21.8
20.7;
22.8 20.9
19.9;
22.0 20.1
19.1;
21.1 19.2
18.2;
20.3 18.4
17.3;
19.4 17.5
16.4;
18.6 16.7
15.5;
17.8
30 25.4 24.1; 26.8
24.5 23.3; 25.8
23.6 22.4; 24.8
22.7 21.6; 23.8
21.8 20.7; 22.9
20.9 19.8; 22.0
20.0 18.9; 21.1
19.1 18.0; 20.2
18.2 17.0; 19.4
17.3 16.0; 18.5
31 26.5 25.1;
27.9 25.5
24.2;
26.9 24.6
23.3;
25.9 23.6
22.4;
24.9 22.7
21.5;
23.9 21.7
20.6;
22.9 20.8
19.6;
21.9 19.8
18.6;
21.0 18.8
17.6;
20.1 17.9
16.6;
19.2
32 27.6 26.1;
29.1 26.6
25.1;
28.0 25.6
24.2;
26.9 24.6
23.3;
25.9 23.5
22.3;
24.8 22.5
21.3;
23.8 21.5
20.3;
22.8 20.5
19.2;
21.8 19.5
18.2;
20.9 18.5
17.1;
19.9
33 28.7 27.0; 30.3
27.6 26.1; 29.1
26.5 25.1; 28.0
25.5 24.1; 26.9
24.4 23.1; 25.8
23.4 22.0; 24.7
22.3 21.0; 23.6
21.2 19.9; 22.6
20.2 18.7; 21.6
19.1 17.6; 20.6
34 29.7 28.0;
31.5 28.6
27.0;
30.3 27.5
26.0;
29.1 26.4
24.9;
27.9 25.3
23.9;
26.7 24.2
22.8;
25.6 23.1
21.6;
24.5 21.9
20.5;
23.4 20.8
19.3;
22.4 19.7
18.1;
21.3
35 30.8 29.0;
32.7 29.7
27.9;
31.4 28.5
26.9;
30.1 27.3
25.8;
28.9 26.2
24.6;
27.7 25.0
23.5;
26.5 23.8
22.3;
25.3 22.7
21.1;
24.2 21.5
19.9;
23.1 20.3
18.6;
22.0
36 31.9 30.0;
33.8 30.7
28.9;
32.5 29.5
27.7;
31.2 28.2
26.6;
29.9 27.0
25.4;
28.6 25.8
24.2;
27.4 24.6
23.0;
26.2 23.4
21.7;
25.0 22.1
20.4;
23.9 20.9
19.1;
22.7
37 33.0 30.9;
35.0 31.7
29.8;
33.6 30.4
28.6;
32.2 29.2
27.4;
30.9 27.9
26.2;
29.6 26.6
25.0;
28.3 25.3
23.7;
27.0 24.1
22.4;
25.8 22.8
21.0;
24.6 21.5
19.6;
23.4
38 34.1 31.9;
36.2 32.7
30.7;
34.7 31.4
29.5;
33.3 30.1
28.3;
31.9 28.8
27.0;
30.5 27.4
25.7;
29.2 26.1
24.4;
27.9 24.8
23.0;
26.6 23.5
21.6;
25.4 22.1
20.1;
24.1
39 35.1 32.9; 37.4
33.8 31.7; 35.9
32.4 30.4; 34.4
31.0 29.1; 32.9
29.6 27.8; 31.5
28.2 26.4; 30.1
26.9 25.0; 28.7
25.5 23.6; 27.4
24.1 22.1; 26.1
22.7 20.6; 24.9
40 36.2 33.9;
38.6 34.8
32.6;
37.0 33.4
31.3;
35.4 31.9
29.9;
33.9 30.5
28.6;
32.4 29.1
27.2;
31.0 27.6
25.7;
29.6 26.2
24.2;
28.2 24.8
22.7;
26.9 23.3
21.1;
25.6
41 37.3 34.8;
39.8 35.8
33.5;
38.1 34.3
32.2;
36.5 32.8
30.8;
34.9 31.4
29.4;
33.4 29.9
27.9;
31.9 28.4
26.4;
30.4 26.9
24.8;
29.0 25.4
23.3;
27.6 24.0
21.7;
26.3
42 38.4 35.8; 40.9
36.8 34.4; 39.2
35.3 33.0; 37.6
33.8 31.6; 35.9
32.2 30.1; 34.3
30.7 28.6; 32.8
29.2 27.1; 31.3
27.6 25.5; 29.8
26.1 23.8; 28.4
24.6 22.2; 27.0
43 39.4 36.8;
42.1 37.9
35.4;
40.4 36.3
33.9;
38.6 34.7
32.4;
36.9 33.1
30.9;
35.3 31.5
29.4;
33.7 29.9
27.7;
32.1 28.3
26.1;
30.6 26.7
24.4;
29.1 25.2
22.7;
27.7
44 40.5 37.8;
43.3 38.9
36.3;
41.5 37.2
34.8;
39.7 35.6
33.3;
38.0 34.0
31.7;
36.2 32.3
30.1;
34.6 30.7
28.4;
33.0 29.0
26.7;
31.4 27.4
25.0;
29.9 25.8
23.2;
28.4
45 41.6 38.7; 44.5
39.9 37.2; 42.6
38.2 35.7; 40.8
36.5 34.1; 39.0
34.8 32.5; 37.2
33.1 30.8; 35.5
31.4 29.1; 33.8
29.8 27.3; 32.2
28.1 25.5; 30.6
26.4 23.7; 29.1
46 42.7 39.7; 45.7
40.9 38.1; 43.7
39.2 36.6; 41.8
37.4 34.9; 40.0
35.7 33.3; 38.2
34.0 31.5; 36.4
32.2 29.8; 34.7
30.5 28.0; 33.0
28.7 26.1; 31.4
27.0 24.2; 29.8

194
SpO2
PIO2
(kPa)
85 % 95 %
CI 85 86 %
95 %
CI 86 87 %
95 %
CI 87 88 %
95 %
CI 88 89 %
95 %
CI 89 90 %
95 %
CI 90 91 %
95 %
CI 91 92 %
95 %
CI 92 93 %
95 %
CI 93 94 %
95 %
CI 94 95 %
95 %
CI 95 96 %
95 %
CI 96 97 %
95 %
CI 97 98 %
95 %
CI 98 99 %
95 %
CI 99
100
%
95
% CI
10
0
47 43.8 40.7;
46.9 42.0
39.1;
44.9 40.2
37.4;
42.9 38.4
35.8;
41.0 36.6
34.0;
39.1 34.8
32.3;
37.3 33.0
30.5;
35.5 31.2
28.6;
33.8 29.4
26.7;
32.1 27.6
24.7;
30.5
48 44.8 41.6; 48.0
43.0 40.0; 46.0
41.1 38.3; 44.0
39.3 36.6; 42.0
37.4 34.8; 40.1
35.6 33.0; 38.2
33.7 31.1; 36.4
31.9 29.2; 34.6
30.0 27.2; 32.9
28.2 25.2; 31.2
49 45.9 42.6;
49.2 44.0
40.9;
47.1 42.1
39.2;
45.0 40.2
37.4;
43.0 38.3
35.6;
41.0 36.4
33.7;
39.1 34.5
31.8;
37.2 32.6
29.8;
35.4 30.7
27.8;
33.6 28.8
25.7;
31.9
50 47.0 43.6;
50.4 45.0
41.9;
48.2 43.1
40.1;
46.1 41.1
38.3;
44.0 39.2
36.4;
42.0 37.2
34.5;
40.0 35.3
32.5;
38.1 33.3
30.4;
36.2 31.4
28.4;
34.4 29.4
26.2;
32.6
51 48.1 44.6; 51.6
46.1 42.8; 49.4
44.1 41.0; 47.2
42.1 39.1; 45.0
40.0 37.2; 42.9
38.0 35.2; 40.9
36.0 33.2; 38.9
34.0 31.1; 37.0
32.0 28.9; 35.1
30.0 26.7; 33.3
52 49.1 45.5;
52.8 47.1
43.7;
50.5 45.0
41.8;
48.2 43.0
39.9;
46.0 40.9
38.0;
43.9 38.9
35.9;
41.8 36.8
33.8;
39.8 34.7
31.7;
37.8 32.7
29.5;
35.9 30.6
27.2;
34.0
53 50.2 46.5;
54.0 48.1
44.6;
51.6 46.0
42.7;
49.3 43.9
40.8;
47.0 41.8
38.7;
44.8 39.7
36.7;
42.7 37.6
34.5;
40.6 35.4
32.3;
38.6 33.3
30.0;
36.6 31.2
27.7;
34.7
54 51.3 47.5;
55.1 49.1
45.6;
52.7 47.0
43.6;
50.4 44.8
41.6;
48.1 42.6
39.5;
45.8 40.5
37.4;
43.6 38.3
35.2;
41.5 36.2
32.9;
39.4 34.0
30.6;
37.4 31.8
28.2;
35.4
55 52.4 48.5;
56.3 50.2
46.5;
53.9 47.9
44.5;
51.4 45.7
42.4;
49.1 43.5
40.3;
46.8 41.3
38.1;
44.5 39.1
35.9;
42.3 36.9
33.6;
40.2 34.6
31.2;
38.1 32.4
28.8;
36.1
56 53.5 49.4;
57.5 51.2
47.4;
55.0 48.9
45.4;
52.5 46.7
43.3;
50.1 44.4
41.1;
47.7 42.1
38.8;
45.4 39.8
36.5;
43.2 37.6
34.2;
41.0 35.3
31.7;
38.9 33.0
29.3;
36.8
57 54.5 50.4; 58.7
52.2 48.3; 56.1
49.9 46.2; 53.6
47.6 44.1; 51.1
45.3 41.9; 48.7
42.9 39.6; 46.3
40.6 37.2; 44.0
38.3 34.8; 41.8
36.0 32.3; 39.6
33.6 29.8; 37.5
58 55.6 51.4;
59.9 53.2
49.3;
57.2 50.9
47.1;
54.6 48.5
44.9;
52.1 46.1
42.6;
49.6 43.7
40.3;
47.2 41.4
37.9;
44.9 39.0
35.4;
42.6 36.6
32.9;
40.4 34.2
30.3;
38.2
59 56.7 52.3;
61.1 54.3
50.2;
58.4 51.8
48.0;
55.7 49.4
45.7;
53.1 47.0
43.4;
50.6 44.6
41.0;
48.1 42.1
38.6;
45.7 39.7
36.0;
43.4 37.3
33.4;
41.1 34.9
30.8;
38.9
60 57.8 53.3; 62.3
55.3 51.1; 59.5
52.8 48.9; 56.8
50.3 46.6; 54.1
47.9 44.2; 51.5
45.4 41.8; 49.0
42.9 39.2; 46.6
40.4 36.7; 44.2
37.9 34.0; 41.9
35.5 31.3; 39.7
61 58.9 54.3;
63.4 56.3
52.0;
60.6 53.8
49.8;
57.8 51.3
47.4;
55.1 48.7
45.0;
52.5 46.2
42.5;
49.9 43.7
39.9;
47.4 41.1
37.3;
45.0 38.6
34.6;
42.7 36.1
31.8;
40.4
62 59.9 55.3;
64.6 57.3
53.0;
61.7 54.8
50.6;
58.9 52.2
48.2;
56.1 49.6
45.8;
53.4 47.0
43.2;
50.8 44.4
40.6;
48.3 41.8
37.9;
45.8 39.3
35.1;
43.4 36.7
32.3;
41.1
63 61.0 56.2; 65.8
58.4 53.9; 62.9
55.7 51.5; 60.0
53.1 49.1; 57.2
50.5 46.6; 54.4
47.8 44.0; 51.7
45.2 41.3; 49.1
42.6 38.5; 46.6
39.9 35.7; 44.2
37.3 32.8; 41.8
64 62.1 57.2; 67.0
59.4 54.8; 64.0
56.7 52.4; 61.0
54.0 49.9; 58.2
51.3 47.3; 55.4
48.6 44.7; 52.6
46.0 42.0; 50.0
43.3 39.1; 47.4
40.6 36.3; 44.9
37.9 33.3; 42.5

195
SpO2
PIO2
(kPa)
85 % 95 %
CI 85 86 %
95 %
CI 86 87 %
95 %
CI 87 88 %
95 %
CI 88 89 %
95 %
CI 89 90 %
95 %
CI 90 91 %
95 %
CI 91 92 %
95 %
CI 92 93 %
95 %
CI 93 94 %
95 %
CI 94 95 %
95 %
CI 95 96 %
95 %
CI 96 97 %
95 %
CI 97 98 %
95 %
CI 98 99 %
95 %
CI 99
100
%
95
% CI
10
0
65 63.2 58.2;
68.2 60.4
55.8;
65.1 57.7
53.3;
62.1 54.9
50.7;
59.2 52.2
48.1;
56.3 49.5
45.4;
53.5 46.7
42.6;
50.8 44.0
39.8;
48.2 41.2
36.8;
45.7 38.5
33.8;
43.2
66 64.2 59.1; 69.4
61.4 56.7; 66.2
58.7 54.2; 63.2
55.9 51.6; 60.2
53.1 48.9; 57.3
50.3 46.1; 54.4
47.5 43.3; 51.7
44.7 40.4; 49.0
41.9 37.4; 46.4
39.1 34.3; 43.9
67 65.3 60.1;
70.5 62.5
57.6;
67.4 59.6
55.0;
64.2 56.8
52.4;
61.2 53.9
49.7;
58.2 51.1
46.9;
55.3 48.2
44.0;
52.5 45.4
41.0;
49.8 42.5
38.0;
47.2 39.7
34.8;
44.6
68 66.4 61.1;
71.7 63.5
58.5;
68.5 60.6
55.9;
65.3 57.7
53.2;
62.2 54.8
50.5;
59.2 51.9
47.6;
56.2 49.0
44.7;
53.4 46.1
41.6;
50.6 43.2
38.5;
47.9 40.3
35.3;
45.3
69 67.5 62.1; 72.9
64.5 59.5; 69.6
61.6 56.8; 66.4
58.6 54.1; 63.2
55.7 51.2; 60.1
52.7 48.3; 57.1
49.8 45.3; 54.2
46.8 42.2; 51.4
43.9 39.1; 48.7
40.9 35.8; 46.0
70 68.6 63.0;
74.1 65.6
60.4;
70.7 62.5
57.7;
67.5 59.5
54.9;
64.2 56.5
52.0;
61.1 53.5
49.1;
58.0 50.5
46.0;
55.1 47.5
42.9;
52.2 44.5
39.6;
49.4 41.5
36.3;
46.7
71 69.6 64.0;
75.3 66.6
61.3;
71.9 63.5
58.5;
68.5 60.5
55.7;
65.2 57.4
52.8;
62.0 54.4
49.8;
58.9 51.3
46.7;
55.9 48.2
43.5;
53.0 45.2
40.2;
50.2 42.1
36.9;
47.4
72 70.7 65.0;
76.5 67.6
62.2;
73.0 64.5
59.4;
69.6 61.4
56.5;
66.3 58.3
53.6;
63.0 55.2
50.5;
59.8 52.1
47.4;
56.8 48.9
44.1;
53.8 45.8
40.8;
50.9 42.7
37.4;
48.1
73 71.8 66.0;
77.7 68.6
63.2;
74.1 65.5
60.3;
70.7 62.3
57.4;
67.3 59.1
54.4;
64.0 56.0
51.2;
60.7 52.8
48.0;
57.6 49.7
44.7;
54.6 46.5
41.3;
51.7 43.3
37.9;
48.8
74 72.9 66.9;
78.8 69.7
64.1;
75.3 66.4
61.2;
71.7 63.2
58.2;
68.3 60.0
55.1;
64.9 56.8
52.0;
61.6 53.6
48.7;
58.5 50.4
45.4;
55.4 47.2
41.9;
52.4 43.9
38.4;
49.5
75 73.9 67.9; 80.0
70.7 65.0; 76.4
67.4 62.1; 72.8
64.1 59.0; 69.3
60.9 55.9; 65.9
57.6 52.7; 62.5
54.3 49.4; 59.3
51.1 46.0; 56.2
47.8 42.5; 53.2
44.5 38.9; 50.2
76 75.0 68.9;
81.2 71.7
65.9;
77.5 68.4
62.9;
73.9 65.1
59.9;
70.3 61.7
56.7;
66.8 58.4
53.4;
63.5 55.1
50.1;
60.2 51.8
46.6;
57.0 48.5
43.0;
53.9 45.2
39.4;
50.9
77 76.1 69.8;
82.4 72.7
66.9;
78.6 69.4
63.8;
74.9 66.0
60.7;
71.3 62.6
57.5;
67.8 59.2
54.2;
64.4 55.9
50.7;
61.0 52.5
47.2;
57.8 49.1
43.6;
54.7 45.8
39.9;
51.7
78 77.2 70.8; 83.6
73.8 67.8; 79.8
70.3 64.7; 76.0
66.9 61.5; 72.3
63.5 58.3; 68.7
60.1 54.9; 65.3
56.6 51.4; 61.9
53.2 47.8; 58.6
49.8 44.2; 55.4
46.4 40.4; 52.4
79 78.3 71.8;
84.8 74.8
68.7;
80.9 71.3
65.6;
77.1 67.8
62.4;
73.3 64.4
59.0;
69.7 60.9
55.6;
66.2 57.4
52.1;
62.7 53.9
48.5;
59.4 50.4
44.7;
56.2 47.0
40.9;
53.1
80 79.3 72.8;
86.0 75.8
69.6;
82.0 72.3
66.5;
78.1 68.8
63.2;
74.3 65.2
59.8;
70.6 61.7
56.4;
67.1 58.2
52.8;
63.6 54.6
49.1;
60.2 51.1
45.3;
57.0 47.6
41.4;
53.8
81 80.4 73.7; 87.1
76.8 70.6; 83.1
73.3 67.3; 79.2
69.7 64.0; 75.4
66.1 60.6; 71.6
62.5 57.1; 68.0
58.9 53.4; 64.4
55.3 49.7; 61.0
51.8 45.8; 57.7
48.2 41.9; 54.5

196
SpO2
PIO2
(kPa)
85 % 95 %
CI 85 86 %
95 %
CI 86 87 %
95 %
CI 87 88 %
95 %
CI 88 89 %
95 %
CI 89 90 %
95 %
CI 90 91 %
95 %
CI 91 92 %
95 %
CI 92 93 %
95 %
CI 93 94 %
95 %
CI 94 95 %
95 %
CI 95 96 %
95 %
CI 96 97 %
95 %
CI 97 98 %
95 %
CI 98 99 %
95 %
CI 99
100
%
95
% CI
10
0
82 81.5 74.7;
88.3 77.9
71.5;
84.3 74.2
68.2;
80.3 70.6
64.9;
76.4 67.0
61.4;
72.6 63.3
57.8;
68.9 59.7
54.1;
65.3 56.1
50.3;
61.8 52.4
46.4;
58.5 48.8
42.4;
55.2
83 82.6 75.7; 89.5
78.9 72.4; 85.4
75.2 69.1; 81.3
71.5 65.7; 77.4
67.8 62.2; 73.5
64.1 58.5; 69.8
60.5 54.8; 66.1
56.8 50.9; 62.6
53.1 47.0; 59.2
49.4 42.9; 55.9
84 83.7 76.6;
90.7 79.9
73.3;
86.5 76.2
70.0;
82.4 72.4
66.5;
78.4 68.7
63.0;
74.5 65.0
59.3;
70.7 61.2
55.5;
67.0 57.5
51.6;
63.4 53.7
47.5;
60.0 50.0
43.4;
56.6
85 84.7 77.6;
91.9 80.9
74.3;
87.6 77.1
70.9;
83.5 73.4
67.3;
79.4 69.6
63.7;
75.4 65.8
60.0;
71.6 62.0
56.1;
67.8 58.2
52.2;
64.2 54.4
48.1;
60.7 50.6
43.9;
57.3
86 85.8 78.6; 93.1
82.0 75.2; 88.8
78.1 71.7; 84.5
74.3 68.2; 80.4
70.4 64.5; 76.4
66.6 60.7; 72.5
62.7 56.8; 68.7
58.9 52.8; 65.0
55.1 48.7; 61.5
51.2 44.4; 58.0
87 86.9 79.6;
94.3 83.0
76.1;
89.9 79.1
72.6;
85.6 75.2
69.0;
81.4 71.3
65.3;
77.3 67.4
61.5;
73.4 63.5
57.5;
69.5 59.6
53.4;
65.8 55.7
49.2;
62.2 51.8
44.9;
58.7
88 88.0 80.5;
95.4 84.0
77.0;
91.0 80.1
73.5;
86.7 76.1
69.8;
82.4 72.2
66.1;
78.3 68.2
62.2;
74.3 64.3
58.2;
70.4 60.3
54.0;
66.6 56.4
49.8;
63.0 52.4
45.5;
59.4
89 89.0 81.5;
96.6 85.0
78.0;
92.1 81.0
74.4;
87.7 77.0
70.7;
83.4 73.0
66.9;
79.3 69.0
62.9;
75.2 65.0
58.9;
71.2 61.0
54.7;
67.4 57.0
50.4;
63.7 53.0
46.0;
60.1
90 90.1 82.5;
97.8 86.1
78.9;
93.3 82.0
75.3;
88.8 78.0
71.5;
84.5 73.9
67.6;
80.2 69.8
63.6;
76.1 65.8
59.5;
72.1 61.7
55.3;
68.2 57.7
50.9;
64.5 53.6
46.5;
60.8
91 91.2 83.4;
99.0 87.1
79.8;
94.4 83.0
76.1;
89.9 78.9
72.3;
85.5 74.8
68.4;
81.2 70.7
64.4;
77.0 66.6
60.2;
73.0 62.5
55.9;
69.0 58.3
51.5;
65.2 54.2
47.0;
61.5
92 92.3 84.4; 100.2
88.1 80.8; 95.5
84.0 77.0; 90.9
79.8 73.2; 86.5
75.6 69.2; 82.1
71.5 65.1; 77.9
67.3 60.9; 73.8
63.2 56.5; 69.8
59.0 52.1; 66.0
54.8 47.5; 62.2
93 93.4 85.4;
101.4 89.1
81.7;
96.6 84.9
77.9;
92.0 80.7
74.0;
87.5 76.5
70.0;
83.1 72.3
65.8;
78.8 68.1
61.6;
74.7 63.9
57.1;
70.6 59.7
52.6;
66.7 55.4
48.0;
63.0
94 94.4 86.4;
102.6 90.2
82.6;
97.8 85.9
78.8;
93.1 81.6
74.8;
88.5 77.4
70.8;
84.0 73.1
66.6;
79.7 68.8
62.2;
75.5 64.6
57.8;
71.4 60.3
53.2;
67.5 56.1
48.5;
63.7
95 95.5 87.3; 103.7
91.2 83.5; 98.9
86.9 79.6; 94.2
82.6 75.7; 89.5
78.2 71.5; 85.0
73.9 67.3; 80.6
69.6 62.9; 76.4
65.3 58.4; 72.2
61.0 53.7; 68.3
56.7 49.0; 64.4
197
A4.1. Rationale for use of fetal hemoglobin as a reference for the
ideal oxyhemoglobin dissociation curve
Multiple red blood cell transfusions will have negligible impact on fetal hemoglobin
at 36 w PMA. Generally such transfusions are at most 10-20 % of blood volume per
transfusion. The majority of these transfusions occur within the extreme preterm infant
group, and mostly over the first 2-3 weeks of life. Recent published data indicate that
only 50 % of adult transfused blood cells survive in the neonatal circulation after 2
weeks, with less than 10 % surviving to 6 weeks post transfusion. Hence, for the
majority of infants, who would generally receive the majority of their transfusions
prior to 30 weeks, there is likely to be very little remaining adult hemoglobin at 36
weeks PMA. For example, a 26 weeks’ GA neonate may receive three separate 20
mL/kg (20 % neonatal blood volume) blood transfusions at 5 days, 2 weeks and again
at say 6 weeks postnatal age (32 w PMA). Such an infant would be expected to have
a residual adult hemoglobin blood composition of 2 %, 3 % and 5% adult hemoglobin
(total of 10 %) of the blood volume at 36 w as a consequence of the prior transfusions
based on the survival of transfused adult red blood cells in neonatal circulation from
Widness et al (Widness et al., 2015). This example is verified by the work of Bard and
Prosmanne (Bard & Prosmanne, 1982), who show that the number of transfusions
given to a preterm infant (some of which received up to 18 transfusions), does not
affect the timing of the switchover from HbF to HbA synthesis. These investigators
showed that on average, over 70 % of the Hb at 36 w PMA is HbF, irrespective of
number of prior transfusions. Indeed, the genetic programming of this switch from
HbF to HbA and its insensitivity to environmental exposures is supported by several
other recent studies (Berglund et al., 2014; Shiao & Ou, 2006).


