Unfinished Business:The Case for
Extended Producer Responsibility for Post-Consumer Packaging
ConradMacKerron, AsYouSow
About the AuthorConrad MacKerron, Senior Director, As You Sow, has nearly two decades of experience leading shareholder advocacy engagement
on social and environmental policies at publicly traded companies. Since founding As You Sow’s shareholder advocacy program in
1997, he has led initiatives on behalf of investors at scores of major companies. Conrad has focused on engaging companies to
develop producer responsibility policies to deal with post-consumer packaging and end-of-life electronics.
He was formerly Senior Social Investment Analyst, Piper Jaffray Philanthropic & Social Investment Consulting and Senior Analyst,
Energy and Environment, Investor Responsibility Research Center. Conrad is a past board member of the Social Investment Forum
and As You Sow. A former journalist, he served as Washington Bureau Chief for Chemical Week and writer for BNA Environment
Reporter. He is the author of Unlocking the Power of the Proxy (Rockefeller Philanthropy Advisors, 2004) and Business in the
Rainforests: Corporations, Deforestation and Sustainability (IRRC, 1993). He holds a Masters in Journalism and Public Affairs from
American University. In 2007, he received the Socially Responsible Investment Service Award from the U.S. Social Investment Forum
for outstanding contributions to the SRI community.
AcknowledgementsThe report was made possible by the generous financial support of Educational Foundation of America, Lisa & Douglas Goldman Fund,
Roy A. Hunt Foundation, Merck Family Fund, The Overbrook Foundation, and V. Kann Rasmussen Foundation. Additional support
was provided by the Arntz Family Foundation, Firedoll Foundation, The Fred Gellert Family Foundation, and individual donors.
The author is indebted to Miriam Gordon of Clean Water Action who contributed content through extensive research and analysis
of existing EPR systems in Europe and Canada, which is reflected in the discussion of these systems in Chapters V and VI.
The author would like to thank the following people who reviewed portions of this paper: Duncan Bury, Duncan Bury Consulting; Miriam
Gordon, Clean Water Action; Clarissa Morawski, CM Consulting; Joachim Quoden, PRO EUROPE; Bill Sheehan, Product Policy
Institute; and others who wish to remain anonymous.
Thank you to the following people who contributed expertise and reviewed the calculations of the value of packaging materials in the
waste stream: Dave Cornell, Association of Postconsumer Plastics Recyclers; Adam Gendell, Greenblue; Wayne Gjerde, Minnesota
Pollution Control Agency; Gregory Rudder, RISI; Will Sagar, Southeast Recycling Development Council; Michael Schedler, NAPCOR.
Additional thanks to the following people for their contributions during the research phase of this project: Scott Cassel, Product
Stewardship Institute; Sheila Davis, Silicon Valley Toxics Coalition; Rick Denyes, Stewardship Ontario; Barbara Kyle, Electronics Take
Back Coalition; Minal Mistry, Greenblue; Scott Mouw, NC Division of Environmental Assistance & Outreach; Joan Pierce, Ameripen;
Jerry Powell, Resource Recycling; Matt Prindiville, Cradle 2 Coalition; Joachim Quoden, PRO EUROPE; Heidi Sanborn, California
Product Stewardship Council; Elizabeth Shoch, Greenblue; Stefanie Wnuck, Product Stewardship Institute.
Thank you to As You Sow staff including Andrew Behar, Danielle Fugere, Amy Galland, Katherine Kassing, and intern Jared Schor
for their assistance in compiling elements of and/or reviewing this report.
Design by John Opet, art270.
About As You SowAs You Sow is a nonprofit organization dedicated to increasing environmental and social corporate responsibility. Founded in 1992,
As You Sow envisions a safe, just, and sustainable world in which environmental health and human rights are central to
corporate decision making. Its Energy, Environmental Health, Waste, and Human Rights programs create positive, industry-wide
change through corporate dialogue, shareholder advocacy, coalition building, and innovative legal strategies. www.asyousow.org
Unfinished Business: The Case for Extended Producer Responsibility for Post-Consumer Packaging
Table of ContentsIntroduction 1
Executive Summary 3
I. The Global Challenge: Sustainable Production and Consumption 5
II. The Packaging Challenge 5Reduce 5Re-use 7Recycle 7U.S. Paper and Packaging Recycling Rates 8Plastic Ocean Pollution 9Deposit Laws 10
III. The Case for Extended Producer Responsibility 10States Are Tapped Out 11Packaging and Climate Change 12Economic Benefits 13How an EPR System Would Work 14
IV. New Momentum for EPR for Packaging in the U.S. 14Industry Pushback 15EPR Proponents Organize 16
V. European Leadership on EPR 16The German Packaging Ordinance 17Program Challenges 18Belgium 19Assessing the EU Directive’s Impact 19
VI. Canada’s Move to EPR 21Ontario 22British Columbia 22
VII. Impact on Design for Recycling 23
VIII. Incineration 23
IX. Conclusions 24
X. Recommendations 26
Appendix 1: Methodology for Determining the Value of Paper and Paperboard and Packaging Materials in Landfills in 2010 27
Endnotes 31
1
Unfinished Business: The Case for Extended Producer Responsibility for Post-Consumer Packaging
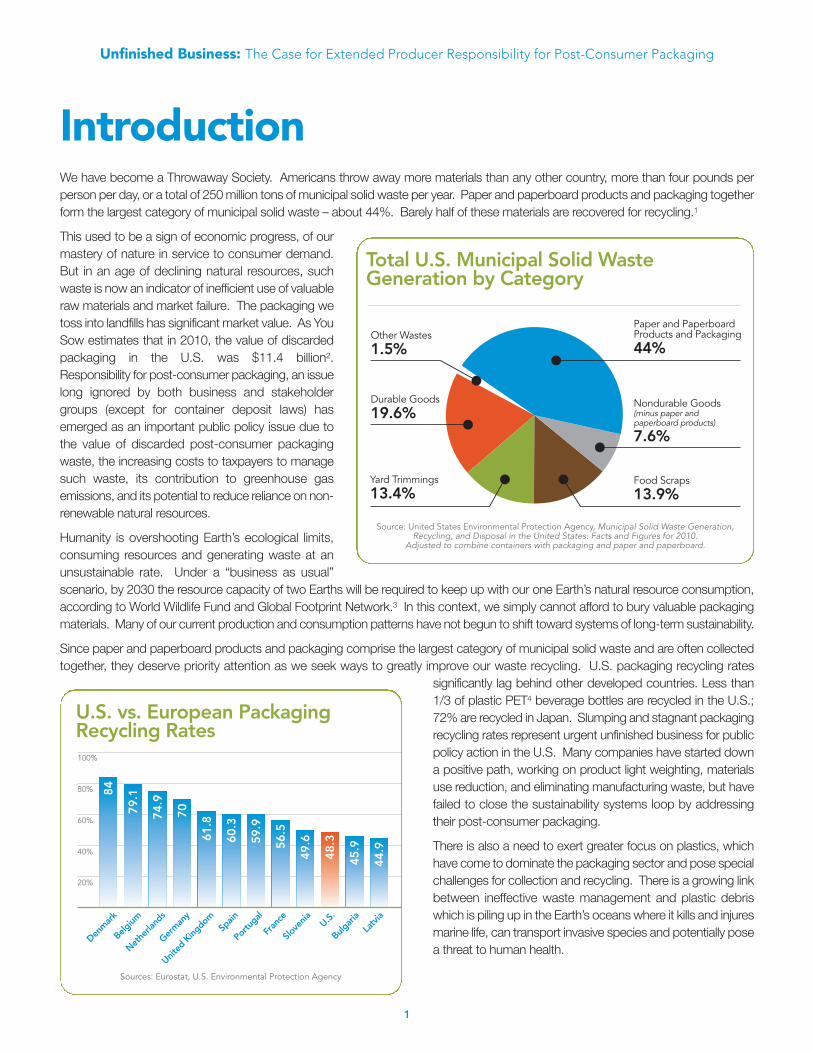
IntroductionWe have become a Throwaway Society. Americans throw away more materials than any other country, more than four pounds per
person per day, or a total of 250 million tons of municipal solid waste per year. Paper and paperboard products and packaging together
form the largest category of municipal solid waste – about 44%. Barely half of these materials are recovered for recycling.1
This used to be a sign of economic progress, of our
mastery of nature in service to consumer demand.
But in an age of declining natural resources, such
waste is now an indicator of inefficient use of valuable
raw materials and market failure. The packaging we
toss into landfills has significant market value. As You
Sow estimates that in 2010, the value of discarded
packaging in the U.S. was $11.4 billion2.
Responsibility for post-consumer packaging, an issue
long ignored by both business and stakeholder
groups (except for container deposit laws) has
emerged as an important public policy issue due to
the value of discarded post-consumer packaging
waste, the increasing costs to taxpayers to manage
such waste, its contribution to greenhouse gas
emissions, and its potential to reduce reliance on non-
renewable natural resources.
Humanity is overshooting Earth’s ecological limits,
consuming resources and generating waste at an
unsustainable rate. Under a “business as usual”
scenario, by 2030 the resource capacity of two Earths will be required to keep up with our one Earth’s natural resource consumption,
according to World Wildlife Fund and Global Footprint Network.3 In this context, we simply cannot afford to bury valuable packaging
materials. Many of our current production and consumption patterns have not begun to shift toward systems of long-term sustainability.
Since paper and paperboard products and packaging comprise the largest category of municipal solid waste and are often collected
together, they deserve priority attention as we seek ways to greatly improve our waste recycling. U.S. packaging recycling rates
significantly lag behind other developed countries. Less than
1/3 of plastic PET4 beverage bottles are recycled in the U.S.;
72% are recycled in Japan. Slumping and stagnant packaging
recycling rates represent urgent unfinished business for public
policy action in the U.S. Many companies have started down
a positive path, working on product light weighting, materials
use reduction, and eliminating manufacturing waste, but have
failed to close the sustainability systems loop by addressing
their post-consumer packaging.
There is also a need to exert greater focus on plastics, which
have come to dominate the packaging sector and pose special
challenges for collection and recycling. There is a growing link
between ineffective waste management and plastic debris
which is piling up in the Earth’s oceans where it kills and injures
marine life, can transport invasive species and potentially pose
a threat to human health.
Source: United States Environmental Protection Agency, Municipal Solid Waste Generation, Recycling, and Disposal in the United States: Facts and Figures for 2010.
Adjusted to combine containers with packaging and paper and paperboard.
Total U.S. Municipal Solid WasteGeneration by Category
Paper and Paperboard Products and Packaging 44%
Nondurable Goods (minus paper and paperboard products)
7.6%
Durable Goods 19.6%
Other Wastes1.5%
Food Scraps13.9%
Yard Trimmings13.4%
Latvia
Bulgaria
U.S.
Slovenia
Portugal
United Kingdom
Spain
Germany
Netherlands
Denmark
100%
80%
60%
40%
20%
Belgium
France
U.S. vs. European PackagingRecycling Rates
84
79.1
74.9
70
61.8
60.3
59.9
56.5
49.6
48.3
45.9
44.9
Sources: Eurostat, U.S. Environmental Protection Agency
2
Unfinished Business: The Case for Extended Producer Responsibility for Post-Consumer Packaging
Discarded post-consumer packaging is an environmental externality whose funding has been carried long enough by U.S. taxpayers
who fund recycling programs. As You Sow believes the time has come to shift financial responsibility for collecting and recycling used
packaging from taxpayers to producers through public policy and regulation known as extended producer responsibility (EPR). Shifting
responsibility to producers for packaging can lead to internalization of end-of-life costs and creates an economic incentive for producers
to reduce packaging and switch to easier to recycle materials. This is not a new or radical idea. At least 47 countries have legislation
in force requiring producers to bear some or all of the cost of end-of-life packaging management.5
EPR has already been successfully adopted in the U.S. for several product categories
such as batteries, carpet, electronics, fluorescent lighting, and paint. Container deposit
laws in 10 states are a form of EPR that have been very successful in increasing
container recovery rates in those states. The most notable success has been for end-
of-life electronics. Explosive growth in information technology driven by faster, cheaper
microchip technology has resulted in rapidly growing piles of electronics discarded after
only a few years of use. An estimated 65 million computers and 130 million mobile
phones are discarded in the U.S. annually. In response, 23 states have adopted EPR
laws and technology giants like Apple, Dell, and HP are assuming financial responsibility
for selected waste electronics.6 Most U.S. companies who generate enormous
amounts of packaging, however, have shown scant leadership on post-consumer
packaging. Until they do, their efforts to portray themselves as environmental leaders
will be lacking a key component – a comprehensive waste policy.
We believe U.S. producers must stop hiding from accountability and follow scores of
other developed economies to accept responsibility for packaging. Here are some of
the most compelling reasons for why companies should take responsibility for their
packaging waste:
• It is not good business to throw away billions of dollars of reusable resources.
• Business needs to prepare now to function sustainably in a world of dwindling
natural resources and increasing commodity costs.
• Increasing recycling of packaging can help reduce a company’s carbon
footprint.
• A few major companies are beginning to confront their responsibility for post-consumer packaging and will set the standard
for other companies to follow.
• Higher recycling rates will build new secondary materials markets that generate thousands of additional “green” jobs.
• Other countries have pioneered producer responsibility models that the U.S. can learn from as it develops an EPR packaging
policy for the 21st century.
• Cash-strapped state and local governments are beginning to look toward producers to help develop and fund effective
recycling programs.
The failure of federal leadership on solid waste policy and goals has slowed progress on developing advanced materials recovery,
strategies, and policies. Voluntary corporate responsibility efforts are laudable but have also failed to significantly increase U.S. recycling
rates. Indeed, they create a perception of progress through incremental and often symbolic feel-good actions that basically preserve
the status quo. New mandates are needed to drive systemic change.
Most U.S. companieswho generateenormous amountsof packaging have shown scantleadership on post-consumer packaging.Until they do, theirefforts to portraythemselves asenvironmentalleaders will be lackinga key component – a comprehensivewaste policy.
3
Unfinished Business: The Case for Extended Producer Responsibility for Post-Consumer Packaging
Executive SummaryAmericans generate more waste than any other country in the world but recycle far less than other developed counties like Denmark,
Belgium, or Germany. Post-consumer paper and paperboard and packaging, which together form the largest category of municipal
solid waste, merit priority attention in efforts to improve extremely poor recycling rates for many post-consumer materials. Shifting
financial responsibility for collecting and recycling used packaging in the U.S. from taxpayers to producers through a policy known as
“extended producer responsibility” (EPR) will incentivize producers to reduce the amount of packaging they create, substantially increase
recycling rates, provide much needed revenue to improve efficiency of recycling systems, reduce carbon footprint and energy use, and
reclaim billions of dollars of embedded value now buried in landfills.
Post-consumer paper and paperboard and packaging consist of valuable commodities such as aluminum, glass, paper, plastic, and
steel. A new estimate completed by As You Sow concludes that the market value of these materials that are not recycled in the U.S.
was $11.4 billion in 2010.7 It is not good business practice to throw away valuable resources.
We live in a world of finite, dwindling resources. Businesses that do not develop sustainable sourcing of products through resource-
efficient circular, or closed loop, systems in the very near term, will not be able to compete to serve a world population estimated at
nine billion by 2050.
U.S. packaging recycling rates lag behind other developed countries by significant amounts. Denmark has an 84% packaging recycling
rate, Belgium is at 78%, the Netherlands at 72%, Germany at 73%. The U.S. recovery rate is estimated at 48.3% for packaging and
52.7% for paper and paperboard products. There are some bright spots; the U.S. does well in paper recycling, but aside from paper,
just 22% of remaining packaging is recycled. Only 12.1% of plastic packaging, the dominant packaging of the future, is recycled.
There are other troubling trends: beverage container recycling rates have dropped 20% over the last two decades. One quarter of the
U.S. population still doesn’t have access to curbside recycling. More than 40 billion aluminum cans, the most valuable beverage
container material, are still dumped annually into landfills in the U.S. According to Alcoa, this wasted material could provide enough
aluminum to build 25,000 jetliners!
Our locally controlled and taxpayer-funded recycling collection systems are often ill-equipped to deal with increasing volume and an
expanding array of packaging wastes. Saddled with projected deficits topping $100 billion, local governments cannot afford to invest
in improving recycling systems. Over 47 countries require producers to bear some or all of the cost of end-of-life packaging management
that in the U.S. has always been paid for by taxpayers. As You Sow believes it is time to shift financial responsibility for managing
packaging to producers through effective and tested EPR policies.
EPR laws and policies are already firmly established in the U.S. for several product categories. More than 70 producer responsibility
laws are in effect in 32 states, covering batteries, mobile phones, paint, pesticide containers, carpet, electronics, thermostats, and
fluorescent lamps – but not packaging. Twenty-three states have passed EPR laws requiring technology makers to take responsibility
for end-of-life management of electronics.
Container deposit laws, structured as EPR programs in eight of the 10 states that have them, are a major success story. The U.S.
recycling rate for beverage containers is only 35%, but in the 10 states with deposit laws, recycling rates range from 66% to 96%.
However, these laws have not expanded to apply to other kinds of consumer packaging.
Shifting financial responsibility to producers for packaging can lead to internalization of end-of-life costs, resulting in economic incentives
to reduce packaging and a transition to easier to recycle materials. Efficiently designed and administered EPR systems can lead to
profits in processing used materials, reductions in carbon emissions and energy used to produce packaging, and thousands of new
“green” jobs in collection and processing.
There is also a need for greater focus on plastics, which have come to dominate the packaging sector and pose special challenges.
There is a growing link between ineffective waste management and plastic debris, which is piling up in the Earth’s ocean gyres where
it injures and kills marine life, can transport invasive species, and potentially poses a threat to human health. A recent assessment of
marine debris concluded that a substantial cause of this debris entering the sea is inadequate waste management infrastructure and
inappropriate disposal. Concern about ocean plastic has resulted in more than 60 cities in California and 100 cities in the U.S. banning
or restricting use of polystyrene foam food packaging and another 28 California municipalities banning plastic take-out bags.

4
Unfinished Business: The Case for Extended Producer Responsibility for Post-Consumer Packaging
EPR laws would resolve many of the concerns identified with packaging recycling by:
• Substantially increasing recovery rates for all post-consumer packaging
• Incentivizing producers to re-design packaging to reduce materials and improve recyclability
• Creating the potential for profitable secondary materials markets for the more than $11 billion worth of packaging that was
landfilled in 2010 alone
• Providing stable revenue sources through producer fees to improve the curbside recycling infrastructure and build new
systems to collect waste from consumers when away from home
• Reducing greenhouse gases
n Nestlé Waters North America says 55% of its carbon footprint comes from production of its bottles and that recycling a bottle
reduces its greenhouse gas impact by 25%
• Meeting pent up demand for recyclables
n There is enormous demand for recycled PET plastic used for soda and water bottles, yet recyclers have been unable to
increase supplies with existing recycling programs; PET recycling rates languish at a paltry 29%
n U.S. recycled PET makers urgently need more materials so major brands can meet commitments made to use high levels
of recycled package content
The European Union enacted a packaging waste directive in 1994, requiring member states to develop systems to meet recycling
goals. Most chose EPR-based systems. Europen, a packaging industry trade group, calls the directive “clearly one of the most
successful pieces of E.U. environmental legislation,” responsible for a “remarkable” reduction in waste sent to disposal and for “lower
costs for the public purse.” The amount of packaging going to final disposal in 15 EU countries fell by 43% over the past 11 years,
largely due to higher recycling levels.
In the last two years, momentum has been building for introduction of EPR for packaging in the U.S. This has been driven by the
factors cited above. Working with a group of aligned shareholders, As You Sow has led engagement of major consumer goods and
grocery companies to adopt EPR polices. These companies include Colgate-Palmolive, General Mills, Kraft Foods, Safeway, Supervalu,
Target, Kroger, Procter & Gamble, Unilever, Walmart, Ahold USA, and Whole Foods. Surprisingly, prominent companies are among
those calling for producers to take responsibility for packaging – most notably Coca-Cola and Nestlé Waters. For the emerging EPR
effort to build sufficient traction, other large companies must step up and take responsibility. A new non-governmental organization,
Recycling Reinvented, is serving as a policy strategy center for educating stakeholders and to move EPR for packaging legislation in
U.S. states. Among its board members is renowned environmental leader Robert F. Kennedy Jr.
Recommendations• Businesses that place substantial amounts of packaging on the U.S. market should take responsibility for collecting and
recycling post-consumer packaging.
• Companies should prioritize engagement with peers and other stakeholders to reach agreement on binding state producer
responsibility legislation setting high packaging recycling goals for all individual kinds of packaging (75%+) and an aggressive
timeline for meeting them.
• A successful mandated EPR for packaging program in the U.S. should address all packaging types, be financed and
managed by producers, drive source reduction, require participation by all businesses that produce packaging waste, and
phase out use of non-recyclable packaging.
• By supporting EPR laws and policies that drive more aggressive and effective collection efforts, companies can then make
commitments to use far higher levels of recycled content in product packaging, which, in turn, supports a circular system
ensuring a stable supply of post-consumer materials to use as new feedstock.
State-of-the-art mining of our post-consumer packaging “trash” is a crucial step to propel us towards sustainable production and
consumption policies that will ease the stress on our planet’s limited natural resources and help feed, clothe, and shelter a world
population of nine billion people by 2050.
5
Unfinished Business: The Case for Extended Producer Responsibility for Post-Consumer Packaging
I. The Global Challenge:Sustainable Production andConsumptionThe United States consumes 33% of the world’s resources but represents only 4.6% of its population.8 With consumption of materials
so far out-pacing the rest of the world, new solutions are needed in the U.S. to slow the drain of natural resources. Some supplies of
petrochemicals, for example, a primary source for plastic packaging, are expected to peak between now and 2020 with prices continuing
to increase.9
Resource scarcity can lead to price volatility. For metals, food, and non-food agricultural items, volatility levels in the first decade of this
century were higher than in any decade in the 20th century.10
Non-governmental groups focusing on Earth’s dwindling resources including World Wildlife Fund and Global Footprint Network are
calling for “one-planet living” through boosting energy efficiency, cutting waste generation, developing low-carbon forms of transport,
improving product sustainability, and using water more efficiently. Even business-oriented groups are calling for aggressive actions to
preserve dwindling natural resources. Vision 2050, a report by the World Business Council for Sustainable Development, calls for up
to a 10-fold improvement in the use of resources and materials to ensure businesses have sufficient raw materials to continue operating
and serve a world of nine billion people in 2050. The report calls for the development of closed loop recycling systems that will make
waste obsolete.11
Incremental change is not enough, warns a similar study from the World Economic Forum. “Achieving sustainability implies very
substantial improvements in resource use and waste management as well as changes in product types and different models of
consumption […] For business models and consumption models to shift fundamentally, all consumption has to become sustainable.”12
A key element of any 21st century corporate sustainability policy must be a comprehensive approach to reducing and eliminating waste
where possible during the production process and recycling it in the post-consumer phase. However, few forward-thinking companies
have dealt with post-consumer waste as a core element of their corporate social responsibility commitments. Many companies have
developed plans to reduce toxics and greenhouse gas emissions but few have demonstrated recognition of the value of discarded
products once consumers are finished with them or how recycling can reduce total environmental footprint. New packaging commonly
enters the marketplace without sufficient consideration of and design for its recyclability. Companies that market globally need to factor
the lack of recycling infrastructure into marketing plans for both developed and less developed countries. Stronger action in these
areas will prepare companies for the challenges ahead in providing uninterrupted supplies of products and packaging in the coming
era of resources limitations.
II. The Packaging ChallengeIt is helpful to discuss post-consumer packaging in the context of the widely accepted waste management hierarchy known as the
3Rs – reduce, re-use, recycle – with progress on source reduction and waste prevention as the highest goals in end-of-life management,
followed by re-use and recycling.
ReduceA strong federal policy would be a good place to start to encourage or require reduced resource consumption. Unfortunately, the
Resource Conservation and Recovery Act, the federal law governing solid waste policy in the U.S., sets no goals or mandates for
reducing solid waste generation or natural resource consumption. It merely encourages waste prevention and diversion of recyclable
materials from landfills. Without such mandates, states generally have not prioritized source reduction, instead focusing on reducing
waste sent to landfills, setting ambitious solid waste diversion goals with mixed results. The nation’s most populous state, California,
6
Unfinished Business: The Case for Extended Producer Responsibility for Post-Consumer Packaging
reached a solid waste diversion rate of 65% in 2010 and recycles 82% of its beverage bottles and cans.13 Other states have struggled.
Connecticut failed to meet a statutory 1993 goal of recycling 40% of solid waste by 2000 and recycles only 30%.14 New York set a
goal of 50% recycling by 1997 and met the goal for a short time, but has since slid back to 20%.15
In recent years, several major consumer goods producers and retailers have begun to address packaging source reduction. Concern
over the volume of packaging generated has become important enough for industry leaders to set reduction goals. Walmart set a goal
of reducing packaging 5% by 2013 from a 2008 baseline. To encourage progress, it developed an innovative supplier packaging
scorecard allowing it to score categories like greenhouse gas emissions generated per ton of packaging, raw material use, packaging
size, recycled content, and the recovery value of materials used. The effectiveness of the scorecard in reducing environmental impact
is not yet clear. The company calls it a work in progress and has cited a few anecdotal instances of source reduction. While a promising
start, it remains to be seen if Walmart will use the scorecard to require systemic change in how packaging is designed and used.
The Grocery Manufacturers Association (GMA) said in 2011 its members had reduced packaging weight by 1.5 billion pounds between
2005 and 2010 and expected to reduce another 2.5 billion pounds between 2011 and 2020.16 If the reductions actually occur going
forward, they would represent a 19% reduction in total weight. However, it is not a formal commitment and there is no plan by GMA
to assure third party verification of data, or to ensure that reductions made are net reductions after factoring continued sales growth.
Further, its timing can be viewed as a tactic to forestall requests being advanced by Coca-Cola and Nestlé Waters for other member
companies to take responsibility for post-consumer packaging.
The Walmart and GMA examples demonstrate the difficulty of evaluating these laudable goals. In the absence of established government
mandated goals for source reduction, companies often set reduction goals based on actions that are easiest and cheapest to achieve.
For example, as long as goals are based on weight reduction as opposed to product-to-package ratio or volume reduction, there will
be a bias to switch from metal and glass to plastic packaging to reduce overall weight
without reducing the amount or size of containers used and discarded.
Many companies have put increasing emphasis in recent years on reducing waste
from manufacturing and operations. (Manufacturing waste dwarfs municipal solid
waste. Manufacturing wastes were last estimated at 7.6 billion tons in 1989 vs.
municipal solid waste today of 250 million tons.) Some major companies have made
bold “zero waste” commitments including General Motors, Procter & Gamble, Staples,
Toyota, and Walmart. These are typically long-term goals to reduce waste materials
to zero in their operations. However, zero waste is often interpreted in an ad hoc way.
For example, General Motors burns about 3% of the waste it can’t landfill. Kraft Foods
also cites use of waste-to-energy facilities for materials that can’t be recycled under
its zero waste commitments. The use of incineration would not be viewed as
legitimate under the charter principles of the Zero Waste International Alliance, a group
seeking to develop uniform standards. The commitments also often lack a specific timeline and do not include taking responsibility for
products or packaging once consumers are done with them, another requirement of the Alliance. There is no doubt much important
work being done to reduce production waste but without a federal mandate or an accurate record of baseline generation data, these
well intended actions risk veering into greenwash and self-promotion. No data are currently reported to the federal government on
industrial waste generation, recovery, or disposal practices in the U.S. making overall progress difficult to measure. Importantly, business
interests have opposed attempts to regulate or even require reporting on manufacturing waste.17
By contrast, one of the goals of the European Union’s (EU’s) packaging directive is prevention of generation of packaging waste, with
requirements that packaging weight and volume be minimized. While enforcement is still minimal and varies by country, it does explicitly
establish reduction of waste as an important goal. Similarly, Canada’s Council of Ministers of the Environment issued a strategy for
sustainable packaging recommending that each province set limits on the amount of packaging materials put on the market.
Many companies have made good progress light weighting their packaging in recent years. Walmart has pressed suppliers like Procter
& Gamble to reduce packaging; a good example is P&G’s concentration of laundry detergent so it can be sold in smaller packages.
PepsiCo says its Aquafina brand plastic water bottle weighs 50% less than it did in 2002, resulting in a savings of 75 million pounds of
PET plastic per year. While these actions are often undertaken because they result in costs savings rather than as part of a concerted
resource efficiency strategy, they are welcome and may temporarily slow the rate of increase of materials used. However, companies
have yet to demonstrate how they will achieve net source reduction as light weighting efforts are offset by continued sales growth. The
importance of making real progress on source reduction is demonstrated by California’s push on diversion. Despite an impressive
Companies have yetto demonstrate howthey will achieve netsource reduction aslight weighting effortsare offset by continuedsales growth.
7
Unfinished Business: The Case for Extended Producer Responsibility for Post-Consumer Packaging
65% diversion rate of solid waste from landfills in California, continued growth in solid waste generation means the state is disposing
of roughly the same amount of waste in landfills today as it did in 198918. The voluntary focus by companies on source reduction is
encouraging and should continue. However, for source reduction to have strategic impact at the national or global level, it should be
led by a federal policy prioritizing natural resource conservation, based on scientific analysis of future availability of various resources.
If federal policy changes remain politically unlikely, states should build source reduction into their solid waste management programs.
Re-useRefillable bottles have long been a symbol of cost efficient re-use of materials in packaging. Prior to the 1960s, most beverages were
delivered in thick refillable bottles that were returned and used 20 times or more. Technological advances which made it more profitable
to introduce single-use bottles and moves to consolidate operations led major beverage makers to gradually abandon refillables in the
U.S. Switching to single-use bottles allowed companies to centralize operations and bypass smaller producers who distributed and
collected bottles regionally.19 Companies maintained that in switching to single-use they were providing the convenience consumers
demanded; but conveniently avoided was discussion that the public would be picking up the cost to manage or recycle bottles for
which companies had previously been willing to take responsibility for collection and recycling.
While beverage companies have abandoned use of refillables in most developed markets, they do continue to be offered in some
developed markets and are thriving in developing markets. Refillable beer bottles in Canada, which represent about 1/5 of total beverage
container sales, are recovered at a rate of 98%.20 Refillables still have a foothold, if dropping, in Denmark, the Netherlands, Germany,
and Finland due to government regulations to protect and promote refillables as well as breweries using the bottles. At least one bottle
maker believes refillables have a future. The UK container company Petainer launched a refillable plastic bottle made of 25% PET
plastic in 2012 claiming that companies could save four to five times as much on packaging by using refillables instead of one-way
bottles.21 If materials shortages arise as expected in the coming decades, refillable bottles may once again be viewed as the most cost
effective method of packaging beverages. Oil spikes combined with high costs of raw materials could make local refilling the most
economical way to deliver products by reducing shipping distances and saving raw materials through repeated usage.
Some brands that don’t yet take responsibility for their packaging are financially supporting companies like Terracycle that direct
unrecyclable products into a re-use stream. A prominent example is Kraft Foods’ Capri Sun drink pouches made from an aluminum
plastic laminate that, 30 years after being placed on the market, still cannot be recycled anywhere in the world. Kraft and Terracycle
announced a partnership in 2008 to collect drink pouches and make them into backpacks and tote bags. This is more beneficial than
landfilling, but is generally very limited in terms of the volume of materials gathered and re-used and achieves only a temporary reprieve
since the laminate is disposed of after its second useful life has ended. Such re-use schemes are stop-gap methods that may make
consumers feel good that the products have been diverted from landfills. Companies who put such packaging into commerce are not
confronting the question of why they are marketing beverages in non-recyclable containers when there are abundant alternatives like
glass, aluminum cans, and PET plastic that are readily recyclable. A more meaningful sustainability commitment than paying for a
private party to process its pouches would be for Kraft to commit to use packaging that is widely collected in curbside recycling systems
and readily processed in closed loop systems to make the most efficient use, long term, of these natural resources.
RecycleRecycling rocks! Or so you would think. The practice of
consumer recycling is well established in the United
States. It is believed that more people recycle than vote
and that it is the most widely practiced environmental
activity in the U.S.22 Compared with 20 years ago, twice
as many Americans, 58%, say they sort solid waste from
recyclables (although there is a lot of room for
improvement – 87% of French and 94% of German
consumers say they sort packaging for recycling).23 Yet
for an activity so popular and increasingly routine, there
are an unsettling number of lingering problems
associated with recycling. Beverage container recycling
rates are one of the most closely watched indicators
is discarded annuallyto produce
Enough aluminum
Airbus A320 planes.
8
Unfinished Business: The Case for Extended Producer Responsibility for Post-Consumer Packaging
because of the volume of bottles and cans produced and the frequency with which highly branded packages show up as litter in the
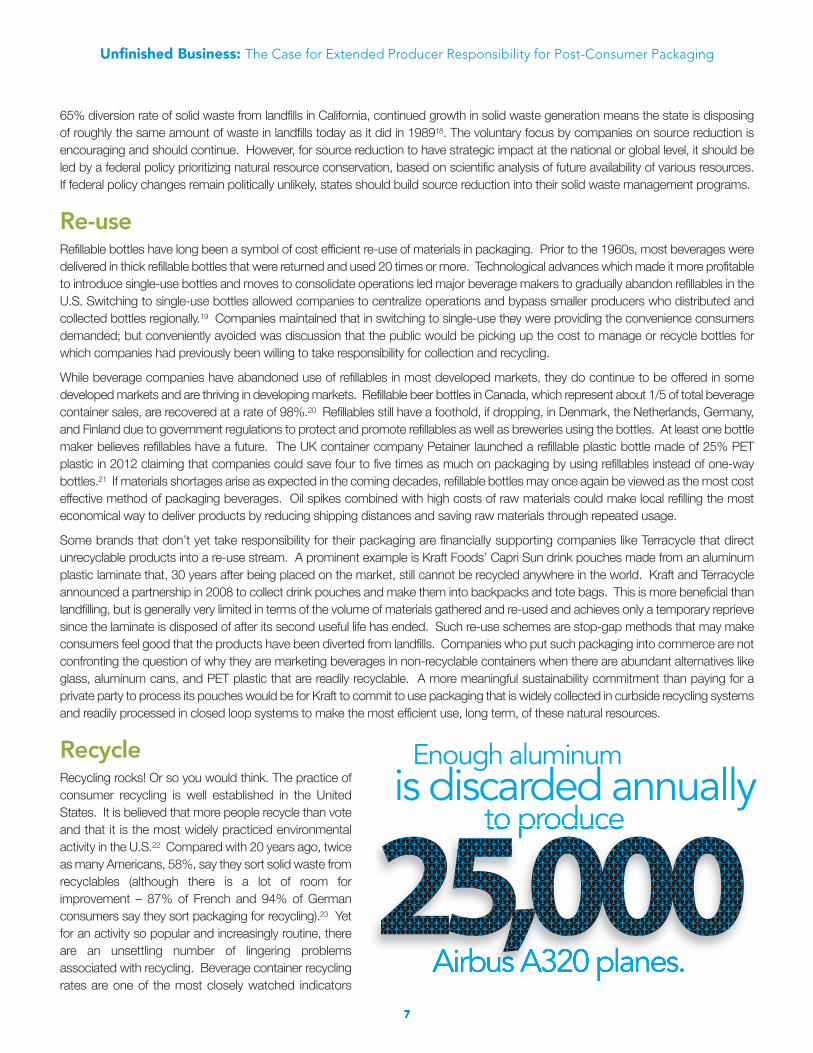
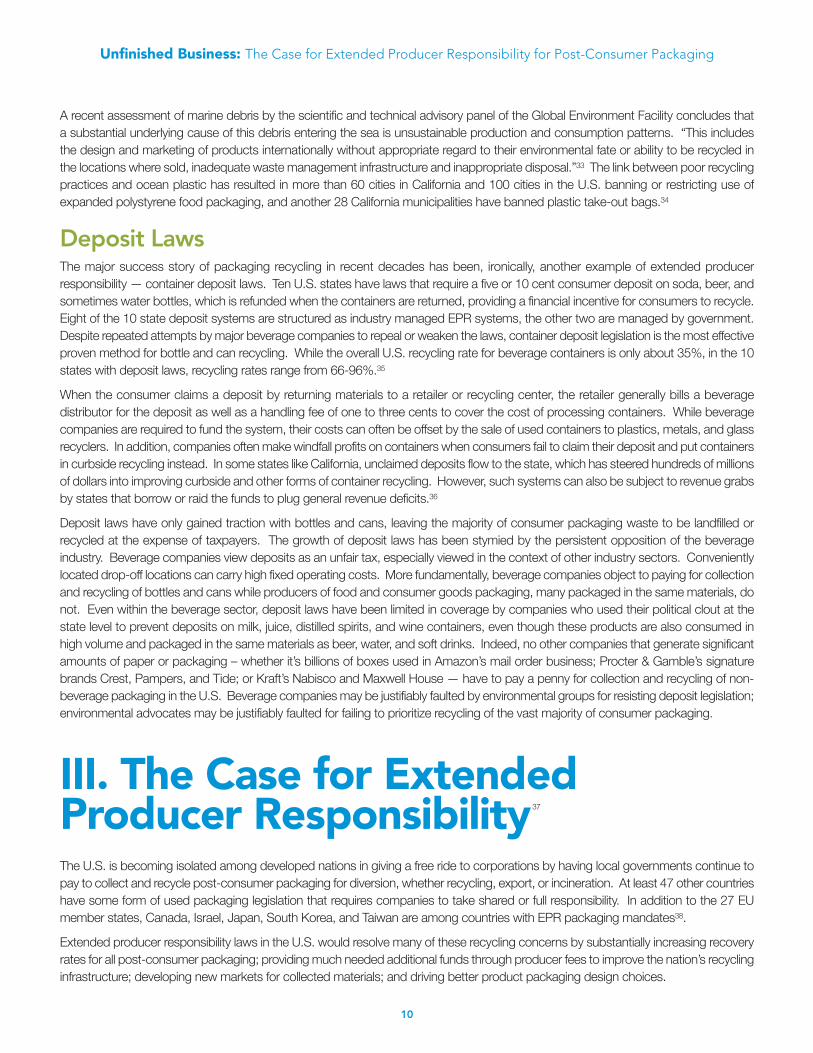
environment. The recycling rates for beverage bottles and cans have dropped over the last 20 years from 53% to about 35% today.24
One quarter of the U.S. population still does not have access to curbside recycling. More than 40 billion aluminum cans, the most
valuable beverage container material, are still dumped annually into landfills in the U.S. That is enough material to make 25,000 jetliners,
according to aluminum maker Alcoa.25 Our waste processing infrastructure lags behind other countries in its ability to process a wide
array of mixed plastics, the dominant and fastest growing form of packaging.
While there is near universal endorsement of recycling as an ideal, companies have generally been willing only to agree to voluntary
rather than binding or mandatory goals. The lack of recycling mandates allows companies to devise their own often modest goals with
no penalty for failing to meet them, while being held to a higher and mandatory standard in other countries and jurisdictions. A classic
example is a commitment made by Coca-Cola in 1992 to use 25% recycled PET plastic in its bottles. The commitment was quietly
abandoned a few years after it was made due to technology constraints. Lack of follow through on even voluntary commitments was
the reason As You Sow engaged Coca-Cola, PepsiCo, and Nestlé Waters to develop bottle and can recycling goals. As You Sow and
its investor allies secured a commitment from Coca-Cola and PepsiCo to use 10% recycled PET content in all plastic bottles in the U.S.
market by 2005. Both companies initially achieved the goal but Coca-Cola soon faltered again after continued problems with technology
and materials supply. PepsiCo has been able to maintain 10% recycled PET content continuously since 2005. Separately, Coca-Cola,
Nestlé Waters, and PepsiCo made commitments to As You Sow to recycle a majority of their bottles and cans over the next four to six
years.26 These commitments set the stage for a push by Coca-Cola and Nestlé Waters to support EPR laws to meet these goals.
U.S. Paper and Packaging Recycling Rates27
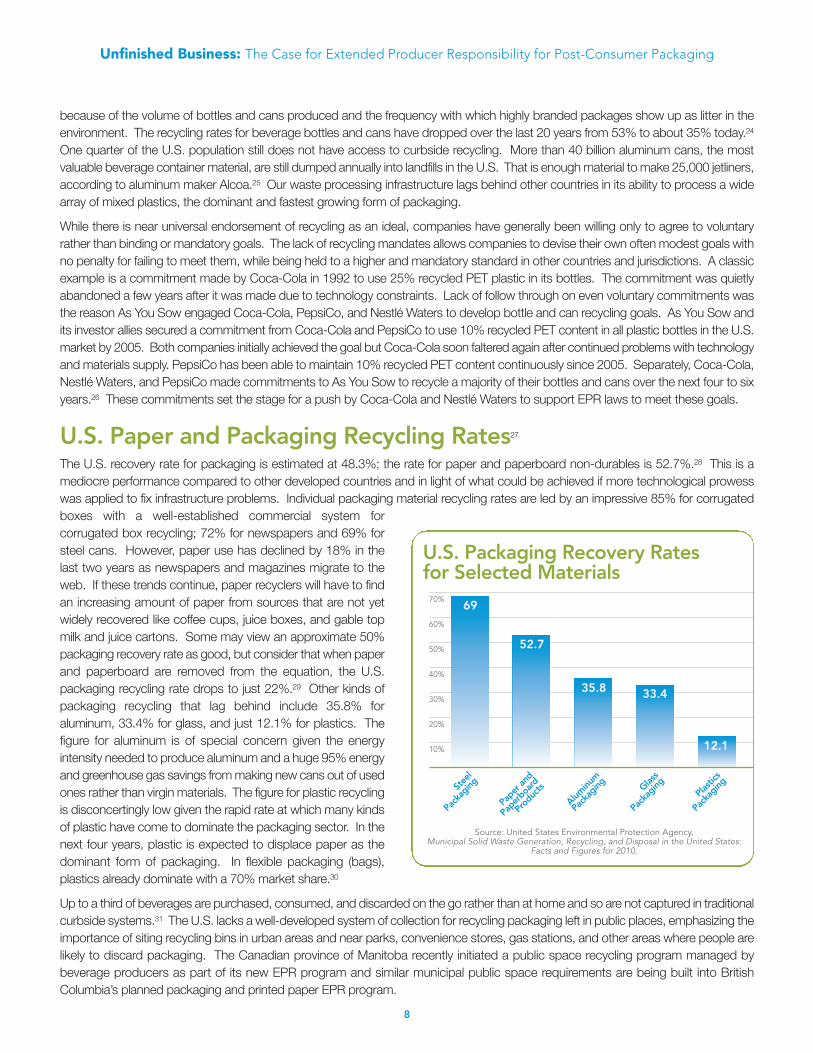
The U.S. recovery rate for packaging is estimated at 48.3%; the rate for paper and paperboard non-durables is 52.7%.28 This is a
mediocre performance compared to other developed countries and in light of what could be achieved if more technological prowess
was applied to fix infrastructure problems. Individual packaging material recycling rates are led by an impressive 85% for corrugated
boxes with a well-established commercial system for
corrugated box recycling; 72% for newspapers and 69% for
steel cans. However, paper use has declined by 18% in the
last two years as newspapers and magazines migrate to the
web. If these trends continue, paper recyclers will have to find
an increasing amount of paper from sources that are not yet
widely recovered like coffee cups, juice boxes, and gable top
milk and juice cartons. Some may view an approximate 50%
packaging recovery rate as good, but consider that when paper
and paperboard are removed from the equation, the U.S.
packaging recycling rate drops to just 22%.29 Other kinds of
packaging recycling that lag behind include 35.8% for
aluminum, 33.4% for glass, and just 12.1% for plastics. The
figure for aluminum is of special concern given the energy
intensity needed to produce aluminum and a huge 95% energy
and greenhouse gas savings from making new cans out of used
ones rather than virgin materials. The figure for plastic recycling
is disconcertingly low given the rapid rate at which many kinds
of plastic have come to dominate the packaging sector. In the
next four years, plastic is expected to displace paper as the
dominant form of packaging. In flexible packaging (bags),
plastics already dominate with a 70% market share.30
Up to a third of beverages are purchased, consumed, and discarded on the go rather than at home and so are not captured in traditional
curbside systems.31 The U.S. lacks a well-developed system of collection for recycling packaging left in public places, emphasizing the
importance of siting recycling bins in urban areas and near parks, convenience stores, gas stations, and other areas where people are
likely to discard packaging. The Canadian province of Manitoba recently initiated a public space recycling program managed by
beverage producers as part of its new EPR program and similar municipal public space requirements are being built into British
Columbia’s planned packaging and printed paper EPR program.
Plastics
PackagingGl
ass
Packaging
Aluminum
Packaging
Paper and
Paperboard
ProductsSt
eel
Packaging
70%
60%
50%
40%
20%
30%
10%
U.S. Packaging Recovery Ratesfor Selected Materials
12.1
33.435.8
52.7
69
Source: United States Environmental Protection Agency, Municipal Solid Waste Generation, Recycling, and Disposal in the United States:
Facts and Figures for 2010.
9
Unfinished Business: The Case for Extended Producer Responsibility for Post-Consumer Packaging
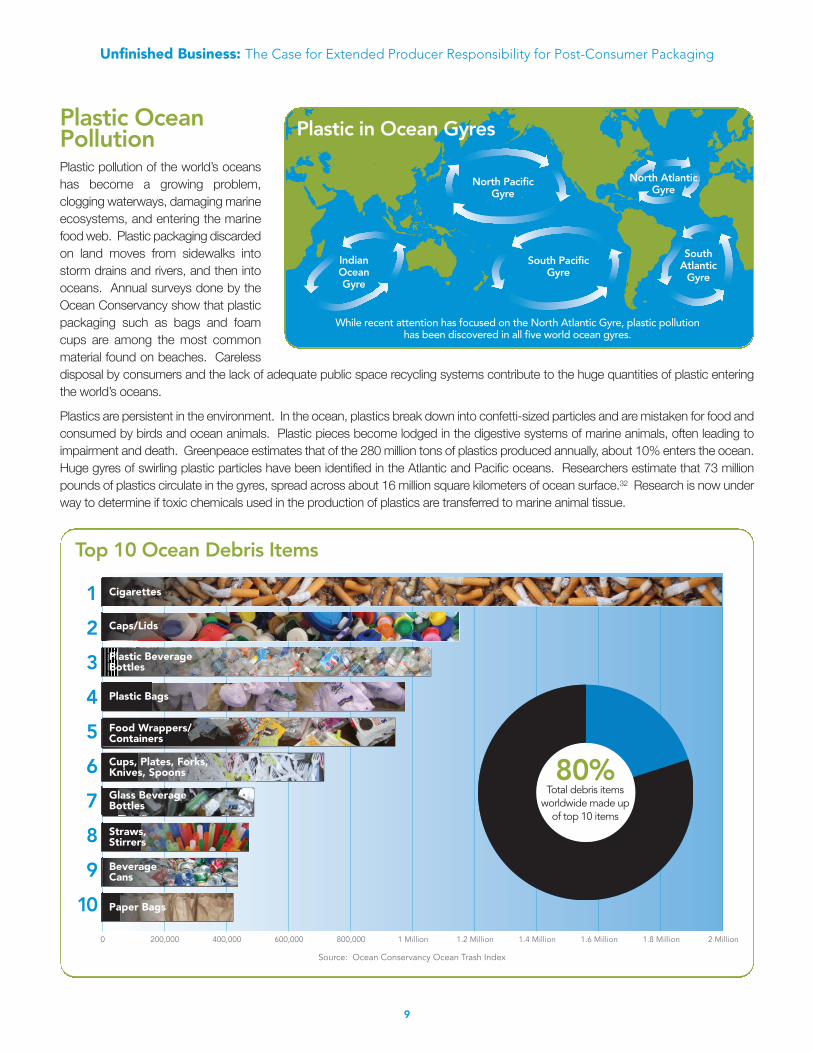
Plastic OceanPollutionPlastic pollution of the world’s oceans
has become a growing problem,
clogging waterways, damaging marine
ecosystems, and entering the marine
food web. Plastic packaging discarded
on land moves from sidewalks into
storm drains and rivers, and then into
oceans. Annual surveys done by the
Ocean Conservancy show that plastic
packaging such as bags and foam
cups are among the most common
material found on beaches. Careless
disposal by consumers and the lack of adequate public space recycling systems contribute to the huge quantities of plastic entering
the world’s oceans.
Plastics are persistent in the environment. In the ocean, plastics break down into confetti-sized particles and are mistaken for food and
consumed by birds and ocean animals. Plastic pieces become lodged in the digestive systems of marine animals, often leading to
impairment and death. Greenpeace estimates that of the 280 million tons of plastics produced annually, about 10% enters the ocean.
Huge gyres of swirling plastic particles have been identified in the Atlantic and Pacific oceans. Researchers estimate that 73 million
pounds of plastics circulate in the gyres, spread across about 16 million square kilometers of ocean surface.32 Research is now under
way to determine if toxic chemicals used in the production of plastics are transferred to marine animal tissue.
Plastic in Ocean Gyres
North PacificGyre
North AtlanticGyre
South PacificGyre
IndianOceanGyre
While recent attention has focused on the North Atlantic Gyre, plastic pollution has been discovered in all five world ocean gyres.
SouthAtlanticGyre
200,000 400,000 600,000 800,000 1 Million 1.2 Million 1.4 Million 1.6 Million 1.8 Million 2 Million0
Top 10 Ocean Debris Items
Source: Ocean Conservancy Ocean Trash Index
1
2
3
4
5
6
7
8
9
10
Cigarettes
Caps/Lids
Plastic Beverage Bottles
Plastic Bags
Food Wrappers/Containers
Cups, Plates, Forks, Knives, Spoons
Glass BeverageBottles
Straws,Stirrers
BeverageCans
Paper Bags
80%Total debris itemsworldwide made up of top 10 items
10
Unfinished Business: The Case for Extended Producer Responsibility for Post-Consumer Packaging
A recent assessment of marine debris by the scientific and technical advisory panel of the Global Environment Facility concludes that
a substantial underlying cause of this debris entering the sea is unsustainable production and consumption patterns. “This includes
the design and marketing of products internationally without appropriate regard to their environmental fate or ability to be recycled in
the locations where sold, inadequate waste management infrastructure and inappropriate disposal.”33 The link between poor recycling
practices and ocean plastic has resulted in more than 60 cities in California and 100 cities in the U.S. banning or restricting use of
expanded polystyrene food packaging, and another 28 California municipalities have banned plastic take-out bags.34
Deposit LawsThe major success story of packaging recycling in recent decades has been, ironically, another example of extended producer
responsibility — container deposit laws. Ten U.S. states have laws that require a five or 10 cent consumer deposit on soda, beer, and
sometimes water bottles, which is refunded when the containers are returned, providing a financial incentive for consumers to recycle.
Eight of the 10 state deposit systems are structured as industry managed EPR systems, the other two are managed by government.
Despite repeated attempts by major beverage companies to repeal or weaken the laws, container deposit legislation is the most effective
proven method for bottle and can recycling. While the overall U.S. recycling rate for beverage containers is only about 35%, in the 10
states with deposit laws, recycling rates range from 66-96%.35
When the consumer claims a deposit by returning materials to a retailer or recycling center, the retailer generally bills a beverage
distributor for the deposit as well as a handling fee of one to three cents to cover the cost of processing containers. While beverage
companies are required to fund the system, their costs can often be offset by the sale of used containers to plastics, metals, and glass
recyclers. In addition, companies often make windfall profits on containers when consumers fail to claim their deposit and put containers
in curbside recycling instead. In some states like California, unclaimed deposits flow to the state, which has steered hundreds of millions
of dollars into improving curbside and other forms of container recycling. However, such systems can also be subject to revenue grabs
by states that borrow or raid the funds to plug general revenue deficits.36
Deposit laws have only gained traction with bottles and cans, leaving the majority of consumer packaging waste to be landfilled or
recycled at the expense of taxpayers. The growth of deposit laws has been stymied by the persistent opposition of the beverage
industry. Beverage companies view deposits as an unfair tax, especially viewed in the context of other industry sectors. Conveniently
located drop-off locations can carry high fixed operating costs. More fundamentally, beverage companies object to paying for collection
and recycling of bottles and cans while producers of food and consumer goods packaging, many packaged in the same materials, do
not. Even within the beverage sector, deposit laws have been limited in coverage by companies who used their political clout at the
state level to prevent deposits on milk, juice, distilled spirits, and wine containers, even though these products are also consumed in
high volume and packaged in the same materials as beer, water, and soft drinks. Indeed, no other companies that generate significant
amounts of paper or packaging – whether it’s billions of boxes used in Amazon’s mail order business; Procter & Gamble’s signature
brands Crest, Pampers, and Tide; or Kraft’s Nabisco and Maxwell House — have to pay a penny for collection and recycling of non-
beverage packaging in the U.S. Beverage companies may be justifiably faulted by environmental groups for resisting deposit legislation;
environmental advocates may be justifiably faulted for failing to prioritize recycling of the vast majority of consumer packaging.
III. The Case for ExtendedProducer Responsibility 37
The U.S. is becoming isolated among developed nations in giving a free ride to corporations by having local governments continue to
pay to collect and recycle post-consumer packaging for diversion, whether recycling, export, or incineration. At least 47 other countries
have some form of used packaging legislation that requires companies to take shared or full responsibility. In addition to the 27 EU
member states, Canada, Israel, Japan, South Korea, and Taiwan are among countries with EPR packaging mandates38.
Extended producer responsibility laws in the U.S. would resolve many of these recycling concerns by substantially increasing recovery
rates for all post-consumer packaging; providing much needed additional funds through producer fees to improve the nation’s recycling
infrastructure; developing new markets for collected materials; and driving better product packaging design choices.

Unfinished Business: The Case for Extended Producer Responsibility for Post-Consumer Packaging
The Organization for Economic and Community Development (OECD) defines EPR as an environmental policy approach in which a
producer’s responsibility for a product is extended to the post-consumer stage of a product’s lifecycle. The OECD maintains EPR
policy is characterized by “shifting responsibility (physical and/or economic; full or partial) upstream toward the producer and away from
municipalities; and providing incentives to producers to take into account environmental considerations when designing their products.”39
Further, while the OECD says that all entities involved in the packaging chain have some responsibility to reduce the lifecycle impacts
of a product and its packaging, EPR holds that primary responsibility lies with the producers or brand owners, because they make
design and marketing decisions which most directly affect the recyclability of packaging.
U.S. EPR proponents recently unveiled a more robust EPR definition. The Product Stewardship Institute, Product Policy Institute, and
California Product Stewardship Council solicited input from stakeholders from business, government, and non-governmental
organizations (NGOs) in an effort to reflect progress made in the past decade since the product stewardship movement emerged in
the U.S. Their new definition, released in April 2012, states that EPR is:
a mandatory type of product stewardship that includes, at a minimum, the requirement that the producer’s responsibility for their
product extends to post-consumer management of that product and its packaging. There are two related features of EPR policy:
(1) shifting financial and management responsibility, with government oversight, upstream to the producer and away from the public
sector; and (2) providing incentives to producers to incorporate environmental considerations into the design of their products and
packaging.40
By mandating producer responsibility, taxpayer subsidization of end-of-life costs are reduced or eliminated in favor of the more equitable
approach of industry accepting full cost accounting for this externality. If producers know they are liable for end-of-life costs, they will
be less likely to design and place hard to recycle packaging on the market because it would result in higher recycling or disposal costs
to them.
As noted, EPR laws and policies are already firmly established in the U.S. for several product categories. More than 70 producer
responsibility laws are in effect in 32 states covering 10 categories of products including batteries, mobile phones, paint, pesticide
containers, carpet, electronics, thermostats, and fluorescent lamps – but not packaging. Electronics EPR laws have been particularly
successful in stemming the tide of electronic waste, or e-waste, generated by rapid turnover of electronic devices by consumers. In
the last decade, 23 states have passed e-waste producer responsibility EPR laws. The most effective of those laws have either minimum
take-back goals or convenience requirements.41 Other factors that have a positive impact on recycling rates include promoting a variety
of collector types (recyclers, retailers,
government) and landfill bans.42
Programs have also benefited from
including a broad scope of products to
be recycled (computers, televisions, cell
phones, monitors, etc.).43
States Are TappedOutWhile states and municipalities have
authority for local solid waste
management, they are facing greater
financial difficulties in funding those
programs. State budget deficits grew
to staggering levels during the recent
recession. In fiscal year 2012,
cumulative state budget deficits are
projected to be $140 billion.45 A recent
assessment from the Northwest
Product Stewardship Council
concluded, “[l]ocal governments and
their ratepayers are no longer able to
invest the necessary financial resources
Zero One Two Three Four Five Six
Number of Product Categories Covered by EPR Law:
* Other laws authorizing agencies to require EPR, including framework laws.
*
*ProductCategories:• Auto Switches• Batteries• Carpet• Cell Phones• Electronics• Fluorescent Lighting• Mercury Thermostats• Paint• Pesticide Containers
More than 70 EPR Laws in 32 States44
Source: Product Stewardship Insitute, 2011.
11

Unfinished Business: The Case for Extended Producer Responsibility for Post-Consumer Packaging
to increase the diversion of materials from disposal to recycling.46” Scott Mouw, a top North Carolina environmental official commented,
“[i]ndustry seems satisfied with the government-taxpayer approach to system financing that is failing to deliver the goods – literally.47”
One reason states cannot keep pace on recycling is the growth of new forms of packaging in recent years. A few decades ago,
packaging products were made out of single materials, generally paper, glass, plastic, or metal. Now there are many kinds of plastic
packages, some of which are combinations of biologically-based and petroleum-based. There are many kinds of composites which
generally can’t be recycled. Recycling technologies at the local level would have to become increasingly complex and sophisticated
everywhere to keep pace, which is not a realistic expectation in this time of deficits. Shifting the responsibility to producers will require
them to design products that can be recycled using existing technology, or else develop, manage, and fund recycling technologies for
new materials.
Mouw further notes that part of the appeal of EPR is that it:
could harness the business acumen of corporate capitalism to improve the
commodity supply situation, shifting decision-making from conflicted government
agencies to more economically rational actors. It would also inject capital that in
turn would improve the overall performance of the system – i.e., collect more
materials.48
Given these concerns, many state and local governments have moved to support
EPR legislation. The National Conference of Mayors, National League of Cities, and
National Association of Counties, and municipal leagues in Minnesota and California
have adopted policy statements in support of EPR legislation or a framework structure
allowing EPR to be developed for many product streams.49 “State policies currently
hold local governments responsible for achieving waste diversion goals and enforcing
product disposal bans, both of which are unfunded mandates,” notes the mayors’
resolution, adding that “costs to manage problematic products are currently borne by
taxpayers and rate payers and these costs are increasing substantially and will
continue to do so unless policy changes are made.” California, the Pacific Northwest, New York, Texas, and Vermont have started
statewide product stewardship councils which have adopted principles for EPR framework legislation.50
Packaging and Climate ChangeMost attention on greenhouse gas (GHG) reduction centers on large
industrial sources such as electric utilities. Electric power is the
largest source of GHG emissions when measured using a traditional
industrial sector approach (34%). However, a recent systems-
based analysis of embedded emissions in the U.S. supply chain
concluded that products and packaging are responsible for an even
bigger slice of GHG emissions (44%).51 That’s more than emissions
from energy used in buildings, agriculture, or transportation, which
often get the most attention from activists, government, and
business. “We cannot address climate change or prepare for the
post-peak oil period without changing the way we manage products
and packaging throughout their life cycle,” says Bill Sheehan,
Executive Director of the Product Policy Institute, which analyzed
data from the U.S. Environmental Protection Agency (EPA) to
develop a more complete picture of systems’ contribution to GHG
emissions.
Companies are finding that their packaging contributes a significant
amount of their total carbon footprint. Nestlé Waters found that
55% of its carbon footprint comes from production of its bottles and
that recycling a bottle reduces its greenhouse gas impact by 25%.Source: Joshuah Stolaroff, “Products, Packaging, and U.S. Greenhouse
Gas Emissions,” Product Policy Institute, 2009.
of the U.S. greenhouse gasemissions come from
products and packaging ina systems-based analysis.
44%
Packaging Link to Carbon Pollution
Products and Packaging44%
Local PassengerTransport13%
Building HVACand Lighting21%
Non-Local Passenger Transport9%
Provisionof Food12%
Infrastructure1%
We cannot addressclimate change orprepare for the post-peak oil period withoutchanging the way wemanage products andpackaging throughouttheir life cycle.– Bill Sheehan, Executive Director, Product Policy Institute
12

13
Unfinished Business: The Case for Extended Producer Responsibility for Post-Consumer Packaging
Coca-Cola says packaging is the largest contributor to the carbon footprint of several of its products. States are beginning to understand
the impact recycling can have on reduction of GHG emissions. Paper and paperboard, for example, comprise 46% of materials
deposited in landfills, according to the EPA.52 Decomposing paper forms methane gas in landfills, which is a far more potent greenhouse
gas than carbon dioxide. California has announced its intent to use recycling to help it meet GHG emissions reduction goals required
by its pioneering emission reduction law known as AB 32. California plans to require reductions of five million metrics tons of CO2 from
enhanced commercial recycling.
Economic BenefitsIncreasing recycling rates through mandated EPR programs carries the potential for creating and expanding profitable new recycling
and secondary materials markets. In lieu of existing official estimates on the value of paper and paperboard and packaging landfilled
in the U.S., As You Sow calculated that in 2010, the value of these
materials was $11.4 billion. The estimate was compiled by applying
current commodity and process materials prices to the portion of
materials estimated by U.S. EPA to be land filled in 2010. PET plastic
had the highest commodity value, estimated at $2.9 billion, followed
by HDPE at $2.8 billion, aluminum at $1.4 billion, and paper at
$1.3 billion.53
High demand and limited supply for recycled PET (rPET)
demonstrates the economic potential of increasing recycling rates.
The rPET market was described as “red hot” in industry trade
publications in April 2012. Demand for limited materials is increasing
as new domestic recycling plants compete for the 29% of PET
plastic bottles collected, while the vast majority of the bottles are
landfilled. Packaging providers must compete for available supplies
with carpet makers and, increasingly, textile manufacturers who
turned to PET to make clothing after cotton prices spiked in 2011.
One industry analyst said a new recycling plant in Fayetteville, N.C.
can handle up to 280 million pounds per year, making it the largest
PET recycler in North America, but there are concerns about where
the material will come from to supply this plant. “Everyone is going
after that same chunk of pie, and nobody is doing much to increase
collection.”54 U.S. PET reclaimers currently operate at less than 60% of capacity. Lack of sufficient rPET supply is one of the reasons
cited by Coca-Cola for not meeting a goal to use 10% rPET in its plastic bottles by 2011.
The states of Oregon, New York, and Connecticut all amended their beverage container laws in the last two years to cover plastic
water bottles, which helped to boost deposit program collections by 50 million pounds in 2010. “If we hadn’t had the expansions in
those three bottle deposit states, reclaimers would have had a rough time,” said Mike Schedler, Technical Director for NAPCOR, the
PET industry’s recycling association.55 So, ironically, the ability of beverage companies
to meet their promises to use rPET hinges partly on the deposit laws they have vigorously
opposed.
The U.S. already has a healthy recycling industry for some materials. The firms that
process metals, paper, electronics, rubber, plastic, glass, and textiles generate 137,000
direct jobs and $32 billion in revenue. When suppliers and indirect impact are factored
in, the industry supports nearly half a million jobs and generates a total of $90 billion
annually in economic activity.56 A recent Container Recycling Institute study concluded
that beverage container recycling creates more jobs than disposal and that jobs gained
in recycling far outweigh jobs lost in extraction of virgin materials, landfilling, or domestic
manufacturing.57 A 75% national recycling rate could add nearly 1.5 million new jobs in
this industry by 2030, according to a recent report prepared for the Blue Green Alliance
and a coalition of labor and environmental groups. The report said this level of recycling
Paper: $1,294,625,417
Steel: $285,000,000
Aluminum: $1,446,228,571
PET: $2,917,345,309
HDPE: $2,854,896,000
PVC: $136,000,000
LDPE/LLDPE: $726,000,000
PP: $1,273,600,000
PS: $371,000,000
Total: $11,402,020,357
Glass: $97,325,060
Value of Wasted PackagingMaterials in the U.S.
Source: See Appendix 1 for methodology and plastic material definitions.
The U.S. recyclingindustry indirectlysupports nearly half a million jobsand generates a total of $90 billionannually in economicactivity.
14
Unfinished Business: The Case for Extended Producer Responsibility for Post-Consumer Packaging
would also reduce CO2 emissions by 276 million metric tons by 2030 (equivalent to eliminating emissions from 72 coal-fired power
plants), reduce conventional and toxic emissions that impact human and ecosystem health, and generate a stronger economy by
creating a broader employment base.58
How an EPR System Would WorkState-level legislation will be needed to build a platform for EPR packaging practices in the U.S. Legislation is needed to set high,
enforceable recycling targets and to provide a level playing field for brands by ensuring that all contribute to the system based on the
amount of materials they put on the market. Strict enforcement would avoid a free rider problem which plagues some existing systems.
Currently, consumers pay for recycling services though their real estate taxes or utility bills. Under EPR, producers would develop a
nonprofit producer responsibility organization (PRO) to determine how to set fees for each covered packaging material according to
market share, recyclability of materials used, and other factors. Brand owners would ideally internalize these costs, but may pass a
portion of costs on to consumers. The PRO would contract with waste haulers, recycling facilities, and municipalities to cover their
cost for collection at negotiated rates. The producers operating the PRO would be incentivized to identify opportunities for efficiency
to keep their costs down.
In developing efficient systems, the PROs should study the recommendations of the EPA multi-stakeholder dialogue group consisting
of brands, NGOs, and state and local officials which recently reviewed strategies for optimizing the current collection system. One key
issue is improving the potential for high-quality collectibles, which depends in part on the collection method employed. Where recyclables
are source-separated by consumers and collected separately, higher quality commodities are produced. But most systems are
converting to co-mingled or single-stream systems, which lowers collection costs, but also results in lower quality materials, as the
mixing of materials results in significant contamination of recyclables. Some material loss can be mitigated if material recovery facilities
have high technology optical sorting capabilities to mechanically separate recyclables. Research and pilot projects on consumer
incentives and education are needed so residents will know how to recycle materials properly and be encouraged to do so. The EPA
dialogue group’s report said that better information also needs to be developed on efficiency and cost control, improved performance
reporting, and scalability of systems to accommodate a full array of consumers, including e.g., single family homes, multi-family dwellings,
and commercial and away from home sources.59
IV. New Momentum for EPR for Packaging in the U.S.In the last two years, momentum has been building for the introduction of EPR for packaging in the U.S. This has been driven by the
factors cited above – deteriorating financial positions of states and municipalities, the economic value of wasted materials, growing
awareness of the policy inequity of companies taking responsibility in other world markets but not in their U.S. operations, growing
demand for post-consumer materials, and links to climate footprint and ocean pollution. The fact that state officials, environmental
groups, and materials recyclers favor EPR is not particularly surprising; what is surprising is the new leadership by some forward-
thinking brands. Over the last five years, three major beverage brands, Coca-Cola, Nestlé Waters, and PepsiCo made commitments
to As You Sow to recycle at least 50% of post-consumer bottles and cans over the next four to six years. In pursuit of that commitment,
Coca-Cola and Nestlé Waters decided that the most practical way to achieve those goals, given domestic political realities and the
complexity of increasing materials recovery, was to press for an EPR mandate in the U.S. requiring that all parties placing packaging
on the market contribute based on the level of materials they generate.
In a survey of beverage container recycling practices released last year by As You Sow, Nestlé Waters, New Belgium Brewing Company,
and Coca-Cola said they would support a mandated fee-based EPR system. PepsiCo remained neutral but said it was open to
exploring options depending on more detailed specific proposals. Assuming PepsiCo would sign on to one of these, this would
represent approval of EPR by a significant percentage of the U.S. beverage market.60
State officials petitioned the EPA in 2009 to develop the previously noted multi-stakeholder dialogue on ways to improve financing of
municipal solid waste recycling, specifically praising mandated or legislated EPR programs in Canada and Europe. Officials from New
York, North Carolina, and Iowa noted that:
15
Unfinished Business: The Case for Extended Producer Responsibility for Post-Consumer Packaging
[m]any European and Asian countries and the Canadian provinces of Ontario, Quebec and soon Manitoba have implemented
innovative policy approaches to finance municipal recycling programs outside of the local tax structure. Such policies have led to
increased recycling rates and improved efficiency in local programs, while also helping to meet the needs of the commodity industries
and the increasing commitment of consumer product companies to more environmentally sustainable packaging.61
The group of stakeholders, including major consumer packaged goods (CPG) and grocery brands, met through 2010 and 2011 and
issued a report making recommendations for ways to improve municipal recycling rates and financing.62 However, as a result of
resistance from consumer packaged goods companies, no consensus was reached on how to proceed, demonstrating the need for
more focused discussion between companies, regulators, and stakeholders on a specific approach.
A sign of concern by companies that EPR for packaging policies are gaining steam was the formation in 2011 of a new packaging
trade organization, Ameripen, to develop public policies on packaging and the environment. The group is studying EPR and alternatives
to EPR and plans to have a formal position by the end of 2012.63
Industry PushbackInitial outreach by Coca-Cola and Nestlé Waters to the big CPG sector companies on an EPR approach in 2010 and 2011 met
resistance as might be expected from companies used to generations of not having to take responsibility for their packaging. While
acknowledging they pay fees to recycle their packaging in scores of other countries, no major companies have immediately stepped
forward to take similar responsibility in the U.S. or to support Coca-Cola and Nestlé Waters’
call to action. Most let their trade group, the Grocery Manufacturers Association (GMA), speak
for them.
Rather than engage in an open and balanced dialogue about the merits and challenges posed
by a mandated EPR system, GMA hired a consultant to estimate the potential costs of a
national EPR system and appeared at several industry conferences in 2011 criticizing the
prospect of EPR. The opaque “data” prepared by the consultant purported to show that
reaching a 52% recycling rate with a national EPR system would cost $7 billion to the CPG
sector. The veracity of this figure cannot be confirmed as GMA declined to explain how it was calculated. The approach favored by
EPR proponents is enactment of state EPR laws which would happen incrementally over many years. The GMA estimate seemed to
be based on the assumption that a national program would be imposed all at once, which is highly unlikely given the current political
polarization and massive deficits at the federal level. GMA’s data likely failed to account for cost savings that can be expected as
lessons learned by early adopting states are passed on to later
adopters. But GMA was not done with its sleight of hand. It also
projected a whopping total of $21 billion that the CPG sector might
be liable for if forced to pay for all municipal solid waste it generated,
not just packaging waste. There is no current effort to press
companies to pay for all their solid waste so it was disingenuous for
GMA to publicize the $21 billion figure as a possible policy scenario.
When challenged by As You Sow on these points, GMA agreed in
December 2011 to stop using this data. Another player on EPR is the
Product Management Alliance, a new group expected to lobby against
EPR legislation.
For the emerging EPR effort to build sufficient traction, other large
companies must step up and take responsibility. One such major
company, Unilever, the giant European–based food and consumer
goods company, stands apart from GMA members like Kraft Foods
and Procter & Gamble who oppose or remain neutral on EPR.
Unilever made a public commitment to increase recycling rates for
packaging it uses on average in 14 major countries (including the U.S.)
where it does business 5% by 2015 and 20% by 2020. This is an
important step forward, but the company has yet to describe how it
will achieve that goal or to endorse EPR.
Major trade group opposes EPR for packaging
Increase recycling and recovery rates for post-consumer packaging by
by 2015, and5%by 2020on average in
14 top market countries15%
Unilever’s Commitment
16
Unfinished Business: The Case for Extended Producer Responsibility for Post-Consumer Packaging
EPR Proponents OrganizeThroughout 2010 and 2011, Nestlé Waters and Future 500, a stakeholder engagement and consulting group, convened major
consumer brands, recycling processors, trade groups, product stewardship groups, and others. Their goal is to educate stakeholders
on EPR systems already in operation and work toward agreement on taking responsibility for packaging waste and to develop an
effective and acceptable legislative model (As You Sow is a member of this group). In January 2012, a new NGO, Recycling Reinvented,
started operation to serve as a strategy center for educating stakeholders and to move EPR for packaging legislation in U.S. states.
The group received startup funding from Nestlé Waters. Convening board
members include renowned environmentalist Robert F. Kennedy Jr. and
Nestlé Waters CEO Kim Jeffery.64 Working with a group of aligned
shareholders, As You Sow has led engagement of major consumer goods
and grocery companies to adopt EPR polices. The companies engaged
in dialogue include Ahold USA, Colgate-Palmolive, General Mills, Kraft
Foods, Safeway, Supervalu, Target, Kroger, Procter & Gamble, Unilever,
Walmart, and Whole Foods.
Aside from Coca-Cola and Nestlé Waters, the beverage industry has not
rushed to publicly endorse EPR but has noticeably shifted towards at
least a shared model of responsibility. “Shifting the cost from municipalities to users and producers of products I think is an inevitable
and necessary thing that the U.S. has got to come to grips with,” Kevin Dietly, an American Beverage Association consultant told a
product stewardship webinar last year.65 Keep America Beautiful, a conservative industry-funded group that has traditionally focused
on voluntary recycling efforts now states: “Producers should be responsible for contributing to a stewardship program that encourages
the source reduction and responsible end-of-life management of covered products and addresses the lifecycle impacts of these
products.”66
Some environmental groups are understandably cautious about the push toward EPR being led by Nestlé Waters given the historic
opposition to container deposit laws by beverage companies. An EPR bill filed in the Vermont legislature in 2010 which contained a
repeal of the state’s existing deposit law raised concerns that an underlying agenda is to repeal existing deposit laws. Nestlé Waters
has said it would not support legislation that repeals existing deposit laws and does not plan to introduce legislation in deposit
law states. The bottle bill repeal was later removed from the Vermont legislation.
EPR needs to be tried because bottle bill-style recycling is not readily expandable to other packaging, according to Nestlé Waters CEO
Kim Jeffery. “People do think we need to do something different,” Jeffery told trade publication Plastics News in May 2012. He continued:
The challenge is getting people to embrace one idea, and too many consumer-product companies see EPR as a tax. Not enough
people have connected the dots that it could change the volumes of materials dramatically. They need to get past the idea of EPR
as a tax and see it as an opportunity to use recycled content in their products and packaging.
However, he maintains that he’s not totally wed to EPR. “I’m agnostic and solutions-oriented. If someone can come up with a solution
better than EPR, I’m willing to listen.”67
V. European Leadership on EPRIn considering EPR for the U.S., the European experience is instructive. As U.S. companies become aware of building pressure for
EPR, they will likely move in the coming months to propose even more voluntary approaches to increasing package recycling. It is
important to understand that European EPR laws were the result of failed attempts to develop voluntary programs. As an example, a
group known as the European Recovery and Recycling Association planned to do packaging take-back pilot programs in eight EU
countries in the 1980s but the program was not successful because of the lack of a level playing field, says Derek Stephenson, President
of Steward Edge, a Canada-based consulting firm. Stephenson, whose group has been assisting in developing product stewardship
programs for more than 30 years in both Canada and Europe, said leading companies first tried “everything but EPR” in terms of
voluntary programs but couldn’t meet their goals. As a result, public policies were developed in those countries requiring them to take
responsibility for their packaging.68
New NGO promoting EPR for packaging

17
Unfinished Business: The Case for Extended Producer Responsibility for Post-Consumer Packaging
Germany was the first country to require EPR for packaging with a 1991 ordinance making industry responsible for the costs of collecting,
sorting, and recycling post-consumer packaging. Germany acted following concerns about dwindling landfill space in the densely
populated country. A key goal was to reduce resource use by creating a policy that would drive down consumption of packaging.
Soon after in 1994, the EU enacted the Packaging and Packaging Waste Directive (94/62/EC), requiring member states to develop
regulations on prevention, re-use, and recycling of packaging waste. Influenced by the German ordinance, each country could decide
how to implement the directive but would be required to meet stipulated recycling and recovery targets.69 The directive specified a
hierarchy of end-of-life waste management options making waste prevention the highest goal, followed by re-use, recycling, other
forms of recovery (including incineration with energy recovery), and finally disposal via landfill or incineration without energy recovery.
The directive required members to form national programs
to encourage packaging re-use, to prevent generation of
packaging waste, and to reduce heavy metals content in
packaging. It did not mandate EPR but most countries
enacted policies requiring companies to pay some or all of
the costs of collection and recycling. Fifteen EU countries
now mandate 100% producer financing for these programs,
10 have shared costs, two have tradable credits, and two
others utilize a packaging tax.70
The directive originally set recovery targets of 50% to 65%
for packaging waste, including a recycling rate of 25% to
45%, to be achieved by June 2001.71 This goal has been
revised twice. The most recent revision increased recycling
goals to a 55% overall target including 60% for glass, paper,
and board packaging, 50% for metals and 22.5% for plastics
by 2008. Of the original 12 nations that signed on to the
directive, all met or exceeded the 2008 packaging materials
55% target. Some of the highest performing programs in
recent years are Denmark with an 84% packaging recycling
rate; Belgium at 78.9%; the Netherlands at 72.4%; Germany
70.5%; and Austria 69.9%. Countries that joined the EU
more recently have additional time to meet the targets but
the average packaging recycling rate across the EU-27 has
already reached 61%.72
Each country’s program is slightly different so making
detailed comparisons is difficult and beyond the scope of
this paper, but two general types of systems evolved: a dual
system and a shared system. Dual systems, more
prominent in Northern European countries like Austria and
Germany, provide collection systems for recycling completely
separate from those for collecting solid waste. Shared
systems, more common in southern Europe, split or share
responsibility for collection between established municipal
solid waste collection systems and private providers.
In order to develop effective and efficient programs in the U.S., it is instructive to consider in more depth various programs that have
been put in place in other countries.
The German Packaging Ordinance73
Germany’s system is praised for its pioneering efforts making producers responsible for take-back and for high recovery rates but also
criticized for its complexity and high costs. Germany’s 1991 packaging ordinance gave retailers the responsibility to take back product
packaging from consumers, but exempted retailers from the take-back requirement if their suppliers established a privately financed
0% 10 20 30 40 50 60 70 80%
55%Target Rate
Target Deadline
Cyprus
Estonia
Slovakia
Hungary
Lithuania
Slovenia
Czech Republic
Greece
Portugal
Ireland
France
Finland
Sweden
Spain
Italy
DenmarkUK
Luxembourg
Austria
Germany
Netherlands
Belgium
2008
2011
2012
Progress Toward EU PackagingRecycling Targets as of 2008
Source: Europen, Packaging and Packaging Waste Statistics in Europe: 1998-2008.

18
Unfinished Business: The Case for Extended Producer Responsibility for Post-Consumer Packaging
system to collect packaging. Retailers pressured their suppliers to take on this responsibility and as a result German manufacturers
that produce or import packaging and suppliers or distributors that put packaging into circulation developed a PRO to manage
packaging drop-off bins and contracts with packaging recyclers.. There are now 33 similar PROs managing producer responsibility in
EU member states.
The PRO, called Duales System Deutchland (DSD), initially managed the packaging take-back system in Germany. It was developed
as a “dual” system separate from solid waste collection. DSD charged manufacturers and distributors a license fee to use a “Green
Dot” or “Greuner Punkt” logo on packages, indicating that the package is accepted in that system. A comprehensive collection network
was set up with three venues where Green Dot waste was collected. The most prevalent component is a curbside system where
consumers deposit Green Dot packaging made from plastics, composites, aluminum, and steel (but not glass, paper, or cardboard) in
yellow bags or bins provided to their households. Paper and cardboard are collected in a separate blue bin from homes or at container
stations nearby. Glass requires special handling; residents are required to bring glass to special bins set up in neighborhoods, often
separated by color. Collection stations are also provided for Green Dot waste at retail stores that sell products in Green Dot packaging.
Once collected, materials are sorted by waste management companies under contract with the DSD and sent to recycling facilities.
Initially, the new EPR regulations performed well in both increasing recycling and reducing consumption. Packaging consumption
dropped 9% between 1991 and 199674 due to light weighting of packaging and an increase in refillable and concentrated packaging,
and use of less composite plastics and more easily recycled materials.75 The packaging recycling rate shot up to 81% in 1997. Costs
charged for each material were based on the costs of recycling. This provided an incentive to manufacturers/fillers to reduce their fees
by using more recyclable materials which have lower fees, or to reduce the amount of packaging.76
Some of the specific early system successes included producers changing to more recyclable materials. There was a 50% drop in
composite and plastic packaging, and plastics use in packaging fell from 40% (by volume) to 27%. This reflected avoidance and
minimization of composites and plastic packaging in favor of paper cartons and steel. Early shifts away from plastic packaging were
noted specifically with respect to polyvinyl chloride, polyethylene, and polypropylene.77 This shift made sense as a result of higher fees
for plastics and composites paid by manufacturers. However, from 1997 to 2007, packaging generation increased, returning to slightly
higher than 1991 levels. Some of the factors that may have been responsible for the reversal include strong growth in GDP at the time
in Europe and substantial increases in population and the size of households in Germany.
Germany achieved a 73.5% recycling rate by 2010 including 91% of paper and cardboard packaging and 91% for aluminum and
steel. Here are some of the factors in its success. Ninety-five percent of the German population has access to curbside collection and
other convenient recycling facilities, such as the “bring” sites for glass.78 These bring sites are also located in commercial districts,
making it easy for consumers to recycle packaging away from home, and there is consistency in color coding for separating materials,
making it easy to understand and participate. Germans are highly engaged and motivated, and recycling is convenient and easy.
Another benefit of the system is that by collecting all packaging materials and plastics, Germany has become a leader in the development
of new sorting and recycling technologies, particularly for hard to recycle materials like plastics. Collection and mandates for recycling
of all different types of packaging materials, as required by the directive, has spurred the development of the new technologies, especially
for mixed plastics.
Program ChallengesDSD came under criticism as a legally sanctioned monopoly and, following legal action, was required to allow competitors to share use
of the DSD infrastructure for collection and recycling services. Since 2008, nine companies compete to offer services to manufacturers
and producers to collect, sort, recycle, and dispose of packaging but using the same infrastructure. It may have spurred economic
competition but these service providers lack transparency such that pricing has become confidential and there is no longer publicly
available data on costs or return rates for refillables and single-use beverage containers. Some maintain service has suffered as well.
“Introduction of competition into the compliance system led to systems only offering the legally required minimum of service,” according
to Joachim Quoden, Managing Director, PRO EUROPE, the umbrella organization for European packaging PROs that contract with
waste haulers, recycling facilities, and municipalities. He said additional waste prevention initiatives and consumer communication
campaigns run by the former monopoly system have stopped and recycling seems more aimed at just meeting minimum targets and
there is reduced recycling of mixed plastics.79
In 2003, the German government introduced a mandatory deposit on single-use beverage containers to help shore up use of refillable
bottles. Some German environmentalists believe it may have succeeded in increasing the recycling rate for beverage containers to as
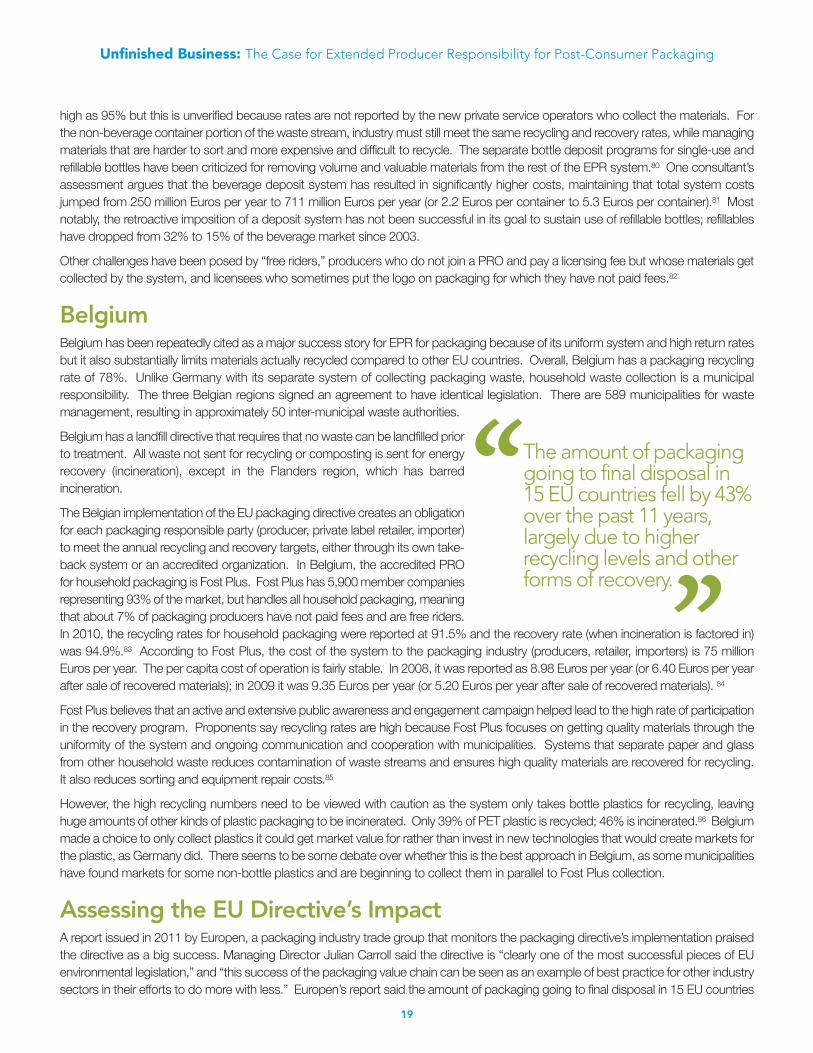
19
Unfinished Business: The Case for Extended Producer Responsibility for Post-Consumer Packaging
high as 95% but this is unverified because rates are not reported by the new private service operators who collect the materials. For
the non-beverage container portion of the waste stream, industry must still meet the same recycling and recovery rates, while managing
materials that are harder to sort and more expensive and difficult to recycle. The separate bottle deposit programs for single-use and
refillable bottles have been criticized for removing volume and valuable materials from the rest of the EPR system.80 One consultant’s
assessment argues that the beverage deposit system has resulted in significantly higher costs, maintaining that total system costs
jumped from 250 million Euros per year to 711 million Euros per year (or 2.2 Euros per container to 5.3 Euros per container).81 Most
notably, the retroactive imposition of a deposit system has not been successful in its goal to sustain use of refillable bottles; refillables
have dropped from 32% to 15% of the beverage market since 2003.
Other challenges have been posed by “free riders,” producers who do not join a PRO and pay a licensing fee but whose materials get
collected by the system, and licensees who sometimes put the logo on packaging for which they have not paid fees.82
BelgiumBelgium has been repeatedly cited as a major success story for EPR for packaging because of its uniform system and high return rates
but it also substantially limits materials actually recycled compared to other EU countries. Overall, Belgium has a packaging recycling
rate of 78%. Unlike Germany with its separate system of collecting packaging waste, household waste collection is a municipal
responsibility. The three Belgian regions signed an agreement to have identical legislation. There are 589 municipalities for waste
management, resulting in approximately 50 inter-municipal waste authorities.
Belgium has a landfill directive that requires that no waste can be landfilled prior
to treatment. All waste not sent for recycling or composting is sent for energy
recovery (incineration), except in the Flanders region, which has barred
incineration.
The Belgian implementation of the EU packaging directive creates an obligation
for each packaging responsible party (producer, private label retailer, importer)
to meet the annual recycling and recovery targets, either through its own take-
back system or an accredited organization. In Belgium, the accredited PRO
for household packaging is Fost Plus. Fost Plus has 5,900 member companies
representing 93% of the market, but handles all household packaging, meaning
that about 7% of packaging producers have not paid fees and are free riders.
In 2010, the recycling rates for household packaging were reported at 91.5% and the recovery rate (when incineration is factored in)
was 94.9%.83 According to Fost Plus, the cost of the system to the packaging industry (producers, retailer, importers) is 75 million
Euros per year. The per capita cost of operation is fairly stable. In 2008, it was reported as 8.98 Euros per year (or 6.40 Euros per year
after sale of recovered materials); in 2009 it was 9.35 Euros per year (or 5.20 Euros per year after sale of recovered materials). 84
Fost Plus believes that an active and extensive public awareness and engagement campaign helped lead to the high rate of participation
in the recovery program. Proponents say recycling rates are high because Fost Plus focuses on getting quality materials through the
uniformity of the system and ongoing communication and cooperation with municipalities. Systems that separate paper and glass
from other household waste reduces contamination of waste streams and ensures high quality materials are recovered for recycling.
It also reduces sorting and equipment repair costs.85
However, the high recycling numbers need to be viewed with caution as the system only takes bottle plastics for recycling, leaving
huge amounts of other kinds of plastic packaging to be incinerated. Only 39% of PET plastic is recycled; 46% is incinerated.86 Belgium
made a choice to only collect plastics it could get market value for rather than invest in new technologies that would create markets for
the plastic, as Germany did. There seems to be some debate over whether this is the best approach in Belgium, as some municipalities
have found markets for some non-bottle plastics and are beginning to collect them in parallel to Fost Plus collection.
Assessing the EU Directive’s ImpactA report issued in 2011 by Europen, a packaging industry trade group that monitors the packaging directive’s implementation praised
the directive as a big success. Managing Director Julian Carroll said the directive is “clearly one of the most successful pieces of EU
environmental legislation,” and “this success of the packaging value chain can be seen as an example of best practice for other industry
sectors in their efforts to do more with less.” Europen’s report said the amount of packaging going to final disposal in 15 EU countries
The amount of packaginggoing to final disposal in15 EU countries fell by 43%over the past 11 years,largely due to higherrecycling levels and otherforms of recovery.
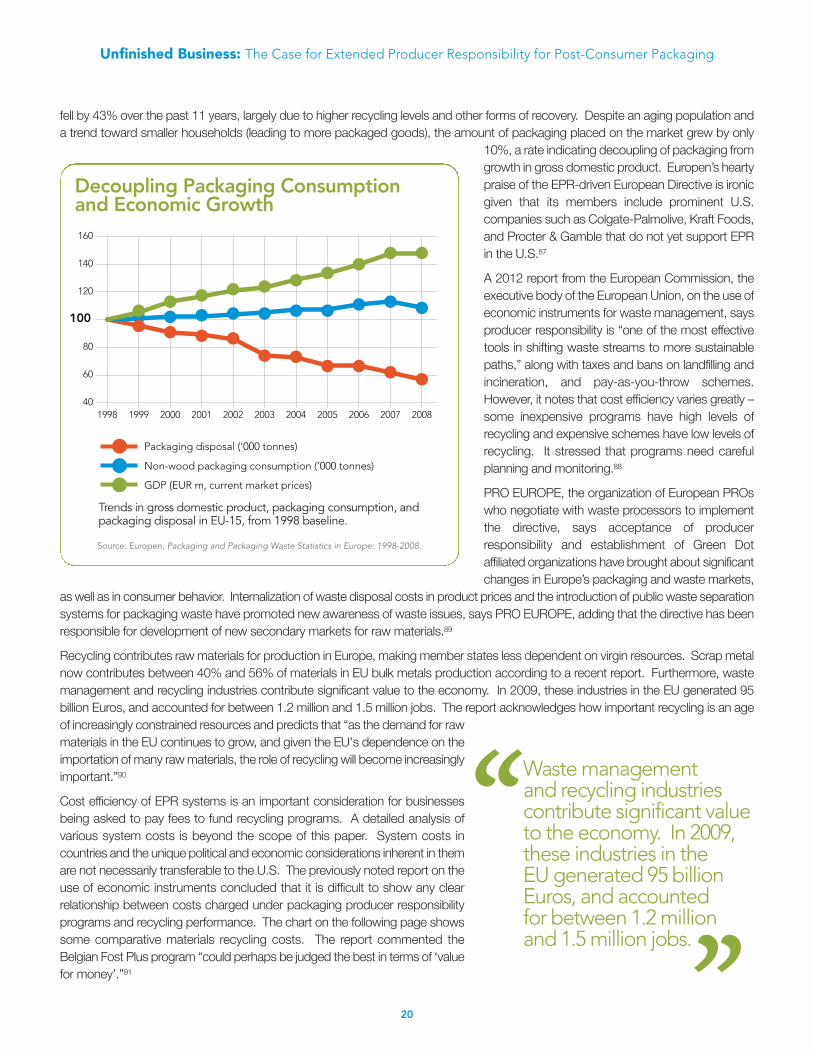
fell by 43% over the past 11 years, largely due to higher recycling levels and other forms of recovery. Despite an aging population and
a trend toward smaller households (leading to more packaged goods), the amount of packaging placed on the market grew by only
10%, a rate indicating decoupling of packaging from
growth in gross domestic product. Europen’s hearty
praise of the EPR-driven European Directive is ironic
given that its members include prominent U.S.
companies such as Colgate-Palmolive, Kraft Foods,
and Procter & Gamble that do not yet support EPR
in the U.S.87
A 2012 report from the European Commission, the
executive body of the European Union, on the use of
economic instruments for waste management, says
producer responsibility is “one of the most effective
tools in shifting waste streams to more sustainable
paths,” along with taxes and bans on landfilling and
incineration, and pay-as-you-throw schemes.
However, it notes that cost efficiency varies greatly –
some inexpensive programs have high levels of
recycling and expensive schemes have low levels of
recycling. It stressed that programs need careful
planning and monitoring.88
PRO EUROPE, the organization of European PROs
who negotiate with waste processors to implement
the directive, says acceptance of producer
responsibility and establishment of Green Dot
affiliated organizations have brought about significant
changes in Europe’s packaging and waste markets,
as well as in consumer behavior. Internalization of waste disposal costs in product prices and the introduction of public waste separation
systems for packaging waste have promoted new awareness of waste issues, says PRO EUROPE, adding that the directive has been
responsible for development of new secondary markets for raw materials.89
Recycling contributes raw materials for production in Europe, making member states less dependent on virgin resources. Scrap metal
now contributes between 40% and 56% of materials in EU bulk metals production according to a recent report. Furthermore, waste
management and recycling industries contribute significant value to the economy. In 2009, these industries in the EU generated 95
billion Euros, and accounted for between 1.2 million and 1.5 million jobs. The report acknowledges how important recycling is an age
of increasingly constrained resources and predicts that “as the demand for raw
materials in the EU continues to grow, and given the EU's dependence on the
importation of many raw materials, the role of recycling will become increasingly
important.”90
Cost efficiency of EPR systems is an important consideration for businesses
being asked to pay fees to fund recycling programs. A detailed analysis of
various system costs is beyond the scope of this paper. System costs in
countries and the unique political and economic considerations inherent in them
are not necessarily transferable to the U.S. The previously noted report on the
use of economic instruments concluded that it is difficult to show any clear
relationship between costs charged under packaging producer responsibility
programs and recycling performance. The chart on the following page shows
some comparative materials recycling costs. The report commented the
Belgian Fost Plus program “could perhaps be judged the best in terms of ‘value
for money’.”91
20082007200620052004200320022001200019991998
Packaging disposal (’000 tonnes)
160
140
120
100
80
60
40
Non-wood packaging consumption (’000 tonnes)
GDP (EUR m, current market prices)
20
Unfinished Business: The Case for Extended Producer Responsibility for Post-Consumer Packaging
Waste management and recycling industriescontribute significant valueto the economy. In 2009,these industries in the EU generated 95 billionEuros, and accounted for between 1.2 millionand 1.5 million jobs.
Trends in gross domestic product, packaging consumption, andpackaging disposal in EU-15, from 1998 baseline.
Decoupling Packaging Consumptionand Economic Growth
Source: Europen, Packaging and Packaging Waste Statistics in Europe: 1998-2008.

21
Unfinished Business: The Case for Extended Producer Responsibility for Post-Consumer Packaging
Another aspect of cost analysis, in terms of packaging recycling, is measurement of cost benefits related to environmental impacts
reduction, such as reducing CO2 through reduction in oil use and sulfur dioxide emissions. The European Commission has concluded
that “it appears safe to say that the costs for packaging recycling are in the same order of magnitude as the most cost-efficient
alternatives to reduce CO2 emissions and other environmental impacts.”92
VI. Canada’s Move to EPREPR requirements for packaging also exist in Canada. Currently, all of the Canadian provinces and two territories have some form of
EPR framework legislation for products and packaging in place. Three of the 10 provinces have packaging programs in place – Ontario,
Quebec, and Manitoba, with a fourth, British Columbia, to start operating in 2014. Ontario and Quebec require industry to pay 50%
of costs, Manitoba 80%, and British Columbia will be 100% producer-financed. As in Europe, Canada’s packaging policies evolved
out of unsuccessful attempts at voluntary solutions. Ontario’s Blue Box curbside system was originally proposed by the beverage
industry as an alternative to a provincial requirement the industry did not like mandating use of a minimum number of refillable bottles.
The government agreed to cut the refillable quota on the condition that the soft drink industry help finance expansion of curbside
recovery across Ontario. This led to the current system of shared industry and municipal funding.
Canada has broadly developed the product stewardship model for many materials, with about 50 product stewardship programs
operated largely at the provincial level.93 Also, all provinces have deposit systems in place for beer containers and eight provinces have
programs in place for soft drinks beverage container recycling, providing an important opportunity to monitor how a dual curbside
packaging recovery system and deposit system can work in tandem in North America.
0
$10
$20
$30
$40
$50
$60
Austri
a
Belgiu
m
Canad
a-Ont
ario
Czech
Rep
ublic
Fran
ce
Germ
any
Japan
Austri
a
Belgiu
m
Canad
a-Ont
ario
Czech
Rep
ublic
Fran
ce
Germ
any
Japan
Austri
a
Belgiu
m
Canad
a-Ont
ario
Czech
Rep
ublic
Fran
ce
Germ
any
Japan
Austri
a
Belgiu
m
Canad
a-Ont
ario
Czech
Rep
ublic
Fran
ce
Germ
any
Japan
Austri
a
Belgiu
m
Canad
a-Ont
ario
Czech
Rep
ublic
Fran
ce
Germ
any
Japan
*
$36
.77
$10
.44
$13
.81
$25
.47
$37
.29
$3.0
8$
57
.87
$6.0
2$
0.9
9$
2.5
8$
5.4
6 $11
.71
$14
.39
$0.2
1
$22
.31
$9.8
6$
3.5
3$
6.8
6$
10
.87
$1.6
5 $9.7
4$
3.9
8$
0.0
8$
1.8
1$
2.6
4$
15
.35
$8.9
4$
4.2
4$
1.2
6$
3.9
0$
5.1
0$
13
.71
$0.0
4
$41
.73
Cereal Box with liner bag
Box of 20tea bags
12 oz.PET bottle
12 oz. aluminumsoda can
Pharmaceuticaltablets
(blisters in box)
International Packaging Fee Comparison (per 1000 retail units)
Fees are per 1000 retail units in U.S. dollars. Calculations are based on fee rates in effect 2011 and reflect sales packaging only.*Japan does not assess fees for aluminum.
Source: Environmental Packaging International

22
Unfinished Business: The Case for Extended Producer Responsibility for Post-Consumer Packaging
OntarioOntario’s Blue Box Program merits discussion as it has been in operation for eight years and presents an alternative to the 100%
industry-financed models in Germany and Belgium. The program was established as part of a Waste Diversion Act (2002) under
Ontario’s Minister of Environment, and implementation began in 2004. Brand owners and first importers of covered products are
designated as stewards who can join together to establish “industry funding organizations” (IFO) similar to PROs in Europe. Stewards
meet their obligation under the act by paying fees to the IFO to cover a portion of the costs associated with collection and recycling of
designated wastes. Waste Diversion Ontario (WDO) oversees the IFOs, reviewing their proposed waste diversion plans and monitors
and tracks performance of IFOs. Stewardship Ontario is the IFO for the residential collection program. It charges the stewards fees
based on the amount of residential packaging and printed paper they supply into Ontario along with other factors. Stewardship Ontario
also uses the fees to invest in market development to expand markets for used packaging, to increase program revenues, and to
improve the effectiveness and efficiency of municipal recycling programs.
Unlike the EU packaging directive, Ontario’s Blue Box program contains no material-specific recovery rates. Instead, it sets overall
diversion targets for printed paper and packaging combined. The most recent target was 60% for 2008. The reported recovery rate
for packaging and printed paper was 65% in 2009 and 67% in 2010. The Ontario model involves municipalities retaining operational
responsibility for local recycling programs, either directly or indirectly, through contracts with waste haulers and sorting operators.
Some of the funds paid by producers are earmarked for market development to improve the province’s capacity to handle difficult to
recycle materials. One project invested $2 million to increase the ability to handle mixed broken glass which contaminates other
recyclables. Another $2 million investment helped develop two new commercial
facilities to recycle mixed plastics previously landfilled or exported to Asia. As a
result, the system can now recycle problematic items like plastic bags and
thermoform plastic containers (polypropylene and polystyrene).
The program has been criticized for having high costs to recover materials like
corrugated, boxboard, and food and beverage containers.94 Plastics overall are
recovered at a fairly low rate of 25% but PET plastic bottles and jars are recovered
at a reported rate of 60% (there is a deposit system in the province for beer, liquor,
and wine but not soft drinks or water bottles). Some analysts have questioned
whether the numbers reported by Stewardship Ontario are realistic, pointing out
they are based on the amount of materials collected rather than actually
recycled.95
The program has been criticized as too cumbersome and prescriptive, and the
provincial government has not moved promptly to fix identified problems by
revising the enabling legislation. There are more than 50 materials recovery facilities serving a population of 13 million, more than 30 of
which manage less than 15,000 metric tons per year, meaning management costs are high.96 Consolidating these facilities might
streamline operations but could result in job losses and stranded assets. Some have suggested that the industry could achieve higher
rates of recovery if it had more operational control over the program. Ontario has proposed moving towards a 100% industry-funded
model, raising the possibility that producers will be given more authority over operating the collection program now administered by
municipalities. Industry advocates expect that performance will improve and cost per ton will decline, due to the greater efficiencies
usually achieved by full EPR programs.97
British ColumbiaThe province of British Columbia has mandated a 100% industry-funded EPR packaging system that will likely be operated by
producers, in some cases in cooperation with municipalities. Obligated producers are required to submit implementation plans by
November 2012 and the system will go into operation in 2014. A key question will be whether the provincial government provides
direction on the role of municipalities under the program. B.C. municipalities may want to continue to collect materials as a contracted
provider to a producers’ organization, or may opt to stop providing collection services. Quebec is in the process of transitioning its
original shared 50/50 financial responsibility packaging program to a 100% industry-funded, but will remain a municipally operated
system. Advocates of EPR packaging programs in the U.S. will watch the development and evolution of these systems with great
interest to see if they resolve operational concerns raised in Ontario.
Some of the funds paid by producers areearmarked for marketdevelopment to improvethe province’s capacity to handle difficult torecycle materials.
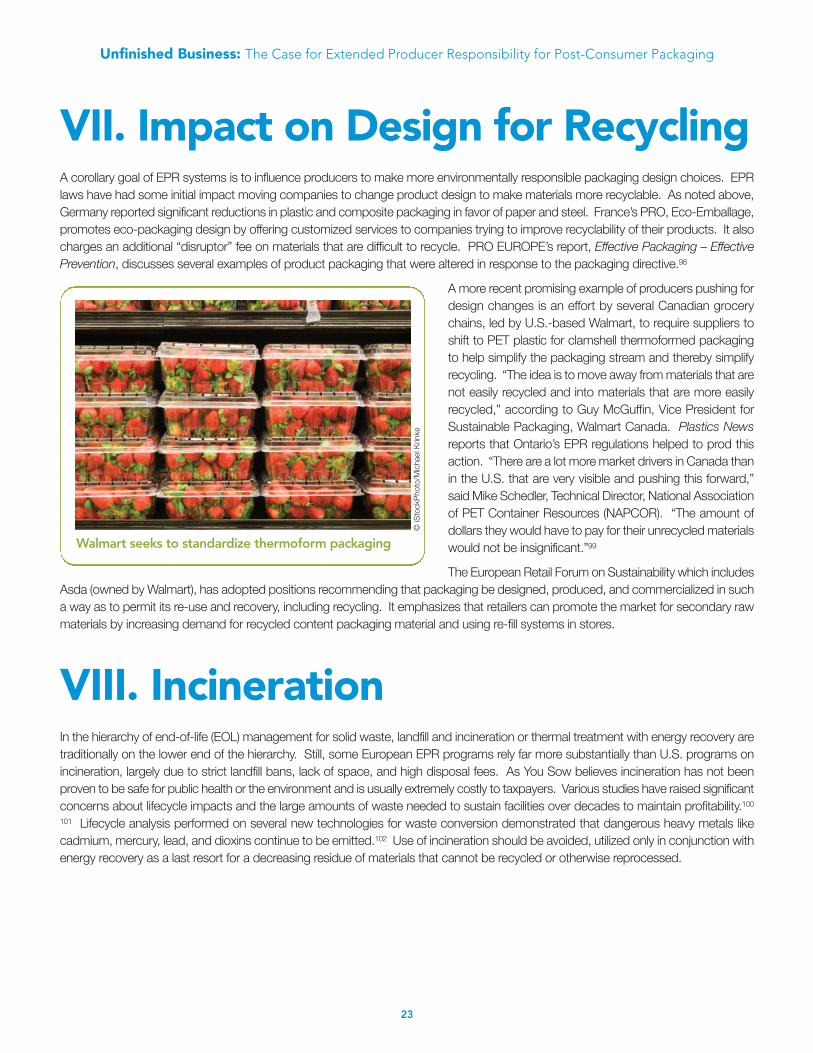
23
Unfinished Business: The Case for Extended Producer Responsibility for Post-Consumer Packaging
VII. Impact on Design for RecyclingA corollary goal of EPR systems is to influence producers to make more environmentally responsible packaging design choices. EPR
laws have had some initial impact moving companies to change product design to make materials more recyclable. As noted above,
Germany reported significant reductions in plastic and composite packaging in favor of paper and steel. France’s PRO, Eco-Emballage,
promotes eco-packaging design by offering customized services to companies trying to improve recyclability of their products. It also
charges an additional “disruptor” fee on materials that are difficult to recycle. PRO EUROPE’s report, Effective Packaging – Effective
Prevention, discusses several examples of product packaging that were altered in response to the packaging directive.98
A more recent promising example of producers pushing for
design changes is an effort by several Canadian grocery
chains, led by U.S.-based Walmart, to require suppliers to
shift to PET plastic for clamshell thermoformed packaging
to help simplify the packaging stream and thereby simplify
recycling. “The idea is to move away from materials that are
not easily recycled and into materials that are more easily
recycled,” according to Guy McGuffin, Vice President for
Sustainable Packaging, Walmart Canada. Plastics News
reports that Ontario’s EPR regulations helped to prod this
action. “There are a lot more market drivers in Canada than
in the U.S. that are very visible and pushing this forward,”
said Mike Schedler, Technical Director, National Association
of PET Container Resources (NAPCOR). “The amount of
dollars they would have to pay for their unrecycled materials
would not be insignificant.”99
The European Retail Forum on Sustainability which includes
Asda (owned by Walmart), has adopted positions recommending that packaging be designed, produced, and commercialized in such
a way as to permit its re-use and recovery, including recycling. It emphasizes that retailers can promote the market for secondary raw
materials by increasing demand for recycled content packaging material and using re-fill systems in stores.
VIII. IncinerationIn the hierarchy of end-of-life (EOL) management for solid waste, landfill and incineration or thermal treatment with energy recovery are
traditionally on the lower end of the hierarchy. Still, some European EPR programs rely far more substantially than U.S. programs on
incineration, largely due to strict landfill bans, lack of space, and high disposal fees. As You Sow believes incineration has not been
proven to be safe for public health or the environment and is usually extremely costly to taxpayers. Various studies have raised significant
concerns about lifecycle impacts and the large amounts of waste needed to sustain facilities over decades to maintain profitability.100
101 Lifecycle analysis performed on several new technologies for waste conversion demonstrated that dangerous heavy metals like
cadmium, mercury, lead, and dioxins continue to be emitted.102 Use of incineration should be avoided, utilized only in conjunction with
energy recovery as a last resort for a decreasing residue of materials that cannot be recycled or otherwise reprocessed.
Walmart seeks to standardize thermoform packaging
© iS
tockP
hoto
/Mic
hael K
rinke
24
Unfinished Business: The Case for Extended Producer Responsibility for Post-Consumer Packaging
IX. ConclusionsEPR WorksAs demonstrated by the initial success of systems discussed in this paper, EPR for packaging programs have increased packaging
recycling rates, spread collection and recycling costs among producers in a generally equitable fashion, provided incentives for producers
to make lighter and more efficiently designed packaging, and reduced the amount of waste going to landfills. Systems in Germany,
Belgium, and Canada provide models, lessons, and choices for the U.S. in its public policy debate on EPR for packaging.
Packaging represents the next great opportunity for producer responsibility because raw materials, such as petroleum and fiber used
to make much consumer packaging, will become increasingly scarce and extraction of these resources has a high environmental
impact. Given its high consumption rates, the U.S. should take action now to improve its waste collection infrastructure to capture a
far greater amount of post-consumer materials and develop closed loop systems
that will efficiently recycle these increasingly valuable materials.
Enthusiastic praise for these systems has come from a major European
packaging trade group whose members include prominent U.S. consumer
goods companies Procter & Gamble and Kraft Foods. EPR for packaging laws
in Europe have diminished public antagonism to packaging waste, been
responsible for a “remarkable” reduction in waste sent to disposal, and local
authorities are seeing “lower costs for the public purse,” according to Julian
Carroll, Managing Director of Europen.103
The systems discussed have not made significant progress on source reduction
and are not without operational challenges, but even with the problems noted,
the programs have made significant progress in elevating recycling rates and
provide a generally solid platform for determining industry responsibility for post-
consumer packaging. Such challenges should not be used as an excuse by
companies for continued inaction.
Focus on Desired OutcomeThe question of which system is “best” is not necessarily the right question, as
each country’s system is the result of often unique political, cultural, and economic forces that will be different in the U.S. A better
question is to ask is, “what is the desired outcome?” If a system that is 100% producer paid is sought, there are many European
models to review. If a system of shared responsibility is preferred, then Ontario or the United Kingdom’s shared funding models can
be considered. Is there a preference for collecting and actually recycling a broad range of materials? If so, observers can look to
Germany, the UK, and Ontario, which focus on recycling a broad range of materials and subsidize investments in new markets for hard
to recycle materials like mixed plastics. If the preference is to focus narrowly on recycling only the most profitable materials, look to
Austria, Belgium, and Switzerland, which focus more on collecting materials with current market value and burn much of the rest.
Companies Must Step UpPaper and paperboard products and packaging comprise the largest segment of U.S. municipal solid waste. Consumer goods
producers operating in the U.S. lag their global peers in taking responsibility for post-consumer packaging. Despite modest progress
on container recycling, companies must acknowledge an ongoing failure of corporate leadership on recycling in the U.S., just as political
leaders must acknowledge similar failures in public policy. Voluntary corporate policies can have a temporary positive impact, but have
not resulted in significant increases in recycling nationwide. Voluntary systems such as individual packaging take-back commitments
by companies likes Starbucks and Estee Lauder are laudable and can be substantive. But in the long run they can cause market
distortions with proactive companies who invest in recycling systems incurring additional costs not borne by their competitors. A
mandated system with fees based on materials put on the market by each producer creates more equity, a level playing field, and
badly needed resources to upgrade U.S. recycling infrastructure.
EPR for packaging laws inEurope have diminishedpublic antagonism topackaging waste, beenresponsible for a‘remarkable’ reduction inwaste sent to disposal,and local authorities areseeing ‘lower costs for the public purse.’– Julian Carroll, Managing Director, Europen
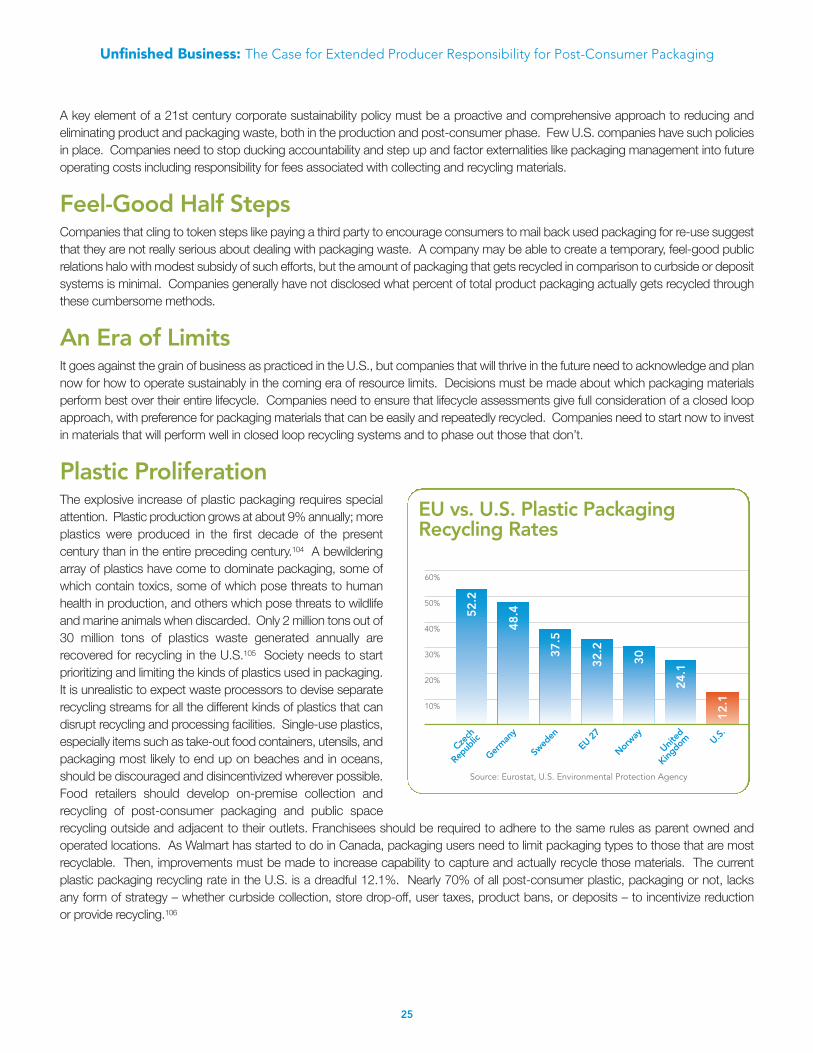
25
Unfinished Business: The Case for Extended Producer Responsibility for Post-Consumer Packaging
A key element of a 21st century corporate sustainability policy must be a proactive and comprehensive approach to reducing and
eliminating product and packaging waste, both in the production and post-consumer phase. Few U.S. companies have such policies
in place. Companies need to stop ducking accountability and step up and factor externalities like packaging management into future
operating costs including responsibility for fees associated with collecting and recycling materials.
Feel-Good Half StepsCompanies that cling to token steps like paying a third party to encourage consumers to mail back used packaging for re-use suggest
that they are not really serious about dealing with packaging waste. A company may be able to create a temporary, feel-good public
relations halo with modest subsidy of such efforts, but the amount of packaging that gets recycled in comparison to curbside or deposit
systems is minimal. Companies generally have not disclosed what percent of total product packaging actually gets recycled through
these cumbersome methods.
An Era of LimitsIt goes against the grain of business as practiced in the U.S., but companies that will thrive in the future need to acknowledge and plan
now for how to operate sustainably in the coming era of resource limits. Decisions must be made about which packaging materials
perform best over their entire lifecycle. Companies need to ensure that lifecycle assessments give full consideration of a closed loop
approach, with preference for packaging materials that can be easily and repeatedly recycled. Companies need to start now to invest
in materials that will perform well in closed loop recycling systems and to phase out those that don’t.
Plastic ProliferationThe explosive increase of plastic packaging requires special
attention. Plastic production grows at about 9% annually; more
plastics were produced in the first decade of the present
century than in the entire preceding century.104 A bewildering
array of plastics have come to dominate packaging, some of
which contain toxics, some of which pose threats to human
health in production, and others which pose threats to wildlife
and marine animals when discarded. Only 2 million tons out of
30 million tons of plastics waste generated annually are
recovered for recycling in the U.S.105 Society needs to start
prioritizing and limiting the kinds of plastics used in packaging.
It is unrealistic to expect waste processors to devise separate
recycling streams for all the different kinds of plastics that can
disrupt recycling and processing facilities. Single-use plastics,
especially items such as take-out food containers, utensils, and
packaging most likely to end up on beaches and in oceans,
should be discouraged and disincentivized wherever possible.
Food retailers should develop on-premise collection and
recycling of post-consumer packaging and public space
recycling outside and adjacent to their outlets. Franchisees should be required to adhere to the same rules as parent owned and
operated locations. As Walmart has started to do in Canada, packaging users need to limit packaging types to those that are most
recyclable. Then, improvements must be made to increase capability to capture and actually recycle those materials. The current
plastic packaging recycling rate in the U.S. is a dreadful 12.1%. Nearly 70% of all post-consumer plastic, packaging or not, lacks
any form of strategy – whether curbside collection, store drop-off, user taxes, product bans, or deposits – to incentivize reduction
or provide recycling.106
Czech
Republic
60%
50%
40%
20%
30%
10%
EU vs. U.S. Plastic PackagingRecycling Rates
52.2
Germany
48.4
Sweden
37.5
EU 27
32.2
Norway
30
United
Kingdom
24.1
U.S.
12.1
Source: Eurostat, U.S. Environmental Protection Agency

X. Recommendations• Businesses that place substantial amounts of packaging on the U.S. market should take responsibility for collecting and
recycling post-consumer packaging.
• Companies should prioritize engagement with peers as well as other stakeholders to reach agreement on binding producer
responsibility legislation setting high packaging recovery goals for all individual kinds of packaging (75%+) and an aggressive
timeline for meeting them.
• A successful mandated packaging EPR program in the U.S. should address all packaging types and include the following
elements:
n Financed and managed by producers
n Aggressive recovery targets with enforceable penalties set by government for failure to meet goals
n Participation by all industries that produce waste streams with each producer contributing an equitable share to the program
n Transparent cost allocation
n Transparency in EPR collection and recycling data, including data from commercial service providers
n Applies to commercial, industrial, and residential packaging
n Industry-funded away from home collection, as well as curbside programs
n Sophisticated educational/promotional programs to ensure consumer participation
n Mechanisms to work synergistically with existing container deposit programs
n A focus on materials management and market development for all recyclables
n Provisions to reduce and phase out use of non-recyclable packaging
n No incineration; burning recyclable materials sends the wrong message to consumers and markets on materials conservation
and efficiency
• The U.S. Environmental Protection Agency and states should propose policies that require companies to move toward
genuine source reduction so businesses can proactively adapt production practices to operate sustainably before coming
resource shortages occur.
• Companies should put resources into designing packaging for recycling in a manner that includes full consideration of the
end-of-life aspect of packaging and, where possible, promotes closed loop systems. Companies should limit packaging
materials to the most readily recyclable materials to save processing fees and promote robust post-consumer materials
markets.
• Companies should make commitments to use far higher levels of recycled content in product packaging, and to publicly
support efforts like mandated producer responsibility laws that will drive more aggressive and effective collection efforts,
ensuring a more stable, long-term supply of post-consumer materials to use as feedstock.
This brief summary of the history of efforts to date of EPR for packaging demonstrates it can provide an efficient and effective packaging
recycling policy for the U.S. for the 21st century. It can capture billions of dollars of value embedded in used materials, provide thousands
of new jobs, and substantially reduce greenhouse gas emissions and energy use. EPR embodies a crucial societal advance by
recognizing that mining our “trash” can propel us towards sustainable production and consumption policies that will ease the stress on
our planet’s limited natural resources and help enable us to feed, clothe, and shelter nine billion people by 2050.
26
Unfinished Business: The Case for Extended Producer Responsibility for Post-Consumer Packaging
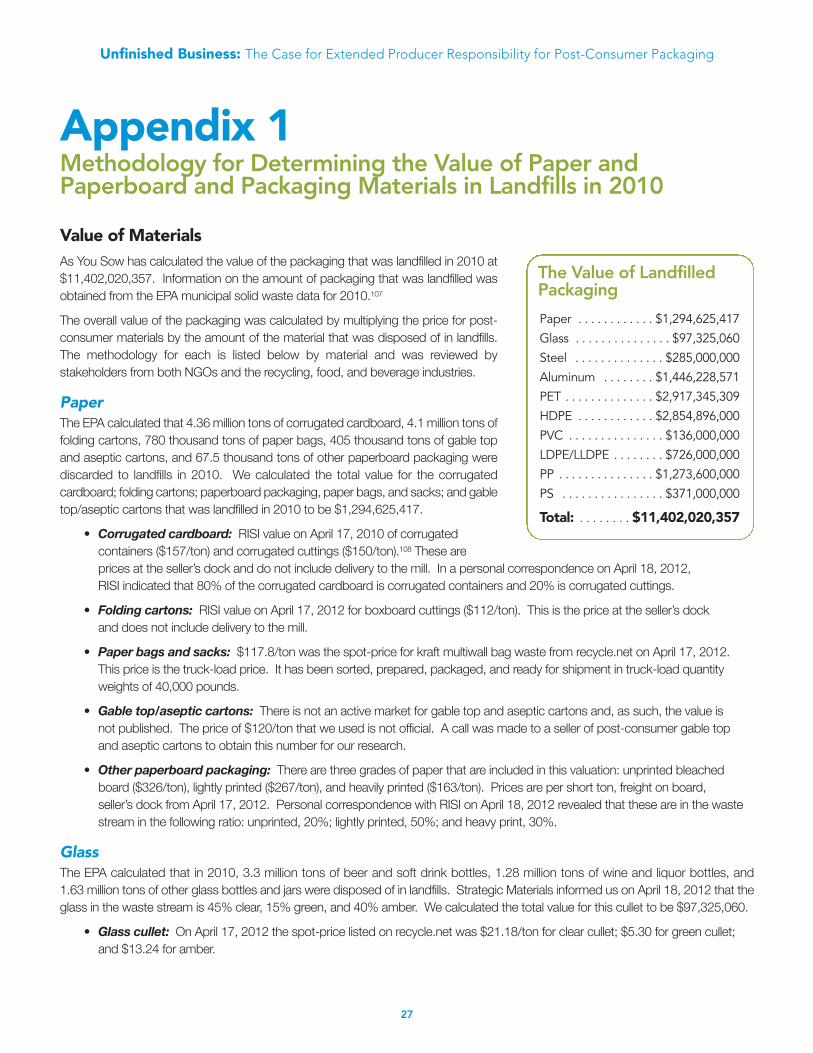
27
Unfinished Business: The Case for Extended Producer Responsibility for Post-Consumer Packaging
Appendix 1Methodology for Determining the Value of Paper andPaperboard and Packaging Materials in Landfills in 2010
Value of MaterialsAs You Sow has calculated the value of the packaging that was landfilled in 2010 at
$11,402,020,357. Information on the amount of packaging that was landfilled was
obtained from the EPA municipal solid waste data for 2010.107
The overall value of the packaging was calculated by multiplying the price for post-
consumer materials by the amount of the material that was disposed of in landfills.
The methodology for each is listed below by material and was reviewed by
stakeholders from both NGOs and the recycling, food, and beverage industries.
PaperThe EPA calculated that 4.36 million tons of corrugated cardboard, 4.1 million tons of
folding cartons, 780 thousand tons of paper bags, 405 thousand tons of gable top
and aseptic cartons, and 67.5 thousand tons of other paperboard packaging were
discarded to landfills in 2010. We calculated the total value for the corrugated
cardboard; folding cartons; paperboard packaging, paper bags, and sacks; and gable
top/aseptic cartons that was landfilled in 2010 to be $1,294,625,417.
• Corrugated cardboard: RISI value on April 17, 2010 of corrugated
containers ($157/ton) and corrugated cuttings ($150/ton).108 These are
prices at the seller’s dock and do not include delivery to the mill. In a personal correspondence on April 18, 2012,
RISI indicated that 80% of the corrugated cardboard is corrugated containers and 20% is corrugated cuttings.
• Folding cartons: RISI value on April 17, 2012 for boxboard cuttings ($112/ton). This is the price at the seller’s dock
and does not include delivery to the mill.
• Paper bags and sacks: $117.8/ton was the spot-price for kraft multiwall bag waste from recycle.net on April 17, 2012.
This price is the truck-load price. It has been sorted, prepared, packaged, and ready for shipment in truck-load quantity
weights of 40,000 pounds.
• Gable top/aseptic cartons: There is not an active market for gable top and aseptic cartons and, as such, the value is
not published. The price of $120/ton that we used is not official. A call was made to a seller of post-consumer gable top
and aseptic cartons to obtain this number for our research.
• Other paperboard packaging: There are three grades of paper that are included in this valuation: unprinted bleached
board ($326/ton), lightly printed ($267/ton), and heavily printed ($163/ton). Prices are per short ton, freight on board,
seller’s dock from April 17, 2012. Personal correspondence with RISI on April 18, 2012 revealed that these are in the waste
stream in the following ratio: unprinted, 20%; lightly printed, 50%; and heavy print, 30%.
GlassThe EPA calculated that in 2010, 3.3 million tons of beer and soft drink bottles, 1.28 million tons of wine and liquor bottles, and
1.63 million tons of other glass bottles and jars were disposed of in landfills. Strategic Materials informed us on April 18, 2012 that the
glass in the waste stream is 45% clear, 15% green, and 40% amber. We calculated the total value for this cullet to be $97,325,060.
• Glass cullet: On April 17, 2012 the spot-price listed on recycle.net was $21.18/ton for clear cullet; $5.30 for green cullet;
and $13.24 for amber.
The Value of LandfilledPackaging
Paper . . . . . . . . . . . . $1,294,625,417
Glass . . . . . . . . . . . . . . . $97,325,060
Steel . . . . . . . . . . . . . . $285,000,000
Aluminum . . . . . . . . $1,446,228,571
PET . . . . . . . . . . . . . . $2,917,345,309
HDPE . . . . . . . . . . . . $2,854,896,000
PVC . . . . . . . . . . . . . . . $136,000,000
LDPE/LLDPE . . . . . . . . $726,000,000
PP . . . . . . . . . . . . . . . $1,273,600,000
PS . . . . . . . . . . . . . . . . $371,000,000
Total: . . . . . . . . $11,402,020,357
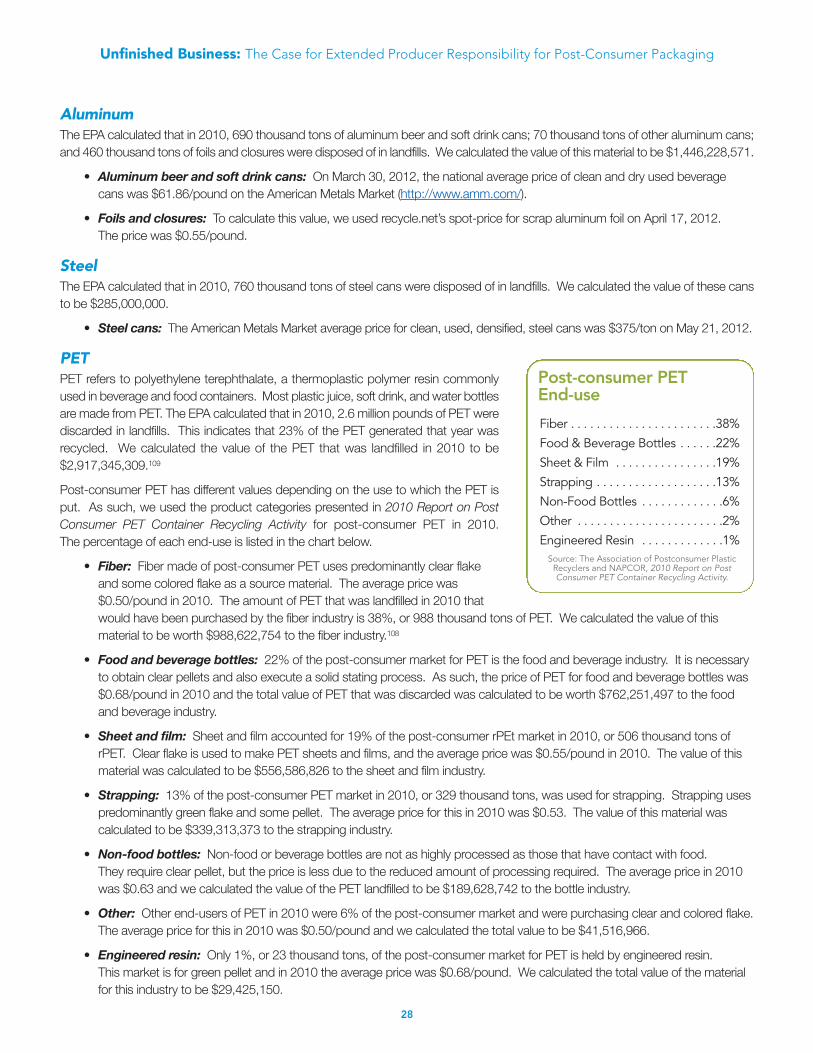
28
Unfinished Business: The Case for Extended Producer Responsibility for Post-Consumer Packaging
AluminumThe EPA calculated that in 2010, 690 thousand tons of aluminum beer and soft drink cans; 70 thousand tons of other aluminum cans;
and 460 thousand tons of foils and closures were disposed of in landfills. We calculated the value of this material to be $1,446,228,571.
• Aluminum beer and soft drink cans: On March 30, 2012, the national average price of clean and dry used beverage
cans was $61.86/pound on the American Metals Market (http://www.amm.com/).
• Foils and closures: To calculate this value, we used recycle.net’s spot-price for scrap aluminum foil on April 17, 2012.
The price was $0.55/pound.
SteelThe EPA calculated that in 2010, 760 thousand tons of steel cans were disposed of in landfills. We calculated the value of these cans
to be $285,000,000.
• Steel cans: The American Metals Market average price for clean, used, densified, steel cans was $375/ton on May 21, 2012.
PETPET refers to polyethylene terephthalate, a thermoplastic polymer resin commonly
used in beverage and food containers. Most plastic juice, soft drink, and water bottles
are made from PET. The EPA calculated that in 2010, 2.6 million pounds of PET were
discarded in landfills. This indicates that 23% of the PET generated that year was
recycled. We calculated the value of the PET that was landfilled in 2010 to be
$2,917,345,309.109
Post-consumer PET has different values depending on the use to which the PET is
put. As such, we used the product categories presented in 2010 Report on Post
Consumer PET Container Recycling Activity for post-consumer PET in 2010.
The percentage of each end-use is listed in the chart below.
• Fiber: Fiber made of post-consumer PET uses predominantly clear flake
and some colored flake as a source material. The average price was
$0.50/pound in 2010. The amount of PET that was landfilled in 2010 that
would have been purchased by the fiber industry is 38%, or 988 thousand tons of PET. We calculated the value of this
material to be worth $988,622,754 to the fiber industry.108
• Food and beverage bottles: 22% of the post-consumer market for PET is the food and beverage industry. It is necessary
to obtain clear pellets and also execute a solid stating process. As such, the price of PET for food and beverage bottles was
$0.68/pound in 2010 and the total value of PET that was discarded was calculated to be worth $762,251,497 to the food
and beverage industry.
• Sheet and film: Sheet and film accounted for 19% of the post-consumer rPEt market in 2010, or 506 thousand tons of
rPET. Clear flake is used to make PET sheets and films, and the average price was $0.55/pound in 2010. The value of this
material was calculated to be $556,586,826 to the sheet and film industry.
• Strapping: 13% of the post-consumer PET market in 2010, or 329 thousand tons, was used for strapping. Strapping uses
predominantly green flake and some pellet. The average price for this in 2010 was $0.53. The value of this material was
calculated to be $339,313,373 to the strapping industry.
• Non-food bottles: Non-food or beverage bottles are not as highly processed as those that have contact with food.
They require clear pellet, but the price is less due to the reduced amount of processing required. The average price in 2010
was $0.63 and we calculated the value of the PET landfilled to be $189,628,742 to the bottle industry.
• Other: Other end-users of PET in 2010 were 6% of the post-consumer market and were purchasing clear and colored flake.
The average price for this in 2010 was $0.50/pound and we calculated the total value to be $41,516,966.
• Engineered resin: Only 1%, or 23 thousand tons, of the post-consumer market for PET is held by engineered resin.
This market is for green pellet and in 2010 the average price was $0.68/pound. We calculated the total value of the material
for this industry to be $29,425,150.
Post-consumer PET End-use
Fiber . . . . . . . . . . . . . . . . . . . . . . .38%
Food & Beverage Bottles . . . . . .22%
Sheet & Film . . . . . . . . . . . . . . . .19%
Strapping . . . . . . . . . . . . . . . . . . .13%
Non-Food Bottles . . . . . . . . . . . . .6%
Other . . . . . . . . . . . . . . . . . . . . . . .2%
Engineered Resin . . . . . . . . . . . . .1%Source: The Association of Postconsumer Plastic Recyclers and NAPCOR, 2010 Report on Post Consumer PET Container Recycling Activity.

29
Unfinished Business: The Case for Extended Producer Responsibility for Post-Consumer Packaging
HDPEHDPE refers to high-density polyethylene, a polyethylene-based thermoplastic widely
used in consumer packaging for milk jugs and laundry detergent, as well as numerous
other applications. The EPA calculated that in 2010, 2.97 million pounds of HDPE
was discarded in landfills. The value of the HDPE that was landfilled in 2010 is
$2,854,896,000.109
Post-consumer HDPE has different values depending on the use to which the HDPE
is put. As such, we used the product categories presented in in 2010 Report on Post
Consumer PET Container Recycling Activity for post-consumer HDPE in 2010. The
percentage of each end-use is listed in the chart below.
• Non-food bottles: Non-food bottles made of HDPE use a natural pellet
as their source. The average price per pound is $0.62. We calculated that
the amount of HDPE that was landfilled in 2010 that could have been used
for non-food bottles has a value of $1,031,184,000.
• Pipe: Pipe uses regrind flake. The price per pound is $0.50. At this price,
we calculated the value of HDPE in the landfill that would be purchased to make pipe to be $739,200,000.
• Lumber and railroad ties: Lumber and railroad ties were the end use of 12% of the post-consumer HDPE in 2010.
Pellets are used to produce these products and the price of mixed-color pellets is $0.58/pound. We calculated the value
of the HDPE in landfills that, on a percentage basis, would be used in lumber and railroad ties to be $321,552,000.
• Automotive: Automotive predominantly uses reprocessed pellet HDPE foam for seats. The price is $0.45/pound and
we calculated the value of HDPE in landfills in 2010 to be worth $187,110,000 to the automotive industry.
• Sheet and film: Film and sheets use clear pellets that cost $0.67/pound. It is 7% of the post-consumer HDPE market and
we calculated its value lost in landfills in 2010 to be $216,678,000.
• Lawn and garden: 4% of post-consumer HDPE was used in lawn and garden applications. They use mixed pellets and
the average price is $0.58/pound. We calculated the value to this industry of HDPE that was lost in landfills in 2010 to be
$107,184,000.
• Pallets, crates, and buckets: 3% of the post-consumer HDPE was used for pallets, crates, and buckets in 2010.
They use mixed pellets and the average price is $0.58/pound. We calculated the value to this industry of HDPE that was
lost in landfills in 2010 to be $80,388,000.
• Bags and sacks: In addition to the above, there were 660 thousand tons of HDPE bags and sacks discarded to landfills
in 2010. The price for baled mixed color HDPE bags is $0.13/pound. We calculated the value lost to this industry to be
$171,600,000.
PVCPVC refers to polyvinyl chloride, a plastic widely used for heavier non-food packaging because of its durability and flexibility. The EPA
does not provide recovery information for PVC and calculates that all of the 400 thousand tons of PVC packaging generated in 2010
were disposed in landfills. Recycle.net provides a spot-price for baled post-consumer PVC of $340/ton. The price is for PVC that is
ready for shipment in truck-load weights of 40,000 pounds. At this price, we calculated that the 400 thousand tons of PVC packaging
that were landfilled have an unrecovered value of $136,000,000.
LDPE/LLDPELDPE refers to low-density polyethylene, a thermoplastic widely used for six-pack container rings and as outer coating of milk and juice
cartons and aseptic packaging. LLDPE refers to linear low-density polyethylene, which is commonly used to make plastics bags,
sheets, and stretch wrap. The EPA calculates that 1.960 million tons of the LDPE/LLDPE film generated in 2010 and all
1.1 million tons of other LDPE/LLDPE packaging were discarded in landfills. Baled LDPE scrap has a value of $0.33/pound.
We calculated the value of the LDPE that was lost in landfills in 2010 to be $726,000,000.
Post-consumer HDPE End-use
Non-Food Bottles . . . . . . . . . . . .36%
Pipe . . . . . . . . . . . . . . . . . . . . . . .32%
Lumber, Railroad Ties . . . . . . . . .12%
Automotive . . . . . . . . . . . . . . . . . .9%
Sheet & Film . . . . . . . . . . . . . . . . .7%
Lawn & Garden . . . . . . . . . . . . . . .4%
Pallets, Crates, Buckets . . . . . . . . .3%
Other . . . . . . . . . . . . . . . . . . . . . . .1%Source: The Association of Postconsumer Plastic Recyclers and NAPCOR, 2010 Report on Post Consumer PET Container Recycling Activity.
Based on 2.3 million tons of HDPE.
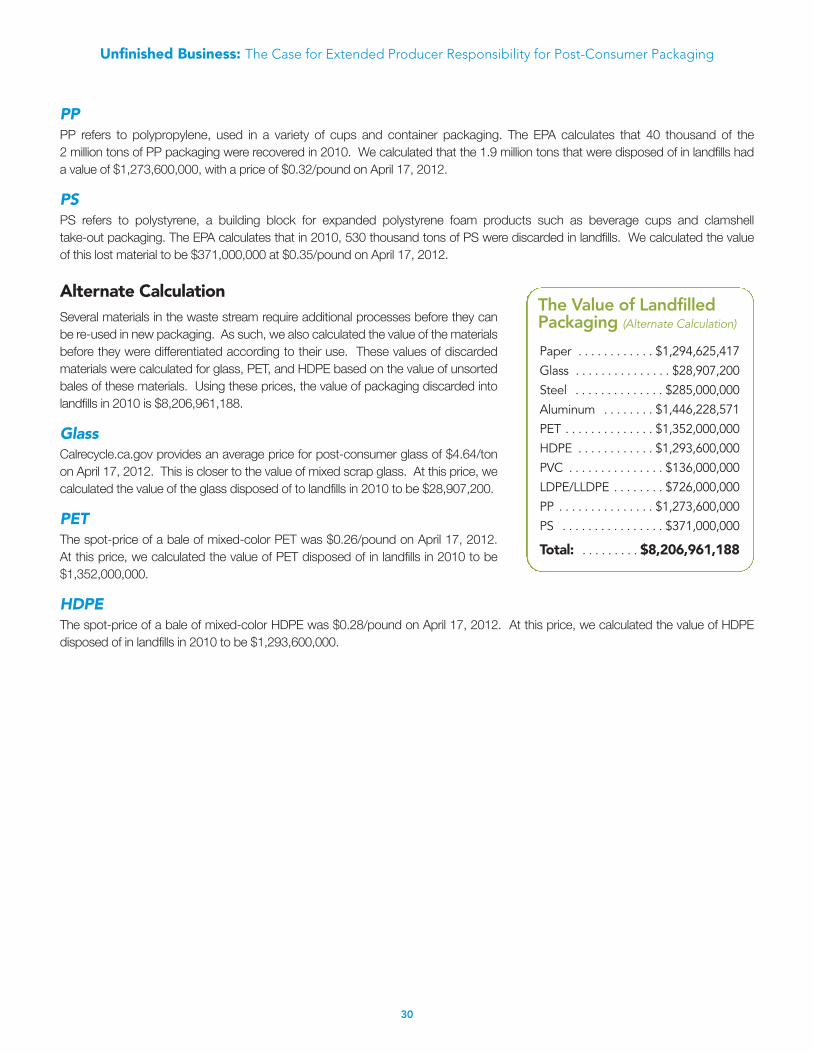
30
Unfinished Business: The Case for Extended Producer Responsibility for Post-Consumer Packaging
PPPP refers to polypropylene, used in a variety of cups and container packaging. The EPA calculates that 40 thousand of the
2 million tons of PP packaging were recovered in 2010. We calculated that the 1.9 million tons that were disposed of in landfills had
a value of $1,273,600,000, with a price of $0.32/pound on April 17, 2012.
PSPS refers to polystyrene, a building block for expanded polystyrene foam products such as beverage cups and clamshell
take-out packaging. The EPA calculates that in 2010, 530 thousand tons of PS were discarded in landfills. We calculated the value
of this lost material to be $371,000,000 at $0.35/pound on April 17, 2012.
Alternate CalculationSeveral materials in the waste stream require additional processes before they can
be re-used in new packaging. As such, we also calculated the value of the materials
before they were differentiated according to their use. These values of discarded
materials were calculated for glass, PET, and HDPE based on the value of unsorted
bales of these materials. Using these prices, the value of packaging discarded into
landfills in 2010 is $8,206,961,188.
GlassCalrecycle.ca.gov provides an average price for post-consumer glass of $4.64/ton
on April 17, 2012. This is closer to the value of mixed scrap glass. At this price, we
calculated the value of the glass disposed of to landfills in 2010 to be $28,907,200.
PETThe spot-price of a bale of mixed-color PET was $0.26/pound on April 17, 2012.
At this price, we calculated the value of PET disposed of in landfills in 2010 to be
$1,352,000,000.
HDPEThe spot-price of a bale of mixed-color HDPE was $0.28/pound on April 17, 2012. At this price, we calculated the value of HDPE
disposed of in landfills in 2010 to be $1,293,600,000.
The Value of LandfilledPackaging (Alternate Calculation)
Paper . . . . . . . . . . . . $1,294,625,417
Glass . . . . . . . . . . . . . . . $28,907,200
Steel . . . . . . . . . . . . . . $285,000,000
Aluminum . . . . . . . . $1,446,228,571
PET . . . . . . . . . . . . . . $1,352,000,000
HDPE . . . . . . . . . . . . $1,293,600,000
PVC . . . . . . . . . . . . . . . $136,000,000
LDPE/LLDPE . . . . . . . . $726,000,000
PP . . . . . . . . . . . . . . . $1,273,600,000
PS . . . . . . . . . . . . . . . . $371,000,000
Total: . . . . . . . . . $8,206,961,188

31
Unfinished Business: The Case for Extended Producer Responsibility for Post-Consumer Packaging
Endnotes1 United States Environmental Protection Agency, Municipal Solid Waste Generation, Recycling, and Disposal in the United States: Facts and Figures for
2010, 2010, http://www.epa.gov/osw/nonhaz/municipal/pubs/msw_2010_rev_factsheet.pdf. U.S. paper and paperboard products and packagingstatistics, the materials discussed in this paper, are derived from two metrics generated annually in the EPA’s municipal solid waste report: containers andpackaging, such as beverage and food bottles, cans, and containers; and paper and paperboard non-durable goods such as books, newspapers, officepaper, magazines, telephone directories, and mail. Since these materials are commonly collected together in U.S. curbside recycling systems, we havecombined the categories in discussing waste generated. 2010 figures indicate these combined materials total 109 million tons or 44% of the totalmunicipal waste stream. EPA data includes waste from residential, commercial, and institutional sources.
2 See Appendix 1.
3 World Wildlife Fund, Living Planet Report, 2012, http://wwf.panda.org/about_our_earth/all_publications/living_planet_report/.
4 PET refers to polyethylene terephthalate, a thermoplastic polymer resin commonly used in beverage and food containers. Most plastic juice, soft drink,and water bottles are made from PET.
5 David Perchard and Raphael Veit, End-of-Life Reporting and Beyond: A Challenge That Keeps Growing, 7.
6 Conrad MacKerron, “Moving Toward Sustainable Consumption in Electronics Design, Production and Recycling,” Utah Environmental Law Review, 31, no. 1 (2011), http://epubs.utah.edu/index.php/jlrel/article/view/471/339.
7 See Appendix 1.
8 World Resources Institute, Earthtrends, 2007, http://www.wri.org/project/earthtrends/.
9 John Collins Rudolf, “Is Peak Oil Behind Us?” New York Times, November 14, 2010, http://green.blogs.nytimes.com/2010/11/14/is-peak-oil-behind-us/?partner=rss&emc=rss.
10 Ellen MacArthur Foundation, Towards the Circular Economy: Economic and Business Rationale for an Accelerated Transition, 2012, 18,http://www.thecirculareconomy.org/.
11 World Business Council for Sustainable Development, Vision 2050, 2012, 8-9, http://www.wbcsd.org/vision2050.aspx.
12 Deloitte Touche Tohmatsu and the World Economic Forum, Redesigning Business Value: A Roadmap for Sustainable Consumption, 2010,http://www.weforum.org/reports/redesigning-business-value-roadmap-sustainable-consumption.
13 “California’s Estimated Statewide Diversion Rates Since 1989,” CalRecycle, last updated June 9, 2011,http://www.calrecycle.ca.gov/lgcentral/goalmeasure/disposalrate/Graphs/EstDiversion.htm. “Biannual Report of Beverage Container Sales,Returns, Redemption, and Recycling Rates,” CalRecycle, last updated May 9, 2012,http://www.calrecycle.ca.gov/bevcontainer/Rates/BiannualRpt/default.htm.
14 “State-Wide Waste Composition and Characterization Study,” Connecticut Department of Energy & Environmental Protection, last updated November 30,2011, http://www.ct.gov/dep/cwp/view.asp?A=2718&Q=439264.
15 “Zeroing Out Waste in the State Solid Waste Management Plan,” Citizen’s Environmental Coalition, http://www.cectoxic.org/ZeroWaste.html.
16 Grocery Manufacturers Association, Reducing Our Footprint, March 2011.
17 Samantha MacBride, Recycling Reconsidered, (MIT Press, 2012), 93.
18 Miriam Gordon, Designing Packaging Extended Producer Responsibility for Source Reduction and Recycling in the U.S., forthcoming.
19 Heather Rogers, Gone Tomorrow: The Hidden Life of Garbage, (New York: New Press, 2005), 136.
20 CM Consulting, Who Pays What, An Analysis of Beverage Container Recovery and Costs in Canada, 2010, 3.
21 Ben Boukley, “Refillable Bottles Are the Future, Says Petainer, Unveiling ‘Greenest Ever’ Bottle,” Beverage Daily, February 7, 2012,http://www.beveragedaily.com/Processing-Packaging/Refillable-bottles-are-the-future-says-Petainer-unveiling-greenest-ever-bottle.
22 MacBride, Recycling Reconsidered, 22.
23 “SC Johnson Sponsors 20th Anniversary Survey, Finding Shifts in Consumer Green Attitudes and Behaviors,” SC Johnson, last updated October 4,2011, http://www.scjohnson.com/en/press-room/press-releases/10-04-2011/SC-Johnson-Sponsors-20th-Anniversary-Survey-Finding-Shifts-
in-Consumer-Green-Attitudes-and-Behaviors.aspx. PRO EUROPE, “Producer Responsibility in Action,” 2010,http://www.zalais.lv/files/pro_europe_brochure_final_web_20101008.pdf.
24 United States Environmental Protection Agency, Municipal Solid Waste Generation, Recycling, and Disposal in the United States: Facts and Figures
for 2010. Container Recycling Institute, “CRI Comments on Natural Logic’s White Paper on EPR for Packaging,” March 2011, http://www.container-recycling.org/assets/pdfs/2011-CRIResponseToNLOnEPR.pdf. EPA figures estimate 34.9% of cumulative glass, aluminum,PET, and HDPE bottles are recovered based on a materials flow/mass balance approach. The Container Recycling Institute estimates the total at 29% byweight and 35% by unit.
25 Beth Schmitt, Director of Recycling Programs, Alcoa, e-mail message to author, February 15, 2011.
32
Unfinished Business: The Case for Extended Producer Responsibility for Post-Consumer Packaging
26 Coca-Cola agreed to recycle half of its bottles and cans in the U.S. by 2016; PepsiCo set an industry goal of 50% for all its U.S. bottles and cans by2018; Nestlé Waters agreed to a U.S. industry goal for PET plastic bottles of 60% by 2018.
27 For simplicity, this paper uses the data developed by U.S. EPA’s annual municipal solid waste report. The report uses the word “recovery” interchangeablyat times with “recycling.” It defines recovery as products removed from the waste stream for the purpose of recycling identified through reportedpurchases of post-consumer recovered materials, plus net exports of materials. The amount of recovered material actually made into new products varieswidely with different materials and collection and sorting methods so it is more accurate to consider “recovery” a collection rate. Further, some observersbelieve EPA’s method, based on materials flow methodology rather than reported landfilled weight, greatly under estimates the amount of wastegenerated, and overestimates recycling. An alternative approach relying on actual tonnages reported by Biocycle and the Earth Engineering Center atColumbia University estimated that U.S. solid waste generation in 2008 was 389 million tons, 35% higher than EPA’s 2008 estimates of 251 tons; andthat only 24% of materials were recycled vs. EPA’s estimates of 33% of waste recycled. See http://www.jgpress.com/archives/_free/002191.html.
28 United States Environmental Protection Agency, Municipal Solid Waste Generation, Recycling, and Disposal in the United States: Facts and Figures for
2010. EPA does not provide a combined recycling figure for containers and packaging and paper and paperboatd products. See endnote 1.
29 Container Recycling Institute, “CRI Comments on Natural Logic’s White Paper on EPR for Packaging,” 3.
30 John Kalkowski, “Is Paper’s Packaging Share a House of Cards?,” Packaging Digest, January 3, 2011, http://www.packagingdigest.com/article/512107-Is_paper_s_packaging_share_a_house_of_cards_.php.
31 Container Recycling Institute, “Container Deposit Legislation: Past, Present, Future,” 2009, slide 3,www.bottlebill.org/assets/ppt/BBsPastPresentFuture.ppt.
32 Marzia Sesini, “The Garbage Patch in the Oceans: The Problem and Possible Solutions” (masters thesis, Columbia University, 2011)http://www.seas.columbia.edu/earth/wtert/sofos/sesini_thesis.pdf.
33 Scientific and Technical Advisory Panel, Marine Debris as a Global Environmental Problem: Introducing a solutions based framework focused on plastic,November 2011, 3, http://www.thegef.org/gef/sites/thegef.org/files/publication/STAP%20MarineDebris%20-%20website.pdf.
34 “State and Local Laws,” PlasticBagLaws.org, http://plasticbaglaws.org/legislation/state-laws.
35 Container Recycling Institute, “CRI Comments on Natural Logic’s White Paper on EPR for Packaging,” 3.
36 For more information, see http://www.bottlebill.org.
37 Product stewardship is a term often used in relation to EPR. However, since it often refers to voluntary actions by companies, EPR is used throughoutthis document to be clear that we are advocating for a mandatory system because we believe voluntary systems, while beneficial, are ultimately noteffective at the scale needed for systemic change.
38 Perchard and Veit, End-of-Life Reporting and Beyond: A Challenge That Keeps Growing, 7.
39 “Extended Producer Responsibility,” Organization for Economic and Community Development,http://www.oecd.org/document/19/0,3746,en_2649_34281_35158227_1_1_1_1,00.html.
40 “Product Stewardship and Extended Producer Responsibility: Definitions and Principles,” Product Policy Institute,http://www.productpolicy.org/content/epr-principles. The definitions have been endorsed by more than 40 businesses, stewardship organizations,government agencies, and NGOs.
41 Electronics Take-Back Coalition, “Ten Lessons Learned from State E-Waste Laws,” 1, http://www.electronicstakeback.com/wp-content/uploads/Lessons-Learned-from-State-E-waste-laws.pdf.
42 Electronics Take-Back Coalition, “Ten Lessons Learned from State E-Waste Laws,” 2, 5.
43 Electronics Take-Back Coalition, “Ten Lessons Learned from State E-Waste Laws,” 6.
44 This chart does not include 10 states with container deposit laws; views vary as to whether these laws constitute EPR since some programs are operatedby states rather than producers and rely on unclaimed consumer deposits. As You Sow views deposit laws as a form of EPR in some cases.
45 Danielle Kurtzleben, “10 States with the Largest Budget Shortfalls,” US News, January 14, 2011, http://www.usnews.com/news/articles/2011/01/14/10-states-with-the-largest-budget-shortfalls.
46 Northwest Product Stewardship Council, Analyzing Product Stewardship Policies for Packaging and Printed Paper in Washington State, 2011, 3,http://www.productstewardship.net/PDFs/productsPackagingNWPSCReport2011.pdf.
47 Scott Mouw, “All in the Same Boat,” Resource Recycling, April 2011, 29.
48 Scott Mouw, “Running to Stand Still: Why the Current Municipal Recycling System Can’t Deliver the Goods,” Product Policy Institute blog, May 31, 2012,http://productpolicy.blogspot.com/2012/05/running-to-stand-still-why-current.html.
49 “National EPR Resolutions,” Product Policy Institute, http://www.productpolicy.org/content/national-epr-resolutions.
50 For more information, see http://www.productpolicy.org/content/councils.
51 Joshuah Stolaroff, “Products, Packaging and US Greenhouse Gas Emissions,” September 2009.
52 United States Environmental Protection Agency, Municipal Solid Waste Generation, Recycling, and Disposal in the United States: Facts and Figures for
2010, 47.
53 See Appendix 1.
33
Unfinished Business: The Case for Extended Producer Responsibility for Post-Consumer Packaging
54 Debbie Galante Block, “Recycle Pricing: rPET Market is Hot, Prices Are Soaring,” Plastics Technology, April 2012,http://www.ptonline.com/articles/recycle-pricing-rpet-market-is-hot-prices-are-soaring.
55 Mike Verespej, “Growing Demand From Packaging Boosts US PET Recycling Rate,” Plastics News, October 12, 2011,http://plasticsnews.com/headlines2.html?id=23365&q=mike+schedler.
56 John Dunham Associates, Economic Impact Study, U.S. Based Scrap Recycling Industry, 2011, http://www.isri.org/jobs.
57 Container Recycling Institute, Returning to Work, 2011, http://www.container-recycling.org/issues/jobs.htm.
58 BlueGreen Alliance, More Jobs, Less Pollution – Growing the Recycling Economy in the U.S., 2011http://www.bluegreenalliance.org/news/publications/more-jobs-less-pollution.
59 United States Environmental Protection Agency, “Final Report of the Dialogue on Sustainable Financing of Recycling of Packaging at the Municipal Level,”September 19, 2011, http://www.epa.gov/osw/conserve/smm/sfmr/packaging-report.pdf.
60 Amy Galland, Waste & Opportunity: U.S. Beverage Container Recycling Scorecard and Report 2011, 2011,http://www.asyousow.org/publications/2011/Waste&Opportunity2011_20110913.pdf. Nestlé Waters and New Belgium also supported depositsystems where unredeemed revenue is allocated only to container recovery programs. Despite its long-time opposition of deposit laws, Coca-Cola said itwas neutral on a voluntary system of deposits administered by associated industries.
61 United States Environmental Protection Agency, “Final Report of the Dialogue on Sustainable Financing of Recycling of Packaging at the Municipal Level.”
62 Ibid.
63 Conversation with Joan Pierce, Executive Director, Ameripen, April 20, 2012.
64 The author of this paper is also currently a member of the board.
65 Product Stewardship Institute, Product Stewardship and Packaging Conference Call Series, February 9, 2011.
66 “Extended Producer Responsibility,” Keep America Beautiful, http://www.kab.org/site/PageServer?pagename=EPR_statement&AddInterest=1001.
67 Mike Verespej, “Recycled Resin Demand Drives Support for EPR,” Plastics News, May 22, 2012,http://www.plasticsnews.com/headlines2.html?id=25508.
68 Product Stewardship Institute, Product Stewardship and Packaging Conference Call Series, February 15, 2011.
69 Recovery refers to both recycling of materials and incineration with energy recovery, a far more widely used option in the EU than in the U.S.
70 Derek Stephenson and Steward Edge, “Implementing EPR for Packaging” (Sustainable Packaging Coalition presentation, September 14, 2010).
71 Based on the EU hierarchy of EOL waste management options, “recovery” includes all diversion of waste from landfill, except for incineration withoutenergy recovery. Recycling and re-use are subsets of recovery, as is incineration with energy recovery.
72 “Generation and recycling of packaging waste (CSI 017) - Assessment published Mar 2010,” European Environment Agency, March 2010,http://www.eea.europa.eu/data-and-maps/indicators/generation-and-recycling-of-packaging-waste/generation-and-recycling-of-packaging-
2#toc-0.
73 Significant portions of the description and analysis of systems in Germany, Belgium, and Canada were provided by Miriam Gordon, California Director,Clean Water Action, and will be discussed in more detail in her forthcoming publication Designing Packaging Extended Producer Responsibility for Source
Reduction and Recycling in the U.S.
74 Argus et al., “European Packaging Waste Management Systems- Final Report,” February 2001, 55.
75 Daniel Imhoff, Paper or Plastic: Searching for Solutions to an Overpackaged World, (Sierra Club Books, 2005), 47.
76 Clean Production Action, “Summary of Germany's packaging take-back law,” September 2003, 7,http://www.cleanproduction.org/library/EPR_dvd/DualesSystemDeutsch_REVISEDoverview.pdf.
77 Ibid.
78 GreenBlue, Closing the Loop: Road Map for Effective Material Value Recovery, 2011, 28.
79 Joachim Quoden, Managing Director, PRO EUROPE, e-mail message to author, June 7, 2012.
80 Ibid.
81 Oliver Beck, “Experience with the Introduction of a Mandatory Deposit System in Germany,” (presented at Packaging Waste Workshop, Budapest,February 24, 2009), http://www.kvvm.hu/cimg/documents/Oliver_Beck_German_Deposit_System.pdf.
82 Karen Palmer and Margaret Walls, Resources for the Future, “The Product Stewardship Movement: Understanding Costs, Effects, and the Role of Policy,”November 2002, http://www.calpsc.org/assets/solution/rff-EPR%20movement-prodsteward.pdf.
83 Fost Plus, Annual Report 2010.
84 GreenBlue, Closing the Loop: Road Map for Effective Material Value Recovery, 21.
85 Ibid.
34
Unfinished Business: The Case for Extended Producer Responsibility for Post-Consumer Packaging
86 Lisa Chacon et al., Product Stewardship & Extended Producer Responsibility: Towards a Comprehensive Packaging Recycling Strategy for the US,October 2010, 38.
87 “Packaging Waste Declining Rapidly,” Europen press release, June 21, 2011.
88 “Environment: Getting gold from garbage – how some Member States are making waste a resource,” European Commission press release , April 12,2012.
89 PRO EUROPE, “Effective Packaging- Effective Prevention,” 2005, http://www.zalais.lv/files/packaging_prevention.pdf.
90 European Commission, “Report for the Commission to the European Parliament, The Council, The European Economic and Social Committee and theCommittee of the Regions on the Thematic Strategy on the Prevention and Recycling of Waste,” SEC 70, 2011, 7.
91 European Commission, “Use of Economic instruments and Waste Management Performances,” April 10, 2012http://ec.europa.eu/environment/waste/pdf/final_report_10042012.pdf
92 Ibid., 8. See also EIMPack – Economic Impact of the Packaging and Packaging Waste Directive, June 2010, 12-13.
93 Northwest Product Stewardship Council, Product Stewardship in Canada: Legislative Framework of Provincial Programs, October 2009, 2.
94 Product Policy Institute, “Evolution of the Ontario Blue Box Program: Transitioning from Government to Producer Responsibility,” July 15, 2010,http://www.productstewardship.us/associations/6596/files/OntarioBlueBoxEvolution-rev.pdf.
95 Clarissa Morawski, “Recovery Questions,” Resource Recycling, February 2011. http://www.cmconsultinginc.com/wp-content/uploads/2011/03/Bev_RecoveryQuestion-Feb20111.pdf.
96 Guy Perry, Steward Edge (presentation to Sustainable Packaging Forum, September 21, 2011).
97 Lisa Chacon et al., Product Stewardship & Extended Producer Responsibility: Towards a Comprehensive Packaging Recycling Strategy for the US, 58.
98 PRO EUROPE, “Effective Packaging- Effective Prevention.”
99 Rhoda Miel, “Canadian grocery chains to require clamshell suppliers to shift to PET,” Plastics News, June 24, 2011.
100 Dr. Jeffery Morris, “Environmental Life Cycle Assessment of Waste Management Strategies with a Zero Waste Objective Study of the Solid WasteManagement System in Metro Vancouver,” British Columbia, June 2009.
101 David Ciplet, “An Industry Blowing Smoke: 10 Reasons Why Gasification, Pyrolysis & Plasma Incineration are Not ‘Green Solutions,’” June 2009,http://www.no-burn.org/downloads/BlowingSmokeReport.pdf.
102 Hsien H. Khoo, “Life cycle impact assessment of various waste conversion technologies,” Waste Management 29, no. 6 (2009): 1892-1900.
103 “Industry Trade Organization Perspectives on Packaging EPR in Canada and Europe,” Product Stewardship Institute Conference Call Series, February 15,2011.
104 Scientific and Technical Advisory Panel, Marine Debris as a Global Environmental Problem: Introducing a solutions based framework focused on plastic,15.
105 Samantha MacBride, Recycling Reconsidered, 181.
106 Samantha MacBride, Recycling Reconsidered, 262.
107 United States Environmental Protection Agency, Municipal Solid Waste Generation, Recycling, and Disposal in the United States Tables and Figures
for 2010.
108 RISI is a source of information for the forest products industry (http://www.risiinfo.com/).
109 Prices provided by National Association of PET Container Resources (NAPCOR) on May 4, 2012.
110 Ibid.
111 Prices provided by Telco, Maine Plastics, and Trex on May 4, 4, and 8, 2012, respectively.

© 2012 As You Sow
As You SowTM
311 California Street, Suite 650
San Francisco, CA 94104
Telephone: 415-391-3212
www.asyousow.org


