
United Rentals, Inc.
100 First Stamford Place
Suite 700
Stamford, CT 06902
Telephone: 203 622 3131
Fax: 203 622 6080
unitedrentals.com
United Rentals Announces Second Quarter 2017 Results
Raises 2017 Guidance
STAMFORD, Conn. – July 19, 2017 – United Rentals, Inc. (NYSE: URI) today announced financial
results for the second quarter 2017. Total revenue was $1.597 billion and rental revenue was $1.367
billion for the second quarter, compared with $1.421 billion and $1.204 billion, respectively, for the same
period last year. On a GAAP basis, the company reported second quarter net income of $141 million, or
$1.65 per diluted share, compared with $134 million, or $1.52 per diluted share, for the same period last
year.
Adjusted EPS1 for the quarter was $2.37 per diluted share, compared with $2.06 per diluted share for the
same period last year. Adjusted EBITDA1 was $747 million and adjusted EBITDA margin1 was 46.8%,
reflecting an increase of $68 million and a decrease of 100 basis points, respectively, from the same
period last year.
Second Quarter 2017 Highlights
• Rental revenue2 increased 13.5% year-over-year. Within rental revenue, owned equipment rental
revenue increased 13.5%, reflecting an increase of 17.4% in the volume of equipment on rent,
partially offset by a 1.2% decrease in rental rates.
• Pro forma3 rental revenue increased 6.2% year-over-year, reflecting growth of 6.6% in the volume
of equipment on rent, partially offset by a 0.4% decline in rental rates.
• Time utilization increased 190 basis points year-over-year to 69.4%, a second quarter record, with
each month in the quarter also establishing a new monthly record. On a pro forma basis, time
utilization increased 210 basis points year-over-year.
• The company’s Trench, Power and Pump specialty segment's rental revenue increased by 18.5%
year-over-year, primarily on a same store basis, while the segment’s rental gross margin
improved by 250 basis points to 49.6%.
• The company generated $133 million of proceeds from used equipment sales at a GAAP gross
margin of 39.1% and an adjusted gross margin of 52.6%, compared with $134 million at a GAAP
gross margin of 41.0% and an adjusted gross margin of 47.8% for the same period last year. The
year-over-year decrease in GAAP gross margin and increase in adjusted gross margin primarily
reflected the impact of sales of NES equipment.4
_______________
1. Adjusted EPS (earnings per share) and adjusted EBITDA (earnings before interest, taxes, depreciation and amortization) are non-
GAAP measures that exclude the impact of the items noted in the tables below. See the tables below for amounts and reconciliations
to the most comparable GAAP measures. Adjusted EBITDA margin represents adjusted EBITDA divided by total revenue.
2. Rental revenue includes owned equipment rental revenue, re-rent revenue and ancillary revenue.
3. Pro forma results reflect the combination of United Rentals and NES Rentals ("NES") for all periods presented. The NES acquisition
closed on April 3, 2017.
4. Used equipment sales adjusted gross margin excludes the impact of the fair value mark-up of acquired RSC and NES fleet that was
sold.

CEO Comments
Michael Kneeland, chief executive officer of United Rentals, said, "The broad demand we saw early this
year continued throughout the second quarter as we entered our busy season. This was reflected in our
strong year-over-year performance, with volume up 6.6% on a pro forma basis, record second quarter
time utilization, and an improved rate trend across our business. The NES integration and Project XL are
both well underway and on track."
Kneeland continued, "We remain encouraged by the level of customer activity and the industry’s ongoing
absorption of fleet. Given our visibility into the balance of 2017, we’ve increased our full-year guidance
for total revenue, adjusted EBITDA, capex and free cash flow. Our focus remains on balancing growth
with margins, free cash flow and returns to maximize our long-term value."
Six Months 2017 Highlights
• Rental revenue increased 9.1% year-over-year. Within rental revenue, owned equipment rental
revenue increased 8.8% year-over-year, reflecting an increase of 12.4% in the volume of
equipment on rent, partially offset by a 1.2% decrease in rental rates.
• Pro forma rental revenue increased 5.1% year-over-year, reflecting growth of 6.5% in the volume
of equipment on rent, partially offset by a 0.9% decline in rental rates.
• Time utilization increased 200 basis points year-over-year to 67.8%. On a pro forma basis, time
utilization increased 190 basis points year-over-year to 67.5%.
• The company’s Trench, Power and Pump specialty segment's rental revenue increased by 17.7%
year-over-year, primarily on a same store basis, while the segment’s rental gross margin
improved by 250 basis points to 47.2%.
• The company generated $239 million of proceeds from used equipment sales at a GAAP gross
margin of 41.0% and an adjusted gross margin of 51.9%, compared with $249 million at a GAAP
gross margin of 41.0% and an adjusted gross margin of 48.2% for the same period last year. The
year-over-year increase in adjusted gross margin primarily reflected the impact of sales of NES
equipment.
• The company generated $1.337 billion of net cash provided by operating activities and $614
million of free cash flow5, compared with $1.247 billion and $792 million, respectively, for the
same period last year. Net rental capital expenditures were $674 million, compared with $473
million for the same period last year.
2017 Outlook
The company has issued the following new full-year guidance:
Prior Outlook Current Outlook
Total revenue $6.05 billion to $6.25 billion $6.25 billion to $6.40 billion
Adjusted EBITDA6 $2.835 billion to $2.985 billion $2.950 billion to $3.025 billion
Net rental capital expenditures after gross purchases
$925 million to $1.075 billion, after gross purchases of $1.45 billion to $1.55 billion
$1.05 billion to $1.15 billion, after gross purchases of $1.55 billion to $1.65 billion
Net cash provided by operating activities $1.85 billion to $2.05 billion $1.975 billion to $2.175 billion
Free cash flow (excluding the impact of merger and restructuring related costs)
$800 million to $900 million $825 million to $925 million
______________
5. Free cash flow is a non-GAAP measure. See the table below for amounts and a reconciliation to the most comparable GAAP
measure.
6. Information reconciling forward-looking adjusted EBITDA to the comparable GAAP financial measures is unavailable to the company
without unreasonable effort, as discussed below.

Free Cash Flow and Fleet Size
For the first six months of 2017, net cash provided by operating activities was $1.337 billion, and free
cash flow was $614 million after total rental and non-rental gross capital expenditures of $968 million. For
the first six months of 2016, net cash provided by operating activities was $1.247 billion, and free cash
flow was $792 million after total rental and non-rental gross capital expenditures of $764 million. Free
cash flow for the first six months of 2017 and 2016 included aggregate merger and restructuring related
payments of $31 million and $6 million, respectively.
The size of the rental fleet was $10.27 billion of original equipment cost ("OEC") at June 30, 2017,
compared with $8.99 billion at December 31, 2016. The age of the rental fleet was 46.7 months on an
OEC-weighted basis at June 30, 2017, compared with 45.2 months at December 31, 2016.
Return on Invested Capital (ROIC)
Return on invested capital was 8.4% for the 12 months ended June 30, 2017, a decrease of 10 basis
points from the 12 months ended June 30, 2016. The company’s ROIC metric uses after-tax operating
income for the trailing 12 months divided by average stockholders’ equity, debt and deferred taxes, net of
average cash. To mitigate the volatility related to fluctuations in the company’s tax rate from period to
period, the federal statutory tax rate of 35% is used to calculate after-tax operating income. When
adjusting the denominator to also exclude average goodwill, ROIC was 11.3% for the 12 months ended
June 30, 2017, a decrease of 20 basis points from the 12 months ended June 30, 2016.
Conference Call
United Rentals will hold a conference call tomorrow, Thursday, July 20, 2017, at 11:00 a.m. Eastern Time.
The conference call number is 855-458-4217 (international: 574-990-3605). The conference call will also
be available live by audio webcast at unitedrentals.com, where it will be archived until the next earnings
call. The replay number for the call is 404-537-3406, passcode is 40851747.
Non-GAAP Measures
Free cash flow, earnings before interest, taxes, depreciation and amortization (EBITDA), adjusted
EBITDA, and adjusted earnings per share (adjusted EPS) are non-GAAP financial measures as defined
under the rules of the SEC. Free cash flow represents net cash provided by operating activities, less
purchases of rental and non-rental equipment plus proceeds from sales of rental and non-rental
equipment and excess tax benefits from share-based payment arrangements. EBITDA represents the
sum of net income, provision for income taxes, interest expense, net, depreciation of rental equipment
and non-rental depreciation and amortization. Adjusted EBITDA represents EBITDA plus the sum of the
merger related costs, restructuring charge, stock compensation expense, net, and the impact of the fair
value mark-up of acquired RSC and NES fleet. Adjusted EPS represents EPS plus the sum of the merger
related costs, restructuring charge, the impact on depreciation related to acquired RSC and NES fleet
and property and equipment, the impact of the fair value mark-up of acquired RSC and NES fleet, the
impact on interest expense related to fair value adjustment of acquired RSC indebtedness, merger
related intangible asset amortization, asset impairment charge and the loss on repurchase/redemption of
debt securities and amendment of ABL facility. The company believes that: (i) free cash flow provides
useful additional information concerning cash flow available to meet future debt service obligations and
working capital requirements; (ii) EBITDA and adjusted EBITDA provide useful information about
operating performance and period-over-period growth, and help investors gain an understanding of the
factors and trends affecting our ongoing cash earnings, from which capital investments are made and
debt is serviced; and (iii) adjusted EPS provides useful information concerning future profitability.
However, none of these measures should be considered as alternatives to net income, cash flows from
operating activities or earnings per share under GAAP as indicators of operating performance or liquidity.

Information reconciling forward-looking adjusted EBITDA to GAAP financial measures is unavailable to
the company without unreasonable effort. The company is not able to provide reconciliations of adjusted
EBITDA to GAAP financial measures because certain items required for such reconciliations are outside
of the company’s control and/or cannot be reasonably predicted, such as the provision for income taxes.
Preparation of such reconciliations would require a forward-looking balance sheet, statement of income
and statement of cash flow, prepared in accordance with GAAP, and such forward-looking financial
statements are unavailable to the company without unreasonable effort. The company provides a range
for its adjusted EBITDA forecast that it believes will be achieved, however it cannot accurately predict all
the components of the adjusted EBITDA calculation. The company provides an adjusted EBITDA
forecast because it believes that adjusted EBITDA, when viewed with the company’s results under
GAAP, provides useful information for the reasons noted above. However, adjusted EBITDA is not a
measure of financial performance or liquidity under GAAP and, accordingly, should not be considered as
an alternative to net income or cash flow from operating activities as an indicator of operating
performance or liquidity.
About United Rentals
United Rentals, Inc. is the largest equipment rental company in the world. The company has an
integrated network of 960 rental locations in 49 states and every Canadian province. The company’s
approximately 13,700 employees serve construction and industrial customers, utilities, municipalities,
homeowners and others. The company offers approximately 3,300 classes of equipment for rent with a
total original cost of $10.3 billion. United Rentals is a member of the Standard & Poor’s 500 Index, the
Barron’s 400 Index and the Russell 3000 Index® and is headquartered in Stamford, Conn. Additional
information about United Rentals is available at unitedrentals.com.
Forward-Looking Statements
This press release contains forward-looking statements within the meaning of Section 21E of the Securities
Exchange Act of 1934, as amended, and the Private Securities Litigation Reform Act of 1995, known as the
PSLRA. These statements can generally be identified by the use of forward-looking terminology such as “believe,”
“expect,” “may,” “will,” “should,” “seek,” “on-track,” “plan,” “project,” “forecast,” “intend” or “anticipate,” or
the negative thereof or comparable terminology, or by discussions of vision, strategy or outlook. These statements
are based on current plans, estimates and projections, and, therefore, you should not place undue reliance on
them. No forward-looking statement can be guaranteed, and actual results may differ materially from those
projected. Factors that could cause actual results to differ materially from those projected include, but are not
limited to, the following: (1) the challenges associated with past or future acquisitions, including NES, such as
undiscovered liabilities, costs, integration issues and/or the inability to achieve the cost and revenue synergies
expected; (2) a slowdown in North American construction and industrial activities, which occurred during the 2008-
2010 economic downturn and significantly affected our revenues and profitability, could reduce demand for
equipment and prices that we can charge; (3) our significant indebtedness, which requires us to use a substantial
portion of our cash flow for debt service and can constrain our flexibility in responding to unanticipated or adverse
business conditions; (4) the inability to refinance our indebtedness at terms that are favorable to us, or at all; (5) the
incurrence of additional debt, which could exacerbate the risks associated with our current level of indebtedness;
(6) noncompliance with covenants in our debt agreements, which could result in termination of our credit facilities
and acceleration of outstanding borrowings; (7) restrictive covenants and amount of borrowings permitted under our
debt agreements, which could limit our financial and operational flexibility; (8) an overcapacity of fleet in the
equipment rental industry; (9) a decrease in levels of infrastructure spending, including lower than expected
government funding for construction projects; (10) fluctuations in the price of our common stock and inability to
complete stock repurchases in the time frame and/or on the terms anticipated; (11) our rates and time utilization
being less than anticipated; (12) our inability to manage credit risk adequately or to collect on contracts with
customers; (13) our inability to access the capital that our business or growth plans may require; (14) the incurrence
of impairment charges; (15) trends in oil and natural gas could adversely affect demand for our services and
products; (16) our dependence on distributions from subsidiaries as a result of our holding company structure and
the fact that such distributions could be limited by contractual or legal restrictions; (17) an increase in our loss
reserves to address business operations or other claims and any claims that exceed our established levels of
reserves; (18) the incurrence of additional costs and expenses (including indemnification obligations) in connection
with litigation, regulatory or investigatory matters; (19) the outcome or other potential consequences of litigation and
other claims and regulatory matters relating to our business, including certain claims that our insurance may not
cover; (20) the effect that certain provisions in our charter and certain debt agreements and our significant
indebtedness may have of making more difficult or otherwise discouraging, delaying or deterring a takeover or other
change of control of us; (21) management turnover and inability to attract and retain key personnel; (22) our costs
being more than anticipated and/or the inability to realize expected savings in the amounts or time frames planned;
(23) our dependence on key suppliers to obtain equipment and other supplies for our business on acceptable
terms; (24) our inability to sell our new or used fleet in the amounts, or at the prices, we expect; (25) competition
from existing and new competitors; (26) security breaches, cybersecurity attacks and other significant disruptions in
our information technology systems; (27) the costs of complying with environmental, safety and foreign laws and
regulations, as well as other risks associated with non-U.S. operations, including currency exchange risk; (28) labor
difficulties and labor-based legislation affecting our labor relations and operations generally; and (29) increases in
our maintenance and replacement costs and/or decreases in the residual value of our equipment. For a more
complete description of these and other possible risks and uncertainties, please refer to our Annual Report on Form
10-K for the year ended December 31, 2016, as well as to our subsequent filings with the SEC. The forward-looking
statements contained herein speak only as of the date hereof, and we make no commitment to update or publicly
release any revisions to forward-looking statements in order to reflect new information or subsequent events,
circumstances or changes in expectations.
# # #
Contact:
Ted Grace
(203) 618-7122
Cell: (203) 399-8951
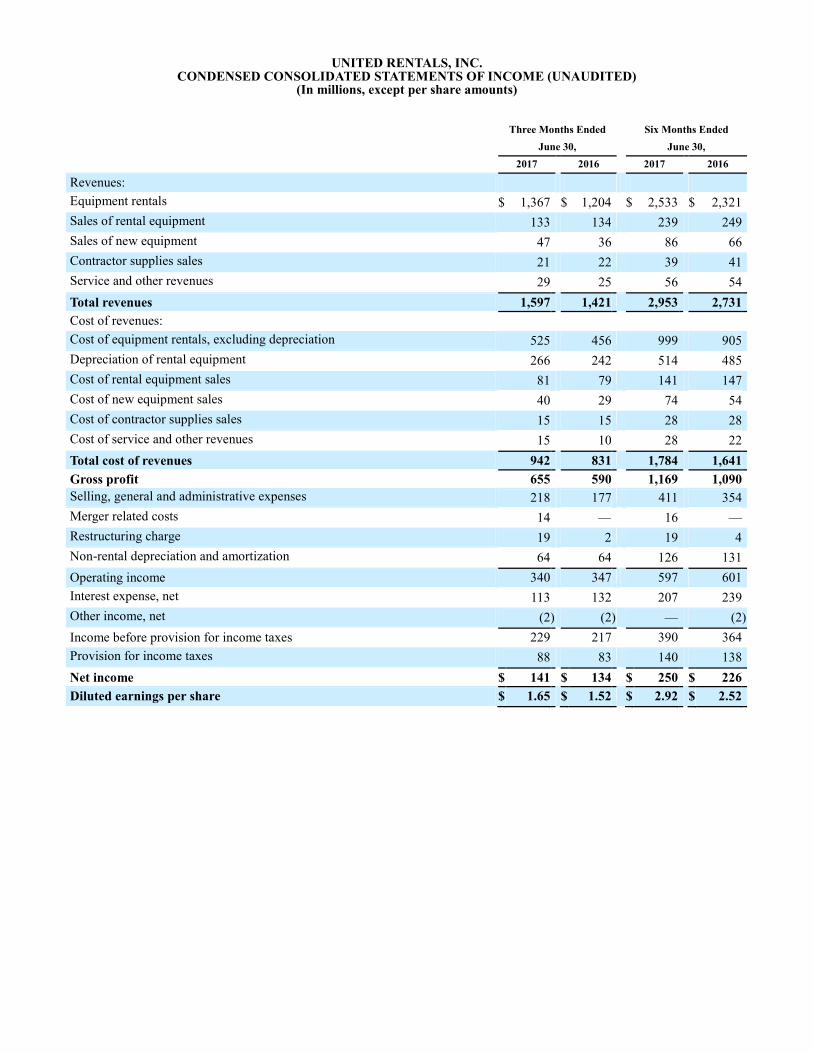
UNITED RENTALS, INC. CONDENSED CONSOLIDATED STATEMENTS OF INCOME (UNAUDITED)
(In millions, except per share amounts)
Three Months Ended Six Months Ended
June 30, June 30,
2017 2016 2017 2016
Revenues:
Equipment rentals $ 1,367 $ 1,204 $ 2,533 $ 2,321
Sales of rental equipment 133 134 239 249
Sales of new equipment 47 36 86 66
Contractor supplies sales 21 22 39 41
Service and other revenues 29 25 56 54
Total revenues 1,597 1,421 2,953 2,731
Cost of revenues:
Cost of equipment rentals, excluding depreciation 525 456 999 905
Depreciation of rental equipment 266 242 514 485
Cost of rental equipment sales 81 79 141 147
Cost of new equipment sales 40 29 74 54
Cost of contractor supplies sales 15 15 28 28
Cost of service and other revenues 15 10 28 22
Total cost of revenues 942 831 1,784 1,641
Gross profit 655 590 1,169 1,090
Selling, general and administrative expenses 218 177 411 354
Merger related costs 14 — 16 —
Restructuring charge 19 2 19 4
Non-rental depreciation and amortization 64 64 126 131
Operating income 340 347 597 601
Interest expense, net 113 132 207 239
Other income, net (2 ) (2 ) — (2 )
Income before provision for income taxes 229 217 390 364
Provision for income taxes 88 83 140 138
Net income $ 141 $ 134 $ 250 $ 226
Diluted earnings per share $ 1.65 $ 1.52 $ 2.92 $ 2.52

UNITED RENTALS, INC. CONDENSED CONSOLIDATED BALANCE SHEETS (UNAUDITED)
(In millions)
June 30, 2017 December 31, 2016
ASSETS
Cash and cash equivalents $ 338 $ 312
Accounts receivable, net 990 920
Inventory 78 68
Prepaid expenses and other assets 77 61
Total current assets 1,483 1,361
Rental equipment, net 7,076 6,189
Property and equipment, net 449 430
Goodwill 3,468 3,260
Other intangible assets, net 798 742
Other long-term assets 10 6
Total assets $ 13,284 $ 11,988
LIABILITIES AND STOCKHOLDERS’ EQUITY
Short-term debt and current maturities of long-term debt $ 644 $ 597
Accounts payable 692 243
Accrued expenses and other liabilities 408 344
Total current liabilities 1,744 1,184
Long-term debt 7,571 7,193
Deferred taxes 1,952 1,896
Other long-term liabilities 69 67
Total liabilities 11,336 10,340
Common stock 1 1
Additional paid-in capital 2,300 2,288
Retained earnings 1,909 1,654
Treasury stock (2,077 ) (2,077 )
Accumulated other comprehensive loss (185 ) (218 )
Total stockholders’ equity 1,948 1,648
Total liabilities and stockholders’ equity $ 13,284 $ 11,988

UNITED RENTALS, INC.
CONDENSED CONSOLIDATED STATEMENTS OF CASH FLOWS (UNAUDITED)
(In millions)
Three Months Ended Six Months Ended
June 30, June 30,
2017 2016 2017 2016
Cash Flows From Operating Activities:
Net income $ 141 $ 134 $ 250 $ 226
Adjustments to reconcile net income to net cash provided by operating activities:
Depreciation and amortization 330 306 640 616
Amortization of deferred financing costs and original issue discounts 2 2 4 4
Gain on sales of rental equipment (52 ) (55 ) (98 ) (102 )
Gain on sales of non-rental equipment (2 ) — (3 ) (1 )
Stock compensation expense, net 24 13 40 22
Merger related costs 14 — 16 —
Restructuring charge 19 2 19 4
Loss on repurchase/redemption of debt securities and amendment of ABL facility 12 26 12 26
Excess tax benefits from share-based payment arrangements (1) — (26 ) — (53 )
Increase in deferred taxes 30 44 40 69
Changes in operating assets and liabilities:
(Increase) decrease in accounts receivable (81 ) (35 ) (16 ) 68
Decrease (increase) in inventory 1 2 (5 ) (2 )
(Increase) decrease in prepaid expenses and other assets (16 ) — (7 ) 64
Increase in accounts payable 290 281 429 337
Increase (decrease) in accrued expenses and other liabilities 2 (51 ) 16 (31 )
Net cash provided by operating activities 714 643 1,337 1,247
Cash Flows From Investing Activities:
Purchases of rental equipment (694 ) (622 ) (913 ) (722 )
Purchases of non-rental equipment (33 ) (19 ) (55 ) (42 )
Proceeds from sales of rental equipment 133 134 239 249
Proceeds from sales of non-rental equipment 4 3 6 7
Purchases of other companies, net of cash acquired (965 ) (1 ) (965 ) (14 )
Purchases of investments (3 ) — (4 ) —
Net cash used in investing activities (1,558 ) (505 ) (1,692 ) (522 )
Cash Flows From Financing Activities:
Proceeds from debt 2,441 3,050 3,943 3,964
Payments of debt (1,604 ) (2,983 ) (3,543 ) (4,320 )
Payments of financing costs — (12 ) (7 ) (12 )
Proceeds from the exercise of common stock options — — 1 —
Common stock repurchased (2) (1 ) (172 ) (24 ) (336 )
Excess tax benefits from share-based payment arrangements (1) — 26 — 53
Net cash provided by (used in) financing activities 836 (91 ) 370 (651 )
Effect of foreign exchange rates 9 (1 ) 11 12
Net increase in cash and cash equivalents 1 46 26 86
Cash and cash equivalents at beginning of period 337 219 312 179
Cash and cash equivalents at end of period $ 338 $ 265 $ 338 $ 265
Supplemental disclosure of cash flow information:
Cash paid for income taxes, net $ 58 $ 56 $ 59 $ 3
Cash paid for interest 87 150 177 219
(1) In 2017, we adopted accounting guidance on share-based payments, as a result of which the excess tax benefits from
share-based payment arrangements for 2017 are presented as a component of net cash provided by operating activities
(within net income), while, for 2016, they are presented as a component of net cash used in financing activities.

UNITED RENTALS, INC.
CONDENSED CONSOLIDATED STATEMENTS OF CASH FLOWS (UNAUDITED) (continued)
(2) The 2017 repurchases reflect shares withheld to satisfy tax withholding obligations upon the vesting of restricted stock
unit awards, and were not acquired pursuant to any repurchase plan or program. We have an open $1 billion share
repurchase program, under which we have purchased $627 million to date, that we paused as we evaluated a number of
potential acquisition opportunities, including the NES acquisition that closed on April 3, 2017. We intend to complete the
share repurchase program; however, we will re-evaluate the decision to do so as we integrate NES and assess other
potential uses of capital. The 2016 repurchases included i) shares repurchased pursuant to the $1 billion share repurchase
program and ii) shares withheld to satisfy tax withholding obligations upon the vesting of restricted stock unit awards.

UNITED RENTALS, INC. SEGMENT PERFORMANCE
($ in millions)
Three Months Ended Six Months Ended
June 30, June 30,
2017 2016 Change 2017 2016 Change
General Rentals
Reportable segment equipment rentals revenue $1,143 $1,015 12.6% $2,120 $1,970 7.6%
Reportable segment equipment rentals gross profit 465 417 11.5% 825 774 6.6%
Reportable segment equipment rentals gross margin 40.7% 41.1% (40) bps 38.9% 39.3% (40) bps
Trench, Power and Pump
Reportable segment equipment rentals revenue $224 $189 18.5% $413 $351 17.7%
Reportable segment equipment rentals gross profit 111 89 24.7% 195 157 24.2%
Reportable segment equipment rentals gross margin 49.6% 47.1% 250 bps 47.2% 44.7% 250 bps
Total United Rentals
Total equipment rentals revenue $1,367 $1,204 13.5% $2,533 $2,321 9.1%
Total equipment rentals gross profit 576 506 13.8% 1,020 931 9.6%
Total equipment rentals gross margin 42.1% 42.0% 10 bps 40.3% 40.1% 20 bps
UNITED RENTALS, INC. DILUTED EARNINGS PER SHARE CALCULATION
(In millions, except per share data)
Three Months Ended Six Months Ended
June 30, June 30,
2017 2016 2017 2016
Numerator:
Net income available to common stockholders $ 141 $ 134 $ 250 $ 226
Denominator:
Denominator for basic earnings per share—weighted-average common shares 84.6 88.1 84.5 89.3
Effect of dilutive securities:
Employee stock options 0.4 0.3 0.4 0.3
Restricted stock units 0.4 0.1 0.5 0.1
Denominator for diluted earnings per share—adjusted weighted-average common shares 85.4
88.5
85.4
89.7
Diluted earnings per share $ 1.65 $ 1.52 $ 2.92 $ 2.52
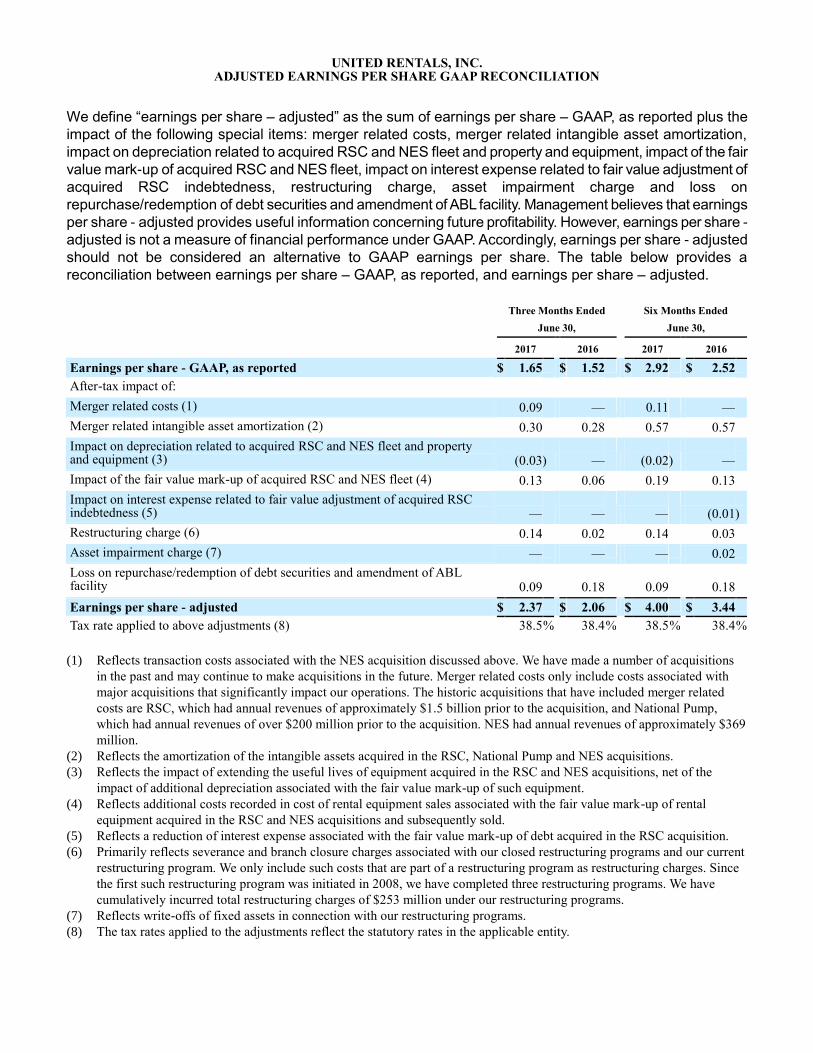
UNITED RENTALS, INC. ADJUSTED EARNINGS PER SHARE GAAP RECONCILIATION
We define “earnings per share – adjusted” as the sum of earnings per share – GAAP, as reported plus the
impact of the following special items: merger related costs, merger related intangible asset amortization,
impact on depreciation related to acquired RSC and NES fleet and property and equipment, impact of the fair
value mark-up of acquired RSC and NES fleet, impact on interest expense related to fair value adjustment of
acquired RSC indebtedness, restructuring charge, asset impairment charge and loss on
repurchase/redemption of debt securities and amendment of ABL facility. Management believes that earnings
per share - adjusted provides useful information concerning future profitability. However, earnings per share -
adjusted is not a measure of financial performance under GAAP. Accordingly, earnings per share - adjusted
should not be considered an alternative to GAAP earnings per share. The table below provides a
reconciliation between earnings per share – GAAP, as reported, and earnings per share – adjusted.
Three Months Ended Six Months Ended
June 30, June 30,
2017 2016 2017 2016
Earnings per share - GAAP, as reported $ 1.65 $ 1.52 $ 2.92 $ 2.52
After-tax impact of:
Merger related costs (1) 0.09 — 0.11 —
Merger related intangible asset amortization (2) 0.30 0.28 0.57 0.57
Impact on depreciation related to acquired RSC and NES fleet and property and equipment (3) (0.03 ) —
(0.02 ) —
Impact of the fair value mark-up of acquired RSC and NES fleet (4) 0.13 0.06 0.19 0.13
Impact on interest expense related to fair value adjustment of acquired RSC indebtedness (5) —
—
—
(0.01 )
Restructuring charge (6) 0.14 0.02 0.14 0.03
Asset impairment charge (7) — — — 0.02
Loss on repurchase/redemption of debt securities and amendment of ABL facility 0.09
0.18
0.09
0.18
Earnings per share - adjusted $ 2.37 $ 2.06 $ 4.00 $ 3.44
Tax rate applied to above adjustments (8) 38.5 % 38.4 % 38.5 % 38.4 %
(1) Reflects transaction costs associated with the NES acquisition discussed above. We have made a number of acquisitions
in the past and may continue to make acquisitions in the future. Merger related costs only include costs associated with
major acquisitions that significantly impact our operations. The historic acquisitions that have included merger related
costs are RSC, which had annual revenues of approximately $1.5 billion prior to the acquisition, and National Pump,
which had annual revenues of over $200 million prior to the acquisition. NES had annual revenues of approximately $369
million.
(2) Reflects the amortization of the intangible assets acquired in the RSC, National Pump and NES acquisitions.
(3) Reflects the impact of extending the useful lives of equipment acquired in the RSC and NES acquisitions, net of the
impact of additional depreciation associated with the fair value mark-up of such equipment.
(4) Reflects additional costs recorded in cost of rental equipment sales associated with the fair value mark-up of rental
equipment acquired in the RSC and NES acquisitions and subsequently sold.
(5) Reflects a reduction of interest expense associated with the fair value mark-up of debt acquired in the RSC acquisition.
(6) Primarily reflects severance and branch closure charges associated with our closed restructuring programs and our current
restructuring program. We only include such costs that are part of a restructuring program as restructuring charges. Since
the first such restructuring program was initiated in 2008, we have completed three restructuring programs. We have
cumulatively incurred total restructuring charges of $253 million under our restructuring programs.
(7) Reflects write-offs of fixed assets in connection with our restructuring programs.
(8) The tax rates applied to the adjustments reflect the statutory rates in the applicable entity.

UNITED RENTALS, INC.
EBITDA AND ADJUSTED EBITDA GAAP RECONCILIATIONS
(In millions)
EBITDA represents the sum of net income, provision for income taxes, interest expense, net, depreciation of
rental equipment, and non-rental depreciation and amortization. Adjusted EBITDA represents EBITDA plus the
sum of the merger related costs, restructuring charge, stock compensation expense, net, and the impact of
the fair value mark-up of acquired RSC and NES fleet. These items are excluded from adjusted EBITDA
internally when evaluating our operating performance and for strategic planning and forecasting purposes,
and allow investors to make a more meaningful comparison between our core business operating results over
different periods of time, as well as with those of other similar companies. The EBITDA and adjusted EBITDA
margins represent EBITDA or adjusted EBITDA divided by total revenue. Management believes that EBITDA
and adjusted EBITDA, when viewed with the Company’s results under GAAP and the accompanying
reconciliation, provide useful information about operating performance and period-over-period growth, and
provide additional information that is useful for evaluating the operating performance of our core business
without regard to potential distortions. Additionally, management believes that EBITDA and adjusted EBITDA
help investors gain an understanding of the factors and trends affecting our ongoing cash earnings, from
which capital investments are made and debt is serviced.
The table below provides a reconciliation between net income and EBITDA and adjusted EBITDA.
Three Months Ended Six Months Ended
June 30, June 30,
2017 2016 2017 2016
Net income $ 141 $ 134 $ 250 $ 226
Provision for income taxes 88 83 140 138
Interest expense, net 113 132 207 239
Depreciation of rental equipment 266 242 514 485
Non-rental depreciation and amortization 64 64 126 131
EBITDA (A) $ 672 $ 655 $ 1,237 $ 1,219
Merger related costs (1) 14 — 16 —
Restructuring charge (2) 19 2 19 4
Stock compensation expense, net (3) 24 13 40 22
Impact of the fair value mark-up of acquired RSC and NES fleet (4) 18 9 26 18
Adjusted EBITDA (B) $ 747 $ 679 $ 1,338 $ 1,263
A) Our EBITDA margin was 42.1% and 46.1% for the three months ended June 30, 2017 and 2016, respectively, and 41.9%
and 44.6% for the six months ended June 30, 2017 and 2016, respectively.
B) Our adjusted EBITDA margin was 46.8% and 47.8% for the three months ended June 30, 2017 and 2016, respectively, and
45.3% and 46.2% for the six months ended June 30, 2017 and 2016, respectively.
(1) Reflects transaction costs associated with the NES acquisition discussed above. We have made a number of acquisitions
in the past and may continue to make acquisitions in the future. Merger related costs only include costs associated with
major acquisitions that significantly impact our operations. The historic acquisitions that have included merger related
costs are RSC, which had annual revenues of approximately $1.5 billion prior to the acquisition, and National Pump,
which had annual revenues of over $200 million prior to the acquisition. NES had annual revenues of approximately $369
million.
(2) Primarily reflects severance and branch closure charges associated with our closed restructuring programs and our current
restructuring program. We only include such costs that are part of a restructuring program as restructuring charges. Since
the first such restructuring program was initiated in 2008, we have completed three restructuring programs. We have
cumulatively incurred total restructuring charges of $253 million under our restructuring programs.
(3) Represents non-cash, share-based payments associated with the granting of equity instruments.
(4) Reflects additional costs recorded in cost of rental equipment sales associated with the fair value mark-up of rental
equipment acquired in the RSC and NES acquisitions and subsequently sold.

UNITED RENTALS, INC.
EBITDA AND ADJUSTED EBITDA GAAP RECONCILIATIONS (continued)
(In millions)
The table below provides a reconciliation between net cash provided by operating activities and EBITDA and
adjusted EBITDA.
Three Months Ended Six Months Ended
June 30, June 30,
2017 2016 2017 2016
Net cash provided by operating activities $ 714 $ 643 $ 1,337 $ 1,247
Adjustments for items included in net cash provided by operating activities but excluded from the calculation of EBITDA:
Amortization of deferred financing costs and original issue discounts (2 ) (2 ) (4 ) (4 )
Gain on sales of rental equipment 52 55 98 102
Gain on sales of non-rental equipment 2 — 3 1
Merger related costs (1) (14 ) — (16 ) —
Restructuring charge (2) (19 ) (2 ) (19 ) (4 )
Stock compensation expense, net (3) (24 ) (13 ) (40 ) (22 )
Loss on repurchase/redemption of debt securities and amendment of ABL facility (12 ) (26 ) (12 ) (26 )
Excess tax benefits from share-based payment arrangements — 26 — 53
Changes in assets and liabilities (170 ) (232 ) (346 ) (350 )
Cash paid for interest 87 150 177 219
Cash paid for income taxes, net 58 56 59 3
EBITDA $ 672 $ 655 $ 1,237 $ 1,219
Add back:
Merger related costs (1) 14 — 16 —
Restructuring charge (2) 19 2 19 4
Stock compensation expense, net (3) 24 13 40 22
Impact of the fair value mark-up of acquired RSC and NES fleet (4) 18 9 26 18
Adjusted EBITDA $ 747 $ 679 $ 1,338 $ 1,263
(1) Reflects transaction costs associated with the NES acquisition discussed above. We have made a number of acquisitions
in the past and may continue to make acquisitions in the future. Merger related costs only include costs associated with
major acquisitions that significantly impact our operations. The historic acquisitions that have included merger related
costs are RSC, which had annual revenues of approximately $1.5 billion prior to the acquisition, and National Pump,
which had annual revenues of over $200 million prior to the acquisition. NES had annual revenues of approximately $369
million.
(2) Primarily reflects severance and branch closure charges associated with our closed restructuring programs and our current
restructuring program. We only include such costs that are part of a restructuring program as restructuring charges. Since
the first such restructuring program was initiated in 2008, we have completed three restructuring programs. We have
cumulatively incurred total restructuring charges of $253 million under our restructuring programs.
(3) Represents non-cash, share-based payments associated with the granting of equity instruments.
(4) Reflects additional costs recorded in cost of rental equipment sales associated with the fair value mark-up of rental
equipment acquired in the RSC and NES acquisitions and subsequently sold.

UNITED RENTALS, INC.
FREE CASH FLOW GAAP RECONCILIATION
(In millions)
We define free cash flow as (i) net cash provided by operating activities less (ii) purchases of rental and non-rental equipment
plus (iii) proceeds from sales of rental and non-rental equipment and excess tax benefits from share-based payment
arrangements. Management believes that free cash flow provides useful additional information concerning cash flow available
to meet future debt service obligations and working capital requirements. However, free cash flow is not a measure of financial
performance or liquidity under GAAP. Accordingly, free cash flow should not be considered an alternative to net income or
cash flow from operating activities as an indicator of operating performance or liquidity. The table below provides a
reconciliation between net cash provided by operating activities and free cash flow.
Three Months Ended Six Months Ended
June 30, June 30,
2017 2016 2017 2016
Net cash provided by operating activities $ 714 $ 643 $ 1,337 $ 1,247
Purchases of rental equipment (694 ) (622 ) (913 ) (722 )
Purchases of non-rental equipment (33 ) (19 ) (55 ) (42 )
Proceeds from sales of rental equipment 133 134 239 249
Proceeds from sales of non-rental equipment 4 3 6 7
Excess tax benefits from share-based payment arrangements (1) — 26 — 53
Free cash flow (2) $ 124 $ 165 $ 614 $ 792
(1) The excess tax benefits from share-based payment arrangements result from stock-based compensation windfall
deductions in excess of the amounts reported for financial reporting purposes. We adopted accounting guidance in 2017
that changed the cash flow presentation of excess tax benefits from share-based payment arrangements. In the table
above, the excess tax benefits from share-based payment arrangements for 2017 are presented as a component of net cash
provided by operating activities, while, for 2016, they are presented as a separate line item. Because we historically
included the excess tax benefits from share-based payment arrangements in the free cash flow calculation, the adoption of
this guidance did not change the calculation of free cash flow.
(2) Free cash flow included aggregate merger and restructuring related payments of $29 million and $3 million for the three
months ended June 30, 2017 and 2016, respectively, and $31 million and $6 million for the six months ended June 30,
2017 and 2016, respectively.
The table below provides a reconciliation between 2017 forecasted net cash provided by operating activities and free cash flow.
Net cash provided by operating activities $1,975- $2,175
Purchases of rental equipment $(1,550)-$(1,650)
Proceeds from sales of rental equipment $475-$525
Purchases of non-rental equipment, net of proceeds from sales $(75)-$(125)
Free cash flow (excluding the impact of merger and restructuring related costs) $825- $925


