
United States Landmarks and Measuring Activity Teacher planning information
Overview: This activity is designed to teach students about landmarks and scale. Objectives: In completing this activity, students should be able to:
• Understand the concept of landmarks • Locate the states where major US landmarks are • Understand differences in scale • Make scale comparisons
Oregon Common Core State Standards for Math: Measurement and Data (2.MD): - measure and estimate lengths in standard units, - relate addition and subtraction to length, -represent and interpret data. Oregon Geography Content Standards: 2.7, 2.10, 3.13. Grades: 2-3 Time: 15 minutes Materials:
• Tape measures (at least 5 feet long) • Writing utensils (any kind) • Pictures of famous US landmarks (included) • Statue of Liberty Statistics activity page (included) • Other Monument Sizes activity page (included) • US map with states labeled (included) • Calculators (optional)
Activity set up: Print out the Statue of Liberty Statistics,
How to do this activity: Step 1:
Look at the pictures of the different landmarks. Do you recognize any of them? Do you know where any are located on the map? What do landmarks represent? Can you think of any landmarks near your home or school? Step 2:
Take one of the maps of the United States and a writing utensil. In which state is each landmark located? Mark each state with a big dot. Bonus: Mark Oregon with a star too. Step 3: Look at the “What is Scale?” sheet, and learn about the three different ways of showing scale and ratio. Step 4: Find the picture of the Statue of Liberty. Take one of the “Statue of Liberty Statistics” activity pages, a tape measure, and a writing utensil. Have someone help you measure your height, and write down your answer on the sheet. Calculate the differences in size between you and the statue. You will see that you and the statue are in different scales! Step 5: Take one of the “Other Monument Sizes” sheets. Look at the landmark photos again to compare your size to the landmark.
What is scale?
When we determine how many of one unit it takes to span the length or height of a tall or long object (like a map or a landmark), it’s known as scale. For this exercise, we will be using math to calculate how our individual height relates to the height and length of major US landmarks. Scale can be shown in three ways:
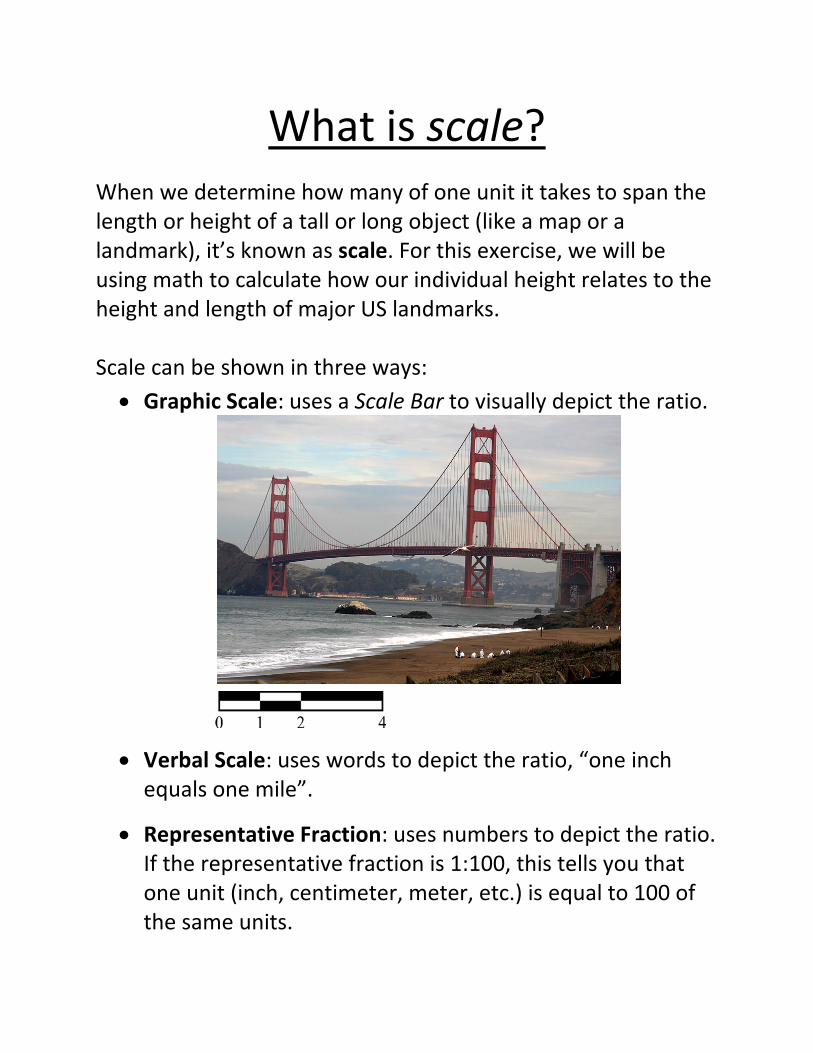
• Graphic Scale: uses a Scale Bar to visually depict the ratio.
• Verbal Scale: uses words to depict the ratio, “one inch equals one mile”.
• Representative Fraction: uses numbers to depict the ratio. If the representative fraction is 1:100, this tells you that one unit (inch, centimeter, meter, etc.) is equal to 100 of the same units.
Statue of Liberty Statistics
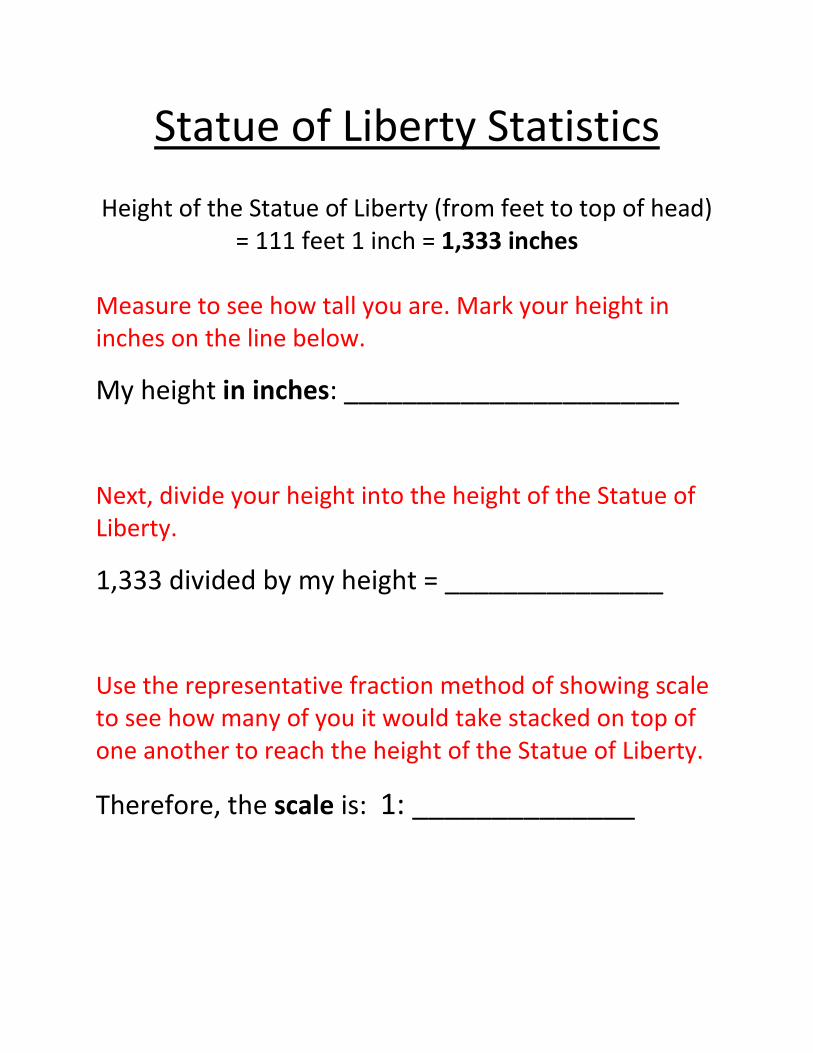
Height of the Statue of Liberty (from feet to top of head) = 111 feet 1 inch = 1,333 inches
Measure to see how tall you are. Mark your height in inches on the line below.
My height in inches: _______________________
Next, divide your height into the height of the Statue of Liberty.
1,333 divided by my height = _______________
Use the representative fraction method of showing scale to see how many of you it would take stacked on top of one another to reach the height of the Statue of Liberty.
Therefore, the scale is: 1: ______________

Other Monument Sizes
My height is: _________________ in inches
Gateway Arch: • Maximum height = 630 feet = 7,560 inches
It would take ________________________ of me stacked on top of one another to reach the height of the Gateway Arch! Golden Gate Bridge:
• Length of the bridge = 8,981 feet (1.7 miles) = 107,772 inches It would take __________________________ of me stacked end to end to span the length of the Golden Gate Bridge! Washington Monument:
• Height = 555 feet 5 inches = 6,665 inches It would take __________________________ of me stacked on top of one another to reach the height of the Washington Monument! Space Needle:
• Height = 605 feet = 7,260 inches It would take _____________________________ of me stacked on top of one another to reach the height of the Space Needle!

Statue of Liberty. New York, NY. Completed in 1886.

Gate
way
Arc
h. S
t. Lo
uis,
MO
. Com
plet
ed in
196
7.

Gold
en G
ate
Brid
ge. S
an F
ranc
isco,
CA.
Com
plet
ed in
193
7.

Space Needle. Seattle, WA. Completed in 1961.

Washington Monument. Washington, D.C. Completed in 1884

Mar
k on
this
map
the
stat
e in
whi
ch e
ach
mon
umen
t can
be
foun
d!

Sources: All images from Wikimedia Commons Monument statistics from the National Park Service, spaceneedle.com, and goldengatebridge.org


