
Permission is hereby granted to the University of Alberta Libraries to reproduce single copies of this thesis
and to lend or sell such copies for private, scholarly or scientific research purposes only. Where the thesis is
converted to, or otherwise made available in digital form, the University of Alberta will advise potential
users of the thesis of these terms.
The author reserves all other publication and other rights in association with the copyright in the thesis and,
except as herein before provided, neither the thesis nor any substantial portion thereof may be printed or
otherwise reproduced in any material form whatsoever without the author's prior written permission.
University of Alberta
Fish olfaction: a biosensor for anthropogenic contaminants
by
Brian Blunt
A thesis submitted to the Faculty of Graduate Studies and Research
in partial fulfillment of requirements for degree of
Master of Science
in
Physiology, Cell & Developmental Biology
Department of Biological Sciences
© Brian Blunt Spring 2014
Edmonton, Alberta
Abstract
Anthropogenic contaminants can impair olfactory responses to natural odorants.
In fishes, these impairments may be used as a metric of sub-lethal toxicity. My
studies aimed to determine the effects of two contaminant sources on fish
olfaction as measured by electro-olfactography (EOG). The effects of treated
municipal reuse water and oil sands process affected water were examined in two
fish species, goldfish (Carassius auratus) and rainbow trout (Oncorynchus
mykiss). Both contaminant sources were found to decrease olfactory responses to
odorants during acute (30 min) and long term (60 and 7 d) exposures. My studies
also aimed to identify a novel class of odorants (nucleosides). It was determined
that nucleosides are detected, as are the nucleobases that comprise part of their
structure. Overall the focus of my thesis was to investigate olfactory toxicity in
fishes and to characterize a new class of odorants for future studies.

Table of contents
Chapter 1: Introduction ........................................................................................1
Fish olfaction ........................................................................................................1
The electro-olfactogram (EOG) ...........................................................................3
Measuring the EOG ..............................................................................................4
Odorants ...............................................................................................................5
Olfactory toxicity of fishes .................................................................................10
Fish olfaction as a bionsensor ............................................................................13
Thesis objectives ................................................................................................14
Tables .................................................................................................................15
Chapter 2: Determining sub-lethal toxicity of treated reuse water as
measured by olfactory impairment to natural odorants in goldfish (Carassius
auratus)..................................................................................................................16
Introduction .......................................................................................................16
Materials and methods ......................................................................................28
Results ...............................................................................................................34
Discussion .........................................................................................................76
Conclusions .......................................................................................................91
Chapter 3: Determining sub-lethal toxicity of oil sands process affected water
as measured by olfactory impairment to natural odorants in rainbow trout
(Oncorynchus mykiss)...........................................................................................93
Introduction .......................................................................................................93
Materials and methods ....................................................................................103
Results .............................................................................................................108
Discussion .......................................................................................................129
Conclusions .....................................................................................................136

Chapter 4: Olfactory detection of nucleosides and nucleobases by goldfish
(Carassius auratus) ............................................................................................137
Introduction .....................................................................................................137
Materials and methods ....................................................................................138
Results .............................................................................................................139
Discussion .......................................................................................................143
Summary of major findings ..............................................................................145
Troubleshooting EOG acquisition ....................................................................148
Future directions ................................................................................................152
Conclusion ..........................................................................................................158
Bibliography .......................................................................................................159
Appendix A .........................................................................................................179
Appendix B .........................................................................................................180
Appendix C .........................................................................................................181
Appendix D .........................................................................................................182
Appendix E .........................................................................................................184
Appendix F .........................................................................................................185

List of Tables
Table1.1. Threshold concentrations for the detection of PGF2α. * only one
concentration was tested.
Table 2.1. Concentration of contaminants found within MF reuse.
Table 2.2. Two-way Anova results for 30min reuse water exposures.
Table 2.3. T-test results for 30d reuse water exposures.
Table 3.1. Residual NA microbial biodegradation kinetics adapted from Martin et
al. [74].
Table 3.2. Comparisons between exposure groups and pre-exposure or control
EOG values throughout the 30 min exposure.
Table 3.3. Concentrations of Chloride and Sodium found in dilutions of OSPW.

List of Figures
Figure 2.1. Concentration response curves for the amino acids L-serine and
L-alanine the pheromones 17,20-P and PGF2α (n = 5).
Figure 2.2. Sample traces for concentration dependent responses.
Figure 2.3. Concentration response curves to MF reuse, CF/MF reuse,
UV/H2O2/MF reuse and a NCM.
Figure 2.4. Concentration response curve to a NCM.
Figure 2.5 Pre-exposure EOG responses before a 30 min exposure to treated reuse
water or a NCM.
Figure 2.6. EOG responses during a 30 min exposure to treated reuse water and a
NCM.
Figure 2.7. EOG responses during a 30 d exposure to treated reuse water during
fall 2011.
Figure 2.8. Sample traces of EOGs collected during 30 d exposure to treated reuse
water.
Figure 2.9. EOG responses during a 60 d exposure to treated reuse water during
spring 2012.
Figure 2.10. EOG responses during a 60 d exposure to treated reuse water during
spring 2012

Figure 2.11. Behavioral response to the introduction of a contaminant pulse.
Figure 2.12. Behavioral responses to the introduction of a pulse of L-alanine post
30 min exposure to a contaminant source.
Figure 2.13 Behavioral responses to the introduction of a pulse of L-alanine
during a 60 d exposure to treated reuse water.
Figure 3.1. Cl- standard curve as determined using a spectrophotometer with an
optical density of 480nm.
Figure 3.2. Na+ standard curve determined by atomic absorption
spectrophotometry.
Figure 3.3. Concentration response curves for L-serine and TChA.
Figure 3.4. Concentration response curves for OSPW, O3OSPW, and the
NaCl control.
Figure 3.5. Concentration response curves for EOGs evoked by OSPW,
O3OSPW, and the NaCl control.
Figure 3.6. Pre-exposure EOGs evoked using L-serine and TChA.
Figure 3.7. Effects of a 30 min exposure to 10% OSPW, 1% OSPW, 10%
O3OSPW, the NaCl control and dechlorinated water (control) on EOGs
evoked by L-serine.

Figure 3.8. Effects of a 30 min exposure to 10% OSPW (n=6), 1% OSPW
(n=11),10% O3OSPW (n=7), , the NaCl control (n=6) and dechlorinated
water (control) (n=6) on EOGs evoked by TChA
Figure 3.9. Effects of a 7 d exposure to 10% O3OSPW, 10% OSPW, 1% OSPW,
the NaCl control and dechlorinated water (control) on EOGs evoked by L-
serine and taurocholic acid.
Figure 4.1. Concentration response of olfactory sensory neurons as measured by
electro-olfactography (EOG) evoked by increasing concentrations of purine
nucleosides, guanosine and adenosine, and purine derivatives, adenine and
hypoxanthine.
Figure 4.2. Cross adaptation of purine nucleosides, a nucleobase, and a purine
derivative.
List of abbreviations
17,20--pregnen-3-one: 17,20-P
Carbon filtered reuse: CF/MF reuse
Electro-olfactogram: EOG
G-protein coupled receptor: GPCR
Litres: L
Membrane filtered reuse: MF reuse
Millilitres: mL
Millivolts: mV
Minutes: min
Napthenic Acid: NA
Novel contaminant mixture: NCM
Oil sands process affected water: OSPW
Olfactory Receptor: OR
Olfactory sensory neuron: OSN
Ozonated oil sands process affected water: O3OSPW
Prostaglandin F2α: PGF2α
Seconds: s
Taurocholic Acid: TChA
Ultraviolet light and hydrogen peroxide filtered reuse: UV/H2O2/MF
reuse
Vomeronasal receptor class 1: V1R

Vomeronasal receptor class 2: V2R
Waste water treatment plant: WWTP
Personal care products and pharmaceuticals: PCPPs

1
Chapter 1: Introduction
Fish olfaction
Olfaction is an important sensory system used by fish to gather information about
their surroundings and is used to guide behaviors such as mating, homing/
migration, and predators / prey avoidance / attraction. The olfactory epithelium of
fishes is comprised of two bilaterally paired structures, known as olfactory
rosettes, contained within olfactory chambers (Appendix A; Appendix B)[46]. In
the fish species I have studied, goldfish (Carassius auratus) and rainbow trout
(Salmo gairdneri), the olfactory chamber is covered by a flap of skin with two
openings (nares), one anterior through which water enters the chamber and one
posterior through which water exits the chamber (Appendix A). Olfactory rosettes
are comprised of multiple lamellae which are folded together (Appendix B).
Olfactory lamellae contain olfactory sensory neurons (OSNs), which occur at
different concentrations on different lamellae within the rosette [42].
Three classes of OSNs have been identified in fishes: ciliated, microvillus and
crypt; ciliated and microvillus being named after the appearance of their projected
structure. Olfactory receptors also have specific g-protein coupled receptors
associated with them, with more than 100 GPCRs occurring in the fish olfactory
system [79]. The GPCR super-family can be subdivided into three sub-families
which include olfactory receptors (OR), and vomeronasal receptor class one and
two (V1R and V2R, respectively), each associated with the OSN sub-families.
Ciliated OSNs express ORs, which express the G-protein G-αolf, microvillus OSNs

2
express V2Rs, which express the G-proteins G-α,o, G-α,q, and G-α,i-3, and crypt
OSNs appear to express both V1Rs and V2Rs, which express the G-proteins G-α,o
and G-α,q [40].
For an olfactory response to occur in fishes, water with odorants or other
molecules/ions passes through the olfactory chamber, over the olfactory rosette,
and to the GPCRs [46]. If an agent binds a receptor, a G-protein subunit may
dissociate and affect the activity of one of two secondary messenger systems: one
which stimulates phospholipase C leading to the production of inositol
triphosphate, or; one which stimulates adenylyl cyclase leading to the production
of cyclic AMP [102]. Secondary messengers can activate a Na+ or Ca
2+ permeable
conductance in cation channels, resulting in an increase in free intracellular Na+
or Ca2+
. The change in membrane conductance affects voltage, which in turn may
activate a second conductance of Cl-, a cation, or K
+, leading to the generation of
generator potential. A strong enough generator potential at the apical end of an
OSN may result in an action potential. Changes in OSN membrane potential can
be measured using an extracellular recording technique referred to as electro-
olfactogram (EOG) by Ottoson [78, 88].
Following the generation of the action potential, the electrical signal travels along
axons extending from OSNs into glomeruli at the base of the olfactory bulb [46].
Multiple OSN axons form a bundle which enters into singular glomeruli for a
convergence of one signal. Mitral cells within the olfactory bulb form a synapse
with the glomeruli and convey this signal into the brain for further processing.

3
This processing of the signal leads to behavioral or physiological responses
related to olfactory detection of odorants. Should the generator potential not be
high enough to activate an action potential, olfactory signaling to the olfactory
bulb would not occur and therefore neither would the processing of the olfactory
signal. Inhibition of the signaling pathway at any point causes a decrease in
olfactory ability, and therefore a decrease in information being gathered via
olfaction [118].
The electro-olfactogram (EOG)
The EOG is a measure of the combined generator potentials of groups of OSNs
within the recording area, with the recording area defined loosely as the region
under and around the micro-electrode used in the recording [78]. In simpler terms,
EOGs are a measure of the change in many cells’ membrane potentials, resulting
from an efflux of ions that occurs during the aforementioned binding of odorants
to ORs. To measure these generator potentials, an electrode composed of Na+/Cl-
and gelatin is placed in close proximity to lamellae within the olfactory rosette
(Appendix C) [7]. A second electrode is placed either on the body of the fish or in
the water bath containing the fish, and the potential at this electrode is also
measured. The EOG is a difference between the generator potential of a group of
OSNs within the recording area of the electrode and the reference electrode.
Signals are amplified using an amplifier and digitized using a computer interface
[7]. The differential EOG is displayed as a negative peak in the baseline, returning
to baseline upon cessation of olfactory stimulation. The magnitude of the peak

4
correlates to the strength of the generator potential, with decreased generator
potentials resulting in decreased peak magnitudes. If generator potentials of a
group of OSNs are decreased then the action potentials will also be decreased,
resulting in a disruption of the information sent for processing. The EOG provides
information regarding detection of odorants via the generator potential; however it
does not provide information on disruption of the olfactory signaling pathway.
Measuring the EOG
As previously stated the EOG is measured as the difference of the peak amplitude
from the pre-odorant baseline. This measure has been used traditionally as it
represents the maximal response evoked from all cells in the recording area. This
is in contrast to electro-encephalogram recordings that measure sum action
potentials and use area under the peak to determine the response. EOGs are not
measured using the area under the curve as the slow return to baseline may occur
over a large amount of time (several seconds) thus making it impractical to use
this measurement [104]. This slow return to baseline may be due to odorants
remaining in the olfactory cavity and stimulating ORs for a second time; however
it is also possible that this slow return to baseline is due to signals from other cells
which have been shown to evoke responses due to changes in the micro-
environment as a result of a release of ions during the depolarization events that
occur during odorant binding [7, 104].
5
Odorants
To date five odorant classes have been shown to be detected in fishes: amino
acids, steroids, prostaglandins, bile salts, and nucleotides [46, 118]. Not all fish
are able to detect each class of odorant and the sensitivity of the olfactory tissue to
specific odorants differs between species [117]. An example of this is with
prostaglandins: rainbow trout do not appear to detect them, while goldfish and
Atlantic salmon (Salmo salar) can at a threshold of 10-8
and 10-11
M, respectively
[110, 115]. Specific behaviors are associated with the detection of some odorants,
examples including feeding behaviors such as food searching and biting exhibited
by the detection of the amino acid L-alanine and mating behaviors such as
chasing of females associated with male goldfish upon the detection of various
pheromones [108, 110, 126, 127]. Below I have described the detection thresholds
and behaviors associated with the odorants used in my thesis.
Amino acids
L-alanine
Olfactory detection of L-alanine was first observed in catfish during a study
conducted by Suzuki and Tucker [114]. The study used EOG recordings to
demonstrate the detection of six amino acids and determined their threshold
concentration for detection. It was shown that channel catfish (Ictalurus
punctatus) can detect L-alanine at dilutions as low as 10-8
M, and that detection
occurred in a concentration dependent manner. The steriochemistry of odorant

6
molecules also plays a role in detection, as the L forms are more stimulatory than
D forms [47, 48]. Hara et al. found that L-alanine was also detectable by rainbow
trout (Oncorhynchus mykiss), with the detection threshold the same as that found
by Suzuki and Tucker [47]. It was again demonstrated that the L- isomer was
more stimulatory than its D- isomer. Hara demonstrated that detection of amino
acid structures was impacted by the positioning of both the amino and carboxyl
group, with OSN responses the greatest when both groups are in the α position
[48]. Behavior evoked in the presence of L-alanine is known to include feeding
behaviors such as snapping, biting and increased searching in multiple fish
species [13, 34, 66, 126, 127]. Studies investigating olfactory detection of L-
alanine suggest that it is an important olfactory cue related to food searching.
Decreased detection of L-alanine may result in decreased ability to find prey
organisms, resulting in malnourishment and decreased fitness.
L-serine
Multiple studies have shown that L-serine represents a potent olfactory stimulus
for multiple fish species [47, 53, 62, 93, 94, 109] and while most behavioral
studies have focused on salmonids, behavioral responses to its introduction have
been demonstrated as avoidance [53, 93]. L-serine was first identified as a
potential odorant for salmonids in a study conducted by Idler et al., in which they
attempted to determine the components of a human hand rinse that were
associated with avoidance behavior [53]. The study examined the willingness of
salmonids to continue migration via a ladder when human hand rinse or
7
compounds extracted from human hand were introduced to the ladder. They found
that hand rinse released in the ladder resulted in fish stopping at the base of the
ladder, as well as increasing rapid movements, or returning downstream. Fish
would eventually climb the ladder; however only after the pulse of hand rinse had
passed. Of all compounds extracted and tested from human hand rinse, L-serine
was the only compound to elicit the same behaviors in the fish at a similar
dilution (10-6
M). The researchers identified L-serine as an odorant associated
with mammalian predators. Hara et al. recorded EOG responses by rainbow trout
to L-serine and determined that it was detectable down to a concentration of 10-8
M. L-serine was also shown to be detected by channel catfish at a dilution of 10-7
M [18]. Rehnberg and Schreck used a y-maze test, in which fish were placed at
the base of a y-shaped trough and allowed to swim up one arm with or without the
presence of an odorant, to show that rainbow trout avoided L-serine[93]. Hara et
al. observed lake whitefish (Coregonus clupeaformis) and goldfish behavior post
introduction of L-serine in a behavioral trough. After the introduction of L-serine,
swimming behavior changed from end to end swimming to small circular
swimming and searching along the trough wall. Decreases in L-serine detection
may result in decreased ability of fishes to detect mammalian predators, and as
such become easier targets.

8
Prostaglandin
Prostaglandin F2α
The pheromone prostaglandin F2α (PGF2α) has been shown to be an olfactory
stimulus in multiple fish species and is associated with both behavioral and
physiological responses [65, 80, 110]. The EOG thresholds determined were
between 10-7
and 10-11
M (Table 1-1). The pheromone PGF2α is a potent
olfactory stimulant released by female goldfish to evoke mating behavior in male
goldfish [110]. Laberge et al. demonstrated that lake whitefish and brown trout
increased locomotor activity after the introduction of PGF2α; however rainbow
trout did not display the same increase [65]. When PGF2α was released by female
Atlantic salmon it was shown to evoke increased milt production in males [80].
The EOG and behavior data regarding PGF2α suggests that it relays important
sensory information that relates to mating in multiple fish species. Decreases in
PGF2α detection may result in male fish not performing mating behaviors or
increasing milt production. If such changes persisted in a field setting, decreases
in fish populations could occur.
Steroid
17α, 20-dihydroxy-4-pregnen-3-one
17α, 20-dihydroxy-4-pregnen-3-one (17, 20-P) was identified by Sorensen et
al. as a steroidal pheromone detected via olfaction by goldfish[108]. The detection
threshold determined by EOG recordings from male, female, and gonadally
9
regressed male goldfish was 10-13
M. Male goldfish exposed to 17,20- P were
shown to have increased milt production as well as increased mating success
[113]. This data suggests that 17,20- P is an important olfactory cue to goldfish
mating. Decreases in 17,20- P detection may result in fish not performing mating
behaviors or increasing milt production. If such changes persisted in a field
setting, decreases in fish populations could occur.
It should be noted that odorants such as steroids require odorant binding proteins
to reach ORs within the olfactory tissues of terrestrial animals due to the change
of phase for these highly volatile compounds, they being present in air and ORs
being in an aqueous environment [129]. This is not likely the case for these
odorants when interacting with the fish olfactory system as the steroids is released
into and detected in an aqueous environment, and no such proteins have been
described in fish olfactory tissue.
Bile salt
Taurocholic Acid
Taurocholic acid (TChA) was first described as an odorant in Arctic char
(Salvelinus alpines) and grayling (Thymallus thymallus) with a mean detection
threshold of 6.3 x 10⁻⁸
by Doving et al. [25]. Goldfish and rainbow trout detect
TChA with concentration thresholds of 10-8
and 10-10
M, respectively [33, 109].
Giaquinto et al. suggest that TChA functions as a pheromone in rainbow trout
[33]. TChA represents an important odorant to salmonids evoking mating

10
behaviors. Decreases in its detection may result in fish not performing courtship
behaviors, and potentially decreasing fish populations.
Olfactory toxicity of fishes
The olfactory tissue of fishes is vulnerable to contaminants due to its highly
exposed nature. To date, olfactory toxicology studies have primarily focused on
the effects of pH, metals, and pesticides [22, 36, 49, 54, 56, 62, 81, 82, 84, 101].
As there are multiple OSN classes, not all of which use the same mechanisms to
evoke olfactory responses, it is likely that different forms of contaminants affect
fishes’ ability to detect different classes of odorants. My thesis focuses on the
effects of organic contaminant mixtures from two sources: one including personal
care products and pharmaceuticals (PCPPs) and pesticides; a second containing a
mixture of naphthenic acids (NAs). To date no studies have focused on the effects
of PPCPs or NAs on olfaction; however studies examining the effects of pesticide
mixtures on EOG responses exist. Atlantic salmon exposed to a pesticide mixture
for 30 min displayed decreased EOG responses to both L-serine and PGF2α. The
mixture contained equal parts of simazine and atrazine (1 μg/L) and decreased L-
serine and PGF2α EOGs by 51 and 70% respectively[82]. The effects of the
mixture were similar to those of a 30 min exposure to 2 μg/L simazine, which
decreased EOG responses to L-serine and PGF2α by 50 and 72% respectively.
Tierney et al. examined the effects of an environmentally realistic pesticide
mixture, exposing juvenile rainbow trout to a mixture containing dimethoate,
simazine, methamidophos, diazinon, chlorpyriphos, endosulphan, malathion,
11
atrazine, linuron, and parathion for 96 h [121]. Total concentrations of pesticides
of 0.186 and 1.01 μg/L reduced L-serine evoked EOGs by 14 and 42%
respectively. Contaminant mixture studies are not well represented in the
literature; however it is important that we better understand the effects of
contaminant mixtures as they represent exposures scenarios that are more likely
encountered by wild fish populations.
Studies examining the effects of contaminant mixtures on behavior provide
important information relating to ecological impacts on fish that may encounter
similar exposure scenarios in the wild. Behaviors with obvious survival relevance,
e.g. homing, migration, mating, and predator/prey detection, often rely on the
detection of chemosensory cues via olfaction. Contaminants within the
environment that disrupt the detection and perception of odorants alter a fish’s
ability to gather this information, and this may negatively affect survival. For fish
to avoid contaminants, they must be able to detect them and also associate their
presence with negative effects. Avoidance of contaminants such as pesticides and
metals has been shown to occur in multiple fish species [16, 17], however some
contaminants are not detectable and other contaminants are not perceived as
harmful and so do not result in avoidance behaviors [32, 38], and may even result
in attraction [5, 122]. The herbicide nicosulfuron is an example of a contaminant
which evokes attraction (in goldfish), although there is no known benefit to this
exposure [100]. Not only is it important to understand behaviors associated with
these contaminants, but also behaviors associated with natural odorants during

12
and after exposure to contaminants, as these may be altered. My thesis focused on
behavior studies involving exposure to a contaminant mixture containing both
PCPPs and pesticides; however behavior data relating to these types of
contaminant mixtures is limited. Tierney et al. monitored time spent in the inflow
zone of a flow through system by adult zebrafish (Danio rerio) when presented
with a pulse of tank water (control), low, medium, or high concentrations of a
pesticide mixture containing glyphosate, dicamba, mecoprop and 2,4-D. Zebrafish
presented with the high concentration (875 ng/L) spent more time in the inflow
zone than controls during the first min following the pulse introduction,
demonstrating an attraction behavior. Tierney et al. also measured time spent in
the inflow zone upon the introduction of the amino acid L-alanine, a food odorant,
after a 96 h exposure to the herbicide mixture. Zebrafish exposed to all
concentrations of the mixture spent more time in the inflow zone during the
second and third minutes post introduction than controls, and those exposed to the
medium concentration continued this behavior into the fourth minute post
introduction. Teather et al. measured the distance travelled in two min by
Japanese medaka (Oryzias latipes) fry at 3 weeks post-hatching after an exposure
to the pesticides azinphos-methyl, chlorothalonil, and endosulfan as well as a
mixture of all three beginning at fertilization and ending seven days post-hatch
[116]. Fry exposed to the mixture containing a total concentration of 0.18 μg/L
were shown to have decreased distance travelled compared to all other exposure
groups and controls.

13
Fish olfaction as a biosensor
To use fish olfaction as a biosensor both detection via OSNs and changes in
behavior associated to contaminants were integrated, allowing us to identify
concentrations of contaminants within waters which may be harmful to fishes.
This has been reviewed by Tierney and two methods for this application were
suggested: concentration responses to contaminants correlated to avoidance/
attraction responses, and reductions in EOG to natural odorants correlated to loss
of behavioral responses to these same odorants[118]. Tierney et al. demonstrated
that studies investigating the concentration responses to contaminants and
avoidance/ attraction responses have a general trend suggesting that contaminants
are detected at lower concentrations than those evoking avoidance behaviors.
Correlations between loss of odorant detection via OSNs and behavioral
responses to these same odorants are less predictable. Small decreases in OSN
detection of odorants may still result in loss of behavioral responses to these
odorants. One example of this is a study conducted by Tierney et al. where
exposures to pesticides resulted in decreases in behavioral preference to the amino
acid L-histidine at concentrations lower than those that decreased EOG responses
to the same odorant [123]. The use of such tests with both individual
contaminants and contaminant mixtures could help identify specific contaminants
and their concentrations within mixtures which elicit negative effects in both
olfactory and behavioral endpoints. This may help with the development of other
technologies, such as those involved in treatment of contaminated water, by

14
demonstrating the contaminants and their concentrations that are of potential
concern to fishes.
Thesis objectives
My thesis focused on four main objectives: 1) determining EOG concentration
response relationships for odorants or organic contaminant mixtures ; 2)
determining the effects of long and short term exposures to organic contaminant
mixtures on EOGs; 3) determining the behavioral effects of introduction and
exposure of contaminant mixtures on olfactory mediated behaviors; and 4)
characterizing a novel class of odorants. Objective l was accomplished by
recording EOGs to the odorants discussed above (L-alanine, L-serine, PFG2α and
17,20-βP), and treated reuse in goldfish and odorants discussed above (TChA and
L-serine), and OSPW in rainbow trout. Objective 2 was accomplished by
recording EOGs to odorants during 30 min and 60 d exposures to treated reuse
water in goldfish and 30 min and 7 d exposures to OSPW in rainbow trout.
Objective 3 was accomplished by tracking goldfish movement to determine
changes in distance travelled during two scenarios: 1) after the introduction of a
contaminant mixture pulse; 2) after exposure to a contaminant mixture and upon
the introduction of the food odorant L-alanine. Objective 4 was accomplished by
recording EOG concentration response curves to adenosine, adenine,
hypoxanthine, and guanosine, and also performing a cross adaptation study using
these compounds. Overall this work aimed at investigating the effects of
contaminant mixtures on olfaction and olfactory mediated behavior, while also
providing evidence of a novel class of odorants.

15
Tables
Species Threshold
concentration
(M)
Source
Goldfish 10-9
Sorensen et al. 1988
Atlantic salmon 10-11
Moore. 1996
Salmo trutta (brown trout)
Whitefish
10-10
10-8
Laberge and Hara.
2003
Salvelinus alpinus
(Arctic char)
10-11
Sveinsson and Hara.
2000
Goldfish
Cyprinus carpio(common
carp)
Zacco temmincki (dark
chub)
Zacco platypus (pale chub)
Misgurnus
anguillicaudarus (loach)
Pleccoglossus altivelis
(ayu)
10-7*
Shoji et al. 1994
Table1.1. Threshold concentrations for the detection of PGF2α. * only one
concentration was tested.

16
Chapter 2: Determining sub-lethal toxicity of treated reuse water as
measured by olfactory impairment to natural odorants in goldfish (Carassius
auratus)
Introduction
The growing global population has increased the demand on the limited potable
water supply [4, 68]. In an attempt to conserve potable water resources, the use of
treated municipal effluent, or final effluent wastewater (FE wastewater) for
industrial, agricultural and urban development / landscaping practices is
increasingly viewed as an acceptable alternative [3]. In regions where potable
water is scarce, use of FE wastewater for groundwater recharge as well as for
potable uses has been approved [3, 68]. The use of FE wastewater for such
practices raises concern as this water contains three forms of contaminants:
microbes and pathogens, synthetic organic compounds, and heavy metals. The
release of FE wastewater to the environment poses a risk for species whose
habitat may become contaminated, such as fishes. This study will focus on the
effects of synthetic organic compounds on goldfish olfaction, and as such will
only cover background related to synthetic organic contaminants.
Gold Bar Waste Water Treatment Plant
The Gold Bar WWTP was the source of treated reuse water. This WWTP is
responsible for treating 310 mega liters of municipal effluent daily from the city

17
of Edmonton [26]. Water enters the treatment facility and begins pretreatment in
aerated grit tanks used to remove large inorganic solids. It then enters clarifying
ponds for primary treatment where heavy organic solids sink to the bottom and
light organic solids are skimmed off of the top. During this phase liquid effluent
and solid waste are separated and treated individually. The effluent, now referred
to as primary effluent, moves on to large bioreactors for secondary treatment.
Preexisting microorganisms within the effluent multiply and use dissolved
organic matter, including contaminants, as a source of nutrients. The primary
effluent then flows into a second set of bioreactors which involve modifications
allowing microorganisms to remove excess phosphorus and ammonia. The
effluent is now referred to as secondary effluent and enters ponds for final
clarification. These ponds use rakes to remove bacterial mats known as floc that
remain after the bioreactors. If the treated effluent is to be returned to the North
Saskatchewan, it is disinfected using a high intensity ultra-violet light. Of the
water that goes through the Gold Bar WWTP, 5% is diverted from UV
disinfection and passes through a membrane filtration process referred to as
effluent polishing. The membranes are composed of highly porous synthetic
strands that are able to remove bacteria and other microorganisms. This 5% of
diverted effluent is high grade process water, or reuse water (MF reuse), that is
intended for industrial applications (e.g. cooling and steam production at oil sand
processing plants) throughout Alberta.
The use of MF reuse for such applications comes with concerns regarding its
toxicity (defined as the ability of a substance to harm an organism or tissues
18
within it [28]), should it be accidentally released. Use of MF reuse in agricultural
and urban landscaping practices would lead to an immediate release into the
surrounding environment and increases concentrations of pharmaceutical and
personal care products (PPCPs) and endocrine disrupting compounds (EDCs)
within receiving waters. The use of MF reuse in industrial applications may also
result in release to the environment should complications arise from transportation
of the water or should it be used in steam processes.
Wastewater toxicity
Studies examining toxicity of wastewater to date have focused on EDCs. These
compounds impart their effects in one of five ways: binding to hormone receptors
and changing protein synthesis or mitosis; interfere with binding of hormones
with membrane receptors; altering steroidogenesis; interfering with the synthesis
of hormones; and alteration of ion flux across a membrane. EDC classes include
estrogens, antiestrogens, antiprogestins, andtiandrogens and heavy metals. Studies
with multiple fish and amphibian species have shown that exposure to EDCs at
concentrations found in wastewater or to wastewater containing EDCs was linked
to increased intersex individuals, decreased number of males, and retarded
development in juveniles [30, 67, 91, 112, 125, 133].
While EDCs are the current front runner as the cause of toxicity associated with
wastewater, many other compounds exist within this chemical mixture.
Wastewater contains a suite of chemical contaminants including analgesics,
pesticides, stimulants, anticonvulsants, antipsychotics, anti-lipidemics, and more.

19
A study conducted by Kerr et al. aimed to examine the estrogenic effects within
water from the Gold Bar WWTP [60]. Screening the effluent for 60 different
organic contaminants, Kerr et al. identified nine different PPCPs and eight
pesticides, with the pesticides occurring on a seasonal basis during the summer
and winter. Kerr et al. only examined the MF reuse for compounds that were
potential endocrine disruptors; however a more recent analysis, which used
methods to determine acid extractable herbicides and PPCPs, showed MF reuse
contains at minimum 75 different organic contaminants all at concentrations of
ng/L (Table 2.1).
A major problem associated with studying the toxicity of wastewater is its highly
diverse chemical composition from one geographic location to the next. While
some compounds such as caffeine and acetominophine are present in the majority
of wastewater effluents, even these commonly occurring compounds are present
in variable concentrations from one location to the next [1, 11, 29, 60, 133]. Little
is understood regarding the synergistic effects of compounds found within
wastewater and so studies must be conducted that examine not only whole
effluent toxicity, but also various combinations of commonly occurring
contaminants at concentration ranges at which they are found.
Ultraviolet light and hydrogen peroxide treatment of reuse water
Ultraviolet light and hydrogen peroxide treatment (UV/H2O2/MF reuse) is one of
the treatments investigated in study. The filtration process using UV/H2O2 is an
example of an advanced oxidation process, a new class of treatment methods
20
currently being investigated for the treatment of wastewaters containing organic
contaminants. The process begins with UV irradiation causing the photolysis of
H2O2 molecules, creating two hydroxyl radicals (OH-). Hydroxyl radicals are
highly reactive compounds that when reacted with organic compounds are able to
oxidize compounds by two methods: 1) removal of hydrogen atoms or 2) by
binding to structures at points where double bonds exist, removing the need for
the double bond [57]. Aside from oxidation via hydroxyl radicals, the process also
has the ability to breakdown organic contaminants using photolysis via UV
irradiation alone.
UV/H2O2 treatment decreases concentrations of organic contaminants such as
atrazine, humic acid, and the poly aromatic hydrocarbons flurorene,
phenanthrene, and acenaphthene [8-10, 130]. Factors that impact the
effectiveness of the UV/H2O2 treatment include the concentration of H2O2, pH,
and bicarbonate concentrations [10]. All of these factors impact the availability
of hydroxyl radicals, which directly relates to the rates of oxidation of organic
contaminants. It should be noted that UV/H2O2 treatment simply changes
chemical structures of compounds and does not eliminate all forms of organic
compound from the matrix [10, 57]. Beltran et al. used gas chromatography mass
spectrometry to identify 33 byproducts occurring as a result of UV/H2O2
treatment of water containing the poly-aromatic hydrocarbons fluorine,
phenanthrene, and acenaphthene. As wastewater effluent contains many different
organic contaminants occurring at concentrations in the ng/L range, it is likely
that the number of byproducts occurring from UV/H2O2 treatment will be

21
numerous, however due to low concentrations of reactants, the concentration of
products should be at or below ng/L concentrations, depending on the
contaminant. Typically such concentration ranges are below those associated
with toxicity [6, 56, 101, 118].
Fish olfaction as a measurement of MF reuse and toxicity
As processes that involve the use of MF reuse may result in its release into the
environment, a result of the process itself or spillage during shipping, it is
important that we understand the impacts on species , especially those with
habitats that may be compromised. It is also important to determine if the
treatment processes that have been applied to MF reuse are sufficient, or if further
treatment is required to lower its toxicity. The use of fish olfaction to study
contaminants at and below the μg/L has been well established [22, 36, 49, 101,
119, 121, 123]. Behaviors associated with fish olfaction such as freezing
responses post-introduction of the odorants L-alanine and L-serine, have also
been studies in both ecological and laboratory settings and have proved valuable
in determining sub-lethal toxicity concentrations for multiple forms of
contaminants [46, 77, 87, 134].
Aims/ Hypothesis
This study aimed to use fish olfaction as a measure of sub-lethal toxicity of MF
reuse and two forms of further treated MF reuse. The first form of treatment used
granular activated carbon, which was previously shown to remove many organic
contaminants, and will be identified as CF/MF reuse. The second treatment used
22
the UV/H2O2 process previously described, and will be referred to as
UV/H2O2/MF reuse. This study also aimed to identify potential olfactory toxicity
of a novel contaminant mixture (NCM) containing components commonly found
in WWTP effluents. The aims of this study were to answer six questions:
1. Could goldfish detect MF reuse, CF/MF reuse, UV/H2O2/MF reuse, and
an NCM in a concentration dependent manner?
2. Did a 30 min exposure to MF reuse, CF/MF reuse, UV/H2O2/MF reuse,
or an NCM cause a decrease in EOGs evoked by natural odorants?
3. Did a 60 d exposure to MF reuse, CF/MF reuse, or UV/H2O2/MF reuse
cause a decrease in EOGs evoked by natural odorants?
4. Did the introduction of a pulse of MF reuse, CF/MF reuse, UV/H2O2/MF
reuse or an NCM result in a change in goldfish behavior?
5. Did a 30 min exposure to MF reuse, CF/MF reuse, UV/H2O2/MF reuse, or
an NCM result in a change in goldfish behavior post-introduction of a
natural odorant?
6. Did a 60 d exposure to MF reuse, CF/MF reuse, or UV/H2O2/MF reuse
result in a change in goldfish behavior post-introduction of a natural
odorant?
I hypothesized that EOGs evoked from goldfish using increasing concentrations
of MF reuse, CF/MF reuse, UV/H2O2/MF reuse, and an NCM would occur in a

23
concentration dependent manner. This was hypothesized as compounds within
MF reuse and its treatments have been shown to resemble polycyclic organic
structures, such as steroids, that have been associated with fish olfaction in the
past [63, 109]. I hypothesized that goldfish exposed to all forms of reuse water or
an NCM would experience altered EOG responses, regardless of the odorant,
during a 30 min exposure [6, 101, 119]. Exposures of 60 d to MF reuse and its
treatments were hypothesized to alter EOGs evoked by all odorants during the
first 10 d of exposure, however EOGs evoked by all odorants were expected to
return at 11 d into the exposure and any time point past this. This was
hypothesized as 7 d exposures to copper have been shown to affect EOGs to
natural odorants less so than 30 min exposures [6, 101].
Behavior as measured by distance travelled was expected to change as a result of
the introduction of one of MF reuse, CF/MF reuse, UV/H2O2/MF reuse, and an
NCM. This was expected as the polycyclic compounds within MF reuse and its
treatments may resemble compounds associated with mating behavior, and these
may cause increased movement [20, 110]. As it was expected that olfaction would
be impaired by a 30 min exposure to MF reuse, CF/MF reuse, UV/H2O2/MF
reuse, or an NCM, it was logical to expect that distance traveled post-introduction
of L-alanine would not decrease due to a lack of ability to detect the odorant. This
same logic was applied to distance travelled by goldfish exposed to MF reuse,
CF/MF reuse, or UV/H2O2/MF reuse for 60 d when behavior experiments were
conducted. No decreases in distance travelled post-introduction were expected to
occur post introduction of the odorant during the first 10 d of exposure, however
24
as olfaction returned over time so would behavioral responses associated with it,
i.e. decreases in distance travelled as a response to L-alanine introduction. The
hypotheses were based on studies that have previously investigated sources of
organic contamination and its effects on olfaction, which show that above μg/l
concentrations, organic contaminants have the ability to decrease EOGs evoked in
fish species [21, 54, 82, 118-121]. While most contaminants within MF reuse
occur in the ng/L range, it is hypothesized that the contaminants would act either
additively or synergistically to impair olfaction. The rationale here is that fish
OSNs appear to be sensitive to all synthetic and natural compounds introduced to
water [118].

25
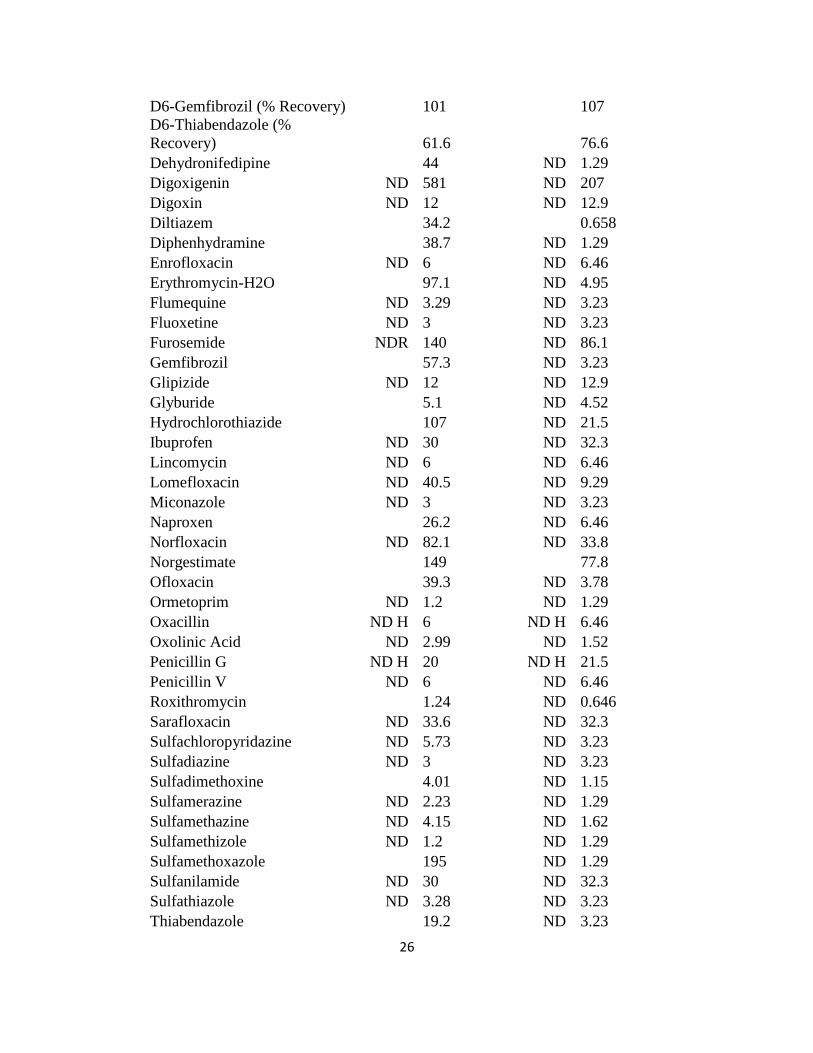
Table 2.1
Contaminant
Concentration in MF
reuse (ng/L) (n=1)
Concentratio
n in Aquatics
Facility water
(ng/L) (n=1)
1,7-Dimethylxanthine ND 120 ND 129
13C12-Triclosan (%
Recovery)
109
107
13C2-15N-Acetaminophen (%
Recovery) 141
134
13C2-Erythromycin-H2O (% Recovery) 82.6
80.4
13C3-Caffeine (% Recovery)
129
125
13C3-Ibuprofen (% Recovery)
95.7
83.8
13C3-N15-Ciprofloxacin (% Recovery) 36.3
60
13C3-Trimethoprim (%
Recovery)
60.8
81.3
13C6-Sulfamethazine (%
Recovery)
77
99.9
13C6-Sulfamethoxazole (% Recovery) 92.9
89
13C6-Triclocarban (%
Recovery)
67.5
73.3
13C-D3-Naproxen (%
Recovery)
78.2
85.4
2-Hydroxy-ibuprofen NDR 192 ND 172
Acetaminophen ND 30 ND 32.3
Azithromycin
13.5 ND 3.23
Bisphenol A ND 999 ND 1080
Caffeine ND 30
101
Carbadox ND 10.6 ND 3.23
Carbamazepine
511
30.4
Cefotaxime ND 93.4 ND 29.9
Ciprofloxacin
156 ND 12.9
Clarithromycin
434 ND 3.23
Clinafloxacin ND 119 ND 39.8
Cloxacillin ND H 6 ND H 6.46
d10-Carbamazepine (%
Recovery)
142
128
D11-Glipizide (% Recovery)
79.1
72.1
D3-Glyburide (% Recovery)
72.9
64
D5-Fluoxetine (% Recovery)
69.1
79.7
D5-Warfarin (% Recovery)
55.6
91.6
D6-Bisphenol A (% Recovery)
49.2
48.6
26
D6-Gemfibrozil (% Recovery)
101
107
D6-Thiabendazole (%
Recovery)
61.6
76.6
Dehydronifedipine
44 ND 1.29
Digoxigenin ND 581 ND 207
Digoxin ND 12 ND 12.9
Diltiazem
34.2
0.658
Diphenhydramine
38.7 ND 1.29
Enrofloxacin ND 6 ND 6.46
Erythromycin-H2O
97.1 ND 4.95
Flumequine ND 3.29 ND 3.23
Fluoxetine ND 3 ND 3.23
Furosemide NDR 140 ND 86.1
Gemfibrozil
57.3 ND 3.23
Glipizide ND 12 ND 12.9
Glyburide
5.1 ND 4.52
Hydrochlorothiazide
107 ND 21.5
Ibuprofen ND 30 ND 32.3
Lincomycin ND 6 ND 6.46
Lomefloxacin ND 40.5 ND 9.29
Miconazole ND 3 ND 3.23
Naproxen
26.2 ND 6.46
Norfloxacin ND 82.1 ND 33.8
Norgestimate
149
77.8
Ofloxacin
39.3 ND 3.78
Ormetoprim ND 1.2 ND 1.29
Oxacillin ND H 6 ND H 6.46
Oxolinic Acid ND 2.99 ND 1.52
Penicillin G ND H 20 ND H 21.5
Penicillin V ND 6 ND 6.46
Roxithromycin
1.24 ND 0.646
Sarafloxacin ND 33.6 ND 32.3
Sulfachloropyridazine ND 5.73 ND 3.23
Sulfadiazine ND 3 ND 3.23
Sulfadimethoxine
4.01 ND 1.15
Sulfamerazine ND 2.23 ND 1.29
Sulfamethazine ND 4.15 ND 1.62
Sulfamethizole ND 1.2 ND 1.29
Sulfamethoxazole
195 ND 1.29
Sulfanilamide ND 30 ND 32.3
Sulfathiazole ND 3.28 ND 3.23
Thiabendazole
19.2 ND 3.23

27
Triclocarban ND 6 ND 6.46
Triclosan ND 120 ND 129
Trimethoprim
68.2 ND 3.23
Tylosin ND 12 ND 12.9
Virginiamycin ND 52.7 ND 10.1
Warfarin ND 3 ND 3.23
Table 2.1. Concentration of contaminants found within MF reuse. A sample of
MF reuse and aquatics facility water was obtained on July 18th
2012 and sent to
AXYS analytical services. The table shows concentrations of contaminants found
in each sample using two methods: an acid extractable herbicide method and a
pharmaceutical and personal care method. ND indicates concentrations detected
below the reportable level while H indicates estimated concentrations.

28
Materials and Methods
Fish
Goldfish were obtained from Mt. Parnell Fisheries (Mercersburg, PA) and held at
18°C in flow-through aquaria at the University of Alberta Aquatics Facility.
Chemicals
Chemicals used in the construction of electrodes (NaCl, KCl, and gelatin), as well
as sodium bicarbonate (Na2CO3), were obtained from Fischer Scientific (Toronto,
ON). Chemicals used to construct the NCM (gemfibrozil, mecoprop,
carbamazepine, diclofenac and caffeine) were all obtained from Sigma
(Mississauga, ON). The anesthetic, tricaine methanosulfate, was obtained from
Syndell (Vancouver, BC).
MF reuse
MF reuse water was obtained from Gold Bar WWTP, Edmonton Alberta, Canada.
MF reuse water was created by passing final effluent through hollow fiver
membrane ultrafilration using a Zenon ZeeWeed 500 with a pore size of 0.04 μm.
CF/MF reuse
MF reuse water obtained from Gold Bar WWTP was passed through granular
activated carbon (GAC), particle size 0.1-0.3 mm, at a flow rate of 1.0 L/min.
This flow rate allowed for a retention time >15 min, allowing wastewater to
interact with the GAC. The filter unit containing the GAC was constructed from

29
polyvinyl chloride (PVC) piping and had a length of 1.22 m and an outer diameter
of 15.0 cm. The GAC filter was capped at both ends by glass wool followed by
PVC diffusers.
UV/H2O2/MF reuse
MF reuse water obtained from the Gold Bar WWTP was passed through an
electronic dosing apparatus that dosed the water with 20 mg/L H2O2. The MF
reuse then passed through a UV filter dosing at 1000 mJ/cm2. The MF reuse flow
rate through both the dosing apparatus and UV filter at a flow rate of 5.6 L/min
[60].
NCM
A secondary approach to examining the effects of chemical classes within reuse
water involved examining the effects of an NCM. Contaminants that occurred at
the highest concentration for each class during the study conducted by Kerr et al.
were selected as representative contaminants [60] which resulted in the following
mixture: the herbicide MCPP (Mecoprop®); the antiepileptic agent
carbamazepine; the hypolipodemic agent gemfibrozil; the non-steroidal anti-
inflammatory (NSAID) drug diclofenac; and the stimulant caffeine [60]. The
concentration of each contaminant reflected the total concentration of all members
within its class and was as follows: mecoprop= 29.7 μg/L; carbamazepine= 103.6
μg/L; gemfibrozil= 11.5 ; diclofenac= 1.61 μg/L; caffeine= 0.095 μg/L.
Solvent Control

30
To control for effects that may be attributed to methanol used to dissolve both
carbamazepine and gemfibrozil, a solvent control containing 11.6 μL/L of
methanol was created and used during 30 min EOG and behavior experiments.
Electro-olfactogram experiments
Electro-olfactograms
Differential EOG responses were recorded using electrodes made of Ag/Ag-Cl
inside of a borosilicate glass capillary tube embedded in 2% Agar/ 1M NaCl plug
[27]. Capillary tubes were pulled using an electrode puller to achieve a tip
diameter of 25μm, then trimmed using forceps to achieve a diameter of 100μm,
and flame polished before being filled. All signals were AC coupled, with
filtering occurring between 0.1-1000 Hz. Signals were amplified 1000×. All
recording was monitored and acquired using a PowerLab 4/25 and Chart5
software (ADInstruments, Colorado Springs). Goldfish were anaesthetized by
immersion in 200 mg/L tricaine solution, and anesthesia was maintained by
placing goldfish in a water bath containing water at the same temperature as their
tank and flowing a 100 mg/L tricaine solution over the gills. The covering of the
right nares was surgically removed and a recording electrode was placed on the
third lamellae from the right of the olfactory rosette; a reference electrode of the
same composition was placed on the body of the goldfish or within the water
bath. Olfactory epithelium was perfused with background water for 10 min and
odorants and contaminants were delivered in 2 s pulses. If goldfish did not have
EOGs evoked by at least 2 odorants or if EOGs evoked were less than 0.5 mV in

31
magnitude, the electrode was repositioned. A maximum of 3 repositions was
allowed per fish, and if conditions were not met on the third reposition, the fish
was not used. Odorant pulses were given every 2 min for concentration response
curves, and for 30 min exposures, and every 5 min for goldfish tested during the
60 d exposure (Appendix E). Fluid delivery was maintained at 6 mL/min for both
background water and odorants. To quantify odorant responses, EOG (olfactory
neuron response) peak responses were taken as the maximum change compared to
the pre-pulse baseline.
Concentration dependent responses
Increasing concentrations of the odorants L-alanine, L-serine, PGF2α, and 17,20-
P or contaminant mixtures, of MF reuse, CF/MF reuse, UV/H2O2/MF reuse or a
NCM were delivered to the olfactory epithelium in 2 s pulses, with 2 min being
left between each pulse (Appendix E). This time period is known to allow the
generator potentials of the OSNs to return to baseline [7]. EOG responses were
determined as the mean of three evoked responses.
30 min exposures
After the 10 min acclimation period, EOG responses to 2 s pulses of L-serine, L-
alanine, and 17,20-P, were evoked every 2 min (Appendix E). After 30 min
background water was switched to one of MF reuse, CF/MF reuse, UV/H2O2/MF
reuse or a NCM, and EOG responses were measured as previously stated. After
32
30 min of exposure, background water was returned and EOGs were again
measured for 30 min post-exposure.
60 d exposures
Goldfish were housed at the Gold Bar WWTP in the same manner described by
Kerr et al.[60]. This exposure period was chosen at random by collaborating
researchers. Briefly, goldfish were acclimated for 7 d to dechlorinated municipal
water before exposures to MF reuse, CF/MF reuse, and UV/H2O2/MF reuse.
Goldfish were collected throughout the 60 d exposure and returned to the
University of Alberta where EOG recordings were taken. Background water used
during EOGs matched that used in the exposure for each goldfish. EOGs
responses were determined as the mean of three evoked responses. During the
first exposure (fall 2011), EOGs were evoked using L-alanine, PGF2α, and 17,20-
P. During the second exposure (spring 2012), EOGs were evoked using L-
alanine and 17,20-P. During the third exposure (summer 2012), EOGs were
evoked using L-alanine, L-serine, and 17,20-P. Odorants were changed between
exposure periods due to the inability of PGF2α to evoke EOGs in control after 30
d during the 1st exposure.
Behavioral Experiments
Introduction of a contaminant
These experiments were conducted using methods from Tierney et al. 2011[122].
Briefly, 2 L beakers were filled with dechlorinated municipal tap water and

33
goldfish were placed inside the beaker and left to acclimate for 30 min. An inflow
line that was secured to the wall of the beaker delivered a 20 mL injection of one
of MF reuse, CF/MF reuse, UV/H2O2/MF reuse, novel odorant mixture,
dechlorinated municipal water control or solvent (ethanol) control. Goldfish
behavior was recorded using video surveillance positioned above the arena over
the 30 min acclimation and 10 min post injection. Behavior was analyzed as
distance travelled and this was determined using EthoVision XT (Noldus,
Netherlands).
30 min and 60 d exposures
Experiments were conducted as stated above, using methods from Tierney et al.
2011 [122]. Briefly, 2 L beakers were filled with one of MF reuse, CF/MF reuse,
UV/H2O2/MF reuse, a NCM, a decholrinated municipal water control or solvent
(ethanol) control and goldfish were placed inside the beaker and left to acclimate
for 30 min. The inflow line delivered a 20 mL injection of 10-3
M L-alanine,
resulting in a final concentration within the beaker of 10-5
M. Goldfish behavior
was recorded using video surveillance positioned above the arena over the 30 min
acclimation and 10 min post injection. Behavior was analyzed as distance
travelled and this was determined using EthoVision XT (Noldus, Netherlands).
Statistical Analysis
Differences in EOG responses evoked by increasing concentrations of odorants
and contaminant mixtures were determined using one-way repeated measures

34
(RM) ANOVA with Holm-Sidak post hoc tests. Differences between : different
contaminant mixtures at the same concentration; EOG responses evoked
throughout the 30 min and 60 d exposures; and distance travelled pre- and post-
exposure to a contaminant mixture or L-alanine, were determined using two-way
RM ANOVA with Holm-Sidak post hoc tests. Differences in distance travelled
between exposure groups during a 60 d exposure to treated reuse water were
determined using a three-war ANOVA with Holm-Sidak post hoc tests. All
statistical analysis was conducted using Sigma Plot 11.0 (Systat, Chicago,
Illinois).
Results
EOG concentration response curves to odorants
L-alanine and L-serine evoked EOGs in a concentration-dependent manner (L-
alanine mean values, in mV= 10-11
mean = 1.88 ± 1.36; 10-9
mean = 2.95 ± 1.64;
10-7
mean = 3.52 ± 2.26; F2 = 6.01, p=0.01;L-serine: 10-12
mean = 0.56 ± 0.21; 10-
10 0.61 ± 0.23; 10
-8 mean = 0.65 ± 0.28; 10
-6 mean = 0.86 ± 0.42; 10
-5 mean = 1.66
± 0.51; F4 = 15.0, p < 0.01) (Figure 2.1A, Figure 2.2A,B,C). L-alanine-evoked
EOGs by concentrations of 10-7
and 10-9
M were increased by 87 and 57%
respectively compared to those evoked by 10-11
M (p=0.02; p=0.04, respectively).
L-serine evoked EOGs of 10-5
, 10-6
, 10-8
, and 10-10
M were increased by 200, 54,
16, and 8.9% respectively compared to those evoked at 10-12
M (p<0.01; p<0.01;
p<0.01; p<0.01, respectively). However, L-alanine appears to be a more potent
odorant than L-serine in goldfish, as L-serine EOGs were only statistically
35
elevated at 10-5
M while those evoked by L-alanine were statistically elevated at
10-9
M.
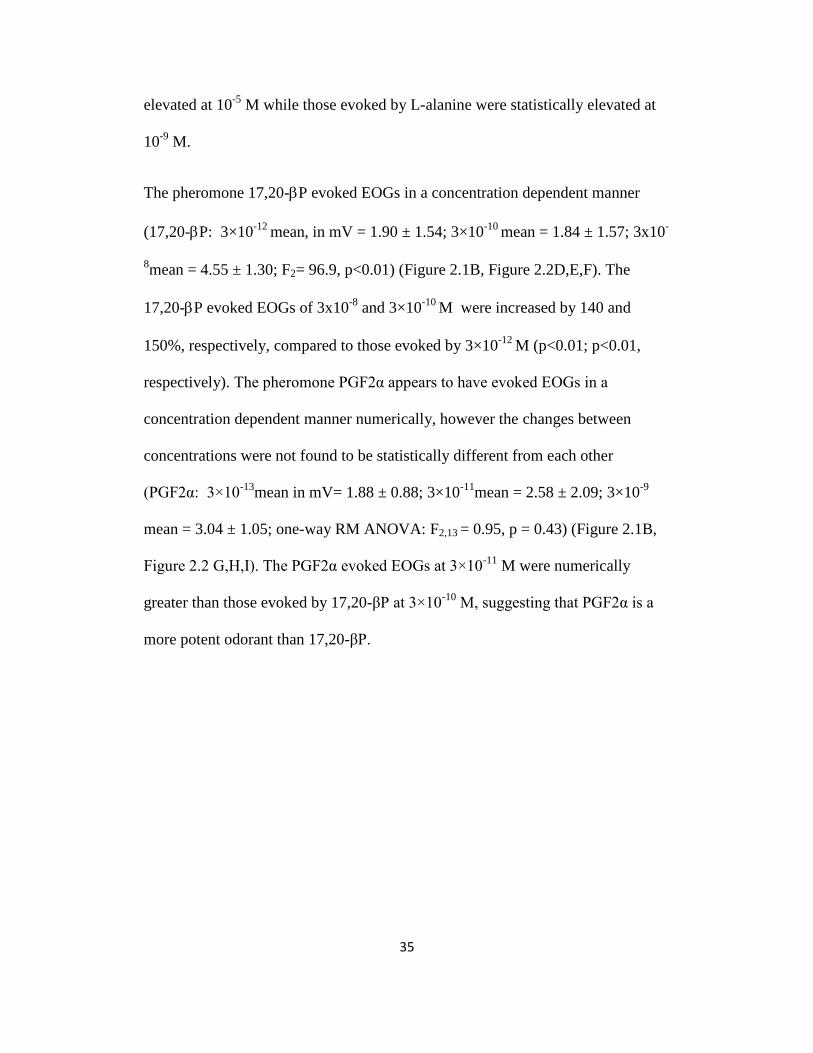
The pheromone 17,20-P evoked EOGs in a concentration dependent manner
(17,20-P: 3×10-12
mean, in mV = 1.90 ± 1.54; 3×10⁻¹⁰
mean = 1.84 ± 1.57; 3x10-
8mean = 4.55 ± 1.30; F2= 96.9, p<0.01) (Figure 2.1B, Figure 2.2D,E,F). The
17,20-P evoked EOGs of 3x10⁻⁸
and 3×10⁻¹⁰
M were increased by 140 and
150%, respectively, compared to those evoked by 3×10-12
M (p<0.01; p<0.01,
respectively). The pheromone PGF2α appears to have evoked EOGs in a
concentration dependent manner numerically, however the changes between
concentrations were not found to be statistically different from each other
(PGF2α: 3×10-13
mean in mV= 1.88 ± 0.88; 3×10-11
mean = 2.58 ± 2.09; 3×10⁻⁹
mean = 3.04 ± 1.05; one-way RM ANOVA: F2,13 = 0.95, p = 0.43) (Figure 2.1B,
Figure 2.2 G,H,I). The PGF2α evoked EOGs at 3×10-11
M were numerically
greater than those evoked by 17,20-βP at 3×10⁻¹⁰
M, suggesting that PGF2α is a
more potent odorant than 17,20-βP.
36
EO
G (
mV
)
0
1
2
3
4
5
6
a a a
a
b
c
d
d
Concentration (M)
1e-14 1e-13 1e-12 1e-11 1e-10 1e-9 1e-8 1e-7 1e-6 1e-5 1e-4
EO
G (
mV
)
0
1
2
3
4
5
6
a a
b
A
B
Figure 2.1. Concentration dependency for A) the amino acids L-serine (n =7)
and L-alanine (n =13) and B) the pheromones 17,20-P (n =5) and
PGF2α (n = 5). These graphs display EOGs evoked by increasing concentrations
of odorants presented to goldfish.

37
Figure 2.2. Sample traces for concentration dependent responses. A, B, C are
EOG traces evoked by l-alanine at concentrations of 10-12
, 10-10
, and 10-8
M,
respectively. D, E, F are EOG traces evoked 17,20-P at concentrations of 3 x
10-11
, 3x10⁻⁹
, and 3x10⁻⁷
M respectively. G, H, I are EOG traces evoked by
PGF2α at concentrations of 3 x 10-12
, 3x10⁻¹⁰
, and 3x10⁻⁸
M respectively. The
legend indicates measurement of time and peak amplitude.EOG concentration
response curves to contaminant mixtures
A

38
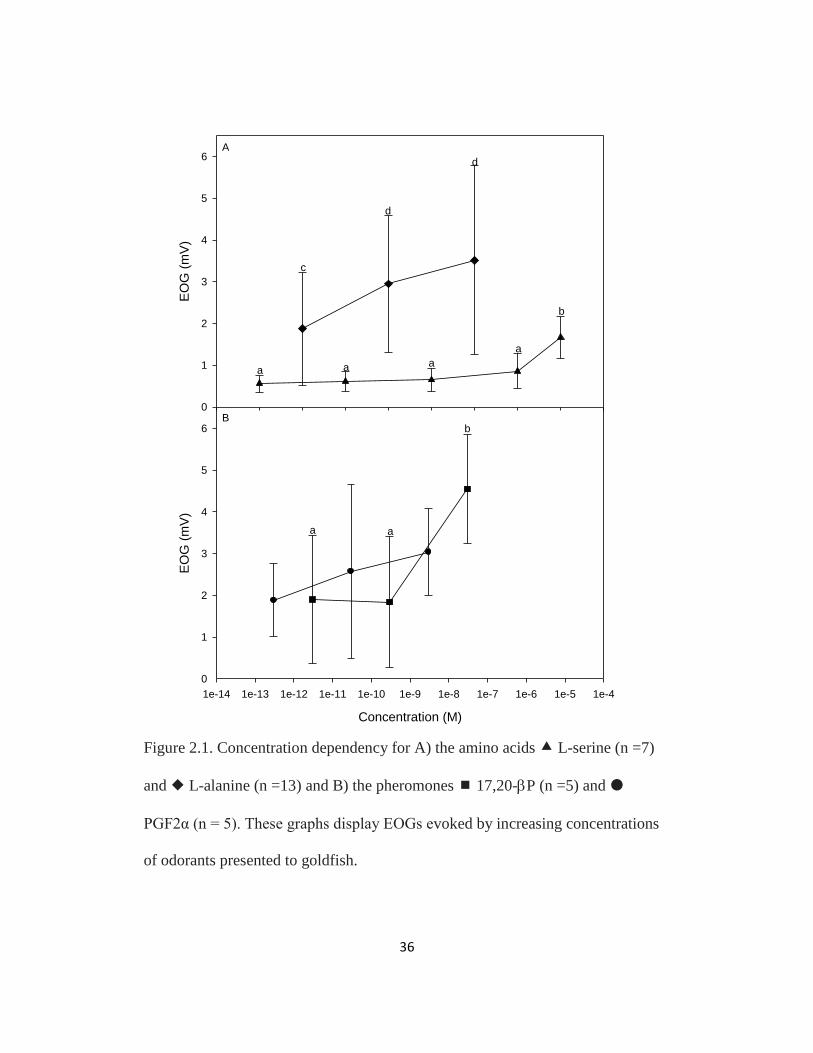
The EOGs evoked by increasing concentrations of MF, CF/MF, and
UV/H2O2/MF reuse occurred in a concentration-dependent manner while those
evoked by a NCM did not (MF reuse: 100% mean, in mV = 7.46 ± 3.11; 50%
mean = 6.02 ± 2.07; 10% mean = 2.85 ± 0.73; 1% mean = 2.32 ± 0.59; 0.1%
mean = 1.18 ±0.46; CF/MF reuse: 100% mean = 4.96 ± 1.96; 50% mean = 4.55 ±
1.80; 10% mean = 2.26 ± 1.14; 1% mean = 2.07 ± 0.92; 0.1% mean = 1.54 ± 0.85;
UV/H2O2/UV reuse: 100% mean = 5.81 ± 2.98; 50% mean = 3.75 ± 2.38;10%
mean = 1.47 ± 0.52; 1% mean = 1.05 ± 0.71; 0.1% mean = 0.86 ± 0.53; F4,139 =
63.7, p < 0.01; F4,139 = 63.7, p < 0.01; Figure 2.3). However, if NCM is analyzed
on its own, concentration-dependence is seen (F4 = 7.26, p < 0.01) (Figure 2.4).
The reason for the lack of significance is likely that the NCM EOGs were much
lower. EOG responses were lowest at a 0.001% dilution of all forms of treated
reuse, and greatest at 50 and 100% dilutions. In general, EOG magnitudes can be
ordered MF reuse > CF/MF or UV/H2O2/MF reuse> NCM (100% dilutions
means, in mV: 7.46 ± 3.11; 4.96 ± 1.96; 5.81 ± 2.98; 1.11 ± 0.26 mV,
respectively; F3,139 = 9.68, p < 0.01; Figure 2.3).
39
Concentration (%dilution)
0.1 1 10 100
EO
G (
mV
)
0
2
4
6
8
10
a
abb
c
d
ee
e
ff
gg
g
h
i
3
1,2
1
2
1
3
1,2
2
Figure 2.3. Concentration response curves to MF reuse (n = 7), CF/MF reuse
(n = 8), UV/H2O2/MF reuse (n = 8) and a NCM (n = 6). This graph displays
EOGs evoked by increasing concentrations of treated reuse and NCM presented
to goldfish.

40
Concentration (%)
0.01 0.1 1 10 100
EO
G (
mV
)
0.2
0.4
0.6
0.8
1.0
1.2
a
ab
ab
bc
c
Figure 2.4. Concentration response curve to a NCM ( n = 6). This graph displays
EOGs evoked by increasing concentrations of an NCM presented to goldfish.

41
EOG responses to L-alanine during a 30 minute exposure to treated reuse water
L-alanine-evoked EOGs were compared to both pre-exposure and control EOGs
throughout a 30 min exposure to MF, CF/MF, UV/H2O2/MF reuse, NCM (0.1 and
100%) and a solvent control. Pre-exposure EOGs did not differ between exposure
groups (F6= 1.41, p=0.23;Figure 2.5). The EOGs evoked from MF reuse exposed
goldfish were decreased on average by 72% compared to pre-exposure throughout
the 30 min exposure (F9,425 = 13.7, p < 0.01; Table 2.2). EOGs evoked by CF/MF
reuse and NCM (0.1 and 100%) exposed goldfish were numerically decreased by
an average of 33 and 46 respectively. throughout the exposure compared to pre-
exposure; however they did not differ statistically. UV/H2O2/MF reuse and
solvent control exposed goldfish had EOGs that were numerically increased by an
average of 22 and 63%, respectively, when compared to pre-exposure throughout
the 30 min exposure. EOGs evoked by 0.1% NCM exposed goldfish increased on
average by 47% from pre-exposure. All other exposure groups returned to pre-
exposure EOG values. Exposure groups did not differ compared to controls on
average throughout the exposure (F6,425 = 2.33, p = 0.05). EOGs evoked by MF
reuse exposed goldfish at 20 and 26 min into the exposure were decreased by 82
and 83%, respectively, compared to controls (F54,425 = 1.79, p < 0.01; p = 0.04,
0.01, respectively). No other exposure groups differed from controls at specific
time points during the exposure (Table 2.2). In general, MF reuse-exposed

42
Exposure Group
Control Methanol Reuse Carbon H2O2 Mixture 0.1
EO
G (
mV
)
0
1
2
3
4
5
Figure 2.5 Pre-exposure EOG responses before a 30 min exposure to treated reuse
water or a NCM. No difference was found in pre-exposure EOGs evoked by L-
alanine, L-serine and 17,20-

43
Table 2.2
Odorant Exposure
group
Time Comparison with
pre-exposure (p-
value)
Comparison
with control (p-
value)
L-alanine MF reuse
CF/MF Reuse
UV/H2O2/MF
Reuse
NCM
2
8
14
20
26
32
38
44
50
2
8
14
20
26
32
38
44
50
2
8
14
20
26
32
38
44
50
2
8
14
20
26
32
38
0.02
0.02
0.01
0.01
0.01
0.68
0.72
0.55
0.59
0.62
0.67
0.67
0.68
0.57
0.80
0.69
0.71
0.78
0.63
0.57
0.58
0.44
0.52
<0.1
<0.1
<0.1
0.08
0.56
0.57
0.43
0.51
0.57
0.91
0.98
0.19
0.26
0.14
0.05
0.01
0.96
0.96
0.89
0.56
0.57
0.66
0.58
0.43
0.46
0.98
0.99
0.81
0.58
0.81
0.88
0.94
0.85
0.85
0.46
0.44
0.31
0.67
0.69
0.66
0.48
0.39
0.15
0.96
0.97

44
0.1% NCM
Solvent
Control
44
50
2
8
14
20
26
32
38
44
50
2
8
14
20
26
32
38
44
50
0.97
0.95
0.95
0.77
0.81
0.97
0.95
0.94
0.35
0.26
0.20
0.25
0.23
0.09
0.27
0.27
0.30
0.22
0.35
0.24
0.75
0.53
0.75
0.85
0.47
0.64
0.41
0.97
0.99
0.83
0.74
0.66
0.66
0.46
0.64
0.80
0.86
0.93
0.86
0.85
17,20-P MF reuse
CF/MF Reuse
UV/H2O2/MF
Reuse
4
10
16.00
22.00
28.00
34.00
40
46
4
10
16.00
22.00
28.00
34.00
40
46
4
10
16.00
<0.01
<0.01
<0.01
<0.01
<0.01
0.68
0.47
0.61
0.02
0.01
0.03
0.00
0.03
0.33
0.55
0.83
<0.01
<0.01
<0.01
<0.01
<0.01
<0.01
<0.01
<0.01
0.12
0.08
0.02
0.05
<0.01
0.02
<0.01
0.03
0.51
0.29
0.16
<0.01
<0.01
<0.01

45
NCM
0.1% NCM
Solvent
Control
22.00
28.00
34.00
40
46
4
10
16.00
22.00
28.00
34.00
40
46
4
10
16.00
22.00
28.00
34.00
40
46
4
10
16.00
22.00
28.00
34.00
40
46
<0.01
<0.01
0.95
0.93
0.92
0.21
0.05
<0.01
0.03
0.22
0.99
1.00
1.00
0.95
0.93
0.99
1.00
0.96
0.95
0.92
0.14
0.67
0.73
0.06
0.58
0.63
0.95
0.96
0.89
<0.01
<0.01
0.27
0.21
0.18
0.17
0.01
0.01
<0.01
0.06
0.44
0.22
0.09
0.31
0.24
0.35
0.25
0.65
0.60
0.26
0.14
0.28
0.06
0.04
0.05
0.09
0.50
0.37
0.14
L-serine MF reuse
CF/MF Reuse
6
12
18
24
30
36
42
48
6
0.80
0.91
0.91
0.92
0.93
0.90
0.93
0.93
0.99
0.80
0.91
0.91
0.92
0.93
0.90
0.93
0.93
0.93

46
UV/H2O2/MF
Reuse
NCM
0.1% NCM
Solvent
Control
12
18
24
30
36
42
48
6
12
18
24
30
36
42
48
6
12
18
24
30
36
42
48
6
12
18
24
30
36
42
48
6
12
18
24
30
36
42
0.97
0.95
0.74
0.96
0.89
0.91
0.99
0.21
0.24
0.10
0.22
0.03
0.20
0.32
0.03
0.99
0.97
0.86
0.96
0.57
1.00
0.99
0.99
0.92
0.88
0.96
0.82
0.75
0.85
0.86
0.78
0.99
0.99
0.93
0.90
0.74
0.97
0.96
0.90
0.98
0.99
0.86
1.00
0.82
0.61
0.90
0.93
0.90
0.91
0.80
0.99
0.75
0.52
0.82
0.95
0.89
0.90
0.93
0.99
0.88
0.68
0.79
0.81
0.89
0.64
0.78
0.99
0.64
0.68
0.79
0.80
0.88
0.79
0.74
0.98
0.82
47
48
0.99
0.60
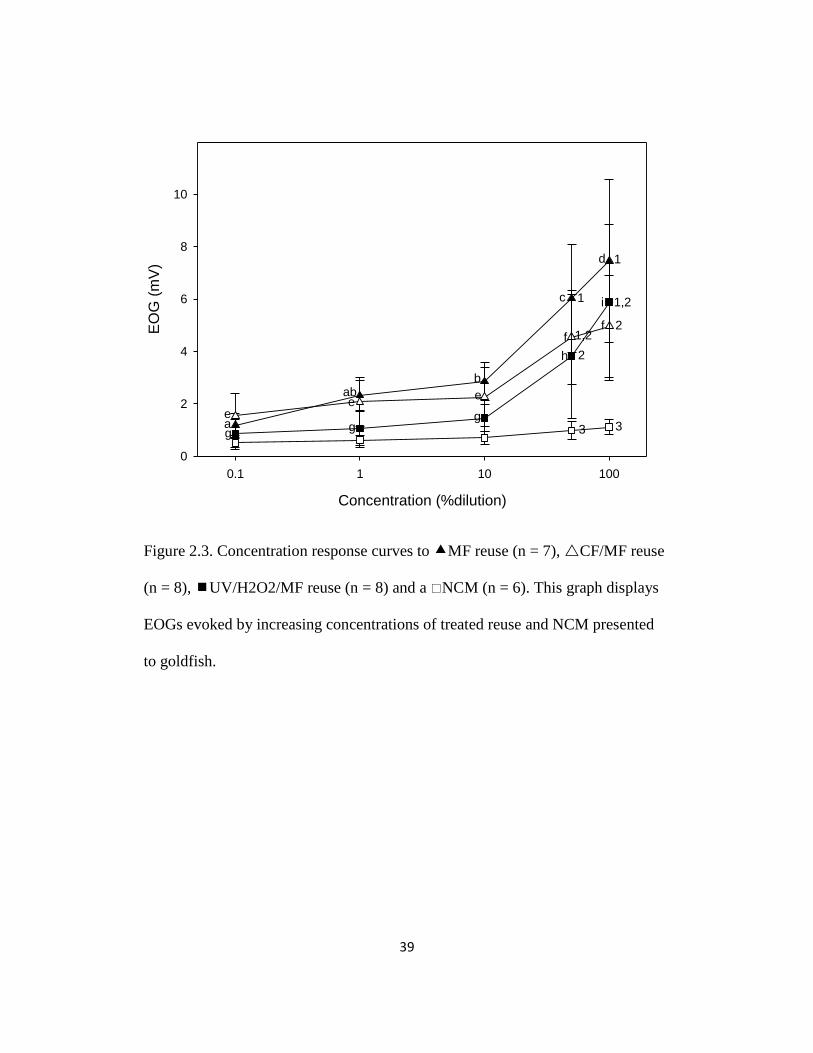
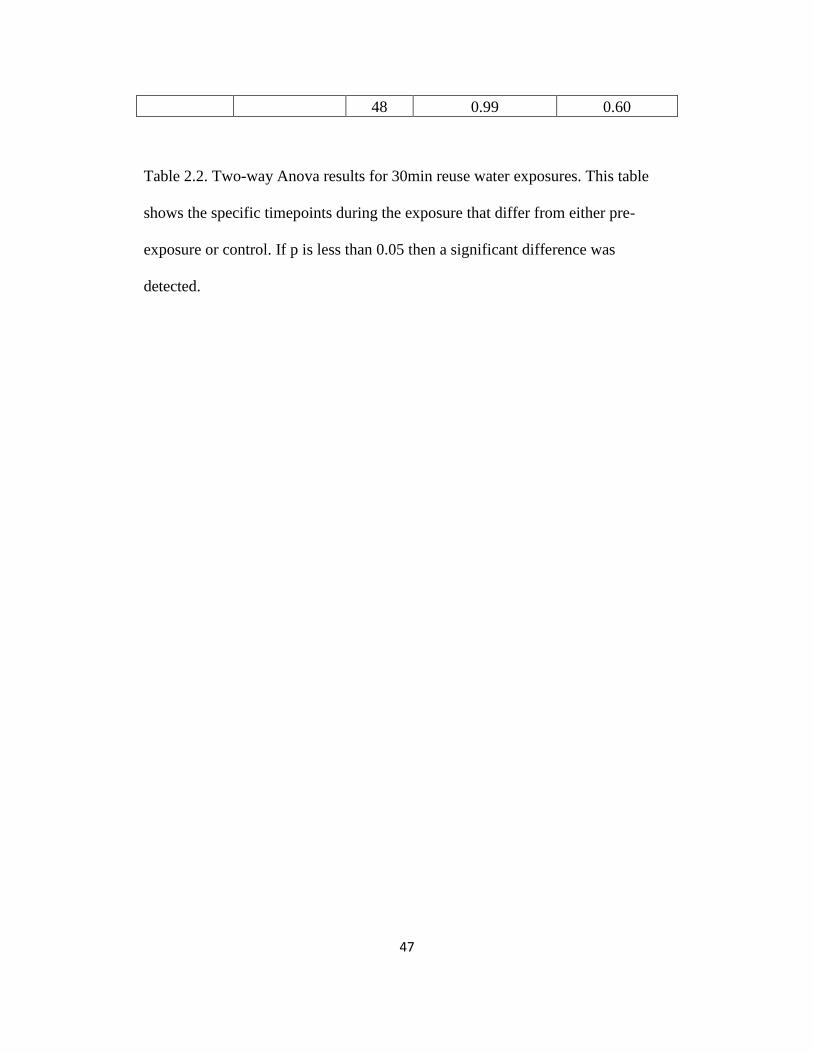
Table 2.2. Two-way Anova results for 30min reuse water exposures. This table
shows the specific timepoints during the exposure that differ from either pre-
exposure or control. If p is less than 0.05 then a significant difference was
detected.

48
goldfish experienced larger decreases in L-alanine evoked EOGs than any other
exposure groups.
EOG responses to L-serine during a 30 min exposure to treated reuse water
L-serine evoked EOGs were compared to both pre-exposure and control EOGs
throughout a 30 min exposure to MF, CF/MF, UV/H2O2/MF reuse, NCM (0.1 and
100%) and a solvent control. Pre-exposure EOGs did not differ between exposure
groups (F6 = 1.13, p = 0.36; Figure 2.5). Exposure groups did not differ
statistically from pre-exposure groups or controls throughout the 30 min exposure
(F8,371 = 1.84, p = 0.07; F6,371 = 1.12, p = 0.37, respectively; Figure 2.6B). MF
reuse and 0.1% NCM, exposed goldfish were numerically decreased from pre-
exposure by an average of 33 and 22%, respectively, throughout the 30 min
exposure. CF/MF and UV/H2O2/MF reuse and 100% NCM exposed goldfish
were numerically increased from pre-exposure by an average of 20, 63, and 25%
respectively throughout the 30 min exposure. MF and solvent control exposed
goldfish were numerically increased by an average of 47 and 36%, respectively,
compared to controls throughout the 30 min exposure; while goldfish exposed to
UV/H2O2/MF reuse increased on average by 28%. All exposure groups returned
to pre-exposure and control values during the recovery period. No exposure
groups differed from controls at any specific time point during the exposure
(F48,371 = 0.76, p = 0.87; Table 2.2). In general MF reuse, exposed goldfish
experienced larger decreases in L-serine evoked EOGs than any other exposure
group.
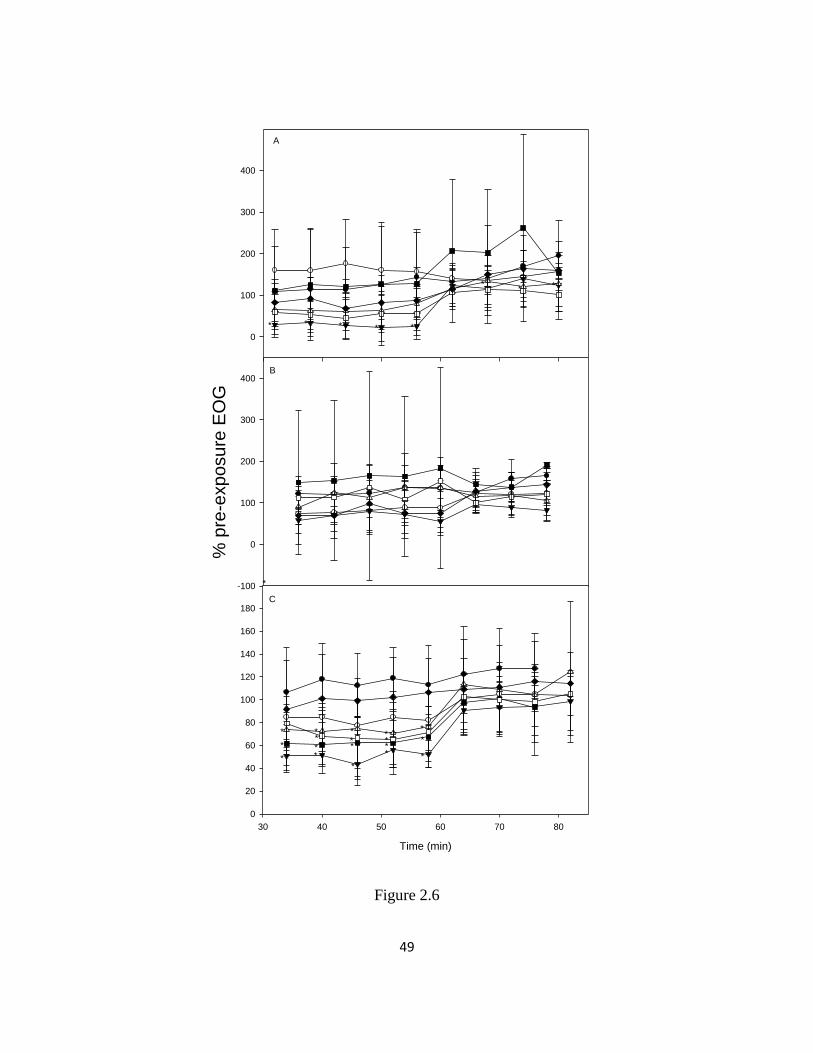
49
** *
* * * * *
A
B
*
0
100
200
300
400
% p
re-e
xposure
EO
G
-100
0
100
200
300
400
Time (min)
30 40 50 60 70 80
0
20
40
60
80
100
120
140
160
180
* *
*
* *
*
* *
** * **
* ****
C
Figure 2.6
50
Figure 2.6. EOG responses during a 30 min exposure to treated reuse water and a
NCM. A) EOG responses to L-alanine during a 30 min exposure to MF reuse (n
= 8), CF/MF reuse (n = 8), UV/H2O2/MF reuse (n = 8), a NCM (n = 6),
0.1%NCM (n = 6), solvent control (n = 5), or a dechlorinated water control
(n =6); B) EOG responses to L-serine during a 30 min exposure to MF reuse (n
= 6), CF/MF reuse (n = 9), UV/H2O2/MF reuse (n = 8), a NCM (n = 6),
0.1%NCM (n = 6), solvent control (n = 5), or a dechlorinated water control
(n = 5); C) EOG responses to 17,20- MF reuse
(n = 9), CF/MF reuse (n = 9), UV/H2O2/MF reuse (n = 8), a NCM (n = 6),
0.1%NCM (n = 6), solvent control (n = 5), or a dechlorinated water control
(n = 5). Significant differences from pre-exposure EOG values are denoted with
an asterisk.

51
EOG responses to 17, 20-βP during a 30 min exposure to treated reuse water
The 17,20-βP-evoked EOGs were compared to both pre-exposure and control
EOGs throughout a 30 min exposure to MF, CF/MF, UV/H2O2/MF reuse, NCM
(0.1 and 100%) and a solvent control. Pre-exposure EOGs did not differ between
exposure groups (F6 = 0.63, p = 0.70) (Figure 2.5). MF, CF/MF and
UV/H2O2/MF reuse and 100% NCM exposed goldfish 17,20-βP-evoked EOGs
were decreased by an average of 49, 26, 37 and 30%, respectively, compared to
pre-exposure EOGs throughout the 30 min exposure (F8,414 = 22.8, p < 0.01;
Figure 2.6). Both solvent control and 0.1% NCM exposed goldfish, 17,20-βP-
evoked EOGs appeared to be unaffected. In MF, CF/MF and UV/H2O2/MF reuse
and 100%NCM exposed goldfish, 17,20-βP-evoked EOGs were decreased by an
average of 55, 35, 63 and 38%, respectively, compared to control EOGs
throughout the 30 min exposure (F6,414 = 5.34, p < 0.01) (Table 2.2). In solvent
control exposed goldfish, 17,20-βP-evoked EOGs were decreased numerically by
an average of 27% compared to control EOGs throughout the 30 min exposure.
All exposure groups 17,20-βP-evoked EOGs returned to pre-exposure and control
values during the recovery period (Figure 2.6, Table 2.2). Time points that
differed significantly from pre-exposures and controls can be found in table 2.2
(overall: F48,414 = 1.47, p = 0.03). In general, MF reuse exposed goldfish
experienced the largest decreases in EOGs, though they were comparable to those
of CF/MF and UV/H2O2 reuse and 100% NCM exposed goldfish, while 0.1%
NCM and solvent control exposed goldfish EOGs were not affected.

52
EOG responses to amino acids and pheromones over 30 and 60 d exposures
Changes to EOG responses evoked by the AAs L-alanine and L-serine and the
pheromones PGF2α were measured during exposure to MF, CF/MF and
UV/H2O2/MF reuse throughout three different seasons (fall 2011, spring 2012,
and summer 2012). L-alanine and 17,20-βP were measured during each of the
time periods while L-serine was only measured during summer 2012 and PGF2α
was only measured during fall 2011. Differences in EOGs evoked by the AAs and
pheromones are described below.
Overall, EOGs evoked by L-alanine and 17,20-βP decreased due to exposure to
treated reuse water; however, recovery was observed in some exposure groups,
depending on the season. L-serine and PGF2α trends were not similar between
exposure groups, and could not be compared between seasons as they were only
collected during the summer and fall.
EOG responses to L-alanine, PGF2α, and 17,20-βP during a 30 d exposure to
treated reuse water: Fall 2011
Goldfish exposed to UV/H2O2/MF reuse experienced the largest decreases in
EOGs at 7 and 30 d for all odorants, while those exposed to CF/MF reuse saw
initial decreases at 7 d that began to recover by 30 d into the exposure. MF reuse
exposed goldfish did not follow a simple pattern as explained above, with L-
alanine and PGF2α EOGs decreasing over time; while those evoked by 17,20-βP
were not affected. Sample traces are shown in figure 2.8.

53
L-alanine-evoked EOGs at 7 and 30 d into the exposure did not differ (Figure
2.6A, Table 2.3). L-alanine-evoked EOGs in goldfish exposed to MF reuse
decreased numerically at d 30 compared to 7 d by 50%, while those evoked by
goldfish exposed to CF/MF reuse increased numerically at 30 d compared to 7 d
by 55%. L-alanine-evoked EOGs in goldfish exposed to UV/H2O2/MF reuse were
decreased by 50% (Figure 2.7A, Table 2.3).
PGF2α-evoked EOGs at 7 and 30 d into the exposure did not differ (Figure 2.6B,
Table 2.3). PGF2α-evoked EOGs in goldfish exposed to both MF and
UV/H2O2/MF reuse decreased numerically at 30 d compared to 7 d by 41 and
23%, respectively (Figure 2.7B, Table 2.3). PGF2α-evoked EOGs in goldfish
exposed to CF/MF reuse increased numerically at 30 d compared to 7 d by 90%.
17,20-βP-evoked EOGs at 7 and 30 d into the exposure did not differ (Figure
2.6C Table 2.3). The 17,20-βP-evoked EOGs in goldfish exposed to CF/MF reuse
increased numerically at 30 d compared to 7 d by 39% (Figure 2.7C, Table 2.3).

54
0
1
2
3
A
EO
G (
mV
)
0.0
0.5
1.0
1.5
2.0
2.5
Treatment
control MF CF/MFUV/H2O2/MF
0
1
2
3
B
C
a
b
Figure 2.7.

55
Figure 2.7. EOG responses during a 30 d exposure to treated reuse water during
fall 2011. A) EOG responses to L-alanine at 7 and 30 ds into exposures to
MF reuse (n = 3; n = 3, respectively), CF/MF reuse (n = 3; n = 8, respectively),
UV/H2O2/MF reuse (n =4; n =2, respectively) and controls (n = 5); B) EOG
responses to PGF2α at 7 and 30 ds into exposures to MF reuse (n = 2; n = 8,
respectively), CF/MF reuse (n = 4; n = 6, respectively), UV/H2O2/MF reuse (n =
3; n = 4, respectively) and controls (n =4); C) EOG responses to 17,20-P at 7
and 30 ds into exposures to MF reuse (n = 5; n = 8, respectively), CF/MF reuse
(n = 3; n = 8, respectively), UV/H2O2/MF reuse (n =4; n =5, respectively) and
controls (n = 5). Significant differences within exposure groups are denoted by
different letters.

56
Figure 2.8

57
Figure 2.8. Sample traces of EOGs collected during 30 d exposure to treated reuse
water. Red traces are those of exposed fish, while those in black are those of
controls collected during the same time points. A) Comparison of L-alanine
evoked EOGs between MF/CF reuse exposed fish at 30d and controls. B)
Comparison of 17,20-βP evoked EOGs between UV/H2O2/MF reuse exposed fish
at 30d and controls. C) Comparison of PGF2α evoked EOGs between MF reuse
exposed fish at 7d and controls.

58
Table 2.3
Odorant Reuse Treatment Comparison t p
L-alanine MF reuse
CF/MF reuse
UV/H2O2/MF
reuse
control vs 7d
control vs 30d
7d vs 30d
control vs 7d
control vs 30d
7d vs 30d
control vs 7d
control vs 30d
7d vs 30d
0.44
1.4
1.4
1
0.51
-1.2
0.78
1.2
5
0.68
0.23
0.23
0.34
0.62
0.25
0.46
0.29
<0.01
17,20-bP MF reuse
CF/MF reuse
UV/H2O2/MF
reuse
control vs 7d
control vs 30d
7d vs 30d
control vs 7d
control vs 30d
7d vs 30d
control vs 7d
control vs 30d
7d vs 30d
0.49
0.19
-0.48
0.74
-0.62
-1.1
1.2
1.8
0.59
0.64
0.85
0.64
0.49
0.55
0.3
0.27
0.11
0.58
PGF2α MF reuse
CF/MF reuse
UV/H2O2/MF
reuse
control vs 7d
control vs 30d
7d vs 30d
control vs 7d
control vs 30d
7d vs 30d
control vs 7d
control vs 30d
7d vs 30d
-0.36
1.5
-1.9
1.6
-0.28
-1.9
0.78
1.6
1.3
0.74
0.18
0.09
0.15
0.79
0.09
0.47
0.15
0.25

59
Table 2.3. T-test results for 30d reuse water exposures. Goldfish exposed to
UV/H2O2/MF reuse display a significant difference between EOGs evoked at 7
and 30 d into the exposures. All other comparisons were not significantly
different.

60
EOG responses to L-alanine and 17,20-βP during a 60 d exposure to treated
reuse water: Spring 2012
MF reuse exposed goldfish appeared to recover responses to L-alanine over time
while those to 17,20-P were decreased throughout the exposure. CF/MF reuse
exposed goldfish did not experience the same initial decrease in L-alanine-evoked
EOGs experienced by other groups during the 1-20 d period; however these EOGs
decreased after this period and showed no sign of recovery. CF/MF reuse exposed
goldfish did not display a general trend for 17,20-βP-evoked EOGs.
UV/H2O2/MF reuse exposed goldfish experienced an initial decrease in EOGs
evoked by both L-alanine and 17,20-βP; however, by the end of the 60 d period
recovery of these EOGs was apparent.
When L-alanine-evoked EOGs were compared at the same time points during the
exposure, no statistical difference was found between goldfish exposed to MF,
CF/MF and UV/H2O2/MF reuse and controls (F6,69 = 1.43, p = 0.22; Figure 2.7A).
MF reuse exposed goldfish differed numerically from controls throughout the
exposure, with EOGs decreased compared to controls at 1-20 d into the exposure
by 24% ; however, EOGs were increased at 21-40 d into the exposure by 110%
compared to controls. CF/MF reuse exposed goldfish had L-alanine EOGs that
were numerically decreased at 41-60 d into the exposure by 47% compared to
controls; however, L-alanine EOGs were numerically increased at 21-40 d into
the exposure by 38%, compared to controls. UV/H2O2/MF reuse exposed goldfish
differed numerically from controls throughout the exposure, EOGs decreased at

61
1-20 d into the exposure by 54.% , compared to controls. No difference was found
between goldfish exposed to MF, CF/MF and UV/H2O2/MF reuse when
compared at the same time points or across time points within the same exposure
group (F4,55 = 1.76, p = 0.15; Figure 2.9A). It should be noted that controls
experienced a large decrease in EOGs to L-alanine at 21-40 d into the exposure
that cannot be explained, but does account for some groups numerically increased
at this time point.
When 17,20-βP-evoked EOGs were compared at the same time points during the
exposure, no statistical difference was found between goldfish exposed to MF,
CF/MF and UV/H2O2/MF reuse and controls (F3,41 = 1.12, p = 0.36; Figure 2.7B).
MF reuse exposed goldfish differed numerically from controls at 1-20 and 21-40
d into the exposure, with decreases of 33 and 43%, respectively. CF/MF exposed
goldfish differed numerically from controls at 21-40 d into the exposure, with a
decrease of 31%. UV/H2O2/MF reuse exposed goldfish differed numerically from
controls with EOGs decreased by 61.7% at 1-20 d into the exposure and increased
by 27.5% at 21-40 d into the exposure. No difference in 17,20-βP-evoked EOGs
were found between exposure groups within the same time period or within the
same exposure group across time points (F4,51 = 1.18, p = 0.34; Figure 2.9B).

62
EO
G (
mV
)
0
1
2
3
4
Exposure group
control MF CF/MFUV/H2O2/MF
0
1
2
3
A
B
Figure 2.9.

63
Figure 2.9. EOG responses during a 60 d exposure to treated reuse water during
spring 2012. A) EOG responses to L-alanine at 1-20, 21-40, and 41-60 ds
into the exposures to MF reuse (n = 5; n = 4; n = 9, respectively), CF/MF reuse (n
= 5; n = 5; n = 10, respectively), H2O2/MF reuse (n = 4; n = 5; n = 9,
respectively), and controls (n = 4; n = 5; n = 5, respectively); B) EOG responses
to 17,20- 1-20, 21-40, and 41-60 ds into the exposures to MF reuse
(n = 5; n = 5; n = 7, respectively), CF/MF reuse (n = 7; n = 6; n = 9, respectively),
H2O2/MF reuse (n = 4; n = 4; n = 5, respectively), and controls (n = 3; n = 8, n =
1 (not included) respectively).

64
EOG responses to L-alanine during a 60 d exposure to treated reuse water:
Summer 2012
A 60 d exposure to MF, CF/MF and UV/H2O2/MF reuse result in decreased EOG
responses to L-alanine-, L-serine-, and 17,20-βP-evoked EOGs. MF reuse
exposed goldfish had the largest decreases, while those exposed to CF/MF reuse
displayed the smallest decreases. L-serine appeared to be the odorant that was
least affected by the exposures, while L-alanine appeared to be the most affected.
A 60 d exposure to MF, CF/MF and UV/H2O2/MF reuse, decreased EOGs evoked
by L-alanine compared to controls at the same time points (F6 = 3.29, p < 0.01;
Figure 2.8A). In MF reuse exposed goldfish EOG responses to L-alanine were
statistically decreased at 21-40 and 41-60 d into the exposure by 71 and 60%,
respectively, compared to controls (Figure 2.8A,). CF/MF reuse exposed goldfish
EOG responses to L-alanine were statistically decreased at 21-40 and 41-60 d into
the exposure by 70 and 80%, respectively, compared to controls; however, EOGs
at 1-20 d into the exposure were numerically decreased by 20% compared to
controls. UV/H2O2/MF reuse exposed goldfish EOG responses to L-alanine
decreased statistically at 1-20, 21-40, and 41-60 d into the exposure by 60, 65, and
47%, respectively, compared to controls.
MF, CF/MF and UV/H2O2/MF reuse exposed goldfish had decreased L-alanine-
evoked EOGs between time points during the exposure (F4,70 = 5.64, p < 0.01).
MF reuse exposed goldfish had L-alanine EOGs at 21-40 d into the exposure that
were statistically decreased by 61% compared to those evoked at 1-21 d into the
65
exposure (p < 0.01); while those evoked at 41-60 d into the exposure were
numerically decreased by 33% compared to 1-20 d into the exposure, and
numerically increased by 72% compared to 21-40 d into the exposure. CF/MF
exposed goldfish had L-alanine EOGs at 21-40 and 41-60 d into the exposure that
were statistically decreased by 48 and 55% respectively compared to those
evoked at 1-20 d into the exposure (p = 0.07, 0.09, respectively). UV/H2O2/MF
reuse exposed goldfish had L-alanine EOGs at 1-20 and 21-40 d into the exposure
that were statistically decreased by 57 and 48%, respectively, compared to those
evoked at 41-60 d into the exposure (p = 0.02, < 0.01, respectively); while those
evoked at 21-40 d into the exposure were numerically decreased by 48%
compared to those at 41-60 d.
L-alanine-evoked EOGs differed between exposure groups at the same time
points during a 60 d exposure to MF, CF/MF and UV/H2O2/MF reuse (F4,70 =
5.64, p < 0.01). UV/MF reuse exposed goldfish had statistically decreased L-
alanine EOGs at 1-20 d into the exposure by 62 and 50% compared to MF and
CF/MF reuse exposed goldfish, respectively (p: < 0.01, 0.02, respectively), while
those evoked from CF/MF exposed goldfish were numerically decreased at 1-20 d
into the exposure by 24% compared to those exposed to MF reuse. CF/MF reuse
exposed goldfish had L-alanine EOGs at 41-60 d into the exposure that were
statistically decreased by 61% compared to goldfish exposed to UV/H2O2/MF
reuse (p < 0.01); while those evoked by MF reuse exposed goldfish were
numerically increased by 94 and 24% compared to CF/MF and UV/H2O2/MF
reuse exposed goldfish.

66
0
1
2
3
*e*e
*f
*d
*d*b
*ab
a
c
A
EO
G (
mV
)
0
1
2
3
4
B
Exposure group
Control MF CF/MFUV/H2O2/MF
0
2
4
6
8
C
Figure 2.10

67
Figure 2.10. EOG responses during a 60 d exposure to treated reuse water during
spring 2012. A) EOG responses to L-alanine at 1-20, 21-40, and 41-60 ds
into the exposures to MF reuse (n = 4; n = 10; n = 9, respectively), CF/MF reuse
(n = 9; n = 11; n = 6, respectively), H2O2/MF reuse (n = 8; n = 7; n = 7,
respectively), and controls (n = 7; n = 6; n = 3, respectively); B) EOG responses
to L-serine at 1-20, 21-40, and 41-60 ds into the exposures to MF reuse (n
= 9; n = 8; n = 8, respectively), CF/MF reuse (n = 8; n = 11; n = 6, respectively),
H2O2/MF reuse (n = 6; n = 9; n = 7, respectively) and controls (n = 7; n = 9, n =
4, respectively); C) EOG responses to 17,20- 1-20, 21-40, and 41-60
ds into the exposures to MF reuse (n = 9; n = 9; n = 9, respectively), CF/MF reuse
(n = 9; n = 11; n = 7, respectively), H2O2/MF reuse (n = 7; n = 9; n = 7,
respectively), and controls (n = 6; n = 8, n = 4 respectively). Differences from
control are denoted with an asterisk and differences within groups between time
points are denoted with different letters.
EOG responses to L-serine during a 60 d exposure to treated reuse water:
Summer 2012
A 60 d exposure to MF, CF/MF and UV/H2O2/MF reuse, did not result in
statistically decreased EOGs evoked by L-serine compared to controls at the same
time points (F6,91 = 1.40, p = 0.22; Figure 2.10B). MF reuse exposed goldfish had
L-serine evoked EOGs at 1-20, 21-40, and 41-60 d into the exposure that were
decreased numerically by 29, 33, and 32%, respectively, compared to controls.
CF/MF reuse exposed goldfish had L-serine evoked EOGs at 21-40, and 41-60 d

68
into the exposure that were numerically decreased by 36 and 27% respectively
compared to controls, while those evoked at 1-20 d into the exposure were
numerically increased by 50% compared to controls. UV/H2O2/MF reuse exposed
goldfish had L-serine evoked EOGS that 1-20, 21-40, and 41-60 d into the
exposure that were numerically decreased by 45, 38, and 31%, respectively,
compared to controls.
L-serine-evoked EOGs did not differ statistically within exposure groups
between time points (F4,71 = 2.06, p = 0.10; Figure 2.10B). MF reuse exposed
goldfish had L-serine EOGs at 41-60 d into the exposure were numerically
decreased by 53% compared to those at 21-40 d into the exposure; while those
evoked at 41-60 d into the exposure were also numerically decreased by 46%
compared to those evoked at 1-20 d into the exposure. CF/MF reuse exposed
goldfish had L-serine EOGS at 21-40 and 41-60 d into the exposure that were
numerically decreased by 48 and 73%, respectively, compared to 1-20 d into the
exposure, while those evoked at 41-60 d into the exposure were also numerically
decreased by 47% compared to those evoked at 21-40 d into the exposure.
UV/H2O2/MF reuse exposed goldfish had L-serine EOGs at 1-20 and 41-60 d into
the exposure that were numerically decreased by 27 and 48%, respectively,
compared to those evoked at 21-40 d into the exposure, while those evoked at 41-
60 d into the exposure were also numerically decreased by 28% compared to
those evoked at 1-20 d into the exposure.

69
L-serine-evoked EOGs did not differ statistically between exposure groups at the
same time points during a 60 d exposure to MF, CF/MF and UV/H2O2/MF reuse
(F4,71 = 2.06, p = 0.10; Figure 2.10B). MF reuse and UV/H2O2/MF reuse exposed
goldfish had L-serine EOGs at 1-20 d into the exposure that were numerically
decreased by 52 and 63%, respectively, compared to those exposed to CF/MF
reuse; while those evoked by UV/H2O2/MF reuse exposed goldfish were also
numerically decreased by 23% compared to MF reuse exposed goldfish.
EOG responses to 17α,20-20-dihydroxy-pregnen-3-one during a 60 d exposure
to treated reuse water: Summer 2012
A 60 d exposure to MF, CF/MF and UV/H2O2/MF reuse, did not result in
statistically decreased EOGs evoked by 17,20- P compared to controls at the
same time points (F6,94 = 0.30, p= 0.93; Figure 2.10C). UV/H2O2/MF reuse
exposed goldfish had 17,20-βP-evoked EOGs at 1-20 into the exposure that were
numerically decreased by 26 % compared to controls.
17,20-βP-evoked EOGs did not differ statistically within exposure groups
between time points (F4,76 = 0.40, p = 0.81; Figure 2.10C). MF reuse exposed
goldfish had 17,20-βP-evoked EOGs at 21-40 and 41-60 d into the exposure were
numerically decreased by 48 and 53% compared to those evoked at 1-20 d into
the exposure. CF/MF reuse exposed goldfish had 17,2-βP-evoked EOGs at 21-40
and 41-60 d into the exposure that were numerically decreased by 38 and 49%,
respectively, compared to those at 1-20 d into the exposure. UV/H2O2/MF reuse
exposed goldfish had 17,20-βP-evoked EOGs at 21-40 and 41-60 d into the

70
exposure that were numerically decreased by 29 and 36%, respectively, compared
to those evoked at 1-20 d into the exposure.
17,20-βP-evoked EOGs did not differ statistically between exposure groups at the
same time points during a 60 d exposure to MF, CF/MF and UV/H2O2/MF reuse
(F4,76 = 0.40, p = 0.81; Figure 2.10C). UV/H2O2/MF reuse exposed goldfish had
17,20-βP-evoked EOGs at 1-20 d into the exposure that were decreased by 26%,
compared to MF reuse exposed goldfish.
EOG responses to L-alanine and 17α,20-20-dihydroxy-pregnen-3-one between
two seasonal 60 d exposures to treated reuse water
Exposure to treated reuse during the summer results in larger decreases in L-
alanine-evoked EOGs compared to those in the spring; however, 17,20-βP EOGs
were generally decreased in the spring compared to summer even in controls
suggesting this effect was not due to exposure to treated reuse. The EOGs evoked
using L-alanine and 17,20-βP in goldfish during the spring and summer differed
depending on the season. L-alanine-evoked EOGs by goldfish exposed to MF,
CF/MF, and UV/H2O2/MF reuse during the spring were statistically increased on
average by 160, 150, and 150%, respectively, compared to those evoked during
the summer (F1,40 = 7.54, p < 0.01; F1,45 = 18.5, p < 0.01; F1,39 = 8.97, p < 0.01,
respectively; p-values: < 0.01, < 0.01, < 0.01, respectively). L-alanine-evoked
EOGs in control goldfish during the spring were increased numerically by 21%
compared to those evoked during the summer (F1,29 = 0.37, p = 0.55). The 17,20-
βP-evoked EOGs in goldfish exposed to MF, CF/MF, and UV/H2O2/MF reuse

71
and controls during the summer were statistically increased on average by 48, 92,
130 and 140%, respectively, compared to those evoked during the spring (F1,43 =
15.6, p < 0.01; F1,48 = 15.2, p < 0.01; F1,35 = 6.65, p = 0.02; F1,24 = 5.6, p = 0.03,
respectively; p-values: < 0.01, < 0.01, 0.02, 0.03, respectively).
Behavioral Endpoints
Treated reuse or a NCM did not evoke a behavioral response in goldfish.
Exposures to treated reuse or NCM of 30 min and up to 60 d do not impact a
behavioral response evoked by L-alanine, with decreases in distance travelled
post-introduction occurring in both control and exposure groups.
Behavioral response to the introduction of a pulse of treated reuse water or NCM
The introduction of a pulse of MF, CF/MF or UV/H2O2/MF reuse or NCM or
solvent control did not change distance travelled post-introduction compared to
controls (F5,143 = 2.06, p = 0.08; Figure 2.11). During the introduction of pulses of
MF, CF/MF or UV/H2O2/MF reuse or NCM, solvent control or dechlorinated
water (control), distance travelled post-introduction was statistically decreased on
average by 16% compared to pre-introduction distance travelled (F1,143 = 37.6, p <
0.01; p < 0.01).
Behavioral response to a pulse of L-alanine after a 30 min exposure to treated
reuse water or an NCM
The introduction of a pulse of L-alanine post exposure to MF, CF/MF or
UV/H2O2/MF reuse or NCM or solvent control did not result in a different

72
response than was displayed by controls (F5,167 = 1.65, p= 0.16) (Figure 2.12).
Goldfish exposed to MF, CF/MF or UV/H2O2/Mf reuse or NCM, solvent control,
or dechlorinated water (control) had distance travelled post-introduction of L-
alanine that was statistically decreased on average by 22% respectively compared
to pre-introduction distance travelled (F1,167 = 57.3. p < 0.01; p < 0.01).
Behavioral response to a pulse of L-alanine during a 60 d exposure to treated
reuse water
The introduction of a pulse of L-alanine throughout the 60 d exposure to MF,
CF/MF, or UV/H2O2/MF did not result in a different response than controls
throughout the exposure. The introduction of a pulse of L-alanine resulted in an
average decreased distance travelled post exposure of 15% compared to pre-
exposure distance travelled (F1,223 = 7.56, p < 0.01; Figure 2.13).

73
Exposure Group
ControlSolvent Control MF CF/MF UV/H2O2/MF NCM
Dis
tan
ce
Tra
ve
lled
(cm
)
0
500
1000
1500
Figure 2.11. Behavioral response to the introduction of a contaminant pulse.
Distance travelled pre- vs. post-exposure by goldfish presented with a pulse
of MF reuse (n = 8), CF/MF reuse (n = 8), UV/H202/MF reuse (n = 8), a NCM (n
= 16), a solvent control (n = 13) or dechlorinated municipal water (control) (n =
19) over time.

74
Exposure group
ControlSolvent Control MF CF/MF UV/H2O2/MF NCM
Dis
tan
ce
tra
ve
lled
(cm
)
0
500
1000
1500
2000
Figure 2.12. Behavioral responses to the introduction of a pulse of L-alanine post
30 min exposure to a contaminant source. Distance travelled pre- vs. post-
exposure by goldfish exposed to MF reuse (n = 8), CF/MF reuse (n = 8),
UV/H202/MF reuse (n = 8), a NCM (n = 22), a solvent control (n = 22) when
compared to goldfish exposed to dechlorinated municipal water (control) (n = 19).

75
0
200
400
600
800
1000
1200
Time (days)
1-20 21-40 41-60
Dis
tan
ce
Tra
ve
lled
(cm
)
0
200
400
600
800
1000
1200
1400
A B
C
1-20 21-40 41-60
D
Figure 2.13 Behavioral responses to the introduction of a pulse of L-alanine
during a 60 d exposure to treated reuse water. Distance travelled pre- vs.
post-exposure by goldfish exposed to A) dechlorinated municipal water (control)
(n = 7; n = 7; n = 5); B) MF reuse (n = 11; n = 10; n = 9); C) CF/MF reuse (n =
12; n = 9; n = 10); D) UV/H2O2/MF reuse (n = 12; n = 10; n =10).

76
Discussion
Goldfish olfaction is able to detect the contaminants found within treated reuse
water. EOGs evoked by goldfish using both natural odorants and contaminant
mixtures were seen to occur in a concentration-dependent manner. In general, L-
alanine and 17,20-βP-evoked EOGs at 10-6
M evoked the greatest responses from
all odorants and concentrations tested; however, 100% MF reuse-evoked EOGs
were greater than both of the aforementioned odorants. The 100% CF/MF and
UV/H2O2/MF reuse-evoked EOGs were greater than 10-6
M 17,20-βP evoked
EOGs, and were within the same range as those evoked by 10-6
M L-alanine.
This ability to detect contaminants within treated reuse suggests that detection of
natural odorants may be impacted by their presence.
EOG concentration dependency to amino acids and pheromones
L-serine and L-alanine evoked EOGs in a concentration dependent manner similar
to that described in rainbow trout by Hara et al. and Sorensen et al. [47, 109]. L-
serine evoked EOGs were similar in magnitude to those evoked in Coho salmon
(Oncorhynchus kisutch) [6]. L-alanine-evoked EOGs in goldfish were greater than
those evoked in rainbow trout [47], suggesting that L-alanine is a more suitable
odorant than L-serine to test olfactory toxicity in goldfish. Concentration
dependency evoked by 17,20-P resembled those reported in goldfish by
Sorensen et al. [109]; 3x10⁻⁶
M 17,20-βP-evoked EOGs were 270% greater than
those evoked using 10-5
M L-serine. Concentration dependency to PGF2α

77
resemble those reported in goldfish by Sorensen et al.[110]; 3x10⁻⁸
M PGF2α-
evoked EOGs were 183% greater than those evoked using 10-5
M L-serine.
EOG concentration response curves to treated reuse water and a NCM
Aside from the point of discharge at the Gold Bar WWTP it is unlikely that fish
will encounter concentrations of treated reuse at 100 or 50% dilutions; however,
responses to treated reuse at a 1% dilution were similar to those evoked by all
odorants at concentrations used during 30 min exposures (Figure 1; Figure 2). As
all contaminants were present at or below the μg/L concentration in 100%
dilutions, detection of 1% dilutions suggests that contaminants in the ng/L
concentration range may evoke behavioral responses.
Detection of chemicals may allow fish to determine potentially harmful areas and
avoid them [35, 51]. Detection can also be problematic, however, as fish may be
attracted to certain contaminants, as has been shown with some pesticide mixtures
[122], placing them in environments which may be harmful. Treated reuse water
not only contains detectable contaminants, but has been in contact with human
skin (e.g. through showering), potentially containing amino acids such as L-serine
and L-alanine that have been shown to evoke olfactory responses at dilutions as
low as 10-8
M [47]. Amino acids evoke behaviors such as feeding and predator
avoidance, so exposure to high concentrations of amino acids may cause
confusion for fish. For example, feeding behavior is associated with L-alanine,
and an increase in its concentration within the environment may result in food
searching behavior in a region where there is no prey. This would be energetically

78
costly to fish and may impact their ability to survive if they cannot properly
search for areas containing prey. An artificially high L-alanine concentration may
also serve to mask the scent of actual prey.
Effects of treated reuse water on EOGs
EOG responses to all odorants were impacted by exposure to treated reuse or
NCM. Exposure to MF reuse resulted in the largest decreases in EOGs evoked by
all odorants during 30 min exposures; while exposure to UV/H2O2/MF reuse
resulted in the largest decreases in EOGs evoked by all odorants during 30 and 60
d exposures. EOGs appear to be the least impacted by exposure to treated reuse or
NCM; while L-alanine evoked EOGs appear to be the most impacted. Seasonal
effects of are seen during 60 d exposures with summer exposures resulting in
larger decreases to L-alanine-evoked EOGs during the summer compared to those
during the spring. Recovery of EOGs was seen in all odorants during 30 min and
60 d exposures, and does not appear to be affected by the season during which the
exposure occurred. Overall this suggests that fish exposed to treated reuse water
may have trouble detecting natural odorants, and so olfactory mediated behaviors
may also be affected.
Effects of treated reuse water on EOGs evoked by amino acids
L-alanine- and L-serine evoked EOGs were decreased during 30 min and 60 d
exposures to treated reuse water; however, L-alanine-evoked EOGs appeared to
be more affected than those evoked by L-serine. No other studies have

79
investigated the effects of treated reuse water on olfactory toxicity; however, a
comparison can be made with a contaminant that has been well studied in regards
to olfactory toxicity, copper. During 30 min exposures to MF, CF/MF, and
UV/H2O2/MF reuse, L-alanine-evoked EOGs were decreased on average by 72.1,
33.0 and 22.4%, respectively; while Atlantic salmon (Salmo salar) exposed to 0.2
and 2.2 μg/L copper solution experienced 50 and 90% decreases to L-alanine-
evoked EOGs, respectively, during a 5 min exposure. L-serine-evoked EOGs
were decreased on average by 49.7% during exposure to MF reuse and increased
on average by 20.3 and 63.4% during a 30 min exposure to CF/MF and
UV/H2O2/MF reuse, respectively; while Coho salmon exposed to 10 μg/L copper
experienced decreased L-serine-evoked EOG by 50%. These comparisons suggest
that treated reuse is less toxic to olfactory receptors than copper during a 30 min
exposure (at a concentration range of 10-100μg/L), and that treated reuse takes
much longer than copper to affect olfactory receptors than copper. These data also
suggest that the UV/H2O2/MF treatment may remove components from the reuse
water that stimulate olfactory neurons; both MF and CF/MF treatments do not
appear to be as effective. Regardless, as L-alanine- and L-serine evoked EOGs
returned to pre-exposure values post-exposure; the data suggest that no permanent
damage to the receptors associated amino acid odorant detection occurred.
L-alanine-evoked EOGs did not decrease in comparison to controls during fall
and spring exposures to treated reuse water; however, summer exposures resulted
in decreases compared to controls throughout the 60 d exposure. Goldfish
exposed to MF, CF/MF, and UV/H202 reuse experienced average decreases

80
throughout the exposure of 50, 58, and 54% respectively. L-serine evoked EOGs
were also decreased in comparison to controls during the summer exposures with
MF, CF/MF and UV/H2O2 reuse exposures resulting in average decreases of 50,
66, and 70%, respectively. No other studies have conducted 60 d exposures to
investigate olfactory toxicity; however data on 96 h exposures to a pesticide
mixture do exist. Tierney et al. found that 96 h exposure to a pesticide mixture
containing dimethoate, simazine, methamidophos, diazinon, chlorpyriphos,
endosulphan, malathion, atrazine, linuron and parathion with a total concentration
of 13.9 μg/L was able to reduce L-serine evoked EOGs in rainbow trout by 47%.
This concentration is double the total contaminant concentration found in MF
reuse, however the decrease in amino acid evoked EOGs are not merely double.
This comparison suggests that an increased number of contaminants at lower
concentrations had less effect than fewer contaminants at greater concentrations.
These results also suggest that seasonal components of treated reuse water have
the ability to impair OSNs used to detect both L-alanine, and this will be
discussed in greater detail further on.
As goldfish have the ability to detect all forms of reuse water it is possible that
chemicals within reuse water are stimulating olfactory neurons. Exposure of
olfactory tissue to a constant barrage of compounds that bind ORs may result in
receptor down regulation. This had previously seen to occur during short term 30
min cross adaptation studies using amino acids [17]. If the neurons that are being
stimulated also detect amino acids, it is possible that reuse chemicals compete
with L-alanine and L-serine and so reduce their ability to evoke responses. These

81
two AAs were found to share a receptor within the olfactory tissue of rainbow
trout, and this receptor can detect short chain amino acid structures and
compounds similar to L-alanine and L-serine that contain substituted functional
groups [15, 16, 93]. Substitution of the amino or carboxylic acid group of L-
alanine resulted in decreased binding of L-alanine the receptor(s) in channel
catfish; however, these same compounds inhibited the binding of L-alanine to
receptors within olfactory tissue. Inhibition of L-alanine binding by -alanine was
no different than that occurring during an L-alanine saturation of the tissue [16].
Inhibition of L-serine in the presence of substituted forms of L-alanine was shown
to be much less effective than the inhibition of L-alanine, -alanine acclimation
only resulting in a 20% decrease in L-serine binding. This information allows us
to speculate upon two potential mechanisms by which L-alanine and L-serine
evoked EOGs are being decreased during a 30 min exposure.
First, there may be competitive binding for the receptor(s) at their orthosteric
site(s). Previous studies have shown that antibiotics, such as cycloserine, have the
ability to bind receptors associated with L-alanine [92, 99]. Compounds which
contain the same carbon backbone and substituted functional groups as L-alanine,
such as D-alanine and -alanine, can act as inhibitors of L-alanine detection by
channel catfish [16]. Therefore it is possible that short chain carbon structures
occurring as byproducts from microbial degradation of contaminants prior to MF,
CF/MF, or UV/H2O2/MF filtration may be decreasing the detection of L-alanine
(via competition). Removal and decomposition of these structures by CF/MF and

82
UV/H2O2/MF filtration may have decreased the concentrations of short chain
carbon structures which resemble L-alanine (within treated reuse). This would
explain why 30 min exposures to MF reuse resulted in larger decreases in EOGs
evoked by L-alanine and L-serine when compared to CF/MF and UV/H2O2/MF
reuse exposures.
Second, it is possible that contaminants within reuse water interacted with L-
alanine at the carboxylic acid or α-amino site, which could have caused structural
changes in olfactory receptors that alter odorants’ ability to bind them. The
functional groups of L-serine and L-alanine which have been identified as crucial
to binding with their shared receptor are the carboxylic acid group and α-amino
group [17, 94]. When comparing L-serine and L-alanine structures, it must be
noted that L-serine contains a polar hydroxyl group on the third carbon and L-
alanine does not. The distance of the hydroxyl group from other functional groups
of L-serine makes it an easier target for substitution as there is less interference
caused by the charge of surrounding functional groups. Substitutions made at this
hydroxyl group may not result in decreases in binding of L-serine to the shared
receptor or perhaps may result in binding of the receptor in the same manner as L-
alanine; however, this has yet to be studied. Interactions between contaminants
and L-alanine are likely to occur at the carboxylic acid terminal and will likely
result in decreases in the substituted L-alanine compounds acting as inhibitors as
has previously been described above. Further studies investigating the changes to
the structures of L-alanine and L-serine in the presence of contaminants should be
conducted to determine if this mechanism of action is possible. Analysis of L-

83
alanine- and L-serine-like compounds using GC/MS have previously been
described by Bruch et al. and these methods could be used to determine the
presence and quantity of substituted L-alanine and L-serine structures [16].
Allosteric modification of receptors and non-specific effects on OSNs may have
also occurred. Allosteric inhibition of amino acid receptors has previously been
reported in channel catfish [70]. Li et al. found that OSNs that appear to detect
multiple amino acids contain multiple binding sites, and when one of these sites is
bound, modification of other sites occurs. As L-alanine appears to be more
affected than L-serine during both 30 min and 60 d exposures, it is possible that
allosteric modification of the L-alanine binding site occurred. A non-specific
effect that may be affecting olfactory responses to amino acids may be increases
of ions, such as Ca2+
, which alter the concentrations of intracellular calcium and
may result in interference with secondary messenger systems that use cation
channels [89].
Effects of treated reuse water on EOGs evoked by 17,20-P
17,20-βP-evoked EOGs were decreased during both 30 min and 60 d exposures to
treated reuse water. During a 30 min exposure to treated reuse water, EOGs
evoked by the pheromone 17,20-P were seen to decrease during a exposure to
MF, CF/MF, and UV/H2O2/MF reuse, average decreases of 52, 30 and 39%
occurring respectively. To date studies have focused on the pheromone PGF2α,
however, PGF2α is a monocyclic pheromone, unlike 17,20-βP which is a
polycyclic pheromone, and so mechanism(s) of action by which contaminants

84
decreased EOGs to PGF2α may differ with those of 17,20-βP. Also, no previous
studies have examined the effects of treated reuse water on olfactory toxicity;
however, studies on pesticides do exist. During 30 min exposures to 10 μg/L
atrazine, 5 μg/L diazinon, 10 μg/L carbofuran, and 2 μg/L simazine, PGF2α
responses in Atlantic salmon were decreased by 44, 49, 33, 28%, respectively [82-
84, 131]. A 30 min exposure to a mixture of 1 μg/L atrazine and 1 μg/L simazine
decreased PGF2α-evoked EOGs in Atlantic salmon by 30% [82]. The
concentrations of atrazine, diazinon and carbofuran used in these experiments are
comparable to the total concentration of contaminants found in MF reuse water;
however EOGs were not decreased to the same magnitude, suggesting that
multiple contaminants at this concentration were better able to decrease 17,20-βP-
evoked EOGs than singular contaminants. A notable comparison can be made
with potential to recover olfactory responses post-exposure. Recovery of PGF2α-
evoked EOGs after a 30 min exposure to 1 μg/L diazinon in rainbow trout took
4.5 h, and only resulted in EOGs being 80% of the pre-exposure, while goldfish
exposed to MF reuse for 30 min had 17,20-βP-evoked EOGs that returned to 97%
of pre-exposure within 22 min post-exposure. This short period of recovery
suggests that no permanent damage occurred to OSNs that detected 17,20-βP. In
the study conducted by Kerr et al., it was demonstrated that CF/MF removal of
cyclic carbon contaminants, such as pesticides, was not complete in reuse water
[60]. The pesticides 2,4-D, dicamba, MCPA, and mecoprop had percent removal
values of 58, 50, 45, and 42%, respectively, indicating that these components of
reuse persist post-filtration. As cyclic organic contaminants have previously been

85
shown to impact fishes’ ability to detect pheromones [83, 84, 131], it is possible
that the aforementioned compounds and others of similar composition may cause
the decreases seen in 17,20-βP evoked EOGs, possibly again acting as
competitive agonists.
Throughout the 2012 summer exposure, EOGs evoked by 17,20P decreased
across all exposure groups including controls. These results suggest that
contaminants within treated reuse water that have the ability to impair olfactory
detection of the pheromone 17,20-βP persist regardless of treatment processes.
Current data regarding the contents of tap water suggests that synthetic progestins
such as norethindrone and levonorgestrel are non-detectable; however,
progesterone itself is present at ng/L concentrations [64]. Studies examining the
contents of FE wastewater have shown the presence of progesterones, progestins,
and progesterone receptor antagonists at ng/L concentrations [63]. In two studies
conducted by Sorensen et al. it was demonstrated that progesterone and
progesterone derivatives have the ability to evoke EOG responses in male,
female, and gonadally regressed male goldfish at concentrations in the ng/L range
[109, 111]. As Sorensen et al. showed that progesterone and progesterone
derivatives are both detectable and their detection can be inhibited by 17,20-βP,
and so it can be assumed that these compounds are able to bind to ORs used to
detect 17,20-βP. These contaminants present themselves as potential competitive
inhibitors for ORs associated with 17,20-βP; however, data is lacking concerning
the concentration at which inhibition occurs. As 17,20-βP is detectable at a
concentration of 10-13
M (approximately 0.33 ng/L) and progesterone and its

86
derivatives were detectable at concentrations as low as 10-12
M, it is likely the
presence of progesterone and its derivatives at low concentrations will impact the
ability of fish to smell 17,20-βP. This information leads me to believe that
progesterone and progesterone derivatives exist within MF, CF/MF and
UV/H2O2/MF reuse at concentrations that are able to impair ORs associated with
17,20-βP. Flow-through tanks may provide a steady exposure to progesterone,
and as such may result in a decrease in expression of the OR that they bind (OR
expression will be down-regulated with constant exposure, as seen in goldfish
during cross adaptation to PGF2α [110]).
Seasonal effects of treated reuse on EOG responses
When reuse water from the Gold Bar WWTP was screened for 68 potential
xenobiotics by Kerr et al., it was found that 8 pesticides were present during the
spring and summer (pooled samples from April-July of 2005); however, these
pesticides were not present during the winter sampling period (pooled samples
from January-April of 2006) [60]. The study also reported that contaminants
measured throughout all seasons were highly variable in concentration between
sampling dates. Studies investigating grey water pre-treatment have shown that
variability between urban sources are high, even when types and amounts of
PCPP used at each source was held constant [135]. I began the spring exposure
period in April 2012 and ended it in May 2012 and began the summer exposure
period in July 2012 and ended it in September 2012, so it is possible that pesticide
concentrations within the reuse water increased throughout summer months that

87
were unmeasured by Kerr et al. I began fall exposure periods in September of
2011 and ended in October 2012, another set of dates untested by Kerr.et al. but
with the potential to contain pesticides during the August and September time
periods. Currently chemical analysis of treated reuse water is ongoing and data is
unavailable to confirm this theory.
Edmonton does have an urban pesticide program in place for 2013 which
describes pesticide use throughout the city on a monthly basis. The 2013 pest
management programs including pesticide use-activity plan showed that
pesticides used to control weeds were not implemented on school grounds until
July and August. Pest control, which may include pesticides, for rodents began in
May and continues throughout September, while pest control for insect pests of
trees began in May and continues on through August. Pest control for yellow
jackets, which may include pesticide use, began in June and continues on
throughout September, while human pathogens at outdoor water sports events
were only controlled for during June and July. This plan does not indicate the
amount of pesticide used; however, one can assume that this would vary
depending on the year and amount of pests present. The pest management
programs including pesticide use-activity plan suggests that pesticides within
urban waterways will increase during July and August and that different
pesticides will be present during August and September when compared to April,
May, and June. These increases and changes in pesticides present may account for
the decrease in EOG seen during the summer exposure but not during the spring
and fall sampling periods.

88
Previous studies have shown that pesticides are able to reduce EOG responses in a
dose dependent manner, with increasing pesticide concentrations causing larger
EOG reductions [54, 56, 84, 119, 121]. Decreases in L-alanine- and 17,20-βP-
evoked EOG compared to controls during 60 d exposures appear to follow a
seasonal trend that corresponds to the city’s use of pesticides. EOGs evoked by L-
alanine and 17, 20-P were not statistically decreased from controls during the
fall or spring exposure periods, but were statistically decreased during the summer
exposure. This seasonal effect on EOGs may be at least partially explained by the
seasonal introduction of pesticides.
Detoxification enzymes may prevent damage to olfactory tissue
During our study, it was not observed that any goldfish were completely anosmic.
Increased expression of olfactory receptors as a result of contaminant exposure
may have occurred; however, data can neither confirm nor refute this hypothesis.
Our lab did however use qPCR to determine the presence of the detoxification
enzymes cytochrome p450 (CYP) 1A and 3A as well as GST α, θ, and π within
olfactory rosettes. Appendix E shows that increased expression of CYP 1A was
observed in goldfish exposed to treated reuse. Goldfish exposed to CF/MF reuse
displayed a 2-fold increase in CYP 1A mRNA expression compared to controls,
while goldfish exposed to both MF reuse and UV/H2O2/MF reuse displayed a 4-
fold increase in CYP 1A mRNA expression. Detoxification enzymes in the CYP
1A class are responsible for the breakdown of xenobiotics within vertebrates and
have previously been found in the olfactory epithelium of topminnows exposed to

89
benzo [a] pyrene [86, 106]. The comparable increase in CYP 1A mRNA in
goldfish exposed to both MF reuse and UV/H2O2/MF reuse suggests that
compounds that elicit an increase in CYP 1A detoxification enzymes were still
present post treatment in UV/H2O2/MF reuse at or near the same concentration as
those found in MF reuse. These compounds may be the reason that olfactory
impairment did not differ between goldfish exposed to these treatments.
Effects of exposure to a NCM
In order to identify if olfactory effects could be attributed to contaminant classes
found in reuse water, a mixture containing the major classes was created (NCM).
No such previous work had been conducted; however, I hypothesized that there
would be greater reductions to EOGs evoked by amino acids and pheromones due
to the high concentration of the contaminants used to represent each class. I did
not see this, as EOGs evoked by both amino acids and pheromones during an
exposure to a NCM were not as affected as those during an exposure to MF reuse.
The 0.1% NCM, in which the contaminants were 10-fold higher than the
concentration at which they exist in MF reuse, did not cause significant decreases
in EOG responses to either amino acids or pheromone. This suggests that other
components found within reuse water are able to impair detection of these
odorants via olfaction. This also means that some of the reuse water components
we analyze for may be unrelated to toxicity, or at least neurotoxicity.

90
Behavioral responses to the introduction of a pulse of treated reuse or NCM
Goldfish do not appear to respond to the introduction of treated reuse or a NCM.
This was not expected as previous studies found fish avoidance and attraction to
contaminants, both behaviors requiring increased movement [5, 51, 52, 122].
Decreases in distance travelled post-introduction of a pulse of treated reuse or a
NCM, as well as during introductions of a solvent control and dechlorinated
municipal water, were observed during our study. These results suggest that
goldfish did not respond behaviorally to the introduction of treated reuse or a
NCM, but they did respond to the stimulus (water addition). This has been found
before in water-exposed zebrafish [105]. It should be noted that the arena used
for this testing was not a preference/ avoidance trough, and perhaps the decrease
in movement occurred as goldfish had no place to move away from the
contaminant source.
Effects of an exposure to treated reuse or a NCM on behavioral responses to L-
alanine
Behavioral responses to L-alanine have previously been described as a searching
behavior in cyprinids and so I expected to see an increase in distance travelled
post-introduction of L-alanine in control goldfish; however, the EOG results
previously presented (i.e. reduced detection of L-alanine) suggested that this same
behavior could be reduced or absent in goldfish exposed to treated reuse or a
NCM for 30 min, or in goldfish exposed to treated reuse over a 60 d period [39].
This was not observed, as a decrease in distance travelled post-introduction of L-

91
alanine in controls and all exposed goldfish was seen. No difference was observed
between controls and exposed goldfish after the introduction of L-alanine,
suggesting that a 30 min exposure to MF, CF/MF, UV/H2O2/MF reuse, a NCM,
or a solvent control do not impair the behavioral response to L-alanine. This same
result was obtained from goldfish throughout the 60 d exposure to treated reuse
water. A study conducted by Hamdani et al. suggested other behaviors associated
with L-alanine introduction including snapping and mouth opening [39]. They
also suggested that three different searching behaviors exist, including swimming
to the surface, bottom food searching, and exploring. As distance travelled does
not seem to be affected by exposure to contaminant sources, I suggest that a more
detailed analysis of the behavior be conducted to determine if a difference exists
within each of the individual categories outlined by Hamdani et al. This analysis
may give more detailed description of changes in behavior as a result of exposure
to a contaminant source.
Conclusions
Goldfish were able to detect treated reuse water and a NCM in a concentration-
dependent manner. This suggests that contaminants found in each have the ability
to affect olfaction. A 30 min exposure to both treated reuse and a NCM resulted in
decreased EOG responses; however, the responses returned, suggesting again that
contaminants within both sources have the ability to bind receptors associated
with natural odorants. A 60 d exposure to treated reuse water resulted in a
decreased ability to detect L-alanine, suggesting that compounds found within

92
reuse water are able to impair olfaction by damaging OSNs. Increases in CYP 1A
mRNA expression within olfactory tissue may be part of the reason why we do
not see complete loss of olfaction during a 60 d exposure. Behavioral
experiments do not suggest any change in behavior as a result of introduction or
exposure to treated reuse water or a NCM over 30 min period. Behavioral
experiments also do not suggest that a change in behavior associated with L-
alanine occurred during a 60 d exposure.

93
Chapter 3: Determining sub-lethal toxicity of oil sands process affected water
as measured by olfactory impairment to natural odorants in rainbow trout
(Oncorynchus mykiss)
Introduction
The Athabasca oil sands located in northern Alberta are the world’s second largest
heavy oil deposit and contain an estimated 1.3 billion barrels of oil. Of those 1.3
trillion, 173 billion have been deemed recoverable, i.e. they can be recovered
using open pit mining because the overhead (amount of soil, rock, etc) does not
exceed 50m [12, 72]. The component of the oil sands which is sought after is
known as bitumen, a viscous substance that is bound to sand particles and once
extracted is used to manufacture synthetic crude oil. To extract bitumen from the
oil sands an alkaline hot water extraction process is used, a process that causes
naphthenates within the oil sands to act as a surfactant and help remove bitumen
from sand particles. The extraction process uses approximately 1 m3 of water per
ton of oil sands; however, due to water recycling an average of 0.3-0.4 m3 is used
to extract each barrel of oil [76].
Oil sands process-affected water
The water used in the extraction process, known as oil sands process-affected
water (OSPW), becomes contaminated with sand, clay, unrecoverable bitumen,
organic compounds such as naphthenic acids (NAs), sulphate, ammonia, aromatic
hydrocarbons, and metals such as lead, copper, nickel, chromium and zinc [12,

94
72]. OSPW is toxic to fish, mammals, plants, zooplankton and bacteria, and as
such is under a no release policy [12, 19, 23, 24, 38, 50, 73, 132]. OSPW is stored
in large tailings ponds intended to stop release into groundwater and the close by
Athabasca river; however NA associated with OSPW have been identified in
tributaries of the Athabasca [97]. Deposition of compounds found within OSPW
occurs via air and water and has been shown to occur up to 80 km from tailings
pond sites [59]. Currently the Athabasca oil sands have yielded over one billion
m3 of OSPW from the Syncrude operation alone, with numbers from Suncor’s
operation not being available [12, 19]. Reclamation of the water contaminated
with OSPW is required by all companies prior to termination of their land lease,
and as such investigation into the cause of OSPW toxicity and methods on how to
treat it is highly important. While OSPW contains high concentrations of
ammonia and aromatic hydrocarbons, current literature suggests that its toxicity is
not due to increases in these compounds but instead increases in NAs [73, 132].
Naphthenic acids
Naphthenic acids are a highly diverse group of alkyl-substituted aliphatic and
alicyclic carboxylic acids that can be described by the formula CnH2n+ZO2, where
2n is the number of carbon atoms and Z is a negative number that indicates the
number of hydrogen atoms lost during ring formation [14]. In their simplest form,
NAs resemble fatty acids; however, they can also be mono-, di-, tri-, and tetra-
cyclic. NAs have a wide range of chemical properties, boiling points ranging from
250-350°C and molecular weights ranging from 200-700 g/mol. The dissociation

95
constants of NAs are similar to those of carboxylic acids, in the order of 10-5
to
10-6
. Different sources of OSPW have highly variably types of NAs within them,
and until recently, discerning which NAs were present in different sources of
OSPW was not possible. However, a new method developed by Rowland et al.
that uses gas chromatography × gas-chromatography- time of flight- mass
spectrometry can determine structures and quantities of individual NAs within
OSPW [98].
Whole OSPW toxicity
Multiple studies have explored OSPW toxicity to a variety of aquatic organisms
and have shown that OSPW toxicity varies greatly between sources. MacKinnon
and Boerger used the Microtox assay to show that acidifying OSPW could reduce
its toxicity [12]. The Microtox assay measures changes in luminescence emitted
by the luminescent bacteria Vibrio fischeri that occur after an exposure to
contaminants at varying concentrations for 20 min, decreased luminescence from
pre-exposure correlating with mortality. They determined that the concentration
inhibiting 20% luminescence (IC20) was 43% OSPW; however this result should
be interpreted cautiously as an IC20 was chosen arbitrarily due to the inability to
achieve a concentratin inhibiting 50% luminescence (IC50) . In contrast, these
researchers found that 96 h exposures caused mortality in 50% of the test groups
(LC50) for a fish species (rainbow trout) and an invert (water flea, Daphnia
magna) were far lower, at 7 and 2%, respectively. This suggests bacteria are far
more resistant to OSPW toxicity. Munkittrick and Power determined the

96
correlation of effect concentrations associated with Microtox and LC50 of rainbow
trout, fathead minnows (Pimephales promelas), and daphnia [85]. They showed
that correlations between Microtox and lethality tests were high for complex
contaminant mixtures, such as municipal effluents, industrial wastes, and organic
contaminants, and low for mixtures containing metals and inorganics. While
waste waters associated with oil production generally had a high correlation
between lethality tests and the Microtox assay, all studies examining OSPW
observed that Microtox was a less sensitive measure than lethality testing. A
study conducted by Toor et al. showed that rainbow trout exposed to a Syncrude
OSPW sample containing 73 mg/L NAs had an 96 h LC50 of 67% (v/v ) [124].
Since many OSPW toxicity studies have linked toxicity to NA concentration,
studying NA toxicity without other components of OSPW (e.g. metals) is of
interest in the scientific community [73, 132].
NA toxicity
Studies on the toxicity of NAs have focused on a myriad of species, but due to the
large amount of OSPW created in the extraction process that must one day be
remediated, have also begun studying the ways in which OSPW can be treated to
lower NAs and toxicity. A study conducted by Madill et al. used the Microtox
assay to show that OSPW toxicity can be attributed to NAs, as fractions of OSPW
containing NAs evoked no luminescence [73]. Further confirmation that NAs are
a major contributor to OSPW toxicity had previously been demonstrated by Wong
et al., who showed that filtration of OSPW using granular activated carbon

97
removed NAs and the toxicity to OSPW [132]. Specifically, Wong et al. exposed
rainbow trout to OSPW before and after filtration with granular activated carbon,
and found survival rates of 20, 50, and 45% pre-treatment and 97, 100, and 99%
post-treatment, respectively [132]. Studies conducted by Dokholyan and
Magomedov determined the 10 day LC50 for NAs was 25 mg/L for two month
old chum salmon (Oncorhynchus ketachum), 50 mg/L for two month old kutum
(Rutilus kutum) and roach (Rutilus rutilus), and 2 year old Russian sturgeon
(Acipenser gueldenstaedtii), and 75 mg/L for two year old roach and round goby
(Neogobius melanostomus) [23, 24]. These data together indicate that NA toxicity
is in the mg/L range and can be influenced by life stage and species. These
researchers also determined that the zooplankton (Nephargoides maeoticus) could
only tolerate NAs concentrations of 0.15 mg/L and as such suggested this be the
maximum allowable concentration of NAs within waters (note: these data indicate
that NAs may exert indirect toxicity to fishes by killing their food source). At the
sub-organismal level, NA toxicity has also been recorded. For example, a study
by Hagen et al. showed immune function of goldfish (Carassius auratus) exposed
to > 5 mg/L NAs had increased expression of pro-inflammatory cytokines and
decreased ability to control infections of the trypanosome parasite Trypanosoma
carassii [38].
In sum, toxicity associated with OSPW is in part attributable to the NA
concentration, as studies that have focused on NA removal have shown that
OSPW post-NA removal is less toxic than the NA fraction. Invertebrates are more

98
sensitive to NAs than larger vertebrates; however, NA concentrations found
within OSPW from Alberta tailings ponds are toxic to multiple fish species.
Ozonation of OSPW reduces toxicity and increases biodegradability of NAs
Detoxification of OSPW is essential for companies such as Syncrude and Suncor,
which are required to return their leased land to conditions that meet or exceed
those in which they acquired them. Ozonation is one method that is currently
showing promise for decreasing OSPW toxicity by breaking down and oxidizing
NAs [31, 103]. Gamal El-din et al. showed that an 80 mg/L ozone treatment
resulted in a 64% decrease in acid extractable organics, a group of compounds
that includes NAs, oxy-NAs and other acid organics [31, 37]. A study by Scott et
al. showed decreased toxicity of ozonated OSPW (O3OSPW) in comparison to
OSPW as determined using the Microtox assay [103]. In their study, the NA
concentration in OSPW was 59 mg/L, and this had an IC20 of 23% (v/v %). After
20 min of ozonation, the IC20 was increased to 31% (v/v %), and after 50 min, it
was <100% (v/v %). The elimination of toxicity at 50 min came as a surprise as
the NA concentration was still 20 mg/L, and so results showed that toxicity of
NAs did not mean that NAs had to be completely removed or destroyed. Gamal
El-din et al. also showed reduced toxicity using the Microtox assay that agreed
with results found by Scott et al., with 150 mg/L ozonation resulting in an IC20
<100%. He et al. showed that fathead minnow development was less affected by
O3OSPW than OSPW, and activated carbon filtered OSPW [50]. Not only was
hatching success at >120 h greater in O3OSPW-exposed fish than those exposed

99
to OSPW, incidences of hemorrhaging, pericardial edema, and spinal
malformations did not differ from control. He et al. determined that gene
transcripts (mRNA) for enzymes involved in detoxification, specifically CYP 3A,
GST and SOD were increased in comparison to controls in embryos exposed to
OSPW but not in those exposed to O3OSPW. It was also seen that reactive
oxygen species were present in higher concentrations in embryos exposed to
OSPW in comparison to those exposed to O3OSPW. A study by Garcia-Garcia et
al. showed a decrease in impact on the mammalian immune system by O3OSPW
compared to OSPW [32]. Exposure of adult mice to OSPW containing 100 mg/L
NAs and O3OSPW containing 25 mg/L NAs via gavagei showed that ozonation
of OSPW abolished OSPW’s ability to alter cytokine gene expression.
Studies investigating methods to reduce NA concentrations within OSPW have
determined that toxicity is decreased by lowering the overall NA concentration.
Gamal El-din et al. used the carbonaceous biochemical oxygen demand as a
measure of biodegradation and found an increase in 8 mg/L to 25 mg/L O2 after
OSPW was treated with 148 mg/L ozone, suggesting increased biodegradation.
Martin injected OSPW, 54% O3OSPW and 73% O3OSPW samples with
microbes endogenous to OSPW tailings ponds at concentrations found in the
ponds, and reported that microbial biodegradation of OSPW increased if
ozonation was applied [74]. Martin et al. found that degradation rates differed
between NAs with different Z numbers post ozonation, which agrees with
100
findings by Han et al.’s upon examination of commercial and synthetic NAs
(Table 3.1) [41].
Olfactory toxicity due to OSPW and O3OSPW exposre
Fish olfaction has been previously used to study sub-lethal effects of
contaminants including pesticides [35, 40, 42, 43] and metals [22]. The
remediation of OSPW tailing ponds will likely result in its return to aquatic
environments, and this would allow fish to be exposed to OSPW. Olfaction is
essential to behaviors such as foraging, predator avoidance, homing/migration and
mating, and can be impacted by contaminants at and below μg/l concentrations
[46, 77, 87, 134]. It is therefore important to study the impacts of contaminants
found within OSPW and O3OSPW on fish olfaction as its return to waters
containing fish may impact olfactory mediated behaviors.
Study Objectives and Hypothesis
My study aimed to use fish olfaction as a measure of sub-lethal toxicity in
rainbow trout exposed to OSPW and O3OSPW. Rainbow trout were used in these
experiments as opposed to goldfish as they are a more ecologically relevant
species to the region where OSPW contamination of water is likely to occur. I
hypothesized that rainbow trout would be able to detect both OSPW and
O3OSPW, as NAs within the mixture have similar structures to natural odorants,
and polycyclic contaminants such as those found in pesticides have previously
been found to be detectable [119, 120]. I also hypothesized that both 10% OSPW

101
and 10% O3OSPW would result in a altered EOGs throughout a 30 min exposure;
however, the decrease would cease immediately post exposure as has been seen
with exposure to other organic contaminants, e.g. those found in pesticides and
organic contaminant mixtures. I hypothesized that EOGs from 10% OSPW and
10% O3OSPW exposed rainbow trout would be altered after a 7 d exposure, as
these concentrations of organic contaminants (0.5-4 mg/L) have previously been
found to cause lasting decreases in EOG post 7 d exposure. While current
literature suggests that ozonation has the potential to reduce toxicity of OSPW, I
do not think that olfactory tissue will be able to cope with such high
concentrations of organic contaminants, regardless of the source and structure.
My hypotheses were based on studies that have previously investigated sources of
both organic and metallic contamination and their effects on olfaction, which
show that above mg/L concentrations both metals and organic contaminants
decrease EOGs evoked by TChA and L-serine in teleost fish species [22, 36, 49,
101, 119, 121, 123].
My overall objectives were to answer the following three questions:
1. Can rainbow trout detect OSPW and O3OSPW via olfaction?
2. Does a 30 min exposure to 1% OSPW, 10% OSPW, or 10% O3OSPW
cause a decrease in EOGs evoked by natural odorants?
3. Does a 7 d exposure to 1% OSPW, 10% OSPW, or 10% O3OSPW cause a
decrease in EOGs evoked by natural odorants?

102
Fold increase in 50% microbial
biodegradation in comparison to
OSPW
Z number 54% ozonated
OSPW
73% ozonated
OSPW
-2 2.5 3.3
-4 1.5 1.6
-6 1.4 1.5
-8 1.9 2.5
-10 NA NA
-12 NA NA
Table 3.1. Residual NA microbial biodegradation kinetics adapted from Martin et
al. (2010)[74]. Microbial biodegradation of NAs to reach 50% of the initial
concentration was seen to increase in OSPW samples treated with both 54 and
73% ozonation.

103
Behavior endpoints were also tested for rainbow trout exposed to OSPW;
however this work was conducted by other members in the lab and was not a
component of my thesis work. Behavior data was unavailable at this time as it
was being used to construct the three dimensional behavior analysis previously
discussed in chapter 2.
Materials and Methods
Fish
Rainbow trout eggs were obtained from Raven Brood Trout Station (Caroline,
Alberta) and hatched during December 2011 at the University of Alberta.
Rainbow trout were acclimated to flow through tanks containing 15°C
dechlorinated municipal water from the city of Edmonton. Rainbow trout were
kept on a 16:8 light: dark photoperiod and were fed twice daily. Experiments
were approved by the University of Alberta Animal Care Committee (#7301003)
and followed the Canadian Council of Animal Care guidelines.
OSPW and O3OSPW
Non-aged OSPW and O3OSPW containing 40mg/L and 5mg/L NAs respectively
were obtained from Syncrude (Mildred Lake samples, Alberta, Canada).
Na+ / Cl- control
Concentrations of Na+ and Cl- were determined in OSPW samples as these have
previously been identified as major ionic constituents contributing to the salinity
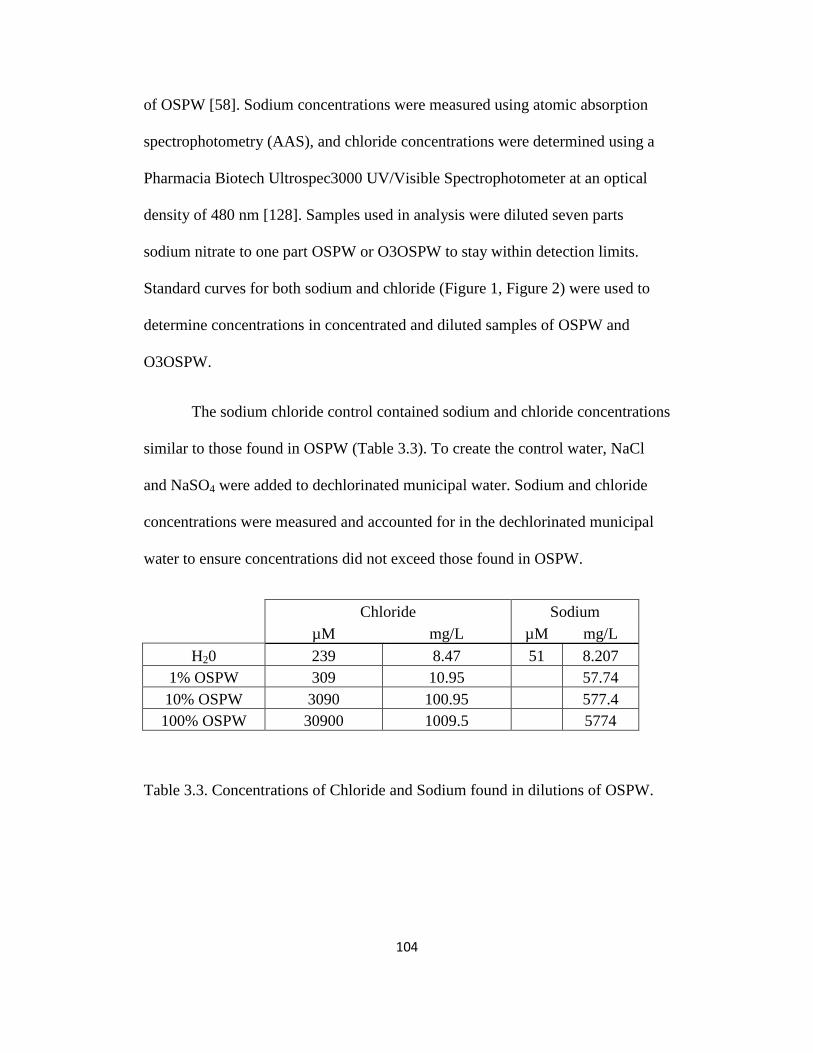
104
of OSPW [58]. Sodium concentrations were measured using atomic absorption
spectrophotometry (AAS), and chloride concentrations were determined using a
Pharmacia Biotech Ultrospec3000 UV/Visible Spectrophotometer at an optical
density of 480 nm [128]. Samples used in analysis were diluted seven parts
sodium nitrate to one part OSPW or O3OSPW to stay within detection limits.
Standard curves for both sodium and chloride (Figure 1, Figure 2) were used to
determine concentrations in concentrated and diluted samples of OSPW and
O3OSPW.
The sodium chloride control contained sodium and chloride concentrations
similar to those found in OSPW (Table 3.3). To create the control water, NaCl
and NaSO4 were added to dechlorinated municipal water. Sodium and chloride
concentrations were measured and accounted for in the dechlorinated municipal
water to ensure concentrations did not exceed those found in OSPW.
Chloride Sodium
µM mg/L µM mg/L
H20 239 8.47 51 8.207
1% OSPW 309 10.95 57.74
10% OSPW 3090 100.95 577.4
100% OSPW 30900 1009.5 5774
Table 3.3. Concentrations of Chloride and Sodium found in dilutions of OSPW.

105
Concentration response curves
Odorants
Concentration response curves for odorants were conducted using the same
methods described in Chapter 2. The odorants used in these concentration
response curves were L-serine and taurocholic acid (TChA).
OSPW, O3OSPW, and NaCl control
Concentration responses curves to OSPW, O3OSPW, and the NaCl control were
conducted in the same manner as those for reuse water treatments in Chapter 2.
EOG responses to dilutions of 100, 50, 10, 1, 0.1, 0.001% of OSPW, O3OSPW,
and the NaCl control were recorded in triplicate from each fish. EOGs were
recorded from lowest concentration to highest concentration.
Exposures
To determine the effects of a 30 min exposure, OSPW was diluted to 1 and 10%,
and O3OSPW was diluted to 10% of the original concentration using
dechlorinated municipal water. Exposures followed methods for 30 min exposures
previously described in chapter 2A. 10-4
M L-serine and 10-5
M TChA were used
as odorants throughout the exposure.
To determine the effects of 7 d exposure to OSPW or O3OSPW, rainbow trout
were placed in 20 ga tanks containing one of aquatic facility water (control), a 1%

106
OSPW solution, a10% OSPW solution, a 10% O3OSPW solution, or a solution
containing Na+ and Cl- concentrations equivalent to those found in a 10% OSPW
solution (sodium and chloride control). Static renewal of 50% of the total tank
volume began 24 h after the start of exposure and was performed daily. Exposure
tanks were placed in a flow through water bath to maintain a temperature of 14°C
and photoperiods and feeding cycles remained the same as previously stated
(University of Alberta, Edmonton).
Electro-olfactograms
EOGs were measured from olfactory sensory neurons using methods described by
Hara and Evans [27] and equipment described by Sorensen, Hara, and Stacey
[109], previously described in chapter 2. Briefly, fish were anesthetized using a
150 mg/L tricaine methanesulfonate solution (Syndell, Vancouver, BC). Upon
cessation of opercular pumping, fish were transferred to a water bath containing
15°C water and the anesthesia was delivered over the gills at a concentration of 75
mg/L. The olfactory rosette was exposed by surgically removing the covering of
the nares, and olfactory tissue was perfused with dechlorinated municipal tap
water delivered through a Teflon feed at a rate of 7 mL/min. Ag-AgCl electrodes
filled with gelatin containing 0.6% (m/V) NaCl were used to record differential
EOGs. One electrode was placed slightly adjacent to the raphe close to the surface
of the lamellae which was third from the bottom of the olfactory rosette and the
second electrode was placed in the water bath. Following electrode placement,
tissue was allowed to acclimate to background water before pulsing of odorants

107
commenced. A computer controlled solenoid valve was used to control the input
of the background water feed, switching of the valve delivered a 2 s pulse of
odorant or contaminant from a second line. EOGs were amplified 100× using a
DAM50 differential amplifier (World Precision Instruments, Sarasota, FL) and
signals were digitized for 10 s after. Peak height was compared to the pre-pulse
baseline to quantify odorant or contaminant responses.
Statistical Analysis
Concentration response curves
Responses to all odorants and contaminants were presented as the recorded EOG
values (mV). Differences among concentrations of the odorants, L-serine and
TChA, were tested using a one-way repeated measure (RM) analysis of variance
(ANOVA). Differences among concentrations of OSPW, O3OSPW and NaCl
control were tested using a one-way RM ANOVA followed by Holm-Sidak post-
hoc test. Differences between OSPW, O3OSPW, and NaCl control concentrations
were tested using a two-way RM ANOVA followed by Holm-Sidak post-hoc test.
For each fish in 30 min exposures, exposure and post-exposure EOG values were
determined as the percent of the average of the first three pre-exposure EOG
values. Differences between controls and exposure groups were tested using a
two-way RM ANOVA followed by Holm-Sidak post-hoc test. The percent
change was also determined between controls and exposed fish, when a
significant difference was found. The percent change was calculated using the

108
formula: % change = 100 - (% pre-exposure EOG exposed / % pre-exposure EOG
control) * 100.
For each fish in 7 d exposures, EOG values were determined as the average of the
first three responses recorded and expressed as mV. Differences between controls
and exposure groups were tested using a one-way RM ANOVA followed by
Holm-Sidak post-hoc test.
Results
Na+ / Cl- analysis
A linear regression model was fitted to the spectrophotometer measurements
taken from known, nominal chloride concentrations. The equation of the line was
y = 0.0021 + 0.007x, with y being the optical density and x the concentration in
mg/L; the equation R2 value was 0.994 (Figure 3-1). A linear regression model
was fitted to atomic absorption spectrophotometer measurements taken from
known Na+ concentrations. The equation of the line was y = 0.019 + 0.096x, with
y being the absorbance and x the concentration in mg/L, with an R2 value of 0.997
(Figure3-2).
The 1% dilutions of OSPW and O3OSPW were found to be within the range of
the standard curve, and so these dilutions were used to determine the amount of
Na+ and Cl- to be included in the control. 1% OSPW and 1% O3OSPW had OD
(480) of 0.033 and 0.030, respectively, and emission values of 0.807 and 0.618,
respectively. As 1% OSPW was found to have a higher Na+ concentration, its

109
values were used to create the NaCl control. Results were extrapolated to create a
control representative of 10% OSPW, and as such contained 101 mg/L Cl- and
578 mg/L of Na+.
Concentration response curves for odorants
L-serine and TChA evoked EOGs in a concentration-dependent manner, with
EOGs increasing with increasing odorant concentrations (F3,55 = 15.7, p < 0.01;
Figure 3.3). EOGs evoked by 10-3
and 10-5
M L-serine (mean = 9.23 ± 1.64 mV,
3.06 ± 0.62 mV, respectively) were statistically increased by 550 and 110%,
respectively, compared to those evoked by 10-7
M (mean = 1.43 ± 0.38 mV; p =
0.01, < 0.01, respectively) (Figure 3.3). EOGs evoked by concentrations of 10-3
and 10-5
M (mean= 9.73 ± 0.81 mV, 5.97 ± 0.57 mV, respectively) were
statistically increased by 560, 480, and 310%, respectively, compared to those
evoked at 10-9
M (mean= 1.47 ± 0.55 mV; p = < 0.01, < 0.01, < 0.01,
respectively) (Figure 3.3).
L-serine and TChA-evoked EOGs compared at the same concentrations differed
with each other (F,355 = 15.7, p < 0.01; Figure 3.3). TChA-evoked EOGs at 10-5
M
were statistically increased by 110% compared to L-serine-evoked EOGs at the
same concentration (p < 0.01), while TChA-evoked EOGs at 10-7
M were
numerically increased by 28% compared to L-serine-evoked EOGS at the same
concentrations. These results suggest that TChA is a slightly more potent odorant
than L-serine for rainbow trout.
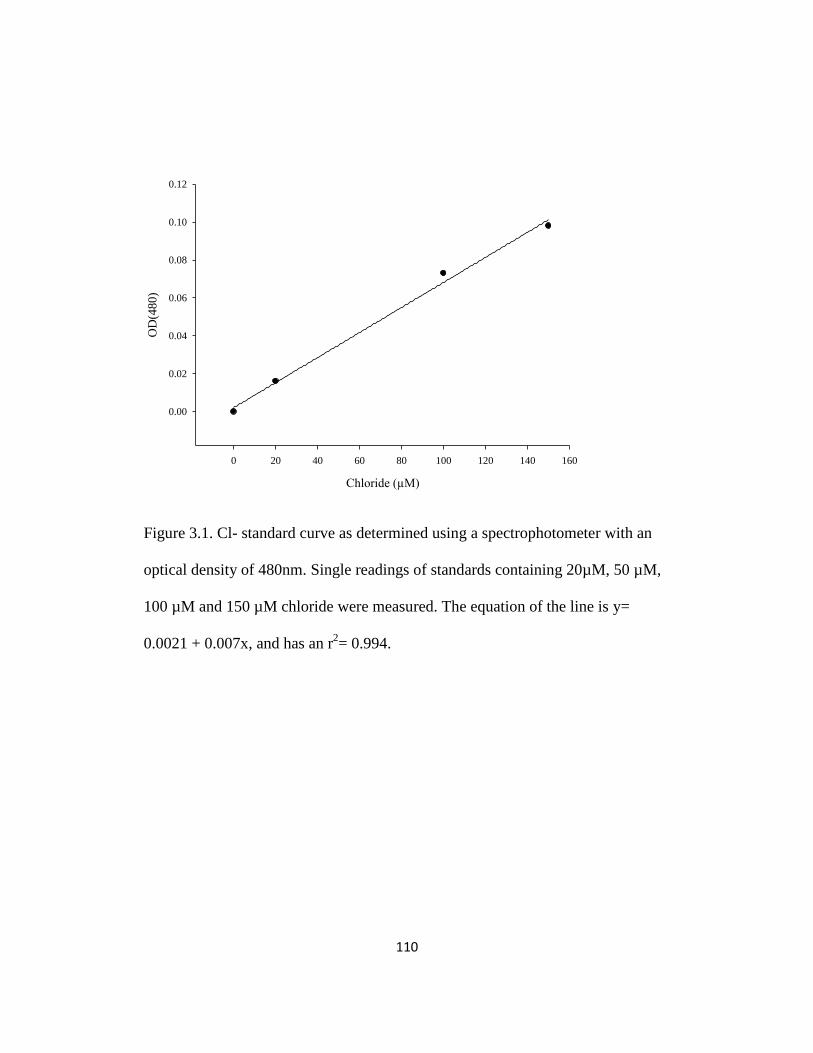
110
Chloride (µM)
0 20 40 60 80 100 120 140 160
OD
(480)
0.00
0.02
0.04
0.06
0.08
0.10
0.12
Figure 3.1. Cl- standard curve as determined using a spectrophotometer with an
optical density of 480nm. Single readings of standards containing 20µM, 50 µM,
100 µM and 150 µM chloride were measured. The equation of the line is y=
0.0021 + 0.007x, and has an r2= 0.994.

111
Sodium concentration (mg/L)
0 2 4 6 8 10 12
Em
issi
on
0.0
0.2
0.4
0.6
0.8
1.0
Figure 3.2. Na+ standard curve determined by atomic absorption
spectrophotometry. Single readings from sodium solutions with known
concentrations of 1, 2, 5 and 10 mg/L were measured. The equation of the line is
y = 0.019 + (0.096) x, r2
= 0.997.

112
Concentration Response Curves for OSPW, O3OSPW, and Sodium and chloride
control
OSPW-evoked EOGs increased in a concentration dependent manner, with EOGs
increasing with increasing concentrations of NAs (F5,35 = 71.2, p < 0.01; Figure
3.4). EOGs evoked from rainbow trout using OSPW containing 40, 20 and 4 ppm
NAs (mean= 6.37 ± 1.66 mV, 5.44 ± 1.65 mV, 3.33 ± 1.04 mV, respectively)
were statistically increased by 910, 770 and 430% respectively compared to those
evoked by OSPW containing 0.004 ppm NA (mean= 0.63 ± 0.28 mV; p = 0.01,
0.01, <0.01, respectively), while those evoked by OSPW containing 2 and 0.4
ppm NAs (mean = 1.60 ± 1.11 mV , 1.21 ± 0.54 mV, respectively) were
numerically increased by 160 and 92%, respectively, compared to those evoked
by OSPW containing 0.004 ppm NA.
O3OSPW-evoked EOGS increased in a concentration dependent manner, with
EOGs increasing with increasing concentrations of NAs (F5,34 = 247, p < 0.01)
(Figure 3.4). The EOGs evoked from rainbow trout using O3OSPW containing 5,
2.5, 0.5 and 0.25 NAs (mean = 6.68 ± 0.26mV, 5.28 ± 0.57 mV, 2.35 ± 0.53 mV,
1.52 ± 0.41 mV, respectively) were statistically increased by 1300, 1000, 400, and
230% compared to those evoked by O3OSPW containing 0.0005 ppm NA (mean
= 0.47 ± 0.23 mV) (p = 0.01, 0.01, <0.01, <0.01); those evoked by O3OSPW
containing 0.05 ppm NA (mean=0.74 ± 0.29 mV) were numerically increased by
58% compared to those evoked by OSPW containing 0.0005 ppm NA.

113
Concentrations of Na+ and Cl- matched to concentrations found in dilutions of
OSPW evoked EOGs in a concentration-dependent manner, with EOGs
increasing with increasing concentrations of Na+ and Cl- (F5,34 = 51.3, p < 0.01)
(Figure 3.4). The NaCl control evoked EOGs at a dilution used to represent Na+
and Cl- concentrations found in OSPW containing 40, 20, 4, and 2 ppm NAs
(mean = 15.5 ± 4.40 mV, 11.0 ± 2.99 mV, 6.24 ± 1.53 mV, 4.84 ± 1.51 mV,
respectively) were statistically increased by 760, 510, 250 and 170% compared to
those evoked by Na+ and Cl- concentrations found in OSPW containing 0.0004
ppm NAs (mean = 1.81 ± 0.35 mV) (p = 0.01, < 0.01, < 0.01, 0.04, respectively);
those evoked by Na+ and Cl- concentrations found in OSPW containing 0.4 ppm
NA (mean = 2.30 ± 1.05 mV) were numerically increased by 27% compared to
those evoked by Na+ and Cl- concentrations found in OSPW containing 0.0004
ppm NA.
EOGs evoked by similar % dilutions of OSPW, O3OSPW, and the NaCl control
differed between groups (F10,106 = 13.6, p < 0.01; Figure 3.5). The 100% dilutions
of OSPW and NaCl control were previously expressed as 40 ppm NAs, and
decreasing dilutions correspond to previously mentioned decreases in NAs. 100%
dilutions of O3OSPW were previously expressed as 5 ppm NAs and decreasing
dilutions correspond to previously mentioned decreases in NAs. EOGs evoked by
the NaCl control at 100, 50, 10, and 5% dilutions were statistically increased by
59, 51, 47 and 67%, respectively, compared to EOGs evoked by OSPW at the
same dilutions (p values < 0.01, < 0.01, < 0.01, < 0.01, respectively); NaCl
control EOGs evoked by 1 and 0.01% dilutions were numerically decreased by 47

114
and 66%, respectively, compared to those evoked by OSPW at the same dilutions.
EOGs evoked by the NaCl control at 100, 50, 10, and 5% dilutions were
statistically increased by 57, 52, 62 and 69% respectively compared to EOGs
evoked by O3OSPW at the same dilutions (p values < 0.01, < 0.01, < 0.01, <
0.01, respectively); NaCl control EOGs evoked by 1 and 0.01% dilutions were
numerically decreased by 68 and 75%, respectively, compared to those evoked by
O3OSPW at the same dilutions. These results suggest that EOGs evoked by
OSPW and O3OSPW do not depend on the concentration of NA within the
sample, but may depend on concentrations of ions such as Na+ and Cl-.

115
Concentration (M)
-10 -9 -8 -7 -6 -5 -4 -3 -2
EO
G (
mV
)
0
2
4
6
8
10
aa
b
c
dd
e
f
Figure 3.3. Concentration response curves for L-serine (n=8) and TChA
(n=7). EOGs were evoked by increasing concentrations of L-serine or TChA.
Differences in EOGs between concentrations are denoted by different letters.

116
Concentration (ppm)
0.0001 0.001 0.01 0.1 1 10 100
EO
G (
mV
)
0
5
10
15
20
cc
b
aa
a dde
f
g
h
i
jk
k
l
m
ij
Figure 3.4. Concentration response curves for OSPW (n=6), O3OSPW (n=6),
and the NaCl control (n=7). EOGs were evoked by increasing concentrations of
OSPW, O3OSPW, or the NaCl control. Differences between increasing
concentrations were denoted using different letters.

117
Dilution (%)
0.001 0.01 0.1 1 10 100 1000
EO
G (
mV
)
0
5
10
15
20
1
2,2
3
4,4
5
6,6
7
8,8
Figure 3.5. Concentration response curves for EOGs evoked by OSPW (n=6),
O3OSPW (n=6), and the NaCl control (n=7). EOGs were evoked by
increasing concentrations of OSPW, O3OSPW, or the NaCl control. Differences
between OSPW, O3OSPW, and the NaCl control are denoted using different
numbers.

118
30 min exposures
L-serine
L-serine-evoked EOGs were compared to both pre-exposure and control EOGs
throughout a 30 min exposure to 10% OSPW, 1% OSPW, 10% O3OSPW, or the
NaCl control. Pre-exposure EOGs did not differ between groups to be exposed to
10% OSPW, 1% OSPW, 10% O3OSPW, the NaCl control, or dechlorinated water
(control) (means, in mV = 1.96 ± 0.64, 2.25 ± 1.08, 1.33 ± 0.54, 1.56 ± 0.43; 2.27
± 1.51, respectively; F4,35 = 1.80, p = 0.15; Figure 3.6).
The EOGs evoked by 10% O3OSPW exposed rainbow trout were statistically
decreased on average by 60% compared to pre-exposure throughout the 30 min
exposure (F11,338 = 1.96, p < 0.01; Figure 3.7, Table 3.2). EOGs evoked by all
other exposure groups returned to pre-exposure values during the recovery period.
The EOGs evoked by 10% O3OSPW exposed rainbow trout were statistically
decreased on average by 72% compared to controls throughout the 30 min
exposure (F40,314 = 1.99, p < 0.01) (Figure 3.7, Table 3.2). The EOGs evoked by
10% OSPW, 1% OSPW and the NaCl control exposed rainbow trout were
numerically decreased on average by 42, 33 and 32%, respectively, compared to
controls throughout the 30 min exposure (Figure 3.7, Table 3.2). All exposure
groups returned to control values during the recovery period.

119
Exposure group
control 10%OSPW 1%OSPW 10%O3OSPW Na+/Cl-
EO
G (
mV
)
0
1
2
3
4
5
Figure 3.6. Pre-exposure EOGs evoked using L-serine and TChA. No
differences were found between groups that would be exposed to 10% OSPW
(n=6), 1% OSPW (n=11), 10% O3OSPW (n=7), the NaCl control (n=6) and
dechlorinated water (control) (n=6).

120
Time (min)
pre 2 6 10 14 18 22 26 30 2post 6post10post
% p
re-e
xp
osu
re E
OG
-50
0
50
100
150
200
a c
b bb b
bb
ab
aa
a
* ** *
**
**
* **
c
c c
cc
c
c
c
c
c
d
c
Figure 3.7. Effects of a 30 min exposure to 10% OSPW (n=6), 1% OSPW
(n=11), 10% O3OSPW (n=7), the NaCl control (n=6) and dechlorinated
water (control) (n=6) on EOGs evoked by L-serine. EOGs evoked from fish
exposed to 10% O3OSPW are decreased during exposure; however return to pre-
exposure values post-exposure. Differences between pre-exposure and EOGs
evoked throughout the exposure were denoted using different letters and asterisk
denotes differences from controls within that time point.

121
Table 3.2
Odorant Exposure
Group
Time point Comparison
with pre-
exposure (p-
value)
Comparisons
with controls at
the same time
point (p-value)
L-serine 10% OSPW
1% OSPW
10%
O3OSPW
2
6
10
14
18
22
26
30
2 post
6 post
10 post
2
6
10
14
18
22
26
30
2 post
6 post
10 post
2
6
10
14
18
22
26
30
2 post
6 post
10 post
0.95
0.91
0.67
0.97
0.97
0.95
0.96
0.96
0.94
0.97
0.98
0.99
0.96
0.71
0.98
0.99
0.84
0.95
0.99
0.14
0.66
0.01
0.01
0.01
0.02
0.02
0.02
0.03
0.13
0.02
0.35
0.90
0.43
0.15
0.04
0.02
0.36
0.18
0.11
0.06
0.26
0.52
0.15
0.67
0.44
0.05
0.02
0.31
0.20
0.10
0.19
0.28
0.90
0.85
0.77
< 0.01
< 0.01
< 0.01
0.01
0.01
0.00
0.01
0.01
0.59
0.85
0.99

122
NaCl control
2
6
10
14
18
22
26
30
2 post
6 post
10 post
0.97
1.00
0.99
0.99
0.99
1.00
0.92
0.96
0.65
0.22
0.96
0.11
0.06
0.22
0.26
0.21
0.14
0.19
0.26
0.78
0.94
0.99
TChA 10% OSPW
1% OSPW
10%
O3OSPW
4
8
12
16
20
24
28
4 post
8 post
12 post
4
8
12
16
20
24
28
4 post
8 post
12 post
4
8
12
16
20
24
0.45
0.37
0.45
0.39
0.45
0.45
0.48
0.85
0.96
0.46
0.99
0.98
0.99
0.99
0.99
0.98
0.98
0.18
0.11
0.01
0.09
0.03
0.25
0.15
0.09
0.08
0.03
0.01
0.02
0.02
0.03
0.02
0.03
0.77
0.48
0.93
0.21
0.14
0.11
0.25
0.33
0.14
0.16
0.99
0.70
0.25
0.01
< 0.01
0.03
0.01
0.01
< 0.01

123
NaCl control
28
4 post
8 post
12 post
4
8
12
16
20
24
28
4 post
8 post
12 post
0.14
0.28
0.87
0.60
1.00
1.00
1.00
1.00
0.99
1.00
1.00
0.06
0.01
0.01
0.02
0.97
0.58
0.93
0.21
0.06
0.15
0.25
0.23
0.22
0.09
0.94
0.71
0.58
Table 3.2. Comparisons between exposure groups and pre-exposure or control
EOG values throughout the 30 min exposure. Significance is denoted be p-
values less than 0.5.
124
Taurocholic Acid
TChA-evoked EOGs were compared to both pre-exposure and control EOGs
throughout a 30 min exposure to 10% OSPW, 1% OSPW, 10% O3OSPW, or the
NaCl control. Pre-exposure EOGs did not differ between groups to be exposed to
10% OSPW, 1% OSPW, 10% O3OSPW, the NaCl control, or dechlorinated water
(control) (mean, in mV = 2.95 ± 1.05, 1.77 ± 0.72, 2.39 ± 0.57; 2.75 ± 1.22,
respectively; F4,35 = 1.47, p = 0.24; Figure 3.6).
The EOGs evoked by 10% O3OSPW exposed rainbow trout were statistically
decreased on average by 40% compared to pre-exposure throughout the 30 min
exposure (F10,314 = 1.99, p < 0.01) (Figure 3.8, Table 3.2). The EOGs evoked by
10% OSPW exposed rainbow trout were numerically decreased on average by
26% compared to pre-exposure throughout the 30 min exposure (Figure 3.8,
Table 3.2). EOGs evoked by goldfish exposed to 1% OSPW and the NaCl control
were statistically increased on average by 50.3 and 50.5% respectively compared
to pre-exposure during the recovery period (F40,314 = 1.99, p < 0.01; Figure 3.8,
Table 3.2). EOGs evoked by all other exposure groups returned to pre-exposure
values during the recovery period.
The EOGs evoked by 10% OSPW and 10% O3OSPW exposed rainbow trout
were statistically decreased on average by 58 and 48%, respectively, compared to
controls throughout the 30 min exposure (F40,314 = 1.99, p < 0.01) (Figure 3.8,
Table 3.2). The EOGs evoked by 1% OSPW and the NaCl control exposed
rainbow trout were numerically decreased on average by 24 and 29%,

125
Time (min)
pre 4 8 12 16 20 24 28 4post 8post 12post
% p
re-e
xp
osu
re E
OG
0
50
100
150
200
*
*
*
*b
** **
**
*
* **
a
a
a
a a a a
a
a a
Figure 3.8. Effects of a 30 min exposure to 10% OSPW (n=6), 1% OSPW
(n=11),10% O3OSPW (n=7), , the NaCl control (n=6) and dechlorinated
water (control) (n=6) on EOGs evoked by TChA. 10% OSPW and 10% O3OSPW
decrease TChA EOGs throughout the exposure; however recovery does occur
post exposure. Differences between pre-exposure and EOGs evoked throughout
the exposure were denoted using different letters and asterisk denotes differences
from controls within that time point.

126
respectively, compared to controls throughout the 30 min exposure (Figure 3.8,
Table 3.2). All exposure groups returned to control values during the recovery
period.
In general, a 30 min exposure to 10% O3OSPW results in the largest decreases in
both L-serine and TChA-evoked EOGs. Decreases in EOG magnitudes, for both
L-serine and TChA-evoked EOGs, during 30 min exposures can be ordered as
follows: 10% O3OSPW > 10% OSPW > NaCl control > 1% OSPW.
7 d exposures
L-serine
L-serine-evoked EOGs were compared to controls and between exposure groups
after a 7 d exposure to 10% OSPW, 1% OSPW, 10% O3OSPW, or the NaCl
control. L-serine EOGs evoked by rainbow trout exposed to 10% OSPW, 1%
OSPW, 10% O3OSPW, or the NaCl control were not statistically different from
controls (F4,35 =1.06, p = 0.39; Figure 3.8). EOGs evoked by rainbow trout
exposed to 10% OSPW or the NaCl control (mean, in mV = 1.33 ± 0.63, 1.40 ±
0.59, respectively) were numerically decreased by 26 and 22% respectively
compared to controls (1.80 ± 0.63 mV) after a 7 d exposure. L-serine EOGs
evoked by rainbow trout exposed to 10% OSPW, 1% OSPW, 10% O3OSPW, or
the NaCl did not differ statistically between groups (F4,35 =1.06, p = 0.39; Figure
3.8). EOGs evoked by rainbow trout exposed to 10% O3OSPW, or the NaCl

127
control were numerically increased by 31, and 26%, respectively, compared to
those evoked by rainbow trout exposed to 10% O3OSPW.
Taurocholic Acid
TChA-evoked EOGs were compared to controls and between exposure groups
after a 7 d exposure to 10% OSPW, 1% OSPW, 10% O3OSPW, or the NaCl
control. EOGs evoked by rainbow trout exposed to 10% OSPW (mean = 1.25 ±
0.33 mV) were statistically decreased by 49% compared to controls (mean = 2.39
± 0.93 mV) after a 7 d exposure (F4,38 = 4.53, p < 0.01; p < 0.01; Figure 3.8).
EOGs evoked by rainbow trout exposed to 1% OSPW or the NaCl control (mean,
in mV = 1.63 ± 0.44, 1.44 ± 0.45, respectively) were numerically decreased by 32
and 40% respectively compared to controls after a 7 d exposure. EOGs evoked by
rainbow trout exposed to 10% O3OSPW were statistically increased by 81%
compared to those evoked by rainbow trout exposed to 10% OSPW after a 7 d
exposure (F4,38 = 4.53, p < 0.01; p = 0.04; Figure 3.8). EOGs evoked by rainbow
trout exposed to 1% OSPW were numerically increased by 33 compared to those
evoked by rainbow trout exposed to 10% OSPW after a 7 d exposure.
In general, a 7 d exposure to 10% OSPW resulted in the largest decreases in both
L-serine and TChA-evoked EOGs. Decreases in L-serine-evoked EOG
magnitudes can be ordered as follows: 10% OSPW > NaCl control > 10%
O3OSPW > 1% OSPW. Decreases in TChA-evoked EOG magnitudes can be
ordered as follows: 10% OSPW > NaCl control > 1% OSPW > 10% O3OSPW.

128
Exposure group
Control Na+/Cl- 10%OSPW 1%OSPW O3OSPW
EO
G (
mV
)
0
1
2
3
* 2
1
Figure 3.9. Effects of a 7 d exposure to 10% O3OSPW (n=7), 10% OSPW (n=6),
1% OSPW (n=11), the NaCl control (n=6) and dechlorinated water (control) on
electro-olfactograms (EOG) evoked by L-serine and TChA. EOGs evoked
from fish exposed to 10% OSPW are the most effected with respect to both
odorants. Differences between exposure groups are denoted by different numbers
and differences between exposure groups and controls are denoted by asterisk.

129
Discussion
Rainbow trout were able to detect OSPW and O3OSPW in a concentration
dependent manner. This finding is important, as detection may allow rainbow
trout to avoid regions contaminated with either OSPW or O3OSPW. I
hypothesized that OSPW and O3OSPW would evoke EOGs in rainbow trout;
however, I did not expect it to do so in a concentration dependent manner as
Tierney et al. did not see a concentration-dependent increase in EOGs with
increasing concentrations of other cyclic organic contaminants [37, 38]. I am
confident in these findings as L-serine and TChA concentration response curves
recorded from the same rainbow trout also occurred in a concentration-dependent
manner. EOGs evoked by natural odorants were also decreased as a result of
exposure to OSPW and O3OSPW, however recovery occurred immediately after
a 30 min exposure. Overall, my data suggest that OSPW and O3OSPW contain
compounds (most likely NAs) that act as odorants with the ability to compete
with other odorant molecules for olfactory receptors (ORs).
Detection of OSPW and O3OSPW
Concentrations of NAs within OSPW are eight-fold greater than those in
O3OSPW at the same dilution (v/v); however, EOGs evoked by OSPW and
O3OSPW did not differ at the same dilution factors. These data suggest that NA
species within O3OSPW, that are detectable via olfaction, occur at a higher
concentration than in OSPW. Martin et al. showed that tetra- and mono-cyclic NA
concentrations increased post-ozonation while di- and tri-cyclic NA
concentrations decreased. I suggest that mono- and tetra-cyclic NAs may bind
130
ORs, while di- and tri-cyclic NAs may not [74]. This would account for the lack
of difference in EOGs at the same dilutions of OSPW and O3OSPW, as OSPW
contained an eight-fold higher concentration of NAs, meaning there were still
concentrations of mono and tetra cyclic NAs that may be comparable to those in
O3OSPW.
The lack of difference in EOGs at the same dilutions of OSPW and O3OSPW
may also be attributed to changes in conductivity; however, the EOGs evoked by
the NaCl control were greater than those evoked by both OSPW and O3OSPW at
1% dilutions and above, and detection again occurred in a concentration
dependent manner. Anderson et al. showed that conductivity between OSPW and
O3OSPW does not differ greatly, suggesting that ion concentrations within the
two is quite similar at the same dilution [2]. EOGs evoked by the NaCl control
were greater than those evoked by OSPW and O3OSPW at the same dilutions,
which suggests that perhaps NAs within OSPW and O3OSPW decreased the
ability of ions within both mixtures to evoke EOG. It should be noted however
that decreases in L-serine and TChA EOGs seen during 30 min exposures to 10%
OSPW and 10% O3OSPW give weight of evidence that components of OSPW
are in fact binding olfactory receptors. This is further supported as 30 min
exposures to 1% OSPW did not result in the same magnitude of decrease in either
L-serine or TChA-evoked EOGs when compared to 10% OSPW exposures, and
the NaCl control did not result in the same decreases as either 10% OSPW or 10%
O3OSPW, suggesting that rainbow trout are in fact detecting NAs within the

131
mixture. It should also be taken into consideration that other ions such as calcium
were not present in this control, which may explain the high responses to the
NaCl control. Calcium and positively charged metals such as copper have
previously been shown to both evoke and suppress olfactory responses [6, 22, 55],
suggesting that should these ions be included in the NaCl control, EOGs may not
have been at such high magnitudes. The magnitude of the NaCl EOGs is likely
attributed to changes in membrane polarization in all cells in the olfactory
epithelium, hence the large potentials measured.
30 min exposure to 10% OSPW, 1% OSPW, 10% O3OSPW, and the NaCl control
Exposure to both 10% OSPW and 10% O3OSPW resulted in decreased EOGs
evoked by L-serine and TChA. There are no previous OSPW olfactory toxicology
studies, but a comparison can be made to a standard toxin, copper. Copper is a
contaminant that has been well characterized to affect fish olfaction [22, 36, 43,
49, 62, 101] and so I elected to compare results to effects of copper on EOGs
evoked by both L-serine and TChA. L-serine-evoked EOGs in rainbow trout
exposed to 10% OSPW and 10% O3OSPW for 30 min were decreased by 16.2
and 59.5%, respectively, a decrease that is comparable to the 30 and 50%
decreases seen in L-serine-evoked EOGs by Coho salmon (Oncorhynchus
kisutch) exposed to 2 and 5 μg/L CuCl2, respectively, for 30 min [6]. TChA-
evoked EOGs by rainbow trout exposed to 10% OSPW and 10% O3OSPW were
decreased by 26.1 and 40.1%, respectively, decreases that are comparable to the
33% decrease seen in TChA-evoked EOGs in Coho salmon exposed to 10 μg/L

132
CuCl2 for 30 min. NA concentrations in 10% OSPW and 10% O3OSPW were 4.0
and 0.50 mg/L, respectively, and these concentrations are 400- and 10-fold greater
than concentrations of copper that resulted in similar decreases to L-serine, and
400- and 50-fold greater than concentrations of copper that resulted in similar
decreases in TChA. Recovery of EOGs was also seen to occur more quickly in
OSPW and O3OSPW exposed rainbow trout than copper exposed fish, as rainbow
trout L-serine- and TChA-evoked EOGs returned immediately post exposure to
OSPW and O3OSPW, while Coho salmon L-serine- and TChA-evoked EOGs did
not return for 90 min follow Cu exposure. These comparisons suggest that OSPW
and O3OSPW at 100 μg/L NA concentrations are less toxic to olfactory tissue
than copper at 1-10 μg/L concentrations (Cu appears >10-fold more toxic than
NAs).
An interesting comparison is between 1% OSPW and 10% O3OSPW, as they
have similar NA concentrations (0.40 and 0.50 μg/L, respectively), yet evoke
EOGs at different magnitudes, and differ in their ability to decrease olfactory
detection of both L-serine and TChA. A study by Anderson et al. found that
mono- and tert-NAs were increased in concentration and di- and tri-NAs were
decreased in concentration in O3OSPW compared to OSPW [2]. A study by
Pérez-Estrada et al. on the effects of ozonation on NAs showed that the
composition of NAs within OSPW and O3OSPW differed, as ozonation removed
many of the alkyl groups attached to the cyclic portions of NAs within OSPW
[90]. As rainbow trout were shown to detect 10% O3OSPW using olfaction and
detection of both L-serine and TChA returned immediately during the recovery

133
period by rainbow trout exposed to 10% O3OSPW, I suggest that alkyl groups
that have been removed from NAs and the remaining cyclic carbon structures
were able to bind L-serine and TChA ORs during a 30 min exposure. L-serine
ORs in rainbow trout have been shown to detect L-alanine and some of its
derivatives, all of which are two or three chain carbon structures with a carboxylic
acid group and an amino group[17] . The structure of TChA is a four ringed
carbon structure which resembles steroids such as estrogen, and as such its OR
may be able to detect other four ringed carbon structures [45]. The NAs found
within OSPW all contain an alkyl group with a carboxylic acid terminal, which
may be removed during ozonation, and a base mono or polycyclic carbon ring
structure [14]. Martin et al. showed that NA with Z numbers of -8, which are tetra
cyclic ring structures similar to that of TChA, increase in concentration after the
ozonation process [74]. These two components may interact with both L-serine
and TChA ORs during a 30 min exposure to O3OSPW; however, the alkyl groups
are not removed from NAs in 1% OSPW, and this may contribute to their lack of
effect on both OSN families.
7 d exposure to 10% OSPW, 1% OSPW, 10% O3OSPW, and the NaCl control
A 7 d exposure to 10% OSPW resulted in decreased L-serine- and TChA-evoked
EOGs compared to those evoked in rainbow trout exposed to decholorinated
water control and 10% O3OSPW. Specifically, L-serine- and TChA-evoked
EOGs were reduced by 26 and 47% compared to controls. Previous studies
examining 96 h and 7 d exposures have shown that mixtures of organic

134
contaminants, as well as individual organic contaminants within the μg/l
concentration, also have the ability to impair olfactory detection of both L-serine
and TChA as measured by EOG in multiple teleost fish species [56, 101, 119,
121]. Specifically, Coho salmon exposed to 0.625 μg/L chlorpyrifos had L-serine-
evoked EOGs that were decreased by 25%, and those exposed to 2.5 μg/L had
TChA-evoked EOGs that were decreased by 55% [101]. Rainbow trout exposed
to a pesticide mixture previously described in chapter 2 with a total concentration
of 10.1 μg/L experienced 41% decreases in L-serine-evoked EOGs. OSPW does
not appear to be as toxic as individual pesticides or mixtures, as NAs within
OSPW are at much greater concentrations than pesticides the pesticides used in
the aforementioned studies, yet evoked similar EOG decreases in the same time
period.
Concentration dependent EOG reductions
Decreases in L-serine and TChA-evoked EOGs occurred in a concentration
dependent manner in rainbow trout exposed to OSPW. These results suggest that
olfactory tissue was able to adapt to the NAs within OSPW at concentration of
0.40 mg/L but not at a concentration of 4.0 mg/L during a 30 min and 7 d
exposure. It should be noted, however, that L-serine and TChA evoked EOGs
were still greater in 1% OSPW than 10% O3OSPW; as previously mentioned this
was likely due to the composition of NAs within the mixture.

135
Ozonation and detoxification
Structural modifications of the NAs within OSPW may affect their
biodegradability by detoxification enzymes within the olfactory epithelium of
rainbow trout. There is evidence that cytochrome p450 (CYP) 1A and 3A exist
within the olfactory tissue, and both of these detoxification enzymes can
breakdown polycyclic organic molecules [106] (Appendix 2-1). While a study by
He et al. showed increases in CYP 1A and 3A within the liver do not occur as a
result of exposure to O3OSPW, it could be suggested that, due to its highly
exposed nature, olfactory tissue may experience increases of these enzymes in the
presence of both OSPW and O3OSPW [50]. It is possible that up-regulation of
CYP 1A and 3A occurred to protect olfactory tissue in rainbow trout exposed to
NA concentrations within a range of 0.40-0.50 mg/L, and resulted in the recovery
of L-serine and TChA EOGs during a 7 d exposure. This up-regulation may also
have occurred in rainbow trout exposed to 4.0 mg/L NAs; however, the NA
concentration may have been too high for these detoxification enzymes to be
effective. Together these findings suggest that OSPW is more toxic to olfactory
tissue than O3OSPW at the same concentrations during a 7 d exposure.
It should be noted that the EOG decreases were found at concentrations below the
LC50 for two-month old salmon reported by Dokholyan and Magomedov [9], and
likely close to that found by MacKinnon and Boergers, who suggested a 96h LC50
for rainbow trout was at a 7% dilution of OSPW (no NA concentration given) [12,
24]. Together these results suggest that O3OSPW is less toxic to rainbow trout
136
olfaction during a 7 d exposure, and may indicate that ozonation is a suitable
treatment for OSPW.
Conclusions
My study shows that rainbow trout have the ability to detect OSPW and
O3OSPW in a concentration-dependent manner that is unrelated to ozonation.
This finding, combined with findings that a 30 min exposure to 10% OSPW, 1%
OSPW, and O3OSPW, decreased L-serine and TChA EOGs, and with findings
that during a 7 d exposure to 10% OSPW, 1% OSPW and 10% O3OSPW, OSPW
exposures decreased L-serine and TChA EOGs while O3OSPW did not, suggests
that the composition of NAs within solution plays an important role in its ability
to disrupt olfaction. Alkyl groups removed during ozonation and tetra cyclic NAs
/ tetra cyclic organic structures may be able to bind ORs associated with L-serine
and TChA during a 30 min exposure; however, their increased biodegradability
may allow tissue to adapt to their presence during a 7 d exposure. Concentrations
of NAs within OSPW at the mg/L range appear harmful to ORs associated with
L-serine and TChA, but concentrations of NAs within OSPW at the μg/L range
have as great of an effect. Furthermore, NAs associated with O3OSPW were less
harmful to olfaction than those associated with OSPW at μg/L concentrations
during exposures of 7 d.

137
Chapter 4: Olfactory detection of nucleosides and nucleobases by goldfish
(Carassius auratus)
Introduction
Nucleotides have previously been identified as chemosensory cues in fishes. The
5´-nucleotides adenosine-5´-monophosphate, adenosine-5´-diphosphate,
adenosine-5´-triphosphate (ATP), citidine-5´monophosphate, guanosine-5´-
monophophate, inosine-5´-monophosphate (IMP) and uridine-5´-monophosphate
have all been identified as chemosensory cues that can be detected via gustatory
receptors in fishes [44]. Many compounds, for example amino acids, that can be
detected by gustatory receptors can also be detected by olfactory receptors (ORs)
[47, 75]. Currently ATP and IMP have been shown to evoke responses in the
olfactory bulb when presented together to olfactory tissue of zebrafish (Danio
rerio) [69]; however, no evidence has been collected regarding receptor binding
or specificity.
Nucleotides, the building blocks of nucleic acids such as DNA and RNA, can be
divided into three components: a phosphate group, a sugar group, and a
nucleobase [61]. Together, the sugar group and nucleobase are identified as a
class of compounds known as nucleosides. Nucleotides differ in with respect to
the number of phosphate groups present, with substitutions of mono-, di-, and tri-
phosphate groups occurring. Sugar groups, including pentose, ribose, or
deoxyribose, also vary between nucleotides. The nucleobase components are
classified as either purines such as adenine or guanine, or pyrimidines, which
includes cytosine, uracil, or thymine.

138
My study used electro-olfactography to demonstrate that goldfish (Carassius
auratus) olfactory ORs can detect the nucleotide adenosine. Adenine, the
nucleobase associated with adenosine, was also tested to demonstrate that neither
the sugar or phosphate groups were needed for olfactory detection. Specificity of
the receptor that may detect adenosine and/ or adenine was also investigated by
measuring electro-olfactogram (EOG) responses to hypoxanthine, a derivative of
adenine, and guanosine, a nucleoside containing the nucleobase guanine and a
ribose sugar, during cross adaptation experiments.
Materials and Methods
Electro-olfactograms
Concentration response curves
Concentration response curves to the purine nucleosides, guanosine and
adenosine, and the purine derivatives, adenine and hypoxanthine were measured
as previously described in chapter 2, following methods of Evans and Hara [27].
Each odorant was tested at a concentration of 10-5
, 10-7
, and 10-9
M.
Cross adaptation
Cross adaptations were conducted as described by Sorensen et al [110]. Briefly,
fish olfactory tissue was perfused with dechlorinated municipal water
(background water) for 10 min before evoking EOGs using 10-5
M L-serine,
adenine, adenosine, guanosine, hypoxanthine, or a background water control.
Background water was then switched to one of adenine, adenosine, guanosine, or
139
hypoxanthine at a concentration of 10-5
M. Background adaptation was given for
30 min or until EOGs evoked by the adapting odorant, at a concentration of
2.0x10⁻⁵
M, were equal to those of background water pulses before adaptation.
Statistical Analysis
Concentration response curves were analyzed using one-way ANOVA followed
by Holm-Sidak post hoc tests. Cross adaptation results were analyzed using one-
way ANOVA followed by Holm-Sidak post hoc test.
Results
Concentration response curves
EOG responses to adenosine and hypoxanthine both occurred in a concentration
dependent manner (adenosine: 10-9
M mean, in mV = 0.68 ± 0.43; 10-7
M mean =
0.77 ± 0.44; 10-5
M mean = 1.06 ± 0.40; F2,37 = 6.28, p < 0.01; hypoxanthine: 10-9
M mean = 0.33 ± 0.20; 10-7
M mean = 0.76 ± 0.33; 10-5
M mean = 0.73 ± 0.47;
F2,36 = 8.89, p<0.01; Figure 4-1). EOGs evoked by 10-7
and 10-9
M adenosine were
decreased by 27 and 36%, respectively, compared to those evoked by 10-5
M (p =
0.03, 0.02, respectively). EOGs evoked by 10-9
M hypoxanthine were decreased
by 57 and 55% compared to those evoked by 10-5
and 10-7
M, respectively (p =
0.02, 0.03, respectively).
EOG responses to adenine and guanosine did not occur in a concentration
dependent manner (adenine: 10-9
M mean = 0.79 ± 0.63; 10-7
M mean= 0.44 ±
0.33; 10-5
M mean = 0.95 ± 0.51; F2,31 = 2.77, p = 0.09; guanosine: 10-9
M mean =

140
0.56 ± 0.31; 10-7
M mean = 0.43 ± 0.31; 10-5
M mean = 0.64 ± 0.39; F2,31 = 2.77, p
= 0.09; Figure 4-1).
Cross-adaptation responses
Cross adaptation of olfactory tissue to the aforementioned nucleosides and
nucleobases revealed a relationship between the detection of adenosine, adenine
and hypoxanthine (Figure 4.2). Adaptation of olfactory tissue to adenosine
numerically decreased adenine- and hypoxanthine-evoked EOGs by 57 and 36%,
respectively, compared to pre-adaptation (Figure 4.2 B). Adaptation of olfactory
tissue to adenine numerically decreased adenosine-evoked EOGs by 17.7%
compared to pre-adaptation (Figure 4.2A). Adaptation of olfactory tissue to
hypoxanthine statistically decreased adenosine-evoked EOGs by 43% (F3,23 =
13.6, p < 0.01; p < 0.01) and numerically decreased adenine EOGs by 27%
compared to pre-adaptation (Figure 4.2D). Post-adaptation EOGs did not differ
statistically from pre-exposure EOGs in all groups, and EOGs post-adaptation
appeared to return at pre-exposure magnitudes. Cross adaptation using guanosine
did not appear to affect the EOGs evoked by adenosine, adenine, or hypoxanthine
during or after the adaptation period when compared to pre-adaptation (Figure
4.2C).

141
Concentration (M)
-9 -7 -5
EO
G (
mV
)
0.0
0.2
0.4
0.6
0.8
1.0
1.2
1.4
a
a
b
c
d
d
Figure 4.1. Concentration response of olfactory sensory neurons as measured by
electro-olfactography (EOG) evoked by increasing concentrations of purine
nucleosides, guanosine and adenosine, and purine derivatives, adenine and
hypoxanthine. EOGs evoked by adenine and hypoxanthine occurred in a
concentration dependent manner. Differences in EOGs evoked by different
concentrations are denoted by different letters.

A) Adenine
a
b
a
a
B) Adenosine
Adaptation
pre during post1 post2
EO
G (
mV
)
0
1
2
3
4
ab
b
aa
cd
d
c
c
EO
G (
mV
)
0
1
2
3
4
ab
a
abb
C) Guanosine
Adaptation
pre during post1 post2
D) Hypoxanthine
Figure 4.2. Cross adaptation of purine nucleosides, a nucleobase, and a purine
derivative. A) Adaptation of olfactory tissue to adenine (n= 8); B) Adaptation of
olfactory tissue to adenosine (n= 6) increased responses to adenine post-
adaptation ; C) Adaptation of olfactory tissue to guanosine (n = 6); D) Adaptation
of olfactory tissue to hypoxanthine (n = 6). The data suggests that adenosine and
hypoxanthine share a receptor. Differences within groups are denoted by different
letters.

143
Discussion
Goldfish are able to detect the nucleosides adenosine and guanosine, as well as
the nucleobase adenine, and the purine derivative hypoxanthine; however, only
adenosine and hypoxanthine appear to evoke EOGs in a concentration dependent
manner.
Concentration response results and cross-adaptation results taken together suggest
that adenosine has a receptor that is specific to its detection; however, both
adenine and hypoxanthine were able to compete with binding of this receptor. An
adaptation to adenosine decreased adenine-evoked EOGs, suggesting that the
presence of the sugar molecule is required for complete binding of the receptor,
and that the presence of the nucleobase alone may only result in partial binding.
The adaptation to either adenosine or hypoxanthine resulted in large decreases to
the other has an interesting implication to the potential specificity of a nucleoside
based olfactory receptor. Hypoxanthine is the nucleobase present in inosine, the
nucleoside portion of IMP, a nucleotide that has previously been shown to evoke
olfactory responses at the olfactory bulb of zebrafish [69]. The ability of
hypoxanthine adaptation to reduce adenosine EOGs by 43.3%, while adenosine
adaptation was only able to reduce hypoxanthine EOGs by 35.8%, suggests that
perhaps the receptor present may detect both adenosine and inosine; however,
inosine may be the dominant ligand for the receptor. This finding also suggests
that only the nucleoside structure, not the entire nucleotide may be required for
binding at the olfactory receptor. As nucleosides associated with ATP and IMP

144
are quite similar in structure (Appendix F), it can be suggested that the presence
of the oxygen group on the hypoxanthine and inosine molecules may play a role
in the binding specificity of a nucleotide-based olfactory receptor.
While guanosine appears to act as an odorant, it does not do so in a concentration
dependent manner, and my results do not suggest that it shares a receptor with the
other compounds tested. This is likely due to binding specificity at the receptor
level being related to the nucleobase present. As guanosine has an amine group
that extends from its six atom ring structure (Appendix F), it is likely that it is
unable to share a receptor with those that do not contain this substitution, and so
may require its own receptor. Yet the absence of a concentration response
relationship, suggests that it is not the primary ligand for the receptor that it was
able to bind.

145
Summary of major findings
Goldfish OSNs detect MF, CF/MF, UV/H2O2/MF reuse and a NCM in a
concentration-dependent manner.
A 30 min exposure to MF, CF/MF, UV/H2O2/MF reuse and a NCM
decreased EOG responses to L-alanine, L-serine, and 17,20-P. EOGs
evoked during these exposures are not as reduced as much as those during
exposures to copper and pesticides, suggesting that many contaminants at
low concentrations do not impair olfaction to the same extent as individual
contaminants at higher concentrations.
A 60 d exposure to MF, CF/MF and UV/H2O2/MF reuse decreased EOG
responses to L-alanine and 17,20-
those seen in lower concentrations of individual pesticides during 7 day
exposures; however this indicates again that mixtures of contaminants at
low concentrations do not impair olfaction to the same extent as individual
contaminants at higher concentrations.
Distance travelled by goldfish post introduction of a pulse of MF, CF/MF,
UV/H2O2/MF reuse and a NCM did not differ from controls introduced to
a pulse of dechlorinated water. Avoidance and attraction to contaminants
has previously been demonstrated, responses which involved increased
distance travelled. This may indicate that goldfish do not perceive treated
reuse or a NCM as harmful or beneficial.

146
Distance travelled by goldfish exposed to MF, CF/MF, UV/H2O2/MF
reuse and a NCM decreased in the same manner as controls when a pulse
of L-alanine was introduced to the environment. The lack of change in
response indicates that fish still respond to L-alanine, regardless of the
presence of treated reuse or a NCM.
Rainbow trout OSNs detect OSPW, O3OSPW, and a Na+/Cl- solution in a
concentration-dependent manner.
A 30 min exposure to 10% O3OSPW decreased EOG responses by
rainbow trout to L-serine and TChA throughout the exposure. EOGs
evoked during these exposures were not as reduced as those during
exposures to copper and pesticides, suggesting that NAs at higher
concentrations do not impair olfaction to the same extent as individual
contaminants at lower concentrations.
A 7 day exposure to 10% OSPW decreased EOG responses by rainbow
trout to L-serine TChA. These reductions are comparable to those seen in
lower concentrations of individual pesticides during 7 day exposures;
however, this indicates again that a mixture of NAs at comparable
concentrations to pesticides do not impair olfaction to the same extent.
Hypoxanthine and adenosine evoked EOG responses in goldfish in a
concentration dependent manner, while adenine and guanosine did not.
A cross adaptation with adenosine decreased EOGs to hypoxanthine and
adenine during exposure. A cross adaptation with adenine decreased
EOGs to adenosine. A cross adaptation with hypoxanthine decreased

147
EOGs to adenosine and adenine. These findings suggest that all three of
the aforementioned compounds share (an) olfactory receptor(s).
A cross adaptation to adenosine, adenine, or hypoxanthine does not affect
guanosine-evoked EOGs. A cross adaptation to guanosine does not affect
adenosine-, adenine-, or hypoxanthine-evoked EOGs. These findings
suggest that guanosine does not share a receptor with any of the other
compounds tested.

148
Troubleshooting EOG acquisition
Often times while conducting EOGs problems with the technique will arise.
Below I have outlined potential problems that may occur while trying to record
EOGs and have included methods by which to determine the problem. It should
be noted that these methods have been written in the order by which they should
be used.
1. Baseline is unresponsive and does not appear to be recording.
-Ensure amplifier is turned on.
-Ensure gelatin within electrodes has actually set, if it has not and is still
liquid often times the fluid will leak out and the electrode holder simply
contains an empty glass capillary tube.
-Blow on the recording electrode while the reference electrode is in the
water bath. If unresponsive, replace electrode. If baseline remains
unresponsive, repeat this test, however this time blow on the reference
electrode and leave the recording electrode in the water bath. If no
prepared electrodes are response, likely missing NaCl in gelatin and so
electrodes should be refilled with gelatin solution.
-Examine electrode holders. If the silver pellet present in the bottom of the
holder appears to be white instead of silver, likely a salt build up that can
be washed out with deionized water. This build up can be avoided be
rinsing holders after each use. If the silver pellet appears brown and scaly,
likely that the electrode holder is no longer of use and should be replaced.
-Turn off channels going to headstage and use test button on amplifier to
149
ensure amplifier is working. Pressing the test button should produce a sine
wave that oscillates between 0.5mV above and 0.5mV below the baseline.
If this does not appear, replace batteries in amplifier or change location
that amplifier is plugged into.
-Remove connections to headstage and place fingers on each connector of
headstage. Tap one finger repeatedly on headstage connection, this should
produce small peaks in the baseline.
-Examine all wires used in connections for frays or cuts. If present, replace
wiring.
-Unplug all wiring, and rewire entire setup. Replace wires that you feel
may be contributing to the problem. Also investigate connection from
amplifier to the data collection device, as many programs are designed to
have a baseline appear regardless of input being present or not.
2. Baseline is thick or noisy (random large spikes occurring repeatedly).
-Ensure electrode is not cupping. Cupping is a term used to describe when
gelatin has pulled back from the tip of the electrode. Gelatin should be
slightly protruding from electrode tip.
-Look under microscope to identify aspects of prep that may be causing
noise. If nares covering is not completely removed, movement of this
tissue can cause noise in baseline. Remove any excess tissue that may be
in the olfactory chamber. If bubbles are forming where fluid delivery is
entering the olfactory chamber, likely that air is present in delivery line.
Remove air from fluid delivery lines by increasing flow rate or flicking the
150
delivery line with your finger.
-Check grounding of all components within setup. Improper grounding
will lead to noise.
-Determine if electrical use in building has changed. Often times change in
draw on electricity, especially due to construction in building, may result
in noise.
-Remove any external hard drives that are connected to the computer
being used in data acquisition. Unlike hard drives in the computer itself,
external hard drives are often not shielded and will result in noise in
baseline.
3. Baseline is responsive, however EOGs are not being evoked upon delivery
of odorant.
-Examine olfactory chamber for excess mucus. This can result from the
electrode touching the olfactory rosette and irritating it or from
contaminants within odorant delivery lines.
-Examine electrodes for cupping or gelatin that is not set.
-Replace electrodes or electrode holders.
-Attempt recording from another fish as current fish may be anosmic.
Anosmia can arise due to water quality in holding tank. Ensure tank is
clean and perform water chemistry to ensure calcium or ammonia
concentrations are not above normal.
-Remake odorant solutions. If this still does not appear to resolve the

151
issue, remake odorant stock solutions. Note, many odorants will degrade
over time and as such stock solutions should be made weekly.
4. Fish waking up during recording process.
-Examine anesthetic delivery. Operculum should be open, however water
should not be moving too quickly through this opening. If this is the case,
decrease the flow rate by shutting the delivery valve slightly. If operculum
are closed, increase the flow rate by opening the delivery valve. Note, the
anesthetic source tank should have a minimum volume that it does not fall
below. Should it fall below this volume the flow rate of anesthetic will be
decreased.
-Examine the expiration date of tricaine methanosulfate. If it is expired it
will not be as potent and should be discarded.
-Increase concentration of stock used to make tricaine methanosulfate
anesthetic solutions.
-Check water temperature. If temperature is higher than the animal is
acclimated to, likely they are metabolizing the anesthetic faster than
normal. Speak with aquatics facility staff about water source temperature
should this be the case.
-Remake stock solution of tricaine methanosulfate used in creation of
anesthetic.
152
Future Directions
Chapter 2
To demonstrate that EOGs are in fact a measure of electrical potentials generated
by OSNs a compound that inhibits the ability of odorants to act on the olfactory
pathway should be used. Forskolin activates the adenylate cyclase pathway that is
associated with the detection of many odorants, and has been demonstrated as a
compound that can be used to inhibit and even abolish EOGs to multiple odorants
[71]. I suggest in future that forskolin be applied to the olfactory tissue after
concentration dependent response experiments and 30 min exposures to
demonstrate that the EOGs measured are actually a measure of OSN activity and
not other cells within the olfactory epithelium having electrical potentials evoked.
One obstacle that arises during the study of contaminant mixtures, as stated by
Tierney et al., is the lack in ability to derive a mechanism through which toxicity
occurs [118]. Studies upon individual contaminants allow us to determine specific
contaminants that correlate to reduction in EOG values for specific odorants.
When dealing with contaminant mixtures there may be multiple compounds
acting additively, synergistically or antagonistically to alter olfaction. Adding to
the complexity of the contaminant mixture found within reuse water is the high
variability in composition over short periods of time. The mixture is known to
change in composition not only on a seasonal basis but on a daily basis (personal
communication Arvinder Singh). To gain a better understanding of the effects

153
caused by this mixture, studies must be conducted looking at individual
components of the mixture.
To identify contaminants within reuse water that have the ability to impair
olfaction, we must first identify which contaminants have the ability to evoke
olfactory responses using EOG. Concentration response curves must be
determined for individual contaminants and a maximum response concentration
must be identified. Once the maximum response concentration is identified, a
cross adaptation study similar to that described by Sorensen et al. should be
conducted [109]. Should a decrease in EOG to a specific odorant or odorant class
occur during the cross adaptation and then return post-cross adaptation, it is likely
that the contaminant present during the adaptation is able to bind the receptor or is
causing modifications to the receptor to prevent binding of the odorant. Should a
decrease in EOG to a specific odorant or odorant class occur during the cross
adaptation and no return is seen post-cross adaption, it is likely that the
contaminant present during the adaptation is able to cause cellular damage to the
olfactory sensory neuron or is able to bind irreversibly to the receptor, resulting in
a permanent loss in receptor function. As the duration of the cross adaptation may
result in increases or decreases in impairment, different durations of cross
adaptation should be used. Exposures which lasted 30 min on the EOG rig were
quite similar to this procedure and have already shown that up to 50% inhibition
was caused by contaminants within treated reuse water in concentration in the
μg/L range. A second experiment that would need to be conducted would be to
conduct a cross adaptation study as previously described; however, in this

154
experiment multiple combinations of contaminants, which were shown to reduce
EOG responses to natural odorants, would be used to determine if synergistic
effects were occurring.
To improve results obtained from the 60 d exposure, I suggest two modifications:
1) reconstructing the contaminant mixture found in reuse water based on averages
of contaminants found within each season, and 2) recording EOGs from the same
goldfish at different time points during the exposure.
To recreate the contaminant mixture found in reuse water I suggest collecting
treated reuse water samples three times each week and analyzing them for a broad
spectrum of contaminants. As contaminants in reuse water have been shown to
fluctuate over time (personal communication Arvinder Singh), an average should
be determined for each contaminant during each season. The contaminant mixture
could then be reconstructed using these average concentrations for each season,
and exposure could be conducted at the University of Alberta. Static renewal of
the contaminant mixture would occur on a daily basis, allowing for the
application of carbon filtration and UV/H2O2 treatment of the mixture each day.
Using this method would keep contaminants within the mixture at a constant
concentration, controlling for variance seen throughout exposures.
By using the same goldfish to record from at each time point, variation between
individuals at different time points will be removed. This was the method I had
wanted to use during exposures; however returning goldfish to the Gold Bar
WWTP was not an option due to daily time constraints. As can be seen in the

155
error presented in concentration response curves and 30 min exposures, not all
goldfish were impacted in the same manner by the presence of contaminants. By
identifying each fish with a fin clip and repeatedly measuring them at set
intervals, it would decrease the variation seen by testing different individuals
along the time course. This would also allow a staggering of the exposures,
allowing for measurements at precise time points during the exposure as opposed
to a range of time points during each exposure.
The current method used to detect changes in behavior has two flaws: 1) lack of 3
dimensional properties and 2) small sample size that does not account for
personality. The first flaw may have contributed in the failure to detect
behavioral changes as measured by distance travelled, as changes in depth are not
factored into the analysis. This may cause problems as food searching behaviors
such as those previously described by Valentincic et al. [126] often involve
changes in depth. The second flaw may have contributed in the failure to detect
behavioral changes as Shamchuk and Tierney [105] have shown that fish exhibit
personalities that affect their behaviors. With the small sample size used, an
accurate representation of these personalities was not achieved. As a three
dimensional assessment of behavior is quite complex and methods to analyze this
data are still being constructed I suggest the behavior experiments be conducted
again, this time using a preference/ avoidance trough and a larger sample size.
This method allows fish to discriminate between a contaminated area and non-
contaminated area and allows them to make a choice between the environments, if
they can detect a difference. This method would allow one to better determine if a

156
behavioral response to the introduction of contaminants exist (as it allows for
movement out of the contaminated zone), unlike the test which I conducted.
Chapter 3
To further identify the ability of rainbow trout to detect NAs within OSPW and
O3OSPW, commercially available NAs, as well as NAs extracted from both
OSPW and O3OSPW, should be tested for their ability to evoke EOGs. Both
OSPW and O3OSPW could also be filtered using granular activated carbon, as
was carried out by Wong et al. [132], and water post-filtration could be tested for
its ability to evoke olfactory responses. By testing a dilution series of this water it
could be determined whether or not the compounds being detected are organic in
nature or if detection of OSPW and O3OSPW is simply occurring due to changes
in conductivity.
The NaCl control used in my experiments needs to be better characterized to
reflect total ion and mineral concentrations within OSPW and O3OSPW. To do so
I would suggest following methods outlined by Sonthalia et al. [107] and Rogers
et al. [96], who determined concentrations of ions within OSPW [95, 107]. The
saltwater control used by Anderson et al. [2] could also be used as a conductivity
control. This control was similar to the one I used except for the inclusion of Ca+.
Chapter 4
To determine receptor specificity of the aforementioned receptor, EOG cross
adaptations should be conducted using ATP, IMP, adenosine, and inosine. An
EOG cross adaptation study using these compounds may allow us to determine if

157
ATP or IMP is the dominant ligand for the receptor, and also if the phosphate
groups are required for their detection.
158
Conclusion
The goal of my thesis was to develop fish olfaction as a biosensor for
anthropogenic contaminants. I was able to show that two fish species have
olfactory responses that are evoked by anthropogenic contaminant mixtures, and
also that these contaminant mixtures are able to impair olfaction. I was also able
to identify two novel classes of odorants, nucleosides and nucleobases. Further
refinement of the model is needed however, specifically in regards to behavioral
assays as was discussed in future directions. My research has laid the ground
work to develop fish olfaction as a biosensor of anthropogenic contaminants;
however the model does need further refinement.

159
Bibliography
1. Agus, E., et al., Odorous Compounds in Municipal Wastewater Effluent
and Potable Water Reuse Systems. Environmental Science & Technology,
2011. 45(21): p. 9347-9355.
2. Anderson, J.C., et al., Effectiveness of Ozonation Treatment in Eliminating
Toxicity of Oil Sands Process-Affected Water to Chironomus dilutus.
Environmental Science & Technology, 2011. 46(1): p. 486-493.
3. Asano, T., Urban water recycling. Water Science and Technology, 2005.
51(8): p. 83-89.
4. Asano, T., Water from (waste)water - the dependable water resource.
Water Science and Technology, 2002. 45(8): p. 24-33.
5. Atchison, G., M. Henry, and M. Sandheinrich, Effects of metals on fish
behavior: a review. Environmental Biology of Fishes, 1987. 18(1): p. 11-
25.
6. Baldwin, D.H., et al., Sublethal effects of copper on coho salmon: Impacts
on nonoverlapping receptor pathways in the peripheral olfactory nervous
system. Environmental Toxicology and Chemistry, 2003. 22(10): p. 2266-
2274.
7. Baldwin, D.H. and N.L. Scholz, The electro-olfactogram: An in vivo
measure of peripheral olfactory function and sublethal neurotoxicity in
fish. Techniques in aquatic toxicology, 2005. 2: p. 257-276.

160
8. Beltran-Heredia, J., et al., Comparison of the degradation of p-
hydroxybenzoic acid in aqueous solution by several oxidation processes.
Chemosphere, 2001. 42(4): p. 351-359.
9. Beltrán, F.J., G. Ovejero, and B. Acedo, Oxidation of atrazine in water by
ultraviolet radiation combined with hydrogen peroxide. Water Research,
1993. 27(6): p. 1013-1021.
10. Beltrán, F.J., G. Ovejero, and J. Rivas, Oxidation of Polynuclear Aromatic
Hydrocarbons in Water. 3. UV Radiation Combined with Hydrogen
Peroxide. Industrial & Engineering Chemistry Research, 1996. 35(3): p.
883-890.
11. Bernet, D., et al., Effects of wastewater on fish health: an integrated
approach to biomarker responses in brown trout (Salmo trutta L.). Journal
of Aquatic Ecosystem Stress & Recovery, 2000. 8(2): p. 143.
12. Boerger, H., M. Mackinnon, and M. Aleksiuk, USE OF BIOASSAY
TECHNIQUES TO EVALUATE THE EFFECTIVENESS OF NATURAL
AND CHEMICAL DETOXIFICATION OF TAR SANDS TAILINGS
WATERS. Canadian Technical Report of Fisheries and Aquatic Sciences,
1986(1480): p. 131-146.
13. Bórquez, A. and V.R. Cerqueira, Feeding behavior in juvenile snook,
Centropomus undecimalis: I. Individual effect of some chemical
substances. Aquaculture, 1998. 169(1–2): p. 25-35.

161
14. Brient, J.A., P.J. Wessner, and M.N. Doyle, Naphthenic Acids, in Kirk-
Othmer Encyclopedia of Chemical Technology. 2000, John Wiley & Sons,
Inc.
15. Brown, S.B. and T.J. Hara, Accumulation of chemostimulatory amino
acids by a sedimentable fraction isolated from olfactory rosettes of
rainbow trout (Salmo gairdneri). Biochimica et Biophysica Acta (BBA) -
General Subjects, 1981. 675(2): p. 149-162.
16. Bruch, R.C. and R.D. Rulli, Ligand binding specificity of a neutral l-
amino acid olfactory receptor. Comparative Biochemistry and Physiology
Part B: Comparative Biochemistry, 1988. 91(3): p. 535-540.
17. Cagan, R.H. and W.N. Zeiger, Biochemical studies of olfaction: binding
specificity of radioactively labeled stimuli to an isolated olfactory
preparation from rainbow trout (Salmo gairdneri). Proceedings of the
National Academy of Sciences, 1978. 75(10): p. 4679-4683.
18. Caprio, J., Olfaction and taste in the channel catfish: An
electrophysiological study of the responses to amino acids and derivatives.
Journal of comparative physiology, 1978. 123(4): p. 357-371.
19. Clemente, J.S. and P.M. Fedorak, A review of the occurrence, analyses,
toxicity, and biodegradation of naphthenic acids. Chemosphere, 2005.
60(5): p. 585-600.
20. DeFraipont, M. and P.W. Sorensen, Exposure to the pheromone
17[alpha],20[beta]-dihydroxy-4-pregnen-3-one enhances the behavioural

162
spawning success, sperm production and sperm motility of male goldfish.
Animal Behaviour, 1993. 46(2): p. 245-256.
21. Derby, C.D. and P.W. Sorensen, Neural processing, perception, and
behavioral responses to natural chemical stimuli by fish and crustaceans.
Journal of Chemical Ecology, 2008. 34(7): p. 898-914.
22. Dew, W.A., C.M. Wood, and G.G. Pyle, Effects of Continuous Copper
Exposure and Calcium on the Olfactory Response of Fathead Minnows.
Environmental Science & Technology, 2012. 46(16): p. 9019-9026.
23. Dokholyan, B. and A. Magomedov, Effect of sodium naphthenate on
survival and some physiological-biochemical parameters of some fishes.
Journal of Ichthyology, 1983. 23(6).
24. Dokholyan, B. and A. Magomedov, The effect of sodium naphthenate on
the viability and physiological and biochemical indices of fish. Vopr
Ikhtiol, 1983. 23: p. 1013-1019.
25. DØVing, K.B., R. Selset, and G. Thommesen, Olfactory sensitivity to bile
acids in salmonid fishes. Acta Physiologica Scandinavica, 1980. 108(2): p.
123-131.
26. EPCOR. GOLD BAR WASTEWATER TREATMENT PLANT. 2011 [cited
2013 January 15]; Available from:
http://corp.epcor.com/watersolutions/operations/edmonton/goldbar/Pages/
gold-bar-wastewater-treatment-plant.aspx.
27. Evans, R.E. and T.J. Hara, THE CHARACTERISTICS OF THE
ELECTRO-OLFACTOGRAM (EOG) - ITS LOSS AND RECOVERY

163
FOLLOWING OLFACTORY NERVE-SECTION IN RAINBOW-TROUT
(SALMO-GAIRDNERI). Brain Research, 1985. 330(1): p. 65-75.
28. Fauci, A.S., Harrison's Principles of Internal Medicine. 17 ed. 2008:
McGraw-Hill Professional.
29. Fraker, S.L. and G.R. Smith, Direct and interactive effects of ecologically
relevant concentrations of organic wastewater contaminants on Rana
pipiens tadpoles. Environmental Toxicology, 2004. 19(3): p. 250-256.
30. Galus, M., et al., Chronic effects of exposure to a pharmaceutical mixture
and municipal wastewater in zebrafish. Aquatic Toxicology, 2013. 132: p.
212-222.
31. Gamal El-Din, M., et al., Naphthenic acids speciation and removal during
petroleum-coke adsorption and ozonation of oil sands process-affected
water. Science of The Total Environment, 2011. 409(23): p. 5119-5125.
32. Garcia-Garcia, E., et al., Ozone treatment ameliorates oil sands process
water toxicity to the mammalian immune system. Water Research, 2011.
45(18): p. 5849-5857.
33. GIAQUINTO, P.C. and T.J. HARA, Discrimination of bile acids by the
rainbow trout olfactory system: Evidence as potential pheromone.
Biological Research, 2008. 41: p. 33-42.
34. Goh, Y. and T. Tamura, Effect of amino acids on the feeding behaviour in
red sea bream. Comparative Biochemistry and Physiology Part C:
Comparative Pharmacology, 1980. 66(2): p. 225-229.
164
35. Gray, R.H., Fish behavior and environmental assessment. Environmental
Toxicology and Chemistry, 1990. 9(1): p. 53-67.
36. Green, W.W., et al., Copper Binding Dynamics and Olfactory Impairment
in Fathead Minnows (Pimephales promelas). Environmental Science &
Technology, 2010. 44(4): p. 1431-1437.
37. Grewer, D.M., et al., Naphthenic acids and other acid-extractables in
water samples from Alberta: What is being measured? Science of The
Total Environment, 2010. 408(23): p. 5997-6010.
38. Hagen, M.O., et al., The acute and sub-chronic exposures of goldfish to
naphthenic acids induce different host defense responses. Aquatic
Toxicology, 2012. 109(0): p. 143-149.
39. Hamdani, E.-H., et al., Alarm Reaction in the Crucian Carp is Mediated
by the Medial Bundle of the Medial Olfactory Tract. Chemical Senses,
2000. 25(1): p. 103-109.
40. Hamdani, E.H. and K.B. Døving, The functional organization of the fish
olfactory system. Progress in neurobiology, 2007. 82(2): p. 80-86.
41. Han, X., et al., Influence of Molecular Structure on the Biodegradability of
Naphthenic Acids. Environmental Science & Technology, 2008. 42(4): p.
1290-1295.
42. Hansen, A., K.T. Anderson, and T.E. Finger, Differential distribution of
olfactory receptor neurons in goldfish: Structural and molecular
correlates. The Journal of Comparative Neurology, 2004. 477(4): p. 347-
359.

165
43. Hansen, J.A., et al., Chinook salmon (Oncorhynchus tshawytscha) and
rainbow trout (Oncorhynchus mykiss) exposed to copper:
Neurophysiological and histological effects on the olfactory system.
Environmental Toxicology and Chemistry, 1999. 18(9): p. 1979-1991.
44. Hara, T., The diversity of chemical stimulation in fish olfaction and
gustation. Reviews in Fish Biology and Fisheries, 1994. 4(1): p. 1-35.
45. Hara, T., et al., Morpholine, Bile Acids and Skin Mucus as Possible
Chemical Cues in Salmonid Homing: Electrophysiological Re-Evaluation,
in Mechanisms of Migration in Fishes, J. McCleave, et al., Editors. 1984,
Springer US. p. 363-378.
46. Hara, T.J., Olfaction and gustation in fish: an overview. Acta Physiologica
Scandinavica, 1994. 152(2): p. 207-217.
47. Hara, T.J., Olfactory responses to amino acids in rainbow trout, Salmo
gairdneri. Comparative Biochemistry and Physiology Part A: Physiology,
1973. 44(2): p. 407-416.
48. Hara, T.J., Structure-activity relationships of amino acids in fish olfaction.
Comparative Biochemistry and Physiology Part A: Physiology, 1976.
54(1): p. 31-36.
49. Hara, T.J., Y.M.C. Law, and S. Macdonald, Effects of Mercury and
Copper on the Olfactory Response in Rainbow Trout, Salmo gairdneri.
Journal of the Fisheries Research Board of Canada, 1976. 33(7): p. 1568-
1573.

166
50. He, Y., et al., Toxicity of untreated and ozone-treated oil sands process-
affected water (OSPW) to early life stages of the fathead minnow
(Pimephales promelas). Water Research, 2012. 46(19): p. 6359-6368.
51. Hidaka, H. and R. Tatsukawa, Avoidance by olfaction in a fish, medaka
(Oryzias latipes), to aquatic contaminants. Environmental Pollution, 1989.
56(4): p. 299-309.
52. Hidaka, H. and R. Tatsukawa, Avoidance test of a fish, medaka (Oryzias
latipes), to aquatic contaminants, with special reference to
monochloramine. Archives of Environmental Contamination and
Toxicology, 1985. 14(5): p. 565-571.
53. Idler, D.R., U.H.M. Fagerlund, and H. Mayoh, OLFACTORY
PERCEPTION IN MIGRATING SALMON: I. L-SERINE, A SALMON
REPELLENT IN MAMMALIAN SKIN. The Journal of General Physiology,
1956. 39(6): p. 889-892.
54. Ishida, Y., H. Yoshikawa, and H. Kobayashi, Electrophysiological
responses of three chemosensory systems in the carp to pesticides.
Physiology & Behavior, 1996. 60(2): p. 633-638.
55. Ishimaru, T., Effects of Ca2+ on electro-olfactogram in the isolated
olfactory mucosa of the frog. Chemical Senses, 1992. 17(3): p. 261-272.
56. Jarrard, H.E., K.R. Delaney, and C.J. Kennedy, Impacts of carbamate
pesticides on olfactory neurophysiology and cholinesterase activity in
coho salmon (Oncorhynchus kisutch). Aquatic Toxicology, 2004. 69(2): p.
133-148.

167
57. Kang, J.-W. and K.-H. Lee, A kinetic model of the hydrogen peroxide/UV
process for the treatment of hazardous waste chemicals. Environmental
engineering science, 1997. 14(3): p. 183-192.
58. Kavanagh, R.J., et al., Fathead minnow (Pimephales promelas)
reproduction is impaired in aged oil sands process-affected waters.
Aquatic Toxicology, 2011. 101(1): p. 214-220.
59. Kelly, E.N., et al., Oil sands development contributes elements toxic at
low concentrations to the Athabasca River and its tributaries. Proceedings
of the National Academy of Sciences, 2010. 107(37): p. 16178-16183.
60. Kerr, J.L., et al., Use of goldfish to monitor wastewater and reuse water
for xenobiotics. Journal of Environmental Engineering and Science, 2008.
7(4): p. 369-383.
61. Khym, J.X., D.G. Doherty, and W.E. Cohn, Ribose Phosphates:
Production from Nucleotides, Ion-Exchange Separation and
Characterization1. Journal of the American Chemical Society, 1954.
76(21): p. 5523-5530.
62. Kolmakov, N.N., et al., Effect of Acute Copper Sulfate Exposure on
Olfactory Responses to Amino Acids and Pheromones in Goldfish
(Carassius auratus). Environmental Science & Technology, 2009. 43(21):
p. 8393-8399.
63. Kolodziej, E.P., J.L. Gray, and D.L. Sedlak, Quantification of steroid
hormones with pheromonal properties in municipal wastewater effluent.
Environmental Toxicology and Chemistry, 2003. 22(11): p. 2622-2629.

168
64. Kuster, M., et al., Analysis and occurrence of pharmaceuticals, estrogens,
progestogens and polar pesticides in sewage treatment plant effluents,
river water and drinking water in the Llobregat river basin (Barcelona,
Spain). Journal of Hydrology, 2008. 358(1–2): p. 112-123.
65. Laberge, F. and T.J. Hara, Behavioural and electrophysiological
responses to F-prostaglandins, putative spawning pheromones, in three
salmonid fishes. Journal of Fish Biology, 2003. 62(1): p. 206-221.
66. Lamb, C.F. and T.E. Finger, Gustatory control of feeding behavior in
goldfish. Physiology & Behavior, 1995. 57(3): p. 483-488.
67. Laposata, M.M. and W.A. Dunson, Effects of Spray-Irrigated Wastewater
Effluent on Temporary Pond-Breeding Amphibians. Ecotoxicology and
Environmental Safety, 2000. 46(2): p. 192-201.
68. Leverenz, H.L., G. Tchobanoglous, and T. Asano, Direct potable reuse: a
future imperative. Journal of Water Reuse and Desalination, 2011. 1(1): p.
2-10.
69. Li, J., et al., Early development of functional spatial maps in the zebrafish
olfactory bulb. The Journal of neuroscience, 2005. 25(24): p. 5784-5795.
70. LI, J., W.N. ZAGOTTA, and H.A. LESTER, Cyclic nucleotide-gated
channels: structural basis of ligand efficacy and allosteric modulation.
Quarterly Reviews of Biophysics, 1997. 30(02): p. 177-193.
71. Lowe, G., T. Nakamura, and G.H. Gold, Adenylate cyclase mediates
olfactory transduction for a wide variety of odorants. Proceedings of the
National Academy of Sciences, 1989. 86(14): p. 5641-5645.

169
72. MacKinnon, M. and J. Retallack, Preliminary characterization and
detoxification of tailings pond water at the Syncrude Canada Ltd. Oil
Sands Plant. Land and Water Issues Related to Energy Development. Ann
Arbor Science, Denver, 1981: p. 185-210.
73. Madill, R.E.A., et al., Preliminary risk assessment of the wet landscape
option for reclamation of oil sands mine tailings: Bioassays with mature
fine tailings pore water. Environmental Toxicology, 2001. 16(3): p. 197-
208.
74. Martin, J.W., et al., Ozonation of Oil Sands Process-Affected Water
Accelerates Microbial Bioremediation. Environmental Science &
Technology, 2010. 44(21): p. 8350-8356.
75. Marui, T., et al., Gustatory responses of the rainbow trout (Salmo
gairdneri) palate to amino acids and derivatives. Journal of comparative
physiology, 1983. 153(4): p. 423-433.
76. Masliyah, J., et al., Understanding Water-Based Bitumen Extraction from
Athabasca Oil Sands. The Canadian Journal of Chemical Engineering,
2004. 82(4): p. 628-654.
77. McPherson, T.D., G.G. Pyle, and R.S. Mirza, Responses of wild fishes to
alarm chemicals in pristine and metal-contaminated lakes. Canadian
Journal of Zoology, 2004. 82(5): p. 694-700.
78. Minor, A.V., Mechanisms of generation and origin of the electro-
olfactogram. Neuroscience and Behavioral Physiology, 1972. 5(2): p. 169-
176.

170
79. Mombaerts, P., Molecular biology of odorant receptors in vertebrates.
Annual review of neuroscience, 1999. 22(1): p. 487-509.
80. Moore, A., Electrophysiological and endocrinological evidence that F-
series prostaglandins function as priming pheromones in mature male
Atlantic salmon (Salmo salar parr. The Journal of Experimental Biology,
1996. 199(10): p. 2307-2316.
81. Moore, A., An electrophysiological study on the effects of pH on olfaction
in mature male Atlantic salmon (Salmo salar) parr. Journal of Fish
Biology, 1994. 45(3): p. 493-502.
82. Moore, A. and N. Lower, The impact of two pesticides on olfactory-
mediated endocrine function in mature male Atlantic salmon (Salmo salar
L.) parr. Comparative Biochemistry and Physiology Part B: Biochemistry
and Molecular Biology, 2001. 129(2–3): p. 269-276.
83. Moore, A. and C.P. Waring, Mechanistic Effects of a Triazine Pesticide on
Reproductive Endocrine Function in Mature Male Atlantic Salmon (Salmo
salarL.) Parr. Pesticide Biochemistry and Physiology, 1998. 62(1): p. 41-
50.
84. Moore, A. and C.P. Waring, Sublethal effects of the pesticide Diazinon on
olfactory function in mature male Atlantic salmon parr. Journal of Fish
Biology, 1996. 48(4): p. 758-775.
85. Munkittrick, K.R., E.A. Power, and G.A. Sergy, The relative sensitivity of
microtox®, daphnid, rainbow trout, and fathead minnow acute lethality
tests. Environmental Toxicology and Water Quality, 1991. 6(1): p. 35-62.
171
86. NEBERT, D.W., et al., The P450 superfamily: update on new sequences,
gene mapping, and recommended nomenclature. DNA and Cell Biology,
1991. 10(1): p. 1-14.
87. Olsén, K.H. and N.R. Liley, The Significance of Olfaction and Social Cues
in Milt Availability, Sexual Hormone Status, and Spawning Behavior of
Male Rainbow Trout (Oncorhynchus mykiss). General and Comparative
Endocrinology, 1993. 89(1): p. 107-118.
88. Ottoson, D., ANALYSIS OF THE ELECTRICAL ACTIVITY OF THE
OLFACTORY EPITHELIUM. Acta Physiologica Scandinavica, 1956. 35:
p. 7-83.
89. Pelosi, P., N.E. Baldaccini, and A.M. Pisanelli, Identification of a specific
olfactory receptor for 2-isobutyl-3-methoxypyrazine. Biochemical Journal,
1982. 201(1): p. 245.
90. Pérez-Estrada, L.A., et al., Structure–Reactivity of Naphthenic Acids in the
Ozonation Process. Environmental Science & Technology, 2011. 45(17):
p. 7431-7437.
91. Pettersson, I. and C. Berg, Environmentally relevant concentrations of
ethynylestradiol cause female-biased sex ratios in Xenopus tropicalis and
Rana temporaria. Environmental Toxicology and Chemistry, 2007. 26(5):
p. 1005-1009.
92. Prosser, G.A. and L.P.S. de Carvalho, Kinetic mechanism and inhibition of
Mycobacterium tuberculosis d-alanine:d-alanine ligase by the antibiotic
d-cycloserine. FEBS Journal, 2013. 280(4): p. 1150-1166.

172
93. Rehnberg, B. and C. Schreck, The olfactoryL-serine receptor in coho
salmon: biochemical specificity and behavioral response. Journal of
Comparative Physiology A, 1986. 159(1): p. 61-67.
94. Rhein, L.D. and R.H. Cagan, Biochemical studies of olfaction: isolation,
characterization, and odorant binding activity of cilia from rainbow trout
olfactory rosettes. Proceedings of the National Academy of Sciences,
1980. 77(8): p. 4412-4416.
95. Roger, S., et al., Mineral, physical and chemical analysis of the solid
matter carried by motorway runoff water. Water Research, 1998. 32(4): p.
1119-1125.
96. Rogers, V.V., K. Liber, and M.D. MacKinnon, Isolation and
characterization of naphthenic acids from Athabasca oil sands tailings
pond water. Chemosphere, 2002. 48(5): p. 519-527.
97. Ross, M.S., et al., Quantitative and Qualitative Analysis of Naphthenic
Acids in Natural Waters Surrounding the Canadian Oil Sands Industry.
Environmental Science & Technology, 2012. 46(23): p. 12796-12805.
98. Rowland, S.J., et al., Diamonds in the Rough: Identification of Individual
Naphthenic Acids in Oil Sands Process Water. Environmental Science &
Technology, 2011. 45(7): p. 3154-3159.
99. ROZE, U. and J.L. STROMINGER, Alanine Racemase from
Staphylococcus aureus: Conformation of Its Substrates and Its Inhibitor,
D-Cycloserine. Molecular Pharmacology, 1966. 2(1): p. 92-94.

173
100. Saglio, P., K.H. Olsén, and S. Bretaud, Behavioral and Olfactory
Responses to Prochloraz, Bentazone, and Nicosulfuron-Contaminated
Flows in Goldfish. Archives of Environmental Contamination and
Toxicology, 2001. 41(2): p. 192-200.
101. Sandahl, J.F., et al., Odor-evoked field potentials as indicators of sublethal
neurotoxicity in juvenile coho salmon (Oncorhynchus kisutch) exposed to
copper, chlorpyrifos, or esfenvalerate. Canadian Journal of Fisheries and
Aquatic Sciences, 2004. 61(3): p. 404-413.
102. Schild, D. and D. Restrepo, Transduction mechanisms in vertebrate
olfactory receptor cells. Physiological Reviews, 1998. 78(2): p. 429-466.
103. Scott, A.C., et al., Ozonation of oil sands process water removes
naphthenic acids and toxicity. Chemosphere, 2008. 71(1): p. 156-160.
104. Scott, J.W. and P.E. Scott-Johnson, The electroolfactogram: A review of
its history and uses. Microscopy Research and Technique, 2002. 58(3): p.
152-160.
105. Shamchuk, A.L. and K.B. Tierney, Phenotyping stimulus evoked
responses in larval zebrafish. Behaviour, 2012. 149(10-12): p. 10-12.
106. Smolowitz, R.M., M.E. Schultz, and J.J. Stegeman, Cytochrome P4501A
induction in tissues, including olfactory epithelium, of topminnows
(Poeciliopsis spp.) by waterborne benzo[a]pyrene. Carcinogenesis, 1992.
13(12): p. 2395-2402.

174
107. Sonthalia, P., et al., Metal ion analysis in contaminated water samples
using anodic stripping voltammetry and a nanocrystalline diamond thin-
film electrode. Analytica Chimica Acta, 2004. 522(1): p. 35-44.
108. Sorensen, P., T. Hara, and N. Stacey, Extreme olfactory sensitivity of
mature and gonadally-regressed goldfish to a potent steroidal pheromone,
17α,20β-dihydroxy-4-pregnen-3-one. Journal of Comparative Physiology
A, 1987. 160(3): p. 305-313.
109. Sorensen, P.W., T.J. Hara, and N.E. Stacey, Extreme olfactory sensitivity
of mature and gonadally-regressed goldfish to a potent steroidal
pheromone, 17<i>α</i>,20<i>β</i>-dihydroxy-4-
pregnen-3-one. Journal of Comparative Physiology A: Neuroethology,
Sensory, Neural, and Behavioral Physiology, 1987. 160(3): p. 305-313.
110. Sorensen, P.W., et al., F prostaglandins function as potent olfactory
stimulants that comprise the postovulatory female sex pheromone in
goldfish. Biology of Reproduction, 1988. 39(5): p. 1039-1050.
111. Sorensen, P.W., et al., Sulfated 17,20β-Dihydroxy-4-pregnen-3-one
Functions as a Potent and Specific Olfactory Stimulant with Pheromonal
Actions in the Goldfish. General and Comparative Endocrinology, 1995.
100(1): p. 128-142.
112. Sowers, A.D., M.A. Mills, and S.J. Klaine, The developmental effects of a
municipal wastewater effluent on the northern leopard frog, Rana pipiens.
Aquatic Toxicology, 2009. 94(2): p. 145-152.

175
113. Stacey, N. and P. Sorensen, 17α, 20β-dihydroxy-4-pregnen-3-one: a
steroidal primer pheromone increasing milt volume in the goldfish,
Carassius auratus. Canadian Journal of Zoology, 1986. 64(11): p. 2412-
2417.
114. Suzuki, N. and D. Tucker, Amino acids as olfactory stimuli in fresh-water
catfish, Ictalurus catus (Linn.). Comparative Biochemistry and Physiology
Part A: Physiology, 1971. 40(2): p. 399-404.
115. Sveinsson, T. and T.J. Hara, Olfactory sensitivity and specificity of Arctic
char, Salvelinus alpinus, to a putative male pheromone, prostaglandin
F2α. Physiology & Behavior, 2000. 69(3): p. 301-307.
116. Teather, K., C. Jardine, and K. Gormley, Behavioral and sex ratio
modification of Japanese medaka (Oryzias latipes) in response to
environmentally relevant mixtures of three pesticides. Environmental
Toxicology, 2005. 20(1): p. 110-117.
117. Tierney, ed. Chapter 23: Olfaction in aquatic vertebrates. Handbook of
olfaction and gustation (3rd
edition): Modern perspectives. 2013, Doty RL,
ed. Wiley & Sons.
118. Tierney, K.B., et al., Olfactory toxicity in fishes. Aquatic Toxicology,
2010. 96(1): p. 2-26.
119. Tierney, K.B., et al., Changes in juvenile coho salmon electro-olfactogram
during and after short-term exposure to current-use pesticides.
Environmental Toxicology and Chemistry, 2006. 25(10): p. 2809-2817.

176
120. Tierney, K.B., P.S. Ross, and C.J. Kennedy, Linuron and carbaryl
differentially impair baseline amino acid and bile salt olfactory responses
in three salmonids. Toxicology, 2007. 231(2–3): p. 175-187.
121. Tierney, K.B., et al., Salmon Olfaction is Impaired by an Environmentally
Realistic Pesticide Mixture. Environmental Science & Technology, 2008.
42(13): p. 4996-5001.
122. Tierney, K.B., et al., EVIDENCE FOR BEHAVIORAL PREFERENCE
TOWARD ENVIRONMENTAL CONCENTRATIONS OF URBAN-USE
HERBICIDES IN A MODEL ADULT FISH. Environmental Toxicology
and Chemistry, 2011. 30(9): p. 2046-2054.
123. Tierney, K.B., et al., Relating olfactory neurotoxicity to altered olfactory-
mediated behaviors in rainbow trout exposed to three currently-used
pesticides. Aquatic Toxicology, 2007. 81(1): p. 55-64.
124. Toor, N.S., et al., Degradation and aquatic toxicity of naphthenic acids in
oil sands process-affected waters using simulated wetlands. Chemosphere,
2013. 90(2): p. 449-458.
125. Vajda, A.M., et al., Reproductive Disruption in Fish Downstream from an
Estrogenic Wastewater Effluent. Environmental Science & Technology,
2008. 42(9): p. 3407-3414.
126. Valentinčič, T. and J. Caprio, Consummatory feeding behavior to amino
acids in intact and anosmic channel catfish Ictalurus punctatus.
Physiology & Behavior, 1994. 55(5): p. 857-863.

177
127. Valentinčič, T., C.F. Lamb, and J. Caprio, Expression of a Reflex
Biting/Snapping Response to Amino Acids Prior to First Exogenous
Feeding in Salmonid Alevins. Physiology & Behavior, 1999. 67(4): p. 567-
572.
128. van Staden, J. and S. Tlowana, Spectrophotometric determination of
chloride in mineral and drinking waters using sequential injection
analysis. Fresenius' journal of analytical chemistry, 2001. 371(3): p. 396-
399.
129. Vogt, R.G., G.D. Prestwich, and M.R. Lerner, Odorant-binding-protein
subfamilies associate with distinct classes of olfactory receptor neurons in
insects. J Neurobiol, 1991. 22(1): p. 74-84.
130. Wang, G.-S., S.-T. Hsieh, and C.-S. Hong, Destruction of humic acid in
water by UV light—catalyzed oxidation with hydrogen peroxide. Water
Research, 2000. 34(15): p. 3882-3887.
131. Waring, C.P. and A. Moore, Sublethal effects of a carbamate pesticide on
pheromonal mediated endocrine function in mature male Atlantic salmon
(Salmo salar L.) parr. Fish Physiology and Biochemistry, 1997. 17(1-6):
p. 203-211.
132. Wong, D.C.L., et al., Use of supercritical fluid extraction and fast ion
bombardment mass spectrometry to identify toxic chemicals from a
refinery effluent adsorbed onto granular activated carbon. Chemosphere,
1996. 32(8): p. 1669-1679.

178
133. Woodling, J.D., et al., Intersex and other reproductive disruption of fish in
wastewater effluent dominated Colorado streams. Comparative
Biochemistry and Physiology Part C: Toxicology & Pharmacology, 2006.
144(1): p. 10-15.
134. Yamamoto, Y. and H. Ueda, Physiological Study on Imprinting and
Homing Related Olfactory Functions in Salmon. 2007.
135. Yuan, Y., K. Hall, and C. Oldham, A preliminary model for predicting
heavy metal contaminant loading from an urban catchment. Science of
The Total Environment, 2001. 266(1–3): p. 299-307.

179
Appendix A
Page 179 has been removed due to copyright restrictions. This page contained a
rendering of the nares of fish from Tierney, ed. Chapter 23: Olfaction in aquatic
vertebrates. Handbook of olfaction and gustation (3rd
edition): Modern
perspectives. 2013, Doty RL, ed. Wiley & Sons.

180
Appendix B
Page 180 has been removed due to copyright restrictions. This page contained a
photograph of the olfactory rosette and was obtained from Baldwin and Scholz.
2005. An in vivo measure of peripheral olfactory function and sublethal
neurotoxicity in fish. Techniques in Aquatic Toxicology, Volume 2.

181
Appendix C
Electro-olfactograms (EOGs)
Fluid delivery
Reference Electrode
Recording electrode
Anesthetic

182
Appendix D
Concentration Dependent Response
30 min exposure
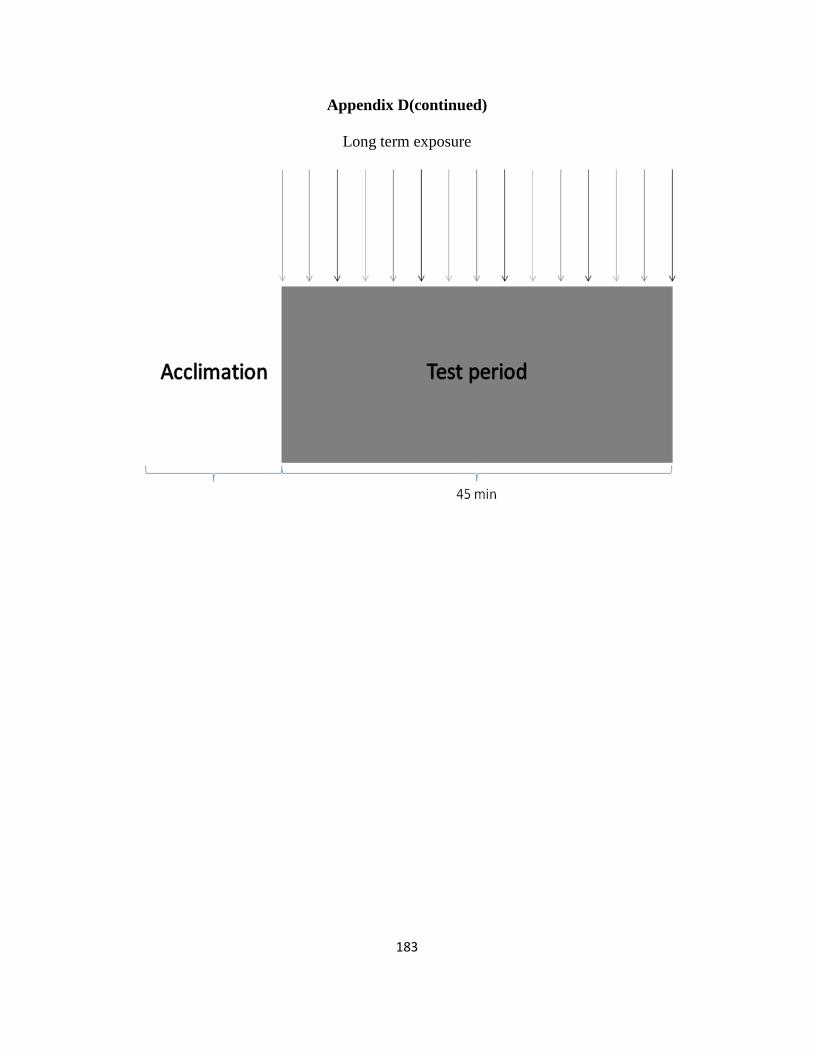
183
Appendix D(continued)
Long term exposure

184
Appendix E
N a m e o f g e n e
Re
lati
ve
mR
NA
ex
pre
ss
ion
le
ve
l
CY
P1A
CY
P3A
GS
TA
GS
TP
GS
TT
0
2
4
6
8
C O N T R O L C H A R C O A L R E U S E U V
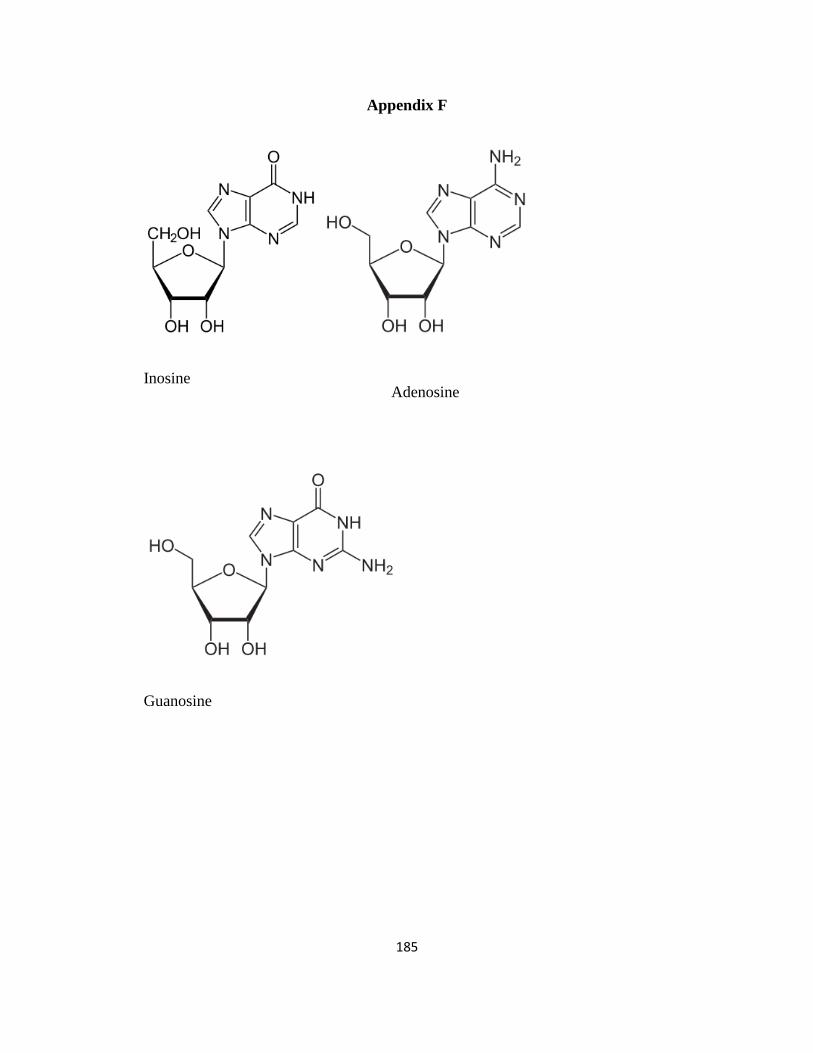
185
Appendix F
Inosine
Guanosine
Adenosine


