Download - Update - Amazon Web Services

Important information: All information regarding limitation of liability and potential conflicts of interest can be found at the end of the report
Redeye, Mäster Samuelsgatan 42, 10tr, Box 7141, 103 87 Stockholm. Tel. +46 8-545 013 30, E-post: [email protected]
Update
Equity Research 9 December 2020
KEY STATS
Ticker OSSD
Market First North
Share Price (SEK) 14.2
Market Cap (MSEK) 251
Net Debt 20E (MSEK) -38
Free Float 57%
Avg. daily volume (‘000) 127
BEAR BASE BULL
10
26
37
KEY FINANCIALS (SEKm)
2018 2019 2020E 2021E 2022E 2023E
Net sales 13 17 25 46 92 146
EBIT -50 -84 -81 -74 -70 -45
EPS n/a -4.8 -3.7 -3.4 -3.2 -2.1
EPS (adj.)
2018 2019 2020E 2021E 2022E 2023E EV/Sales n/a 12 12 6.2 3,1 2
ANALYSTS
Oscar Bergman
Anders Hedlund
3 31
0
5
10
15
20
25
04-dec 03-mar 01-jun 30-aug 28-nov
OMXS 30
OssDsign
While adding potential, acquisition prompts questions on
financing
Redeye raises its long-term estimates and valuation somewhat following OssDsign’s
broadening towards synthetic bone grafts for spinal fusion through the acquisition of
Sirakoss. We have a relatively conservative stance on the new product’s sales potential
at present, though increased clinical validation and demonstrated commercial interest
could prompt a reassessment further out.
Broadening its market potential
Adding a product for spinal fusion surgery opens a market worth some USD 2.4bn,
fivefolding OssDsign’s market potential. However, limited pre-clinical data and no historic
sales do not speak in favour of a rapid sales ramp-up – we expect extensive commercial
activity in the coming years to capitalize on this acquisition. However, we identify several
synergies between the existing commercial platform and the new product offering, which
could ease the introduction of the new product.
A slight increase in long-term sales estimates
We do not forecast any particular increase in sales in the coming years. However, we
estimate that the new product will make up some 10% of total sales towards the second
half of our 2020-2035 forecast period. We still expect a positive EBIT and cash flow in
2025 with sales of SEK 274m.
Equity issue in play, share momentum on halt
We estimated a financing need of SEK 150m until reaching positive cash flow in our initial
report. With the acquisition, the capital need grows larger, especially in the short-term
given the cash instalments for next year of some SEK 50m. Though we expect the
company to continue its success with its cranial implants in the short-term, stock market
sentiment is likely to be hesitant until the financing has been successfully addressed.
New Base Case of SEK 26
Our fundamental analysis presents an updated Base Case value of SEK 26 per share.
The coming quarters’ sales growth continues to be the most critical catalysts. Still, we
argue that the share will likely not regain its momentum sustainably until OssDsign has a
stronger financial position. Indeed, we expect equity issuance during 1H’21.
OssDsign Sector: Medtech
REDEYE RATING
VERSUS OMXS30
FAIR VALUE RANGE
Financials
People
Business
REDEYE Equity Research OssDsign 9 December 2020
2
Broadening its market potential
The acquisition of Sirakoss increases OssDsign's market potential upwards of USD 3bn
from previously USD 0.6bn; however, we judge that its potential to capitalize on this is
speculative and difficult to predict at this stage.
We emphasize that its limited pre-clinical validation and no historic sales put the product
(Osteo3 ZP Putty) at the bottom of a steep hill guarded by fierce competition. However, we
identify several synergies for OssDsign with its US customer base and sales organization,
which could help in the commercial roll-out. In addition to this, OssDsign's board of directors
and management have significant experience in the field of spinal orthopedics, making the
acquisition interesting in a long-term perspective.
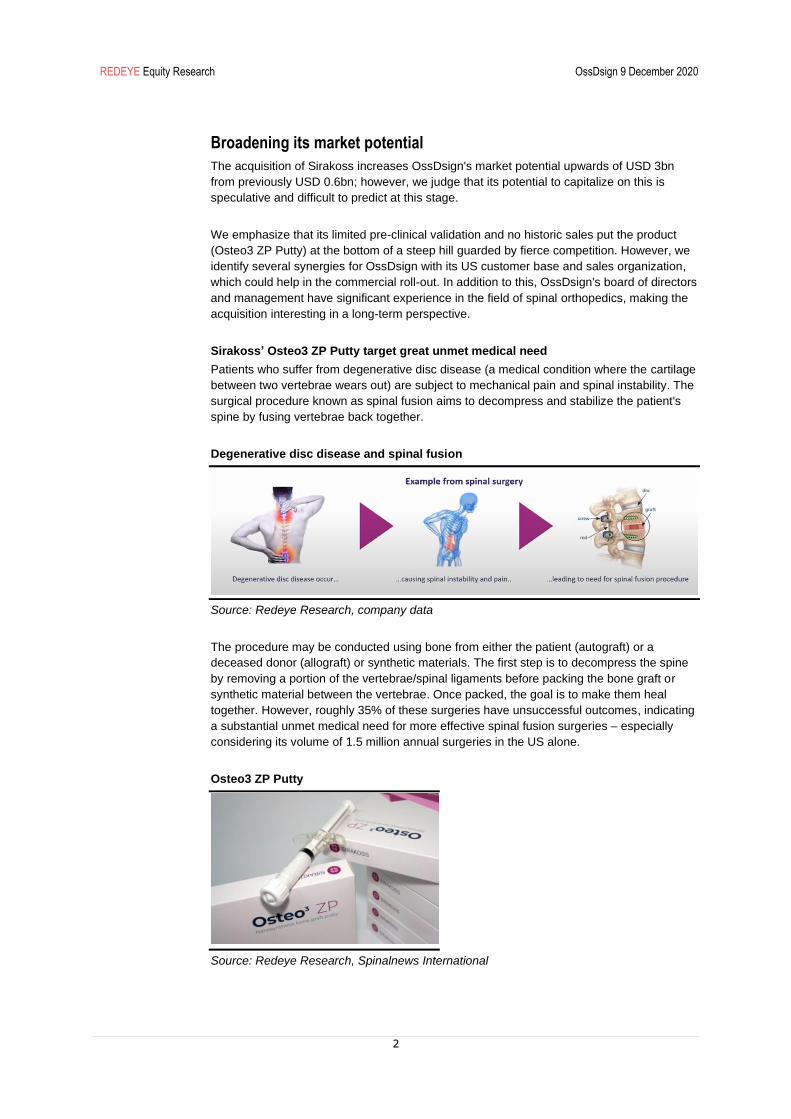
Sirakoss’ Osteo3 ZP Putty target great unmet medical need
Patients who suffer from degenerative disc disease (a medical condition where the cartilage
between two vertebrae wears out) are subject to mechanical pain and spinal instability. The
surgical procedure known as spinal fusion aims to decompress and stabilize the patient's
spine by fusing vertebrae back together.
Degenerative disc disease and spinal fusion
Source: Redeye Research, company data
The procedure may be conducted using bone from either the patient (autograft) or a
deceased donor (allograft) or synthetic materials. The first step is to decompress the spine
by removing a portion of the vertebrae/spinal ligaments before packing the bone graft or
synthetic material between the vertebrae. Once packed, the goal is to make them heal
together. However, roughly 35% of these surgeries have unsuccessful outcomes, indicating
a substantial unmet medical need for more effective spinal fusion surgeries – especially
considering its volume of 1.5 million annual surgeries in the US alone.
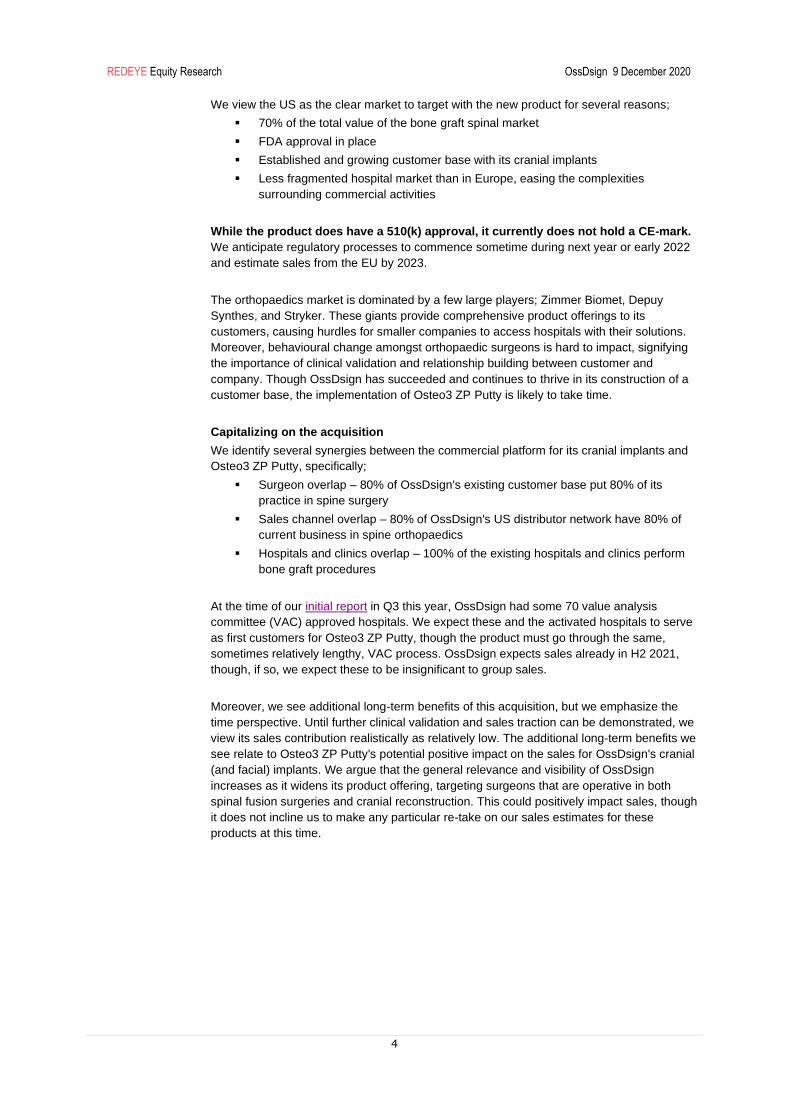
Osteo3 ZP Putty
Source: Redeye Research, Spinalnews International

dsfdsf REDEYE Equity Research OssDsign 9 December 2020
3
Osteo3 ZP Putty is a synthetic bone graft substitute based on a calcium phosphate material,
which has shown osteoinductive capacity in pre-clinical data. While allograft and autograft
have osteoinductive traits (undifferentiated cells developing into bone producing cells),
synthetic materials struggle with this. Though the clinical data is limited for Osteo3 ZP Putty,
we argue that such a trait certainly is exciting.
Market background
The global market for bone grafts is estimated at roughly USD 4bn and is expected to grow
with a CAGR of some 8%. Sirakoss' Osteo3 ZP Putty targets the bone graft market for
cervical and thoracolumbar spinal fusion, valued at approximately USD 1.8bn in the US. On
a global level, this number corresponds to USD 2.6bn.
Global distribution of bone graft market value
Source: Redeye Research, company data
Spinal Fusion (Cervical and thoracolumbar) CMF
Hip Surgery Knee Surgery
Trauma Surgery Extremity Surgery
Walsh et al. 2020
The study aimed to evaluate the in-vivo response of Osteo3 ZP Putty combined with autograft,
compared to autograft and a collagen-biphasic calcium sulphate in combination with autograft,
in a rabbit spinal fusion model.
Three groups were constructed with a total of 70 rabbits by;
1. Autograft alone
2. Osteo3 ZP Putty + autograft
3. Collagen-biphasic calcium phosphate putty + autograft
Based on 26 weeks with fusion assessment at week 6, 9, 12 and 26, histology showed normal
healing and an increase in bone remodelling with the use of Osteo3 ZP Putty in combination
with autograft at all timepoints. New bone formation on the material surface was also
observed, while this was not seen on the collagen-biphasic calcium phosphate putty. At the
last time point (week 26), histology showed a consistent bridging of bone between the
transverse processes in Osteo3 ZP Putty and autograft – this was not the case for the
collagen-biphasic calcium phosphate putty group.
The authors argue that such a solution, such as Osteo3 ZP Putty, could eliminate the need for
excessive autograft harvest in spinal fusion surgery. While positive, we do not expect
orthopaedic surgeons to adapt this product to a particularly great extension without further
clinical data on humans.
dsfdsf REDEYE Equity Research OssDsign 9 December 2020
4
We view the US as the clear market to target with the new product for several reasons;
▪ 70% of the total value of the bone graft spinal market
▪ FDA approval in place
▪ Established and growing customer base with its cranial implants
▪ Less fragmented hospital market than in Europe, easing the complexities
surrounding commercial activities
While the product does have a 510(k) approval, it currently does not hold a CE-mark.
We anticipate regulatory processes to commence sometime during next year or early 2022
and estimate sales from the EU by 2023.
The orthopaedics market is dominated by a few large players; Zimmer Biomet, Depuy
Synthes, and Stryker. These giants provide comprehensive product offerings to its
customers, causing hurdles for smaller companies to access hospitals with their solutions.
Moreover, behavioural change amongst orthopaedic surgeons is hard to impact, signifying
the importance of clinical validation and relationship building between customer and
company. Though OssDsign has succeeded and continues to thrive in its construction of a
customer base, the implementation of Osteo3 ZP Putty is likely to take time.
Capitalizing on the acquisition
We identify several synergies between the commercial platform for its cranial implants and
Osteo3 ZP Putty, specifically;
▪ Surgeon overlap – 80% of OssDsign's existing customer base put 80% of its
practice in spine surgery
▪ Sales channel overlap – 80% of OssDsign's US distributor network have 80% of
current business in spine orthopaedics
▪ Hospitals and clinics overlap – 100% of the existing hospitals and clinics perform
bone graft procedures
At the time of our initial report in Q3 this year, OssDsign had some 70 value analysis
committee (VAC) approved hospitals. We expect these and the activated hospitals to serve
as first customers for Osteo3 ZP Putty, though the product must go through the same,
sometimes relatively lengthy, VAC process. OssDsign expects sales already in H2 2021,
though, if so, we expect these to be insignificant to group sales.
Moreover, we see additional long-term benefits of this acquisition, but we emphasize the
time perspective. Until further clinical validation and sales traction can be demonstrated, we
view its sales contribution realistically as relatively low. The additional long-term benefits we
see relate to Osteo3 ZP Putty's potential positive impact on the sales for OssDsign's cranial
(and facial) implants. We argue that the general relevance and visibility of OssDsign
increases as it widens its product offering, targeting surgeons that are operative in both
spinal fusion surgeries and cranial reconstruction. This could positively impact sales, though
it does not incline us to make any particular re-take on our sales estimates for these
products at this time.

dsfdsf REDEYE Equity Research OssDsign 9 December 2020
5
Financial projections
Increasing our long-term sales estimates
We adjust our sales estimates upwards, if heavily tilted to the long-term. We forecast that
sales from the acquired product will make up a modest percentage of total sales in the
years to come, reaching some 10% towards the second half of our forecasting period 2020-
2035.
OssDsign aims to begin commercializing Osteo3 ZP Putty during H2 2021 and states that it
is to generate "meaningful sales" by 2022. We will follow the development closely as it rolls-
out, and our estimates are subject to possible changes as things progress.
2020-2025 Estimates (SEKm)
Source: Redeye Research
Income statement forecast
While the contribution of sales from Osteo3 ZP Putty is expected to be relatively modest, in
our view, we forecast it to have attractive gross margins as is typical for the synthetic bone
graft market. We forecast gross margins between 85-90%, which positively impacts our
forecasting period's total gross profit. Thus, we slightly increase our gross profit estimates
for the period in addition to slightly increased sales.
OssDsign: 2020-35 income statement forecast (SEKm)
Source: Redeye Research
Acquisition puts additional pressure on capital need
We estimate that roughly SEK 200m of external funding is required until the company turns
cash flow positive in 2025. Now, with the acquisition and its terms for payment, the short-
term capital will increase significantly as OssDsign has two cash instalments for the
acquisition next year of some SEK 50m (SEK 25m on June 30, 2021 and SEK 25m on
December 31, 2021).
We forecast a cash position of some SEK 42m at the end of 2020 and believe that an equity
issue is most likely within the coming six months to fund both operations and the cash
instalments.
0%
1%
2%
3%
4%
5%
6%
7%
8%
0
50
100
150
200
250
300
2020 2021 2022 2023 2024 2025
Total sales Of which Osteo3
0
100
200
300
400
500
600
700
800
Old estimates new estimates
2020 2021 2022 2023 2024 2025 2026 2027 2028 2029 2030 2031 2032 2033 2034 2035
Net sales 25 46 92 146 209 274 344 415 494 556 609 651 675 698 714 728
Sales growth 49% 84% 99% 59% 43% 31% 26% 21% 19% 13% 10% 7% 4% 3% 2% 2%
Gross margin 65% 77% 78% 78% 79% 79% 79% 79% 80% 80% 80% 80% 80% 80% 80% 80%
EBIT -82 -77 -73 -47 -11 35 78 114 160 188 213 229 238 246 251 256
EBIT margin -324% -166% -79% -32% -5% 13% 23% 27% 32% 34% 35% 35% 35% 35% 35% 35%
Taxes 0 0 0 0 0 0 0 0 0 -18 -45 -48 -50 -52 -53 -54
Net Income -82 -78 -75 -49 -14 32 75 111 157 167 165 178 185 191 195 199

dsfdsf REDEYE Equity Research OssDsign 9 December 2020
6
In our view, investors keen on taking a position in OssDsign are likely to await an equity
issue to enter on potentially more attractive levels. Once the financial risk is mitigated, we
have a positive long-term view on OssDsign's potential – a stronger balance sheet will
direct investors to pay attention to the significant sales growth we see ahead on the basis of
its cranial and facial implants.
Valuation of OssDsign
We raise our valuation of OssDsign slightly as an effect of the increased long-term sales
projections due to the acquisition. However, we judge it rather difficult to have a strong view
on the contribution of the acquisition and take a relatively conservative stance on its added
value.
Fair value range – a scenario-based approach
At Redeye, we approach the valuation of a company through a set of three scenarios to
provide for a more dynamic view of the case:
▪ Base Case = SEK 26 (75% upside)
▪ Bull Case = SEK 37 (250% upside)
▪ Bear Case = SEK 10 (-33% downside)
Base Case (SEK 26): Cranial and facial implants continue to be main contributors
We anticipate an aggressive sales growth for its Cranial implant in the coming years and
that it will remain the main contributor to group sales in our forecast period. We expect sales
to reach some SEK 46m in 2021, SEK 92m in 2022, and SEK 136m in 2023. We forecast a
positive EBIT margin by 2025 by when sales should be some SEK 274m. We anticipate
Osteo3 ZP Putty to make up roughly 10% of total sales in our forecast period.
Bull Case (SEK 37): A greater uptake of Osteo3 ZP Putty
In our optimistic scenario, we estimate sales of SEK 52m next year, followed by SEK 136m
in 2022 and SEK 216m in 2023 and a low but positive EBIT margin in the same year. We
have a more favourable view of the success of Osteo3 ZP Putty, making up some 15% of
total sales in the forecast period.
Bear Case (SEK 10): Lower implementation rate amongst surgeons
We estimate sales of SEK 30m next year, SEK 40m in 2022, and SEK 74m in 2023.
Moreover, we do not expect a positive EBIT until 2026. We forecast that Osteo3 ZP Putty
make up approximately 10% of total sales in the forecast period.

dsfdsf REDEYE Equity Research OssDsign 9 December 2020
7
Share performance
We raise our Base Case to SEK 26 (23), offering an upside of some 75% from today's
levels – though, we once again emphasize its forthcoming equity issue and that our Base
Case will have to be adjusted once completed. Moreover, we do not expect the stock to
begin any sustainable climb until the financing is resolved (expected within six months).
Still, quarterly results may boost the share in the short-term, but we believe it will not regain
lasting momentum until the balance sheet has been strengthened.
We released our initial report on September 4th with a Base Case of SEK 28 (since adjusted
to 23 following the directed share issue). In the two months since, the share has continued
its negative performance, down some -16%. Since its IPO some 1.5 years ago, the share
has consistently traded below its listing price (SEK 27.5). While the company has made
progress since its listing and, in our view, is set to continue on its path, we argue that the
share price is currently, and understandably, disconnected from the likelihood of success of
the operations. We attribute this to two main factors;
▪ A continuous overhang from financially distressed owner Karolinska Development
▪ Historical institutional sell-offs since the IPO
▪ A forthcoming extensive equity issue, putting investors at bay until resolved
OssDsign: Share price performance since the initial report
Source: Redeye Research, Bloomberg
0
10
20
30
0
200000
400000
600000
800000
1000000
1200000
2020-09-04 2020-10-04 2020-11-04 2020-12-04
Volume Last Price

dsfdsf REDEYE Equity Research OssDsign 9 December 2020
8
Summary Redeye Rating
The rating consists of three valuation keys, each constituting an overall assessment of several factors that are
rated on a scale of 0 to 1 points. The maximum score for a valuation key is 5 points.
Rating changes in the report
People: 3
Business: 3
Financials: 1
dsfdsf REDEYE Equity Research OssDsign 9 December 2020
9
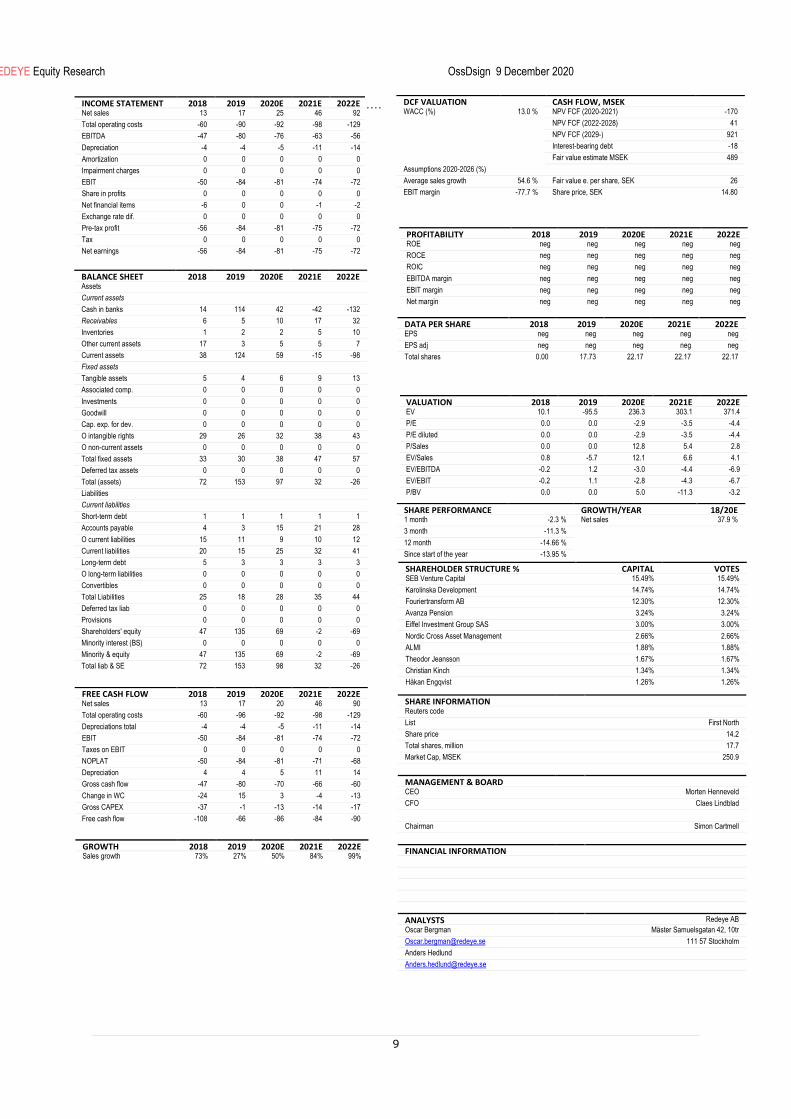
PROFITABILITY 2018 2019 2020E 2021E 2022E ROE neg neg neg neg neg
ROCE neg neg neg neg neg
ROIC neg neg neg neg neg
EBITDA margin neg neg neg neg neg
EBIT margin neg neg neg neg neg
Net margin neg neg neg neg neg
Please comment on the changes in Rating factors……
INCOME STATEMENT 2018 2019 2020E 2021E 2022E Net sales 13 17 25 46 92
Total operating costs -60 -90 -92 -98 -129
EBITDA -47 -80 -76 -63 -56
Depreciation -4 -4 -5 -11 -14
Amortization 0 0 0 0 0
Impairment charges 0 0 0 0 0
EBIT -50 -84 -81 -74 -72
Share in profits 0 0 0 0 0
Net financial items -6 0 0 -1 -2
Exchange rate dif. 0 0 0 0 0
Pre-tax profit -56 -84 -81 -75 -72
Tax 0 0 0 0 0
Net earnings -56 -84 -81 -75 -72
BALANCE SHEET 2018 2019 2020E 2021E 2022E Assets
Current assets
Cash in banks 14 114 42 -42 -132
Receivables 6 5 10 17 32
Inventories 1 2 2 5 10
Other current assets 17 3 5 5 7
Current assets 38 124 59 -15 -98
Fixed assets
Tangible assets 5 4 6 9 13
Associated comp. 0 0 0 0 0
Investments 0 0 0 0 0
Goodwill 0 0 0 0 0
Cap. exp. for dev. 0 0 0 0 0
O intangible rights 29 26 32 38 43
O non-current assets 0 0 0 0 0
Total fixed assets 33 30 38 47 57
Deferred tax assets 0 0 0 0 0
Total (assets) 72 153 97 32 -26
Liabilities
Current liabilities
Short-term debt 1 1 1 1 1
Accounts payable 4 3 15 21 28
O current liabilities 15 11 9 10 12
Current liabilities 20 15 25 32 41
Long-term debt 5 3 3 3 3
O long-term liabilities 0 0 0 0 0
Convertibles 0 0 0 0 0
Total Liabilities 25 18 28 35 44
Deferred tax liab 0 0 0 0 0
Provisions 0 0 0 0 0
Shareholders' equity 47 135 69 -2 -69
Minority interest (BS) 0 0 0 0 0
Minority & equity 47 135 69 -2 -69
Total liab & SE 72 153 98 32 -26
FREE CASH FLOW 2018 2019 2020E 2021E 2022E Net sales 13 17 20 46 90
Total operating costs -60 -96 -92 -98 -129
Depreciations total -4 -4 -5 -11 -14
EBIT -50 -84 -81 -74 -72
Taxes on EBIT 0 0 0 0 0
NOPLAT -50 -84 -81 -71 -68
Depreciation 4 4 5 11 14
Gross cash flow -47 -80 -70 -66 -60
Change in WC -24 15 3 -4 -13
Gross CAPEX -37 -1 -13 -14 -17
Free cash flow -108 -66 -86 -84 -90
GROWTH 2018 2019 2020E 2021E 2022E Sales growth 73% 27% 50% 84% 99%
DATA PER SHARE 2018 2019 2020E 2021E 2022E EPS neg neg neg neg neg
EPS adj neg neg neg neg neg
Total shares 0.00 17.73 22.17 22.17 22.17
VALUATION 2018 2019 2020E 2021E 2022E EV 10.1 -95.5 236.3 303.1 371.4
P/E 0.0 0.0 -2.9 -3.5 -4.4
P/E diluted 0.0 0.0 -2.9 -3.5 -4.4
P/Sales 0.0 0.0 12.8 5.4 2.8
EV/Sales 0.8 -5.7 12.1 6.6 4.1
EV/EBITDA -0.2 1.2 -3.0 -4.4 -6.9
EV/EBIT -0.2 1.1 -2.8 -4.3 -6.7
P/BV 0.0 0.0 5.0 -11.3 -3.2
SHARE INFORMATION Reuters code
List First North
Share price 14.2
Total shares, million 17.7
Market Cap, MSEK 250.9
MANAGEMENT & BOARD CEO Morten Henneveld
CFO Claes Lindblad
Chairman Simon Cartmell
FINANCIAL INFORMATION
ANALYSTS Redeye AB
Oscar Bergman Mäster Samuelsgatan 42, 10tr
[email protected] 111 57 Stockholm
Anders Hedlund
SHARE PERFORMANCE GROWTH/YEAR 18/20E 1 month -2.3 % Net sales 37.9 %
3 month -11.3 %
12 month -14.66 %
Since start of the year -13.95 %
SHAREHOLDER STRUCTURE % CAPITAL VOTES SEB Venture Capital 15.49% 15.49%
Karolinska Development 14.74% 12
14.74% 12 Fouriertransform AB 12.30% 12.30%
Avanza Pension 3.24% 3.03
3.24% 3.03 Eiffel Investment Group SAS 3.00% 3.00%
Nordic Cross Asset Management 2.66% 2.66%
ALMI 1.88% 1.88%
Theodor Jeansson 1.67% 1.67%
Christian Kinch 1.34% 1.34%
Håkan Engqvist 1.26% 1.26%
DCF VALUATION CASH FLOW, MSEK WACC (%) 13.0 % NPV FCF (2020-2021) -170
NPV FCF (2022-2028) 41
NPV FCF (2029-) 921
Interest-bearing debt -18
Fair value estimate MSEK 489
Assumptions 2020-2026 (%)
Average sales growth 54.6 % Fair value e. per share, SEK 26
EBIT margin -77.7 % Share price, SEK 14.80
dsfdsf REDEYE Equity Research OssDsign 9 December 2020
10
Redeye Rating and Background Definitions
Company Quality
Company Quality is based on a set of quality checks across three categories; PEOPLE, BUSINESS, FINANCE.
These are the building blocks that enable a company to deliver sustained operational outperformance and
attractive long-term earnings growth.
Each category is grouped into multiple sub-categories assessed by five checks. These are based on widely
accepted and tested investment criteria and used by demonstrably successful investors and investment firms.
Each sub-category may also include a complementary check that provides additional information to assist with
investment decision-making.
If a check is successful, it is assigned a score of one point; the total successful checks are added to give a score
for each sub-category. The overall score for a category is the average of all sub-category scores, based on a
scale that ranges from 0 to 5 rounded up to the nearest whole number. The overall score for each category is then
used to generate the size of the bar in the Company Quality graphic.
People
At the end of the day, people drive profits. Not numbers. Understanding the motivations of people behind a
business is a significant part of understanding the long-term drive of the company. It all comes down to doing
business with people you trust, or at least avoiding dealing with people of questionable character.
The People rating is based on quantitative scores in seven categories:
• Passion, Execution, Capital Allocation, Communication, Compensation, Ownership, and Board.
Business
If you don't understand the competitive environment and don't have a clear sense of how the business will engage
customers, create value and consistently deliver that value at a profit, you won't succeed as an investor. Knowing
the business model inside out will provide you some level of certainty and reduce the risk when you buy a stock.
The Business rating is based on quantitative scores grouped into five sub-categories:
• Business Scalability, Market Structure, Value Proposition, Economic Moat, and Operational Risks.
Financials
Investing is part art, part science. Financial ratios make up most of the science. Ratios are used to evaluate the
financial soundness of a business. Also, these ratios are key factors that will impact a company's financial
performance and valuation. However, you only need a few to determine whether a company is financially strong
or weak.
The Financial rating is based on quantitative scores that are grouped into five separate categories:
• Earnings Power, Profit Margin, Growth Rate, Financial Health, and Earnings Quality.

REDEYE Equity Research OssDsign 9 December 2020
11
Redeye Equity Research team
Management
Björn Fahlén
Håkan Östling
Technology Team
Jonas Amnesten
Henrik Alveskog
Fredrik Nilsson
Tomas Otterbeck
Oskar Vilhelmsson
Viktor Westman
Forbes Goldman
Mark Siöstedt
Editorial
Mark Siöstedt
Gabriel Höglund
Life Science Team
Gergana Almquist
Oscar Bergman
Anders Hedlund
Ludvig Svensson
Niklas Elmhammer
Mats Hyttinge
Filip Einarsson
Fredrik Thor

REDEYE Equity Research OssDsign 9 December 2020
12
Disclaimer Important information Redeye AB ("Redeye" or "the Company") is a specialist financial advisory boutique that focuses on small and mid-cap growth companies in the Nordic region. We focus on the technology and life science sectors. We provide services within Corporate Broking, Corporate Finance, equity research and investor relations. Our strengths are our award-winning research department, experienced advisers, a unique investor network, and the powerful distribution channel redeye.se. Redeye was founded in 1999 and since 2007 has been subject to the supervision of the Swedish Financial Supervisory Authority. Redeye is licensed to; receive and transmit orders in financial instruments, provide investment advice to clients regarding financial instruments, prepare and disseminate financial analyses/recommendations for trading in financial instruments, execute orders in financial instruments on behalf of clients, place financial instruments without position taking, provide corporate advice and services within mergers and acquisition, provide services in conjunction with the provision of guarantees regarding financial instruments and to operate as a Certified Advisory business (ancillary authorization). Limitation of liability This document was prepared for information purposes for general distribution and is not intended to be advisory. The information contained in this analysis is based on sources deemed reliable by Redeye. However, Redeye cannot guarantee the accuracy of the information. The forward-looking information in the analysis is based on subjective assessments about the future, which constitutes a factor of uncertainty. Redeye cannot
guarantee that forecasts and forward-looking statements will materialize. Investors shall conduct all investment decisions independently. This analysis is intended to be one of a number of tools that can be used in making an investment decision. All investors are therefore encouraged to supplement this information with additional relevant data and to consult a financial advisor prior to an investment decision. Accordingly, Redeye accepts no liability for any loss or damage resulting from the use of this analysis. Potential conflict of interest Redeye's research department is regulated by operational and administrative rules established to avoid conflicts of interest and to ensure the objectivity and independence of its analysts. The following applies:
• For companies that are the subject of Redeye's research analysis, the applicable rules include those established by the Swedish Financial Supervisory Authority pertaining to investment recommendations and the handling of conflicts of interest. Furthermore, Redeye employees are not allowed to trade in financial instruments of the company in question, from the date Redeye publishes its analysis plus one trading day after this date.
• An analyst may not engage in corporate finance transactions without the express approval of management and may not receive any remuneration directly linked to such transactions.
• Redeye may carry out an analysis upon commission or in exchange for payment from the company that is the subject of the analysis, or from an underwriting institution in conjunction with a merger and acquisition (M&A) deal, new share issue or a public listing. Readers of these reports should assume that Redeye may have received or will receive remuneration from the company/companies cited in the report for the performance of financial advisory services. Such remuneration is of a predetermined amount and is not dependent on the content of the analysis.
Redeye's research coverage Redeye's research analyses consist of case-based analyses, which imply that the frequency of the analytical reports may vary over time. Unless otherwise expressly stated in the report, the analysis is updated when considered necessary by the research department, for example in the event of significant changes in market conditions or events related to the issuer/the financial instrument. Recommendation structure Redeye does not issue any investment recommendations for fundamental analysis. However, Redeye has developed a proprietary analysis and rating model, Redeye Rating, in which each company is analyzed and evaluated. This analysis aims to provide an independent assessment of the company in question, its opportunities, risks, etc. The purpose is to provide an objective and professional set of data for owners and investors to use in their decision-making. Redeye Rating (2020-12-09)
Duplication and distribution This document may not be duplicated, reproduced or copied for purposes other than personal use. The document may not be distributed to physical or legal entities that are citizens of or domiciled in any country in which such distribution is prohibited according to applicable laws or other regulations. Copyright Redeye AB.
Rating People Business Financials
5p 20 16 3 3p - 4p 107 88 40 0p - 2p 5 28 89 Company N 132 132 132
CONFLICT OF INTERESTS
Oscar Bergman owns shares in the company : Yes Anders Hedlund owns shares in the company : No Redeye performs/have performed services for the company and receives/have
received compensation from the Company in connection with this.


