Spotlight:
Boston October
2015
Urban Mobility InsightsWe live in a world that moves – transit
systems, delivery vehicles, on-demand
system to map and analyze movement
Dataset:
analyzed by our system
Arrival delay:
between actual and scheduled arrival time
Average trip delay:
On-time: A bus or train that arrives no
more than 1 minute early or 5 minutes late
compared to the published schedule
On-time percentage: Number of stops
where bus is on-time for one run / total
number of stops in the run
explored San
Francisco

Urban Mobility Insights | October 20152
82
74
66
58
50
5/4/2015
5/7/2015
5/10/2015
5/13/2015
5/16/2015
5/19/2015
5/22/2015
5/25/2015
5/28/2015
5/31/2015
6/3/2015
6/6/2015
6/9/2015
6/12/2015
6/15/2015
6/18/2015
6/21/2015
6/24/2015
Representative weekday sample: Each group of bars shows one week of on-time percentage data and illustrates a clear downward trend – lower on-time
percentage on Fridays compared to Mondays.
Weekly performance drops faster than Red Sox’s end-of-year AL East standings
for its bus
Urban Mobility Insights | October 20153
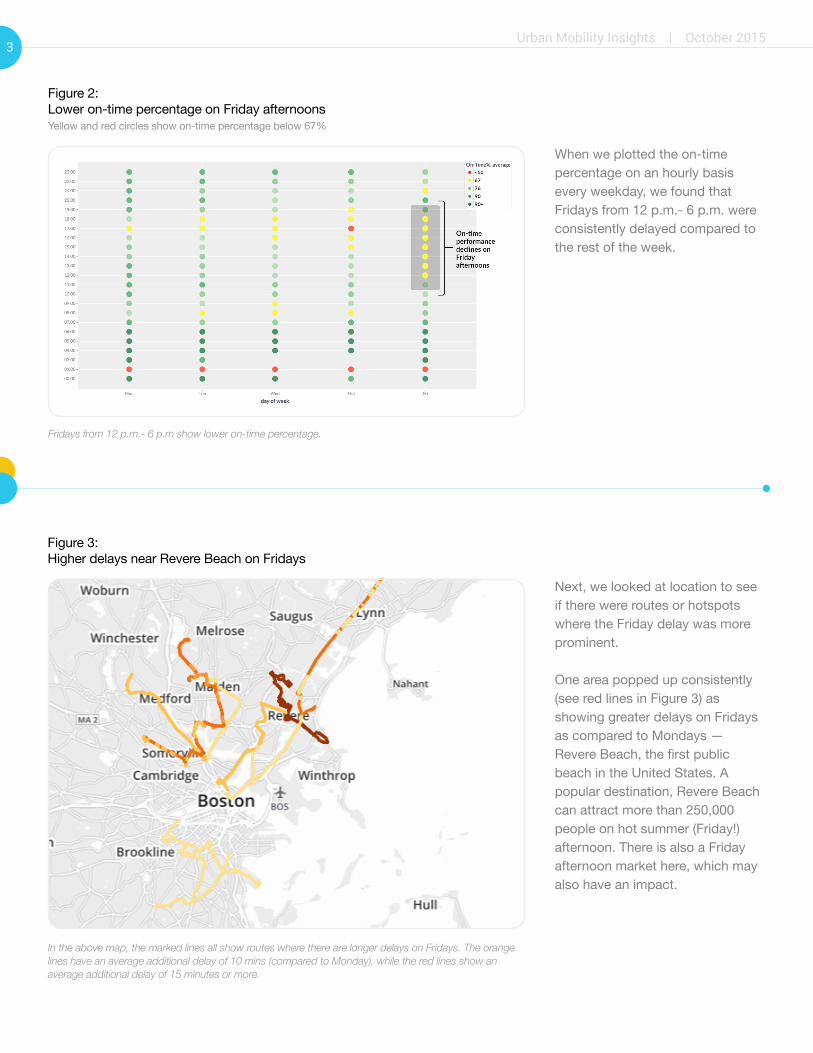
In the above map, the marked lines all show routes where there are longer delays on Fridays. The orange
lines have an average additional delay of 10 mins (compared to Monday), while the red lines show an
average additional delay of 15 minutes or more.
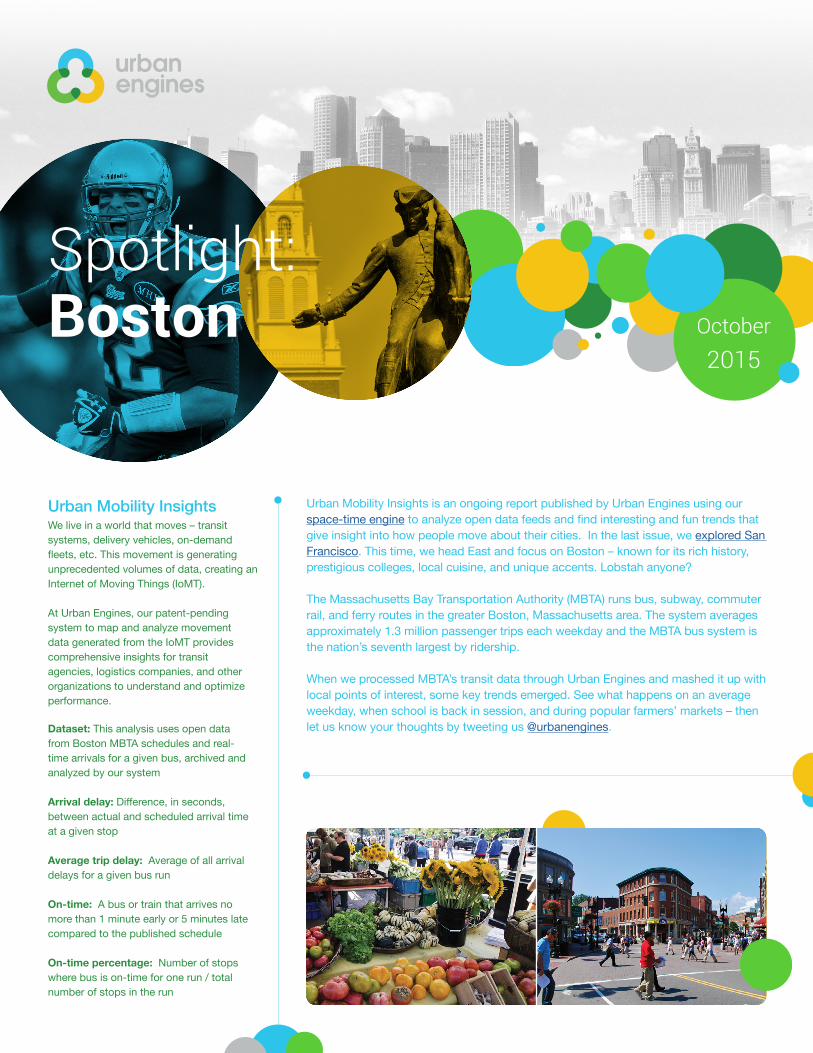
Fridays from 12 p.m.- 6 p.m show lower on-time percentage.
if there were routes or hotspots
where the Friday delay was more
One area popped up consistently
as compared to Mondays —
When we plotted the on-time
consistently delayed compared to

Urban Mobility Insights | October 20154
80
100
60
40
20
0
BostonUniversity
NortheasternUniversity
HarvardUniversity
UmassBoston
== Before school starts
Aroundstart ofschool
On-time percentage for MBTA bus runs near the four universities comparing August 16-29, 2015 (two
weeks before classes begin) to August 30-September 12, 2015 (two weeks around beginning of classes).
University students cause delays when they go back to
school as they learn to commute

Urban Mobility Insights | October 20155
Local bus delays near local farmers’ markets
BostonUniversity
NortheasternUniversity
HarvardUniversity
UmassBoston
AllBoston
83% 82%86%
75%
87%
Percentage change in on-time performance for the two weeks prior to and around beginning of classes for
routes near the four universities compared to all routes in Boston.
buses also declined from the end
September – this could be due
to more people on the road after

Urban Mobility Insights | October 20156
80
100
60
40
20
0
May June July Aug
== SatNon market day
SunMarket day
80
100
60
40
20
0
June July Aug
==Near Roslindale All Boston
South End Open Market at SoWa runs on Sundays from 10 a.m.-4 p.m.
Market days show lower on-time percentage compared to non-market
days (except in June)
Chart shows decrease in on-time percentage on market days compared
to non-market weekend days for Roslindale and compares it to the same
ratio for all Boston buses.
80
100
60
40
20
0
June July Aug
==SunNon market day
SatMarket day
Roslindale Market runs on Saturdays from 9 a.m.-1:30 p.m. June through
November. Market days show lower on-time percentage compared to
non-market days
80
100
60
40
20
0
June July AugJune
==Near SoWa All Boston
Boston buses
Chart shows decrease in on-time percentage on market days compared to
non-market weekend days for South End Open Market and compares it to
the same ratio for all Boston buses.

Urban Mobility Insights | October 20157
Interested in analyzing your own movement data to uncover trends and insights?
Contact us at:
https://www.urbanengines.com/mobility/contact
About Urban Engines
and analytics platform creates actionable
Average segment delays for most impacted routes near the market Average segment delays for most impacted routes near the market


