Nasdaq: USEG www.usnrg.com
Corporate Presentation February 12, 2014
F L O R I D A
Please carefully read the following disclaimer: The information discussed in this Presentation includes “forward-looking statements” within the meaning of Section 27A of the Securities Act of 1933 (the “Securities Act”) and Section 21E of the Securities Exchange Act of 1934 (the “Exchange Act”). All statements made in or in conjunction with this Presentation, other than statements of historical fact, are forward-looking statements. Examples of such statements in this Presentation concern planned capital expenditures for oil and gas exploration and development projects; cash expected to be available for continued work programs with all our industry partners, and for those projects as to which we do not presently have industry partners; recovered volumes and values of oil and gas approximating third-party estimates of oil and gas reserves; projected increases in oil and gas production; current and anticipated drilling and completion activities; anticipated production and price differentials and decline rates from initial production rates, over time, of the daily volume of oil and natural gas produced from wells completed in the Williston Basin and elsewhere; the relationship of national oil and gas natural prices to prices paid for such production in the Williston Basin [and other areas in which we operate]; the drilling of additional wells without industry partners; expected well spacing for wells to be drilled; future cash flows and borrowings; pursuit of potential acquisition opportunities; our expected financial position; our business strategy; future occupancy rates for the energy-related residential housing complex in Gillette Wyoming and the financial performance of the complex; and other plans and objectives for future operations. These forward-looking statements are typically identified by their use of terms and phrases such as “may,” “expect,” “estimate,” “project,” “plan,” “believe,” “intend,” “achievable,” “anticipate,” “will,” “continue,” “potential,” “should,” “could,” and similar terms and phrases. Though we believe that the expectations reflected in these statements are reasonable, they do involve certain assumptions, risks and uncertainties. Results could differ materially from those anticipated in these statements as a result of certain factors. Our future results will depend upon various other risks and uncertainties, including, but not limited to, those detailed in the section entitled “Risk Factors” in our Annual Report on Form 10-K, our Quarterly Reports on Form 10-Q, and other filings we make with the Securities and Exchange Commission, all of which are incorporated by reference in this Presentation. All forward-looking statements attributable to us or persons acting on our behalf are expressly qualified in their entirety by the cautionary statements made above, elsewhere in this Presentation and as incorporated from our public filings. All of such forward-looking statements are made as of the date of this Presentation, and except as otherwise required under securities laws, we do not assume a duty to update any forward-looking statement, whether as a result of new information, subsequent events or circumstances, changes in expectations or otherwise. Actual timing of drilling and completing wells, well performance and the anticipated number of gross and net wells could vary in each of these cases. Amounts budgeted for each regional drilling program are also subject to change based on a number of factors including, but not limited to, timing, well costs, drilling and completion success, availability of capital and weather-related issues. Anticipated well performance could also vary significantly from those modeled internally. Furthermore, funds allocated for specific drilling programs under the 2013 CAPEX budget will be re-allocated to other drilling programs if initial results are below expectations. IP rates, test results and similar data from exploration and development activities are not necessarily reflective of the production, reserves or cash flow that may ultimately be generated from the well in question. Our ability, or the ability of the relevant operator, to maintain expected levels of production from a well is subject to numerous risks and uncertainties, including those discussed and referenced above.
2
Safe Harbor Disclosure
Market Data
3
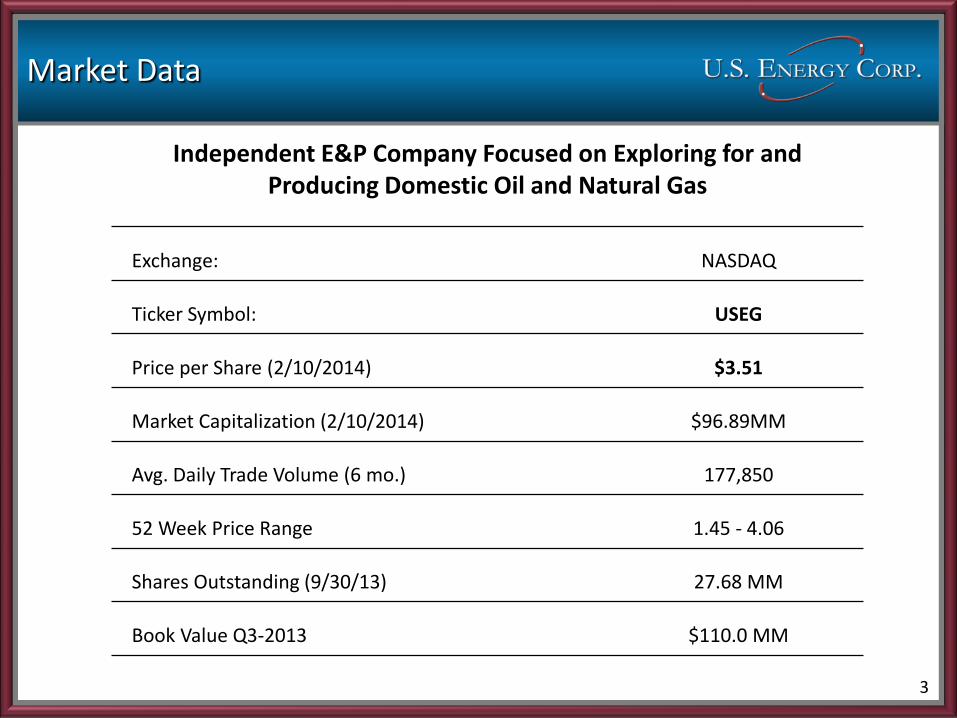
Independent E&P Company Focused on Exploring for and Producing Domestic Oil and Natural Gas
Exchange: NASDAQ
Ticker Symbol: USEG
Price per Share (2/10/2014) $3.51
Market Capitalization (2/10/2014) $96.89MM
Avg. Daily Trade Volume (6 mo.) 177,850
52 Week Price Range 1.45 - 4.06
Shares Outstanding (9/30/13) 27.68 MM
Book Value Q3-2013 $110.0 MM

Areas of Activity / Participation
4
Core Areas of Focus: Williston Basin / South Texas Unconventional Resource Development
Austin Chalk / Eagle Ford Shale / Buda Limestone
Production / Development Program
Bakken/Three Forks Production / Development Program
5
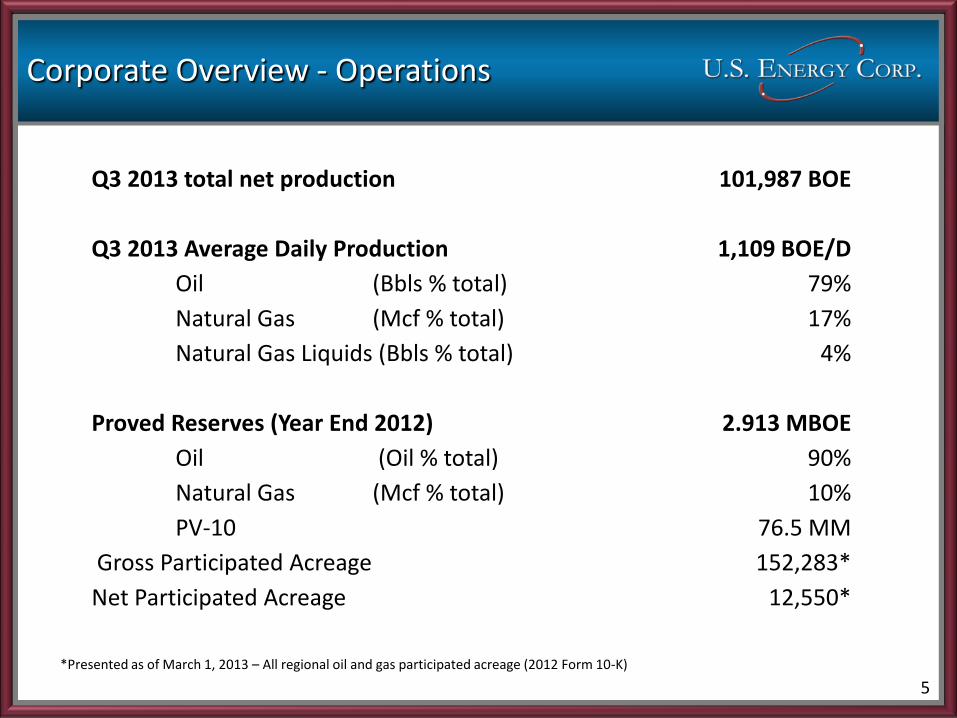
Q3 2013 total net production 101,987 BOE
Q3 2013 Average Daily Production 1,109 BOE/D
Oil (Bbls % total) 79%
Natural Gas (Mcf % total) 17%
Natural Gas Liquids (Bbls % total) 4%
Proved Reserves (Year End 2012) 2.913 MBOE
Oil (Oil % total) 90%
Natural Gas (Mcf % total) 10%
PV-10 76.5 MM
Gross Participated Acreage 152,283*
Net Participated Acreage 12,550*
Corporate Overview - Operations
*Presented as of March 1, 2013 – All regional oil and gas participated acreage (2012 Form 10-K)
6
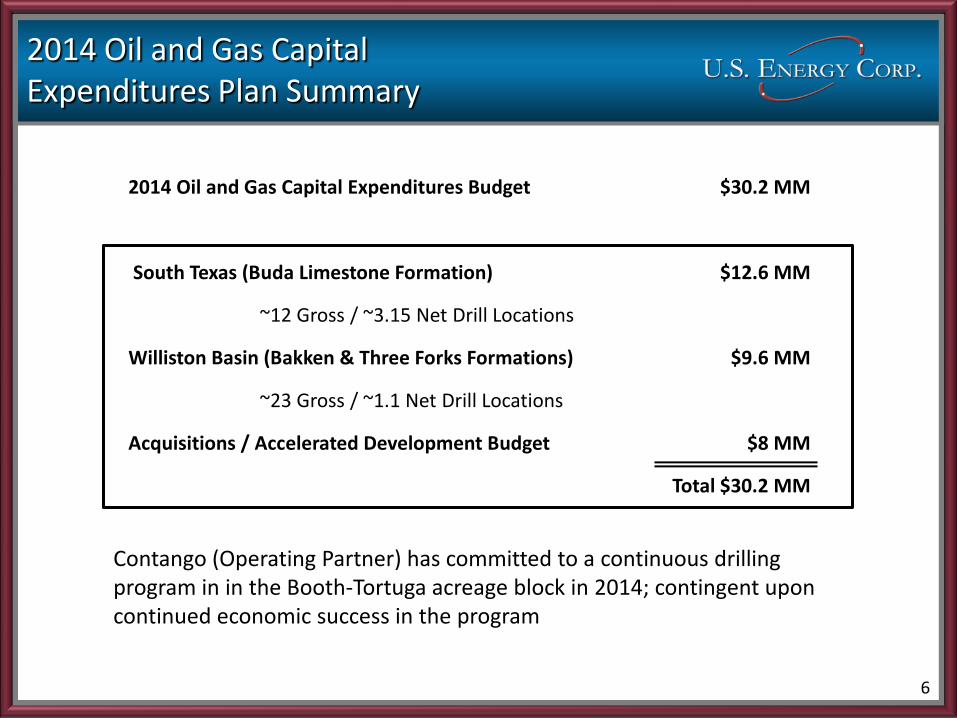
2014 Oil and Gas Capital Expenditures Budget $30.2 MM
South Texas (Buda Limestone Formation) $12.6 MM
~12 Gross / ~3.15 Net Drill Locations
Williston Basin (Bakken & Three Forks Formations) $9.6 MM
~23 Gross / ~1.1 Net Drill Locations
Acquisitions / Accelerated Development Budget $8 MM
Total $30.2 MM
2014 Oil and Gas Capital Expenditures Plan Summary
Contango (Operating Partner) has committed to a continuous drilling program in in the Booth-Tortuga acreage block in 2014; contingent upon continued economic success in the program

E&P Assets
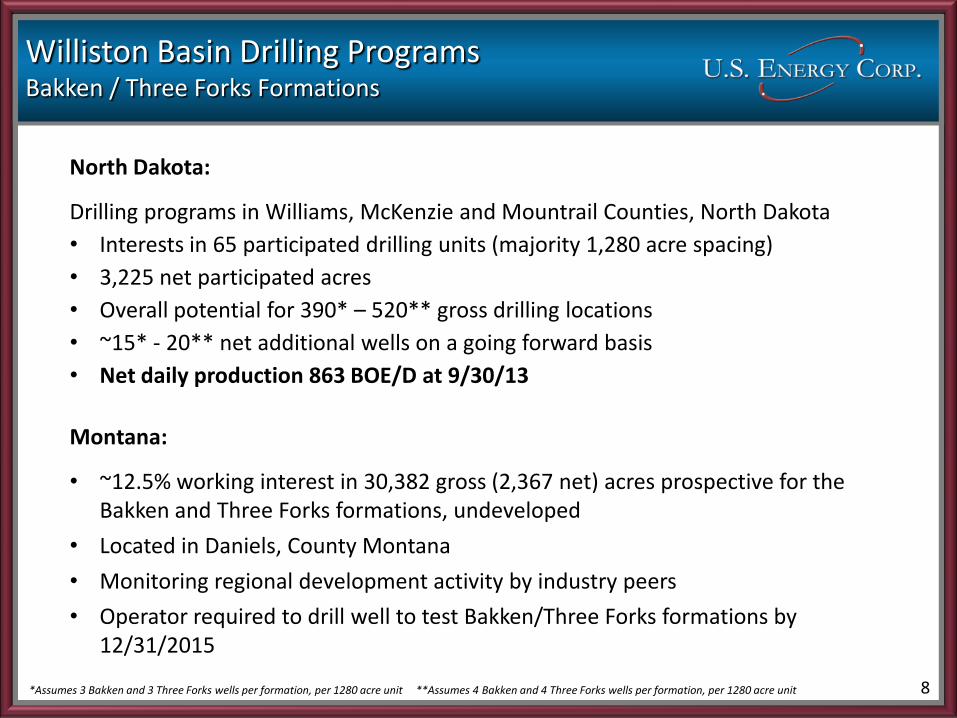
Williston Basin Drilling Programs Bakken / Three Forks Formations
North Dakota:
Drilling programs in Williams, McKenzie and Mountrail Counties, North Dakota
• Interests in 65 participated drilling units (majority 1,280 acre spacing)
• 3,225 net participated acres
• Overall potential for 390* – 520** gross drilling locations
• ~15* - 20** net additional wells on a going forward basis
• Net daily production 863 BOE/D at 9/30/13
Montana:
• ~12.5% working interest in 30,382 gross (2,367 net) acres prospective for the Bakken and Three Forks formations, undeveloped
• Located in Daniels, County Montana
• Monitoring regional development activity by industry peers
• Operator required to drill well to test Bakken/Three Forks formations by 12/31/2015
*Assumes 3 Bakken and 3 Three Forks wells per formation, per 1280 acre unit **Assumes 4 Bakken and 4 Three Forks wells per formation, per 1280 acre unit 8
9
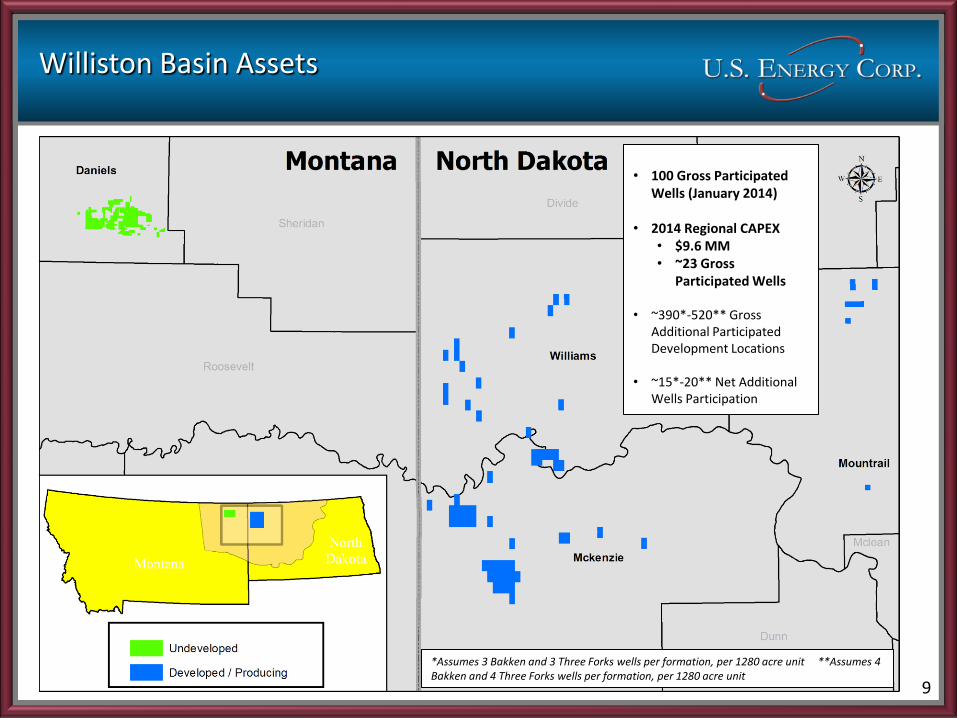
Williston Basin Assets
• 100 Gross Participated
Wells (January 2014)
• 2014 Regional CAPEX • $9.6 MM • ~23 Gross
Participated Wells
• ~390*-520** Gross Additional Participated Development Locations
• ~15*-20** Net Additional Wells Participation
*Assumes 3 Bakken and 3 Three Forks wells per formation, per 1280 acre unit **Assumes 4 Bakken and 4 Three Forks wells per formation, per 1280 acre unit
10
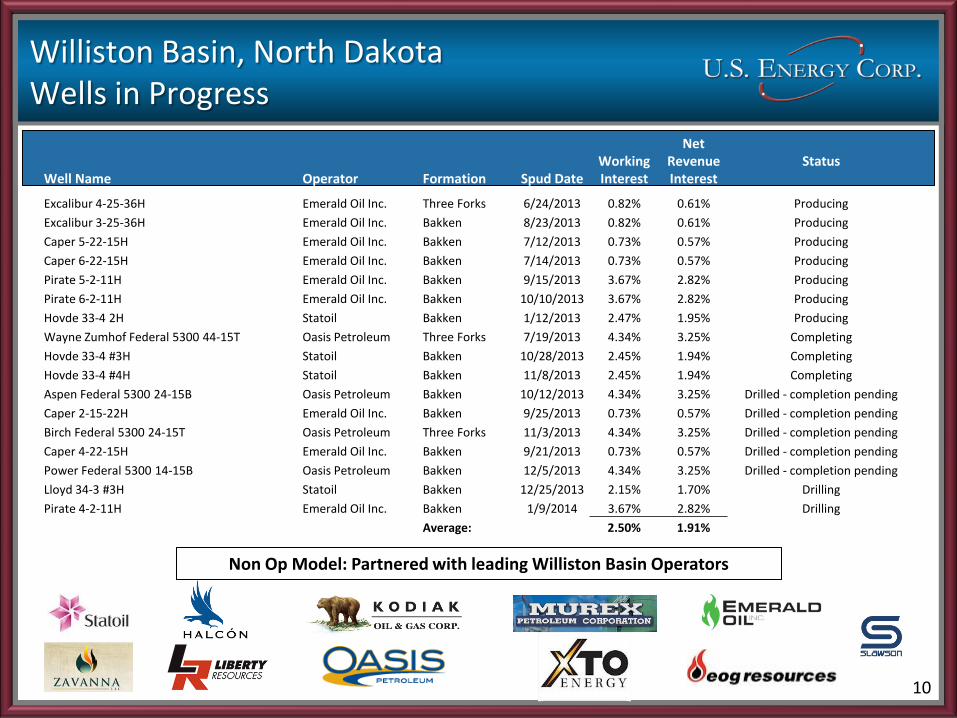
Williston Basin, North Dakota Wells in Progress
Well Name Operator Formation Spud Date Working Interest
Net Revenue Interest
Status
Excalibur 4-25-36H Emerald Oil Inc. Three Forks 6/24/2013 0.82% 0.61% Producing
Excalibur 3-25-36H Emerald Oil Inc. Bakken 8/23/2013 0.82% 0.61% Producing
Caper 5-22-15H Emerald Oil Inc. Bakken 7/12/2013 0.73% 0.57% Producing
Caper 6-22-15H Emerald Oil Inc. Bakken 7/14/2013 0.73% 0.57% Producing
Pirate 5-2-11H Emerald Oil Inc. Bakken 9/15/2013 3.67% 2.82% Producing
Pirate 6-2-11H Emerald Oil Inc. Bakken 10/10/2013 3.67% 2.82% Producing
Hovde 33-4 2H Statoil Bakken 1/12/2013 2.47% 1.95% Producing
Wayne Zumhof Federal 5300 44-15T Oasis Petroleum Three Forks 7/19/2013 4.34% 3.25% Completing
Hovde 33-4 #3H Statoil Bakken 10/28/2013 2.45% 1.94% Completing
Hovde 33-4 #4H Statoil Bakken 11/8/2013 2.45% 1.94% Completing
Aspen Federal 5300 24-15B Oasis Petroleum Bakken 10/12/2013 4.34% 3.25% Drilled - completion pending
Caper 2-15-22H Emerald Oil Inc. Bakken 9/25/2013 0.73% 0.57% Drilled - completion pending
Birch Federal 5300 24-15T Oasis Petroleum Three Forks 11/3/2013 4.34% 3.25% Drilled - completion pending
Caper 4-22-15H Emerald Oil Inc. Bakken 9/21/2013 0.73% 0.57% Drilled - completion pending
Power Federal 5300 14-15B Oasis Petroleum Bakken 12/5/2013 4.34% 3.25% Drilled - completion pending
Lloyd 34-3 #3H Statoil Bakken 12/25/2013 2.15% 1.70% Drilling
Pirate 4-2-11H Emerald Oil Inc. Bakken 1/9/2014 3.67% 2.82% Drilling
Average: 2.50% 1.91%
Non Op Model: Partnered with leading Williston Basin Operators
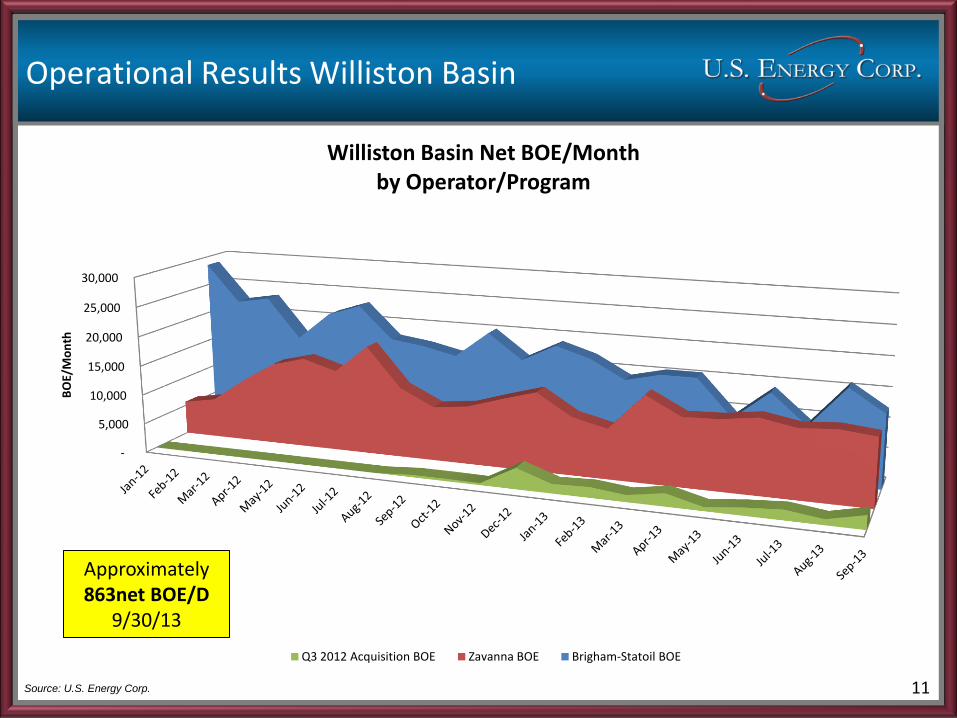
Operational Results Williston Basin
Source: U.S. Energy Corp. 11
Approximately 863net BOE/D
9/30/13
-
5,000
10,000
15,000
20,000
25,000
30,000
BO
E/M
on
th
Williston Basin Net BOE/Month by Operator/Program
Q3 2012 Acquisition BOE Zavanna BOE Brigham-Statoil BOE
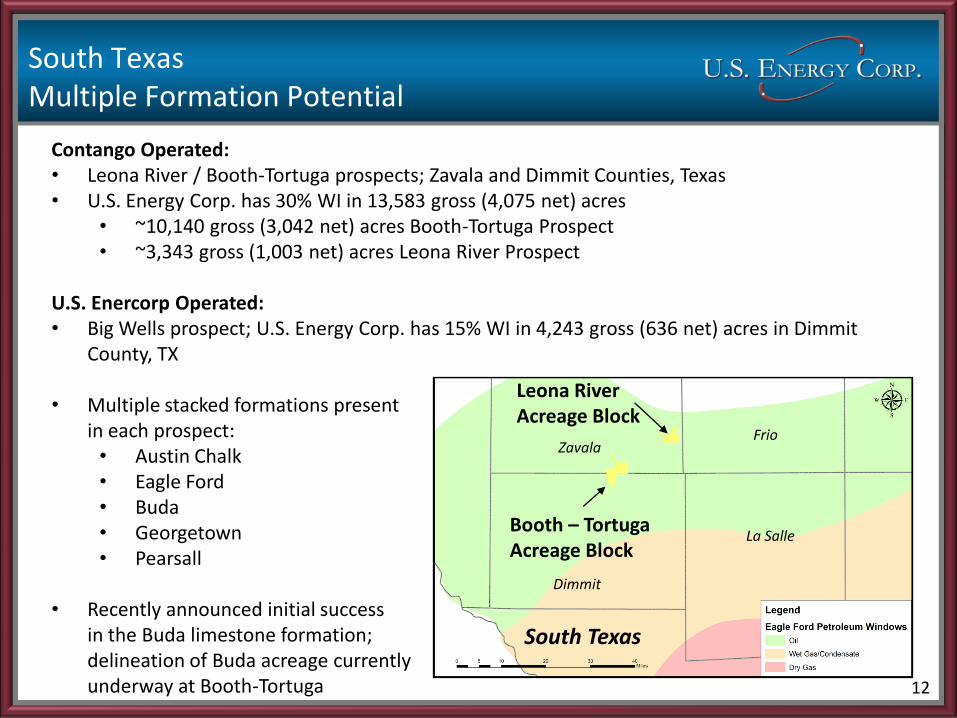
Contango Operated: • Leona River / Booth-Tortuga prospects; Zavala and Dimmit Counties, Texas • U.S. Energy Corp. has 30% WI in 13,583 gross (4,075 net) acres
• ~10,140 gross (3,042 net) acres Booth-Tortuga Prospect • ~3,343 gross (1,003 net) acres Leona River Prospect
U.S. Enercorp Operated: • Big Wells prospect; U.S. Energy Corp. has 15% WI in 4,243 gross (636 net) acres in Dimmit
County, TX
• Multiple stacked formations present in each prospect: • Austin Chalk • Eagle Ford • Buda • Georgetown • Pearsall
• Recently announced initial success
in the Buda limestone formation; delineation of Buda acreage currently underway at Booth-Tortuga
South Texas Multiple Formation Potential
12
South Texas
Leona River Acreage Block
Booth – Tortuga Acreage Block
La Salle
Frio
Dimmit
Zavala
13
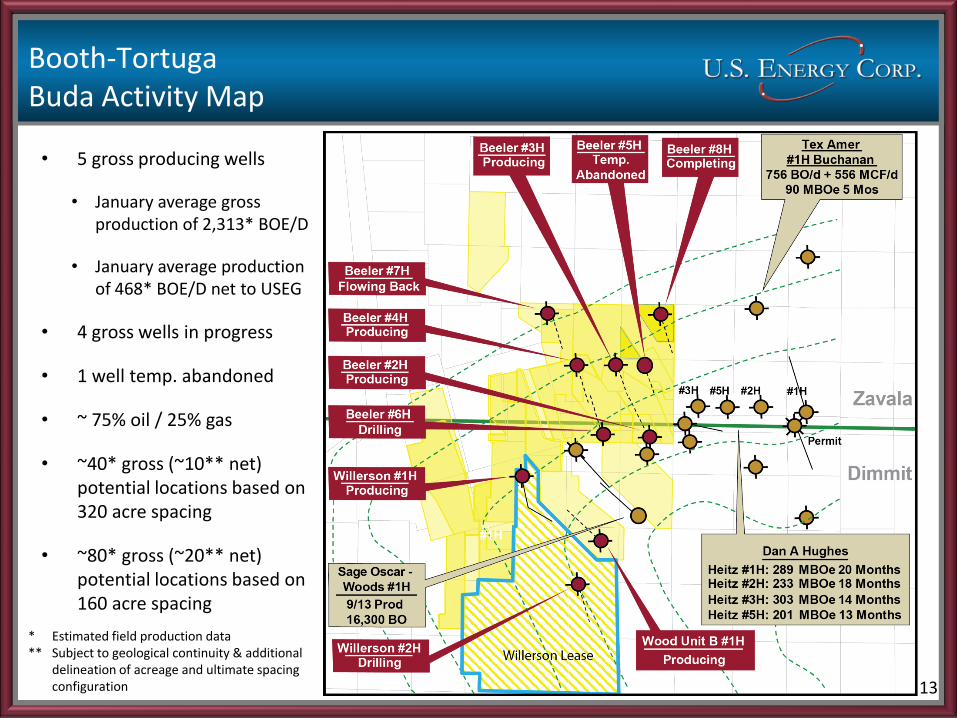
Booth-Tortuga Buda Activity Map
• 5 gross producing wells
• January average gross production of 2,313* BOE/D
• January average production of 468* BOE/D net to USEG
• 4 gross wells in progress
• 1 well temp. abandoned
• ~ 75% oil / 25% gas
• ~40* gross (~10** net) potential locations based on 320 acre spacing
• ~80* gross (~20** net) potential locations based on 160 acre spacing
* Estimated field production data ** Subject to geological continuity & additional
delineation of acreage and ultimate spacing configuration

14
Buda Limestone Formation Well Data
Beeler #2H – Producing
• Initial Production Rate 859 Gross BOE/D • Cumulative Production (1/31/14) 136,716 Gross BOE
Beeler #3H – Producing
• Initial Production Rate 1,260 Gross BOE/D • Cumulative Production (1/31/14) 57,681 Gross BOE
Beeler #4H - Producing
• Initial Production Rate 1,430 Gross BOE/D • Cumulative Production (1/31/14) 96,997 Gross BOE
Willerson #1H – Producing
• Initial Production Rate 1,039 Gross BOE/D • Cumulative Production (1/27/14) 32,581 Gross BOE
Wood Unit B #1H – Producing • 30 Day Avg. Initial Production Rate 338 Gross BOE/D
Beeler #7H – Producing
• Initial Rates Positive
Beeler #8H – In Progress • Completing
Willerson #2H – In Progress • Drilling (Spud 2/3/14)
Beeler #6H – In progress • Drilling (Spud 2/10/14)

15
3,678 net acres (Booth-Tortuga / Big Wells)
Booth-Tortuga Prospect: 30% WI / 22.5% NRI
Big Wells Prospect: 15% WI / 11.25% NRI
• Approximate $4 million gross drilling cost per well
• Estimated ultimate recovery of 400,000 BOE (Internal Company Estimates)*
Buda Economics
Estimated Net Present Value*
Assumptions
AFE $ 4,000,000
Oil Price (per Bbl) $ 100
Royalty 25.0% Production Tax 4.6% Production Required for Payout (Bbls) 56,818
Revenue $ 5,681,818
Royalty (1,420,455)
Production Tax (261,364)
Net $ 4,000,000
320 Acre Spacing 160 Acre Spacing
Prospect Locations PV-10 (net) Locations PV-10 (net)
Booth-Tortuga 30 $ 120,000,000 60 $ 240,000,000
Big Wells 10 $ 20,000,000 20 $ 40,000,000
Total 40 $ 140,000,000 80 $ 280,000,000
* Figures and calculation are based on internal Company estimates. There is no assurance that the above illustrations will be representative of actual drilling locations, drilling results, estimate EUR’s or economics.
16
-
2,000
4,000
6,000
8,000
10,000
12,000
14,000
16,000
Jul-12 Aug-12 Sep-12 Oct-12 Nov-12 Dec-12 Jan-13 Feb-13 Mar-13 Apr-13 May-13 Jun-13 Jul-13 Aug-13 Sep-13
BO
E/M
on
th
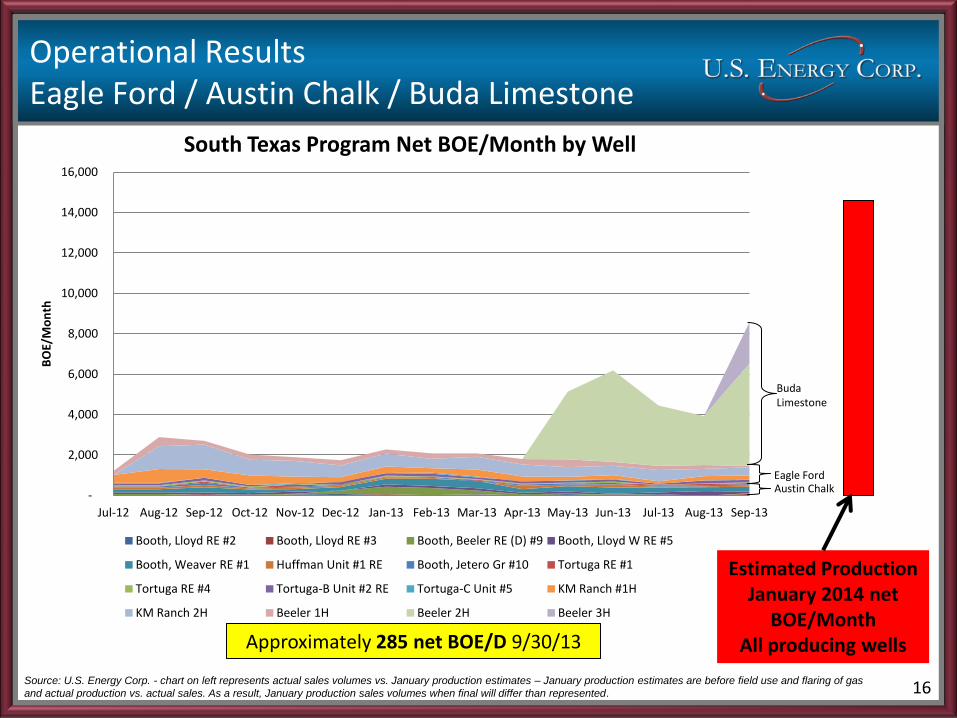
South Texas Program Net BOE/Month by Well
Booth, Lloyd RE #2 Booth, Lloyd RE #3 Booth, Beeler RE (D) #9 Booth, Lloyd W RE #5
Booth, Weaver RE #1 Huffman Unit #1 RE Booth, Jetero Gr #10 Tortuga RE #1
Tortuga RE #4 Tortuga-B Unit #2 RE Tortuga-C Unit #5 KM Ranch #1H
KM Ranch 2H Beeler 1H Beeler 2H Beeler 3H
Operational Results Eagle Ford / Austin Chalk / Buda Limestone
Source: U.S. Energy Corp. - chart on left represents actual sales volumes vs. January production estimates – January production estimates are before field use and flaring of gas
and actual production vs. actual sales. As a result, January production sales volumes when final will differ than represented.
Eagle Ford
Approximately 285 net BOE/D 9/30/13
Buda Limestone
Estimated Production January 2014 net
BOE/Month All producing wells
Austin Chalk

17
Operational Results – All Oil & Gas Programs
Source: U.S. Energy Corp.
-
5,000
10,000
15,000
20,000
25,000
30,000
35,000
40,000
BO
E/M
on
th
2012-13 Production by Region
Gulf Coast Texas (Buda/Eagle Ford/Austin Chalk) Williston Basin
Approximately 1,240 net BOE/D
9/30/13

Financials
19
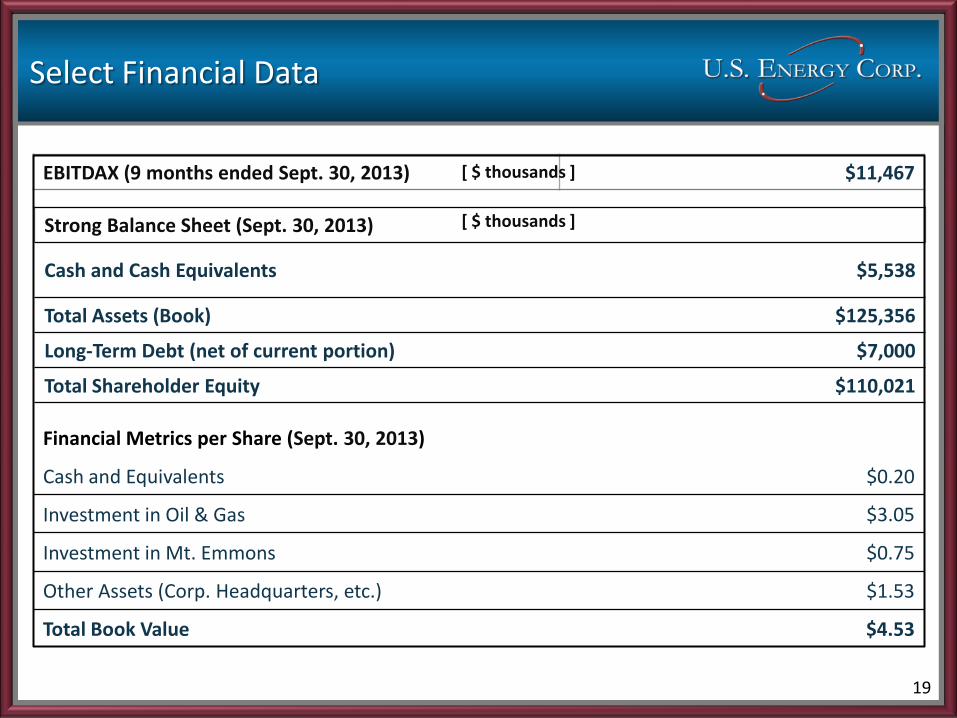
Select Financial Data
Financial Metrics per Share (Sept. 30, 2013)
Cash and Equivalents $0.20
Investment in Oil & Gas $3.05
Investment in Mt. Emmons $0.75
Other Assets (Corp. Headquarters, etc.) $1.53
Total Book Value $4.53
Strong Balance Sheet (Sept. 30, 2013)
Cash and Cash Equivalents $5,538
Total Assets (Book) $125,356
Long-Term Debt (net of current portion) $7,000
Total Shareholder Equity $110,021
EBITDAX (9 months ended Sept. 30, 2013) $11,467 [ $ thousands ]
[ $ thousands ]
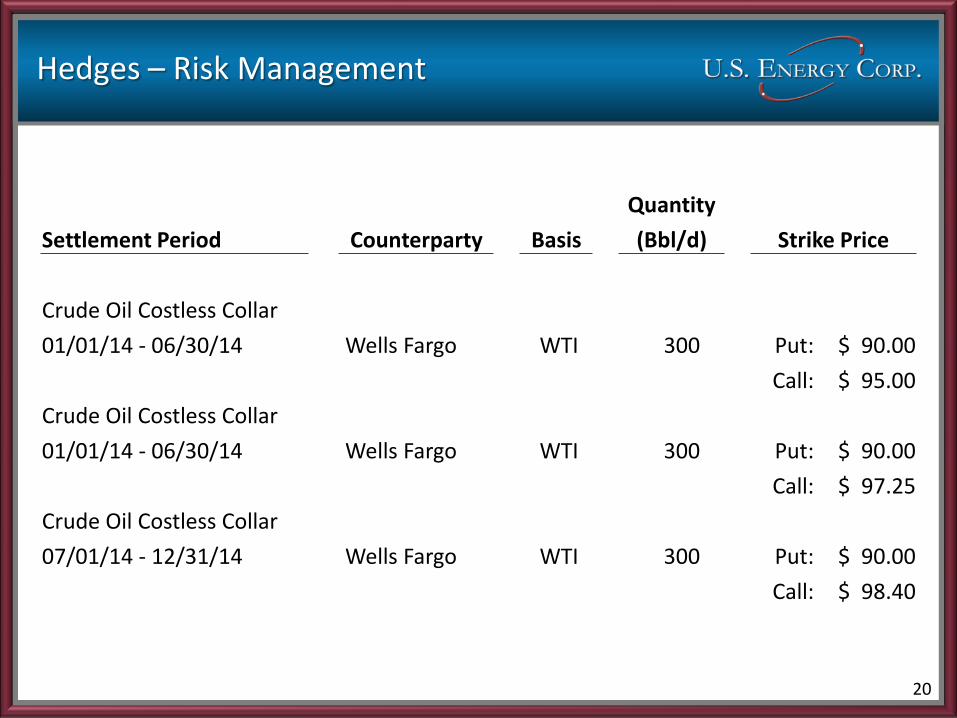
Hedges – Risk Management
20
Quantity
Settlement Period Counterparty Basis (Bbl/d) Strike Price
Crude Oil Costless Collar
01/01/14 - 06/30/14 Wells Fargo WTI 300 Put: $ 90.00
Call: $ 95.00
Crude Oil Costless Collar
01/01/14 - 06/30/14 Wells Fargo WTI 300 Put: $ 90.00
Call: $ 97.25
Crude Oil Costless Collar
07/01/14 - 12/31/14 Wells Fargo WTI 300 Put: $ 90.00
Call: $ 98.40
21
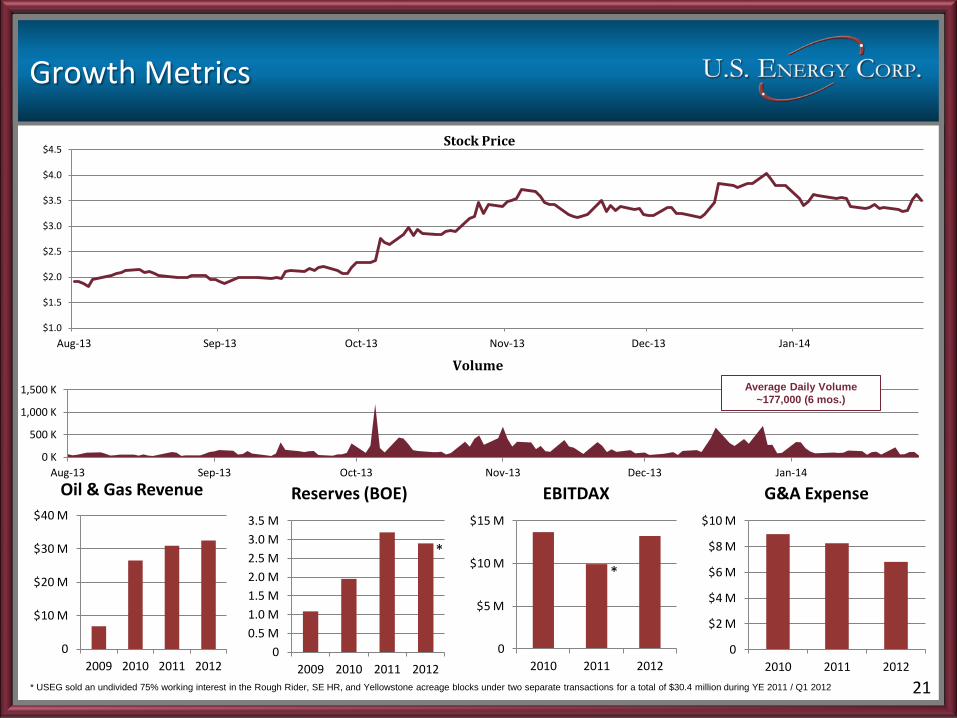
Growth Metrics
0
$10 M
$20 M
$30 M
$40 M
2009 2010 2011 2012
Oil & Gas Revenue
0
0.5 M
1.0 M
1.5 M
2.0 M
2.5 M
3.0 M
3.5 M
2009 2010 2011 2012
Reserves (BOE)
0
$5 M
$10 M
$15 M
2010 2011 2012
EBITDAX
0
$2 M
$4 M
$6 M
$8 M
$10 M
2010 2011 2012
G&A Expense
*
*
* USEG sold an undivided 75% working interest in the Rough Rider, SE HR, and Yellowstone acreage blocks under two separate transactions for a total of $30.4 million during YE 2011 / Q1 2012
$1.0
$1.5
$2.0
$2.5
$3.0
$3.5
$4.0
$4.5
Aug-13 Sep-13 Oct-13 Nov-13 Dec-13 Jan-14
Stock Price
0 K
500 K
1,000 K
1,500 K
Aug-13 Sep-13 Oct-13 Nov-13 Dec-13 Jan-14
Volume
Average Daily Volume
~177,000 (6 mos.)

22
Key Takeaways / Investment Highlights
Catalysts:
• Active drilling programs in the Bakken and Three Forks formations – Williston Basin North Dakota
• Experienced Management Team / Attractive development portfolio
• Financial flexibility / Strong balance sheet and liquidity for growth
• Focused on liquids rich resource plays / Accretive value for shareholders
Buda Limestone
• Encouraging results in initial test wells
• Continuous drilling scheduled through the balance of 2014
• Exploration and development anticipated to be funded from cash flow
• Delineation program currently underway; potential for “outstanding” Buda formation economics in Booth-Tortuga and Big Wells Prospects
• Executing on 2014 growth plan
22

Nasdaq: USEG www.usnrg.com
Shareholder Contact: NASDAQCM: USEG Headquarters: U.S. Energy Corp. 877 N. 8th W. Riverton, Wyoming 82501 P. 1-800-776-9271 F. 1-307-857-3050
Investor Relations: Reggie Larsen Director of Investor Relations P. 1-800-776-9271 M. 1-307-851-4043 [email protected] Web site: www.usrng.com


