1
Working Paper DTC-2014-1
US Phytosanitary Restrictions: The Forgotten Non-Tariff Barrier
Marie-Agnès Jouanjean, Overseas Development Institute.
Jean-Christophe Maur, The World Bank.
Ben Shepherd, Principal.
May 19, 2014.
349 5th Avenue New York, NY 10016
2
US Phytosanitary Restrictions: The Forgotten Non-Tariff Barrier
Marie-Agnès Jouanjean, Jean-Christophe Maur, and Ben Shepherd1
This Version Dated: May 19, 2014.
Abstract: We provide new evidence that the US phytosanitary regime is associated with a
restrictive market access environment for fruit and vegetable products. One chief reason
seems to be that the US regime uses a positive list approach, under which only authorized
countries can export. For most products, only a portion of global production is authorized for
export to the US. Even among authorized countries, only a small proportion actually export.
As a result, the number of countries exporting fresh fruit and vegetables to the US is far
lower than in comparator countries like the EU and Canada, but is on a par with markets
known to be restrictive in this area, such as Australia and Japan. Using a dataset of fruit and
vegetable market access and political contributions, we also provide evidence showing that
domestic political economy considerations may influence the decision to grant market
access to foreign producers.
JEL Codes: F13; F15; O24.
Keywords: Product standards; SPS measures; Non-tariff barriers; Market access; Developing
countries.
1 Jouanjean: Research Fellow, Overseas Development Institute. [email protected]. Maur: Senior Economist, World Bank. [email protected]. Shepherd (Corresponding Author): Principal, Developing Trade Consultants, 349 5th Avenue, New York, NY 10016, USA, Tel. +1-646-845-9702, Fax. +1-646-850-0583. [email protected]. The authors are grateful to John Beghin, two anonymous reviewers, and the Editor, L. Alan Winters, for comments on a previous draft. The findings, interpretations, and conclusions expressed in this paper are entirely those of the authors. They do not represent the view of the World Bank, its Executive Directors, or the countries they represent.
3
1 Introduction
Sanitary and phytosanitary measures (SPS) present significant obstacles to agricultural
exporters, particularly to small producers in developing countries. Although standards in
importing markets like the European Union and the United States can act as catalysts for
production and supply chain upgrading in poorer countries (Maertens and Swinnen, 2009),
the adaptation costs involved, including notably large fixed costs, can be substantial and may
exceed the capacity of some producers (Henson & Jaffee, 2004).
Producers are increasingly facing the challenges posed by standards in importing markets,
particularly SPS measures. Market access issues posed by standards are clearly
acknowledged in the WTO framework, in particular the SPS Agreement and the Agreement
on Technical Barriers to Trade, but negotiations on agricultural market access keep focusing
on tariffs and more traditional non-tariff barriers such as subsidies. Not unlike policy,
analysis is also lagging behind the market realities: data constraints have made it difficult for
researchers to shed more than partial light on the mechanisms at work in the SPS area, and
the effects they have on developing country exporters. SPS measures are complex, often
product-firm-and-process-specific and non-transparent. They remain difficult to grasp for
non-specialists, including trade policymakers and analysts.
Unlike traditional instruments of trade policy, SPS measures are not usually designed to
restrict trade. Rather, they aim to meet legitimate health and plant protection objectives,
which complicates the task of disentangling acceptable regulatory stances from possibly
protectionist ones. To date, the main concern in this regard has been on human health
impacts (e.g. Otsuki, Sewadeh and Wilson, 2001), probably because they resonate more in

4
public policy debates than does the protection of plants from pests and pathogens.2 Plant
pest outbreaks have a direct impact on the environment and on producers income, whom in
developed economies, only represent up to 1 or 2% of the population. Food safety outbreaks
are direct threats to o su e s ell-being and even sometimes to their lives, but pest
outbreaks have a much more indirect effect. . Yet each objective -- the protection of health
and of plants -- requires a different set of measures, and both potentially have trade
impacts. For instance, a survey of Guatemalan exporters3 of non-traditional agricultural
exports4 showed that they were much more afraid of pest outbreaks resulting in import bans
in the US than of import refusals from the Food and Drug Administration (FDA) based on
food safety parameters. This is the focus of this paper: SPS measures designed to preserve
plant health by preventing the spread of pests -- so-called phytosanitary measures -- and
more specifically the mechanisms that can give rise to market access restrictions in the US.
A further issue is that, unlike traditional trade measures like tariffs, SPS measures are
implemented very differently, and in ad hoc ways, across destination markets, even in cases
where regulatory objectives might actually be quite close. Exporters with limited supply
capacity and ability to explore different markets have to make choices about which market
they should target. Differences across markets regarding conditions of access are relatively
difficult to assess, resulting in uncertainty for prospective entrants. Reliance on a small
number of geographical destinations also places producers at particular risk of adverse
demand shocks. It is to be expected that differences in enforcement, and beyond that
differences in enforcement capacity, translate also into differences in market assess costs,
2 In the remainder of the text we will use the term pest to include both pests and pathogens, unless otherwise specified. 3 Conducted by Jouanjean in November – December 2009 4 As opposed to traditional exports such as bananas and sugar. This expression is often used to talk about new high value agricultural exports, mostly horticultural products.
5
some of which are fixed sunk costs. This is the beach head effect posited by Baldwin (1988).
Recent attempts in the empirical literature to draw measurable comparisons across markets
confirm this suspicion (see e.g. Kee, Nicita and Olarreaga, 2009).
In this paper, we focus on the US system of phytosanitary measures, the compliance with
which determines the right to export to the US from a given geographic origin. This system is
complex, and this can have profound implications for developing country exporters, as the
outcome is often that market access is precluded altogether. For many exporters, these
phytosanitary requirements are a prohibitive non-tariff barrier. Most relevant is the
positi e list app oa h used the US, i hi h o l those ou t ies that ha e ee
specifically approved by US authorities are able to export fresh fruits and vegetables (FF&V)
to the US. This system is potentially highly restrictive, as it prohibits entry for any product
that has not been pre-approved, and requires producers to navigate a costly and complex
web of regulations and standards before accessing the market. There is also ample scope for
domestic producer lobbies to be involved in the regulatory approval process and potentially
ga e the s ste to the det i e t of de elopi g ou t e po te s. As a esult of these
characteristics, we find that market access in the US is considerably more restricted than in
comparable markets like the EU or Canada: the number of countries authorized to export
FF&V to the US is usuall a s all f a tio of the o ld s total p odu e s o e po te s.
Numerous case studies have already provided persuasive anecdotal evidence of the
restrictive nature of the US FF&V import regime for certain products. Two long-running
disputed cases about access to the US market have been extensively discussed in the
literature: Mexican Hass avocadoes (Roberts and Orden, 1997; Lamb, 2006; Romano, 1998;
Orden, Narrod and Glauber, 2001; Carman, Lee and Sexton, 2006; Peterson and Orden,

6
2008a; and Peterson and Orden, 2008b), and Argentinian citrus fruits (McLean, 2004;
Stewart and Schenewerk, 2004; Cororaton, Orden and Peterson, 2011; and Thornsbury and
Romano, 2007). The well-documented analysis provided by this body of studies suggests that
there has been capture of the regulatory process by special interest groups. One effective
st ateg used US p odu e s asso iatio s highlighted i these ase studies is the
systematic questioning of the elia ilit of USDA s s ie tifi o lusio s. Doi g so
successfully raised entry costs of rival potential exporters (a predatory tactic first theorized
by Salop and Scheffman, 1983) and delayed the process of market access in some instances
by several years.
Recent empirical work has sought to assess the impact of US SPS measures. Karov, Roberts,
Grant & Peterson (2009) construct a database of US SPS measures affecting FF&V imports,
but find mixed results for the impacts of treatments and the granting of new market access
on trade flows. Jouanjean, Maur & Shepherd (2012), by contrast, consistently find that
import refusals on sanitary grounds are a significant determinant of export flows, and that
they have significant spillover effects beyond the individual shipments in question. Together,
these studies highlight the fact that many developing countries have difficulty complying
with US SPS measures, and thus have difficulty exporting FF&V consistently to the US.
In this paper we argue that in practice, if not de jure, US phytosanitary measures amount to
a prohibitive non-tariff barrier for many developing countries, in the sense that they are not
authorized to export certain products at all to the US. However, the regulatory regime lying
behind these measures is poorly understood and information about it is very diffuse. We
present a summarized picture of the US regime in Section 2. In Section 3, we attempt to
solve part of the information gap by building a dataset of US FF&V market access for the

7
period 1994-2011.We use the dataset to show that the US tends to import from a narrower
range of countries than would be expected based on experience in other major markets. In
Section 4, we turn from the impacts of the US phytosanitary regime to one of its possible
determinants: domestic political economy. There is suggestive evidence that the US
authorities authorize fewer countries to export in organized sectors (those that make
political contributions, or where production is heavily concentrated) than in unorganized
ones. The last section of the paper concludes.
2 The US Market Access Regime for FF&V: An Overview
Border measures like tariffs are only part of the regulatory thicket that potential exporters of
FF&V need to negotiate their way through in order to access a foreign market. The US is no
exception to that rule. However, its system stands out as potentially particularly restrictive
compared with that of other countries due to three factors: its complexity, which leaves
considerable room for the operation of political economy forces; the fact that it uses a
positive list approach, i.e. countries must be authorized by the US before their firms can
start exporting to that market; and the relative lack of genuine additional market access
accorded by reforms following the WTO SPS Agreement. This section examines the US
system from a market access point of view, as a way of setting the scene for the empirical
analysis in the remainder of the paper.5
Although the focus of this paper is on market access, it is important to remember that the
US phytosanitary system was designed with legitimate plant protection objectives in mind.
The public policy of plant protection is somewhat different from the more well-known area
5 It is beyond the scope of this paper to examine the interesting legal question of whether or not the US system complies with the SPS Agreement, and other relevant WTO obligations.

8
of food safety standards. It has a strong public good aspect, as a failure to implement proper
protection can lead to the spread of pests throughout the national area. The key factor is risk
management. Risk varies widely across exporting countries, due to climactic and
environmental conditions, which means that some specificity in approach is required. The
level of domestic production in the US is also relevant, because it determines the extent of a
potential quarantine pest to cause damage to US crops. To be clear, the purpose of this
paper is not to suggest that the US pla t p ote tio egi e should e olled a k o
market access grounds, but simply to highlight some of the trade-related costs that come
with the regime in its current form—and to show that alternatives, such as a negative list
approach, may achieve a similar level of protection without the same level of restrictiveness
in market access.
2.1 The General Regime
Within the US Department of Agriculture (USDA), the Animal and Plant Health Inspection
Service (APHIS) and its Plant Protection and Quarantine (PPQ) program is in charge of
protecting US agriculture and plants against the entry of foreign pests and diseases. As such,
APHIS administers and regulates – including prohibiting – market access for FF&V imports.
APHIS has the responsibility to prohibit entry into the US of food and agricultural products
that contain pests or diseases that may affect domestic animals and plants.
The US uses a positi e list app oa h to the egulatio of FF&V i po ts: all p odu ts f o
all countries are prohibited entry into the US unless explicitly allowed by a regulation. By
o t ast the Eu opea U io uses a egati e list app oa h: the EU fo ids i po ts of
selected products from specific countries based on identified phytosanitary issues (European
Commission, 2006). For some other countries, the EU requires phytosanitary certificates
9
issued by a National Plant Pest Organization (NPPO) declaring the imported product to be
free of quarantine pests. The EU protection system relies mostly on plant-health checks that
are a complete examination or an examination of samples before entry into the EU. Less
stringent checks are implemented when guarantees are provided. The main difference is
therefore that imports of FF&V in the EU do not need to go through a pre-approval process,
as they must in the US. As a result of this important difference in approach, there is clear
potential for the US regime to be more restrictive in practice—a possibility that we explore
in Section 3.
A first reform to improve the system took place in 1992,6 when new rules came into force
mandating the recording of every new eligible FF&V production directly in the regulation.
The underlying rationale was to improve transparency such that the regulation prohibited
any importation into the US unless entry eligibility was explicitly mentioned in it. However, it
rapidly appeared that this new approach did not work out well with the rising number of
requests for FF&V market access to the US. Over time, the regulation became increasingly
complex and marred by many redundancies. Also, rulemaking revealed out to be particularly
burdensome and the whole process could take 18 months to three years on average.7 Some
export requests took considerably longer than the average. For example a Chinese request
to export fragrant pears to the US took twelve years. According to Karp (2006), Chinese
officials issued a first request in 1993 and the USDA only granted approval in December 2005
after repeated visits by Department of Agriculture scientists and revisions of mandated
measures. In general, various exporters have highlighted the particularly long process behind
6 Federal Register/ Vol. 72, No. 137 / Wednesday, July 18, 2007 / Rules and Regulations
7 Federal Register/Vol. 71, No. 81 / Thursday, April 26, 2006 / Proposed Rules.
10
obtaining market access to the US. Even the EU has signaled to the WTO SPS Committee that
it has experienced very lengthy decision-making procedures when trying to export some
plant products to the US.8
A second efo , k o as Q , was adopted in 2007.9 Its objective was to avoid the
burdensome rulemaking procedure and replace it with a notice-based approach for those
products for which relatively straightforward and established phytosanitary measures are
sufficient for entry into the US.10New market access using notices have been rapidly granted
under the AGOA initiative to African countries in 2008 for the following products: baby corn
and baby carrots from Kenya, asparagus from Senegal, eggplant, okra and pepper from
Ghana. Since then, other countries such as Mexico, Chile, Panama, Malaysia, and Vietnam
have secured new market access following this new process.However, very few new
accesses have been granted since 2012 (see table 1)
2.2 Negotiating Market Access
The US decision to accept imports of a new product from a specific country relies on a risk-
based approach. A request of eligibility for entry of a new FF&V must first be submitted to
APHIS by the expo ti g ou t s NPPO. The , as is e ui ed the WTO SPS Ag ee e t a d
in order to base the final decision on a scientific justification, APHIS PPQ conducts a Pest Risk
Analysis (PRA), which can take two or three years on average (Miller, . A appropriate
le el of p ote tio is defi ed a o di g to this PRA. The o je ti e of the p o edu e is to
8 WTO Committee on Sanitary and Phytosanitary Measures. 2011. Specific Trade Concerns, Issues not
Considered in 2010, G/SPS/GEN/204/Rev.11/Add.2, 1 March 2011. 9 See for instance: http://www.aphis.usda.gov/publications/plant_health/content/printable_version/faq_q56reg.pdf 10 After a Pest Risk Analysis is conducted (see section below).
11
identify if any mitigation measures are necessary, applicable, and efficient enough to
minimize the risk of entry of any quarantine pests into the US.
Many factors contribute to the burdensome nature of the eligibility determination process.
According to Miller (2006), countries do not always provide complete lists of pests, as
required by the early stages of the process. As a result, APHIS agents must undertake their
own research, which is one cause of delay,11 and sometimes of disagreements with the
applicant country.
If any pest meets the criteria determining it as a ua a ti e pest ithi the ea i g of the
relevant US regulations, APHIS PPQ follows up with a Pest Risk Management (PRM) analysis.
The objective of the PRM is to define if any mitigation measures exist, their level of
efficiency and feasibility, as well as any impact if the pest were to be accidentally introduced
into the US. Under this approach, the APHIS PPQ proposes a mitigation plan to the applicant
country. However, if there is no satisfactory solution and/or guarantees that the country will
properly follow the mitigation plan, access to the US market is denied.
Following the WTO SPS Agreement, APHIS should determine the measure providing the
necessary protection with the minimum negative impact on trade. Mitigation measures
proposed by APHIS can in some cases be complex and burdensome. The most common
measure is the requirement of specific treatments. Those treatments have to be applied
before the product is exported, or sometimes at the port of entry if the necessary facilities
e ist. A othe ethod is e ou se to the s ste s app oa h that e dis uss i the next
section. At the end of the PRA process, if an efficient mitigation procedure has been
11 In one description (Ghana’s experience, see below fn 12) it is indeed suggested that APHIS had a backlog of PRA of 2 to 3 years.
12
identified or if the PRA shows that no mitigation measures are necessary, APHIS initiates the
rulemaking process for registration of the proposed FF&V in the regulation.
To conduct a Pest Risk Analysis is costly and requires high-level expertise and resources and
some developing country officials have highlighted the difficulty of effectively and efficiently
implementing a PRA.12
The reliability and accuracy of PRA and mitigation measures is potentially open to
contestation by domestic interests: Cororaton et al. (2011) mention that discussions
between the US and Argentina for citrus focused on these two concerns. Thornsbury et al.
(2007) furthermore state that scientific debate is likely to be more contentious and
sustained in cases where the political stakes are greater.
The main conclusion from this overview is that despite two reforms, the US regime remains
based on a positive list approach which in practice is restrictive in view of the time
consuming and potentially costly nature of the admission process for prospective exporters.
We complete this review in the following section with a discussion of two measures to
facilitate market access: the systems approach and cooperation agreements.
2.3 The Systems Approach
The systems approach, which is intended to facilitate market access particularly following
passage of the SPS Agreement, offers an alternative to traditional risk mitigation measures.
By combining various risk management measures, the systems approach can enable market
access when traditional single treatments would not provide the required level of protection
from quarantine pests. The term was first used to describe the approach used to reduce pest
12 See for instance the experience of Ghana presented at the International Plant Health Risk Analysis Workshop, IPPC, 2005. https://www.ippc.int/core-activities/capacity-development/working-groups/international-plant-health-risk-analysis-workshop24-28-october-2005-niagara-falls-canada

13
risks associated with the importation of avocados from Mexico but the practice in the US
goes back to the 1960s, first applied in 1967 to allow access to Unshu oranges from Japan
and Korea (National Plant Board, 2002).
A o di g to the FAO s I te atio al Sta da d fo Ph tosa ito Measu es 002) a systems
app oa h is the i teg atio of diffe e t pest isk a age e t easu es, at least t o of
which act independently, and which cumulatively achieve the appropriate level of
ph tosa ita p ote tio . I additio to the t aditio al post-harvest measures, processes
incorporated into the systems approach include insect trapping and control, growing and
packing requirements, and geographical limitations. The concept behind the systems
approach is that several methods while individually not mitigating the risk of introduction of
a pest to a sufficiently low level of probability13 will do so additively. A systems approach can
also be used to achieve maximum levels of risk reduction (i.e. a second best to an ideal of
100% elimination that is not achievable by known or acceptable means save for outright
prohibition) for phytosanitory risks that are judged particularly serious, such as certain plant
pathogens (National Plant Board, 2002).
A e a ple of a s ste s app oa h is the o e applied to Me i o s a o ados (CFR 319.56-30):
they must meet a nine requirement list that includes trapping, orchard certification, limited
production area (Michoacan), trace-back labeling, pre-harvest orchard surveys for all pests,
orchard sanitation, post-harvest safeguards, fruit cutting and inspection at the
packinghouse, port-of-arrival inspection, and preclearance activities.14 The basic motivation
13 The standard in the US for pests is the so-called Probit-9 security, requiring that 99.9968% of pests to be killed by the treatment. 14 More generally see National Plant Board (2002) for a thorough description of the systems approach. See also Stewart and Schenewerk (2004) for a discussion of the systems approach for citrus from Argentina.
14
behind the implementation of the systems approach is to combine mitigation measures and
risk-based controls.
According to Stewart and Schenewerk (2004), the use of the systems approach is not
popular with US domestic industry, which disputes its scientific relevance and capacity to
p ote t agai st fo eig pest i asio . The fu the o te d that APHIS s use of a s ste s
approach does not allow an opportunity for domestic producers to participate in the
evaluation of the planned measures (including whether they are scientifically based), and
that there is no system of compensation to domestic producers in case of faulty risk
assessment.
2.4 Cooperation Agreements and the Commodity Pre-Clearance Program (CPP)
Preclearance consists of ensuring that exports meet the criteria for admission to the US
market before shipment. Therefore, screening and treatment of FF&V exports are
performed by APHIS agents in the exporting country. Like the systems approach,
preclearance of commodities in the country of origin has been in use, albeit on a limited
basis, for some time. Preclearance is both seen as a means to mitigate pest risks in countries
that lack the technical capacity to have eradication programs (National Plant Board, 2002)
but also to speed up the export process, as problems can be tackled at the source.
Before any preclearance program can be implemented, APHIS and the exporter (the foreign
go e e t o p odu e ust ag ee to a Coope ati e Se i e Ag ee e t , e e ed e e
year, establishing the terms and conditions that must be met prior to the implementation of
a CPP. The preclearance program operates on the basis of full recovery of APHIS s osts. The
country of origin or the private export group is required to provide funds in advance
(annually) under a trust fund agreement (USDA, 2002).

15
Like the systems approach, preclearance programs are presented as a facilitating measure,
and indeed they can be voluntary. For instance, Jamaica initiated a preclearance program in
1984. From 1984-1995, the program was co-sponsored by the Ministry of Agriculture and
Fisheries in conjunction with the United States Agency for International Development
(USAID . The , the Ja ai a E po te s Asso iatio JEA took o e fo the pe iod 1995-2001,
and since April 2001, the Ministry has independently funded the program. In 2011, Jamaica
had a list of 52 horticultural commodities with a preclearance program. In 2004 APHIS had
voluntary preclearance programs in place in 16 countries.15 However, preclearance programs
and consequently trust fund agreements are also mandated for certain exports.
Implementing a preclearance program is a complex procedure, which is closely monitored by
APHIS from the official exporting country proposal stage onwards (USDA, 2002).
Preclearance includes notably the construction of a dedicated treatment facility that must
operate according to APHIS specifications, and requirements regarding the location and
accessibility of the facility. However, the mere existence of costs is not sufficient to conclude
that this approach contravenes the WTO SPS Agreement, according to which such measures
should be the least trade restrictive measure assuring the required level of plant safety.
If preclearance can be described as a way to create and facilitate trade, the corollary is that
ou t ies apa it to e te a d i ple e t a oope atio ag ee e t ith APHIS fo
preclearance becomes a determinant of market access to the US. Capacity is a crucial issue,
however, as many exporters of agricultural products are developing countries, which suffer
from budget constraints and sometimes a lack of support by the government to the
15 USDA APHIS (2004). No more up to date voluntary list is available. The list can be accessed at: http://www.flegenheimer.com/documents/aphis.pdf (last accessed 4/26/2014).

16
development of agricultural exports. Both factors can be an impediment to the
implementation of preclearance measures.1617
In conclusion, measures such as the systems approach and cooperation agreements/pre-
clearance, while offering in limited instances alternative options to exporters to access the
US market, do not appear to really ease to a significant extent the burden on countries
seeking this access. SPS facilitation measures still impose significant implementation delays,
added costs and constraints on exporters, and thus it looks doubtful that such measures are
designed to truly facilitate trade across the board. In the absence of exact information on
the use of the systems approach and preclearance, it is difficult to assess the added market
access provided by these measures and come to a clear conclusion. However, in the light of
the evidence presented in the remainder of this paper, we see that additional access to the
US market to new suppliers is actually limited. Facilitation measures seem driven by an
extremely cautious opening of the US market in response to increased consumer demand for
FF&V variety rather than unmitigated liberalization.
These measures also reveal two important traits of the promoters of the actual system: the
opposition by domestic producers to measures that offer flexibility; and a conception of
flexibility by the agencies that equates to indeed offering less rigid options but at greater
compliance cost for foreign exporters.
16 In the Philippines, an article from the press assesses the running cost (i.e. not including establishment of the treatment facility) of inspection for Mangoes, including the presence of three APHIS inspectors, is quoted to amount to over $142,000 for a period of 5 months in 2007: http://www.gmanews.tv/story/32476/US-importers-look-to-less-costly-RP-mangoes 17 In Haiti In the early 1990s, Haitian mangoes exporters formed a national association of mango
producers. One of the main functions of the association is to coordinate and raise funds for the hot water bath treatment required by APHIS.
17
3 Impacts of the US Market Access Regime
This section presents empirical evidence on the impacts of the US market access regime for
FF&V, as described in the previous section. It first presents a new database on market
access, which forms the basis of the analysis. It then examines US market access and global
production, and finally puts results in comparative perspective, by looking at market access
in other main global players in agricultural trade. The analysis is based on descriptive
statistics, not a full econometric analysis, and is therefore subject to the usual caveat
regarding intervening causes.
3.1 A Database on US Market Access for FF&V between 1994 and 2011
Beyond case-study evidence (including some persuasive contributions noted earlier), there is
little systematic evidence available on the overall scope of US SPS measures and how they
determine market access conditions. To remedy part of this information gap, we construct a
database of access to the US market for the period 1994-2011 for FF&V. This database lists
which countries are actually exporting to the US and which are authorized to export to the
US market. As mentioned earlier, the US uses a positive list approach for phytosanitary
protection when granting market access to its territory: by law, foreign FF&V are not allowed
to enter the US market unless they have been expressly authorized.
Identifying which products have been cleared to enter the US is actually a surprisingly
complex task. As noted earlier, all new market access since 1992 requires an individual
regulation or a notice-based process. As a result, all new market access appears in the
Federal Register as well as in the Code of Federal Regulation. However, products that were
granted permits to export to the US before 1992 were not always listed in the CFR. APHIS,
the agency administering access to the US market for FF&V, tried to amend the regulation so

18
as to add the issi g p odu ts. Ho e e , it still efe s to the list as pa tial i the last
reform, preventing us from directly using this list for the construction of a market access
panel database. We address this deficiency by using information available in the Fresh Fruits
and Vegetables Import Manual FAVIR Database, which allows searching for currently
authorized fruits and vegetables by commodity or country, and provides information on
general requirements for their importation.18
We use Joua jea s a k a d-looking method using the information available in the
FAVIR database in 2011 as our baseline. We can then go back in time and remove products
according to the date on which they became eligible according to Federal Registers. The U.S
Government Printing Office (GPO) makes all Federal Registers and Codes of Federal
Regulation since 1994 accessible and searchable on-line.19 We were therefore able to gather
all APHIS-related notices: availability of a PRA, proposed and final rules for the importation
of fruits and vegetables (grouped or standalone), and other amendments relative to
products already eligible (changes in pest free areas, treatment, or areas of accessibility in
the US). We also include in the database products that had once been granted access to the
US market but which were subsequently removed. Those products do not appear in the
2011 FAVIR database. Lemons and other citrus from Argentina are an example. However,
such situations are unusual.
Another issue is that neither the FAVIR database nor the Federal Register notices mention
a p odu t odes. Both i stead efe to the p odu t s s ie tifi defi itio . Thus, i o de to
18 http://www.aphis.usda.gov/favir/info.shtml. Last accessed: June 22nd 2011. 19 http://www.gpo.gov/fdsys/browse/collectionCfr.action?collectionCode=CFR
19
compare this database with UN-COMTRADE trade flows, we manually recoded all products
according the HS 6-digit scheme.
We limit our analysis to US continental market access. Many products that are not allowed
into the continental US are actually allowed into US territories, and vice versa. Access to US
territories represents very small trade flows but a non-negligible amount of commodity-
country market access, and because of their geographical situation, they represent very
different environments. We therefore exclude US territories from this analysis.
The result of this data collection effort is a panel database of US market access for FF&V. It
covers 57 products at the HS 6-digit level for 194 countries, for the period 1994-2011, for a
total of 69,225 observations.
3.2 US Market Access and Global Production
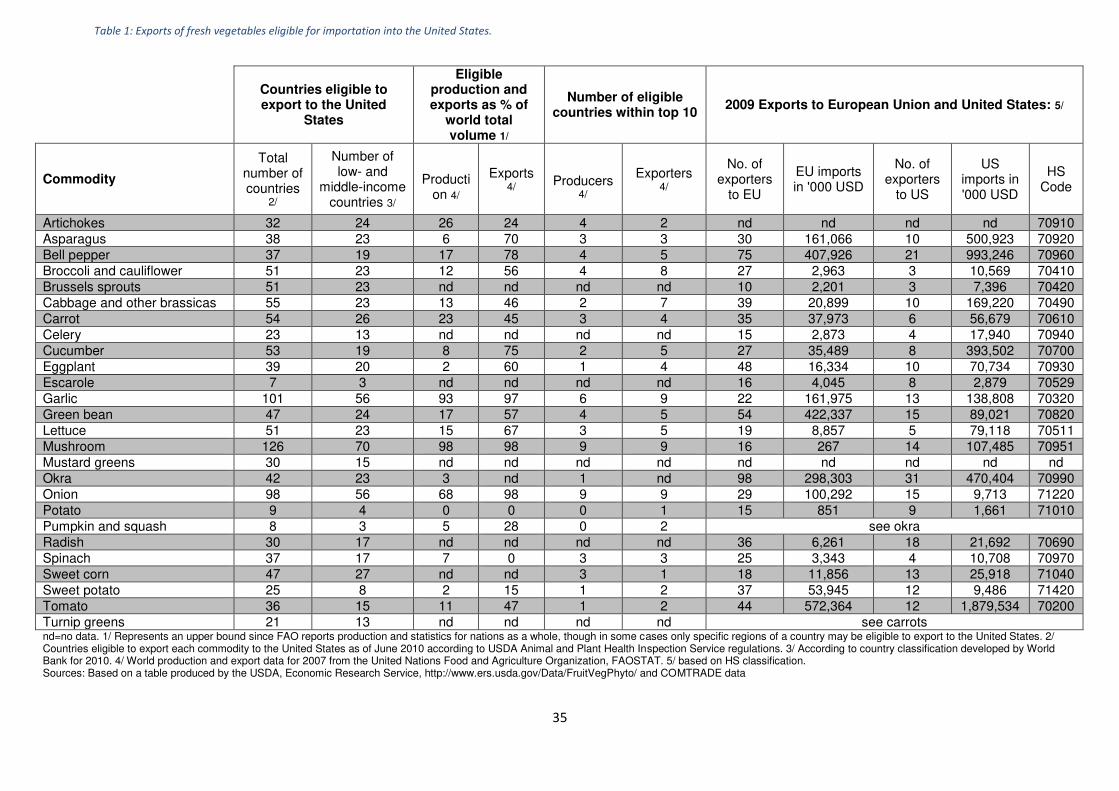
We first proceed to counting eligibility to enter the US market in order to assess how open
or closed the US market for FF&V is. Using data supplied by the USDA Economic Research
Service, we list for key categories of FF&V the number of exporters eligible to enter the US
market, and compare this with the actual number of exporters entering the US for the year
2009. We also offer a comparison with the number of exporters to Europe (Tables 1 and 2).
First, the number of countries eligible to enter the US market is often only a fraction of the
o ld s p odu tio a d e po t suppl , although i a fe ases ga li , ush oo s, o io s,
g apes, a d st a e ies ea l all of the o ld s e po te s ha e a ess to the US. O the
other hand, there are several instances where less tha a thi d of the o ld s e po te s i
volume are allowed entry into the US (artichokes, pumpkins and squash, sweet potatoes,
ap i ots, he ies, dates, figs, a d pea hes . O l % of the o ld s e po te s of figs a d
dates can ship to the US.
20
Tables 1 and 2 also take product level COMTRADE data and match it to market access
eligibility from our database.20 They show that the number of active exporters is generally
lower than the number of eligible countries. This is to be expected to some extent because
all eligible countries may not be able to export to the US in a given year, depending on many
factors such as prices, production, and demand in other markets. However, in numerous
instances the number of actual exporters to the US is much lower than the theoretical
number of potential exporters: for instance only three countries export cauliflower to the
US, four export spinach, four export strawberries, and four export avocados. This is despite
the fact that the US market is theoretically open to a large po tio of the o ld s e po ts fo
these products. For avocado, one of the reasons is that, although a fairly large number of
exporters seems to have access to the US market, this access is restricted to specific varieties
of avocado and very few countries can export the most consumed Haas variety. Moreover
exports take place under stringent conditions and complex systems approaches, as
previously mentioned for Mexico. It is important to note that this table makes the
distinction between access to US territories and access to the continental US market.
We can infer that two levels of potential market access restrictions are at play from the
above information. First, market access eligibility is available only to a small portion of the
o ld s e po te s. Se ond, actual market access is not even fulfilled by all those exporters
that are eligible to export in the first place, suggesting possible further difficulties in
complying with US requirements once market access eligibility is granted. Of course, the gap
20 We use HS6 data which is not perfectly matched to FAOSTAT data. Note for instance that some HS6 codes include dried fruits, which explains why we count respectively 14 and 16 countries exporting to the US when only 4 and 2 are allowed for the fresh fruit.

21
between actual and potential exporters could be explained by other factors, such as trade
costs.
3.3 US FF&V Market Access in Comparative Perspective
If the restrictiveness of the US FF&V market access system in fact inhibits countries from
exporting, we would expect to see fewer exporters to the US than to comparator markets
with less restrictive systems, such as the EU with its negative list approach.
Using UN-COMTRADE trade flows at the HS 6 digit level, we compare the evolution of the
number of active suppliers (measured at the country-level) of FF&V in the world, to the
number of active foreign exporters to the US, a simple measure of whether access to the US
market has followed similar patterns to that of the rest of the world over recent years.
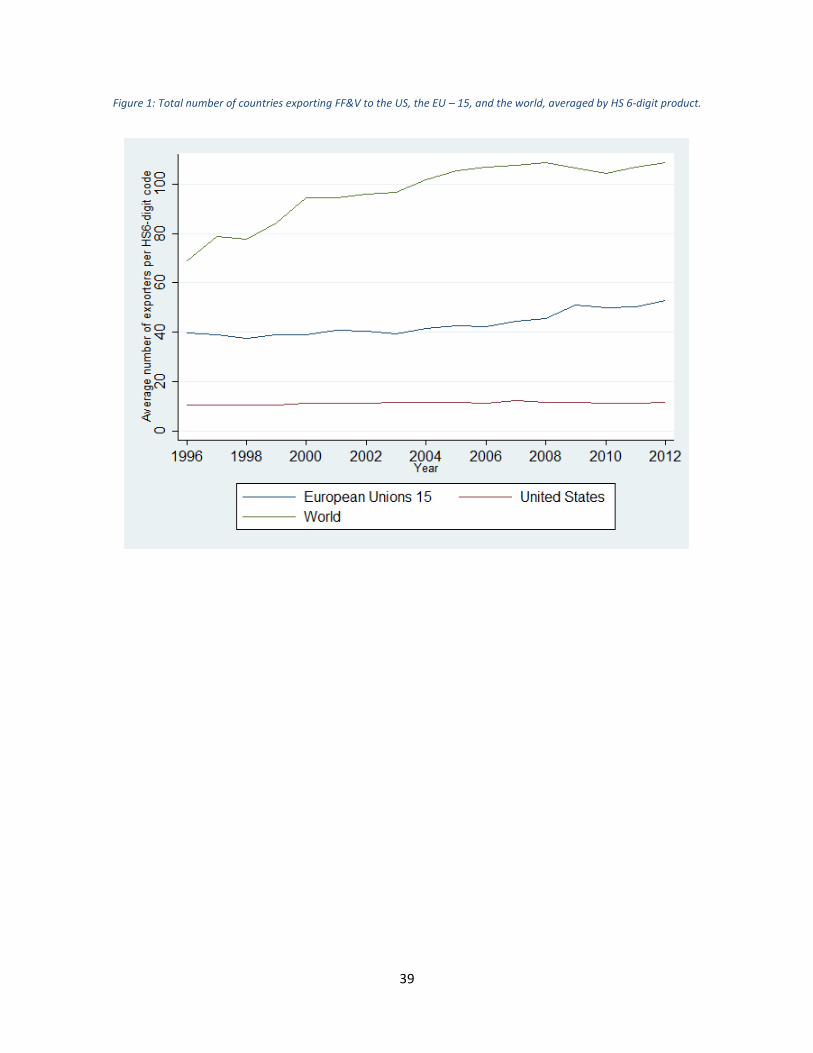
Figure 1 presents a simple average of the total number of suppliers per product across the
products that are covered by the regulation governing access eligibility and listed in our
market access database. Overall market access has increased significantly over the period,
but there is a wide discrepancy of evolution between US market access and the rest of the
world: while the average number of suppliers to the world has nearly doubled over the
period, the average number of FF&V suppliers to the US has on the other hand risen very
slowly, even stagnating in the second half of the sample period. This comes somewhat as a
surprise, since the US reformed its admissibility system twice during this timeframe, and
imports of FF&V to the country increased robustly over the period (see e.g. Johnson, 2010).
There are two possible explanations for this observation. Either the US market was already
more open to FF&V imports than other countries to begin with, or on the contrary, access to
the US market for FF&V remains relatively more restricted or less accessible to new
exporters. There are reasons to doubt the first explanation by simply looking at the number
22
of exporters to the US, which at about 10 on average seems low by any standard, and is far
below the more than 110 countries on average exporting any FF&V across the world, which
we take as approximating the maximum theoretical number of foreign suppliers to the US.
Although these findings are indicative of significant market access difficulties in the US, the
possibility remains that this issue is not unique to that market, and that a similar situation
prevails in the other main agricultural importers. Strict standards and regulations are after all
common to most developed country markets, and the exactitude of US requirements is not
the only source of complaints from prospective exporters.
A further comparison with the number of actual exporters to the EU 15 reveals that save for
a handful of exceptions, exports to the EU 15 attract a far larger number of exporters than
do exports to the US (Figure 1 and Tables 1&2). The difference is sometimes enormous such
as carrot exports, where 35 countries supply the EU 1521 but only 6 do so to the US. The
comparison with the EU is especially interesting as the EU 15 market is relatively similar in
size, income, and presumably consumer and producer preferences regarding the appropriate
(high) level of health and plant standards. However, there are also important differences
that could act as intervening causes. Areas in which the US and EU 15 differ markedly include
domestic production of fruits and vegetables, geographical access, historical ties with other
producing countries, and of course SPS systems. It would seem reasonable to assume that
the US having more areas of production of warm climate fruits and vegetables would have
more domestic competition for imports. Although this is indeed a relevant factor, we see
that even when US imports are equal to or significantly larger than EU ones in value, the
number of suppliers is smaller: tomatoes, cucumbers, cranberries, and blueberries offer
21 Excluding intra-EU trade.
23
relatively striking examples (Tables 1 & 2). Even though it is true that the US market is
further away from potential suppliers than the EU, geographical distance seems unlikely to
be the sole relevant factor behind these significant differences in market penetration.
Furthermore, since we are also looking at a trend over a time period of nearly two decades
in figure 1, we have here a simple way to control for those factors not related to the SPS-
regime that would affect the levels of access to each respective market (such as geographic
distance, production conditions, common language and historical trading relations) that do
not vary significantly over time.22 Thus prima facie evidence suggests strongly that the
difference in SPS systems, and in particular between the negative list approach favored by
Europe and the positive one used by the US, is probably a key factor.
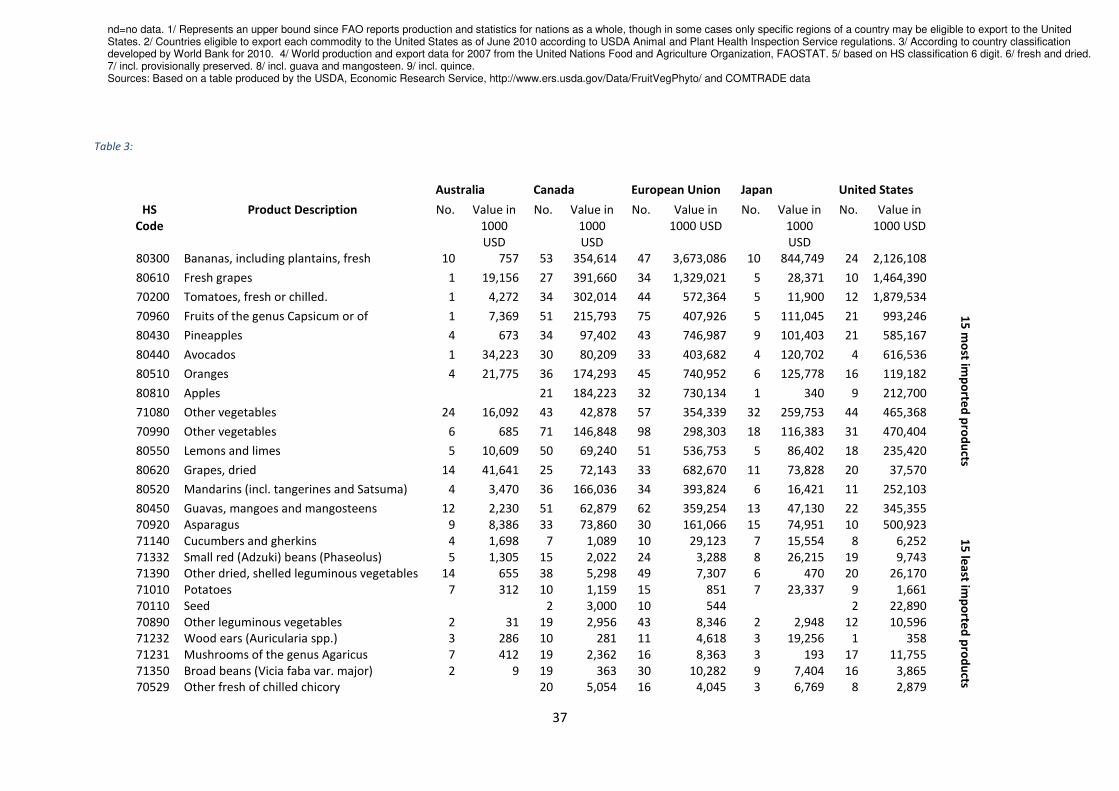
To extend the comparative exercise, we next look at the number of suppliers to the US
market and to three other OECD countries: Canada, Australia, and Japan (Table 4. Two of
these countries have much smaller market sizes compared to the US and Europe; Japan has
an intermediate market size. We also know that two of these countries, Japan and Australia,
have the reputation of being restrictive where agricultural products are concerned, at least
in the case of SPS measures for Australia. The table seems to confirm this view: the number
of exporters to Australia and Japan is often significantly lower and nearly systematically
lower than comparable numbers for the US. Although Australia is a smaller market – and
also geographically distant – and so less likely to attract a large number of exporters, Japan is
22 While production conditions do indeed vary over time, some fundamental endowments such as historical
climate, land characteristics remain stable. Climate conditions have probably changed over the period but likely
in many different ways for the various products we examine so that we can consider it not affecting the
difference between the two trends.
24
a large and rich market, so more exporters are expected. This may be indicative that market
access to the US, although complex, is not the most restrictive out there.
More telling, however, is the comparison with Canada, which is closely related to the US in
terms of preferences and geographical access. Despite the many similarities between the
two markets, the number of exporters to Canada is much higher than to the US,
ot ithsta di g the fo e s s alle a ket size. A gua l , Ca adia ag i ultu al
production is unlikely to compete with imports in some of these sectors. Nonetheless, the
number of exporters to Canada is often comparable to the number serving the EU market,
which may be indicative of an SPS regime that achieves similar objectives.
Finally, we seek to investigate how newly granted market access shapes the distribution of
i po ts a oss o igi s. I o de to do so e easu e ho e e t a ts defi ed he e as
country of origin; entrants are actually firms that are exporting to the US) fare in terms of
the share of total exports to the US. For this we calculate the concentration of shares of total
exports using the Hirschman Herfindahl Index (HHI) a widely accepted and simple measure
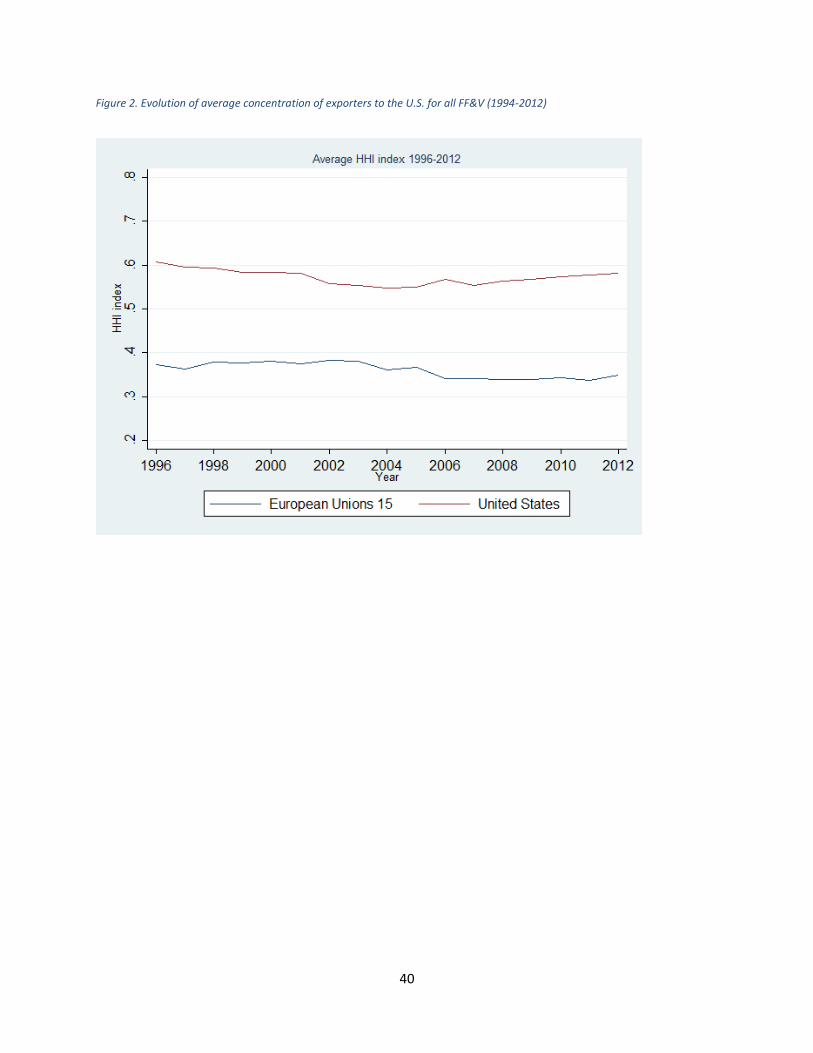
of concentration: the lower the HHI index the lower the concentration.23 The evolution of
the average HHI across all FF&V for exporters to the US and the EU is presented in figure 2.
The figure is interesting in several respects. We first see a decrease of the average HHI index
in the US. This is not really a surprise since we know that market access has been granted to
more countries over the period and more exporters would mean that exports to the US are
distributed over a larger number and thus likely to translate into less concentration of
import market shares. We see also that the decrease in the HHI (lesser concentration of
exports) is more important for the US than for Europe. However, the US was starting from a
23 We calculate = ∑ 𝑋𝑖 𝑋𝑤⁄ 2where 𝑋𝑖 and 𝑋𝑤are country j s export and total exports to the US
respectively.
25
much lower base and still its HHI index shows only a modest improvement, from about 0.65
to 0.58 (in 2002, the HHI actually increases again).The gap compared to Europe is still very
significant, with Europe having an average HHI of 0.29 in the lowest year. To give an order of
comparison, if two exporters have equal market share of 50% of exports, the HHI would be
0.5. A HHI of 0.6 means that one of the exporters has at least a market share of 72%, which
in the absolute is very high. The conclusion is that since the index for the US does not fall
that much, and remains at a very high level, exporters with already a large share of exports
to the US do not lose that much market share to new entrants. This suggests niche entry and
may also suggest that the SPS system is so strict that it allows only marginal varieties. For
instance, Haiti a leading producer of mangoes has only one variety (called Madame
Francisque) accepted into the US, among many varieties produced there.
4 Does Lobbying Play a Role in Determining FF&V Market
Access?
The previous section provided suggestive evidence that the US market access regime for
FF&V is relatively restrictive, both in terms of the proportion of global production that is
authorized to enter the country, and in relation to comparator markets. In theory at least,
the US system is set up for public good reasons: the prevention of damage from quarantine
pests. However, the complexity of the eligibility system means that it is possible for political
economy considerations to play a role at various stages in the process, as demonstrated by
case studies such as Hass avocadoes and Argentinean citrus. Using the FF&V market access
database described in the previous section and data on political economy variables, this
section presents some suggestive evidence to the effect that lobbying is indeed a factor in

26
the determination of the grant of market access. The US FF&V market access system appears
to be about protectionism, as well as protection.
A first piece of evidence comes from data on political contributions as an indicator of
lobbying behavior. Grossman and Helpman (1984) show that protection rates should be
higher in organized industries—i.e., those with lobbies—than in unorganized ones. Empirical
tests of the Grossman and Helpman (1984) model such as Goldberg and Maggi (1999), and
Gawande and Hoekman (2006) in the agricultural context, use sectoral political contributions
as a proxy for the existence of a lobby: sectors with positive contributions are considered to
be organized, and those with zero contributions are considered to be unorganized. We
adopt that approach here, using data on political contributions from Political Action
Committees (PAC) database made available by the U.S. Federal Action Commission (FEC).
The database lists each committee registered with the Federal Election Commission and
their spending. Data from 2007 were downloaded from the FEC website. Among
committees specifically relating to agriculture and in particular to the FF&V sector, we can
identify two types of organizations. The first relates to farm bureaus, cooperatives or lobby
groups on FF&V at large. We do not have the necessary information to know whether those
lobbies were directing their action towards any specific product at the HS 6-digit scale.
Therefore, information on those PACs can only be used in empirical analysis at more
aggregated levels. The second type of lobby is much more specific and relates to a restricted
set of HS 6-digit products or even sometimes to one single product line. Only this set of PACs
is considered in this analysis. The data are mapped to the HS 6 digit product lines in the
market access database.
27
Given that the US adopts a positive list approach to FF&V market access, it would be
evidence of political economy effects at play if the number of approved countries were to be
lower in organized sectors than in unorganized ones. Indeed, that is exactly what we find in
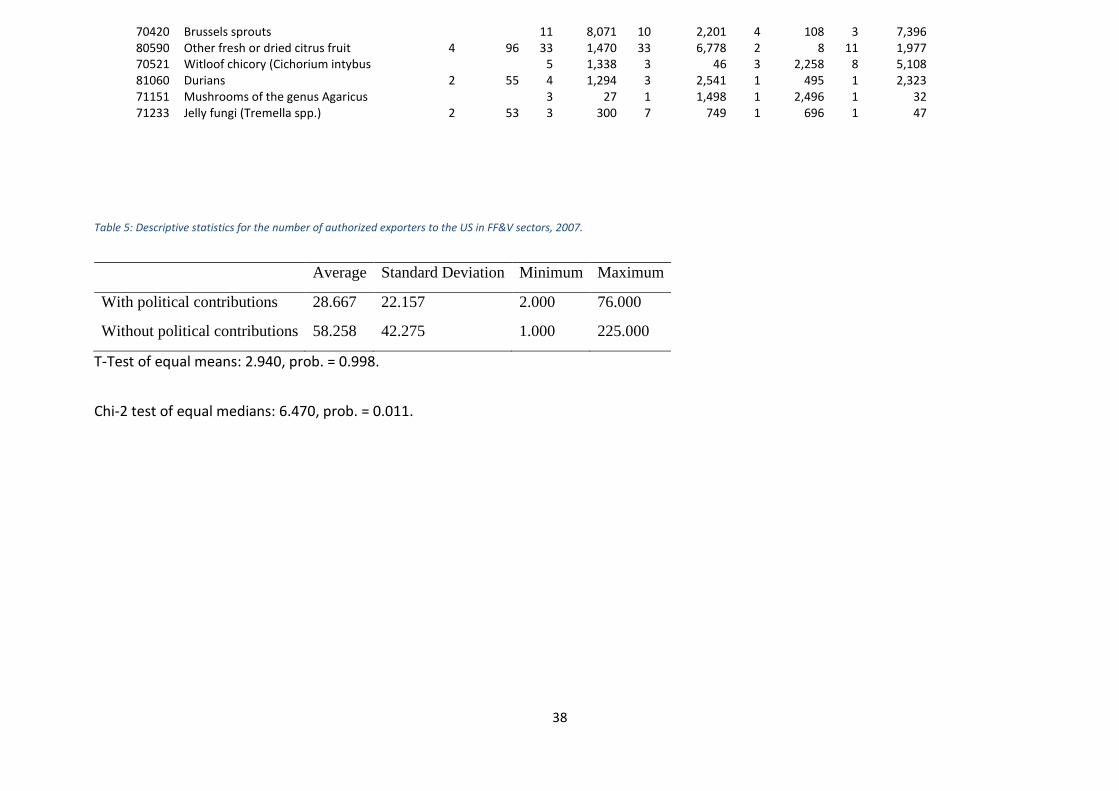
the data. Table 5 shows descriptive statistics for organized and unorganized sectors in 2007.
We find that, on average, only about half as many countries are approved exporters to the
US in organized sectors compared with unorganized sectors. The difference between the
two means is statistically significant at the 1% level, based on a t-test. To show that the
difference in means is not solely a function of skewness in the distributions, we also
compare medians: for organized sectors, the median number of authorized exporters is 22,
whereas for unorganized sectors it is 46. The difference of medians is again statistically
significant at the 5% level. The range for organized sectors is also much narrower, with a
maximum of only 76 countries compared with 225 for unorganized sectors. All of these
descriptive statistics support the view that political economy plays a role in the
determination of market access for FF&V in the US.
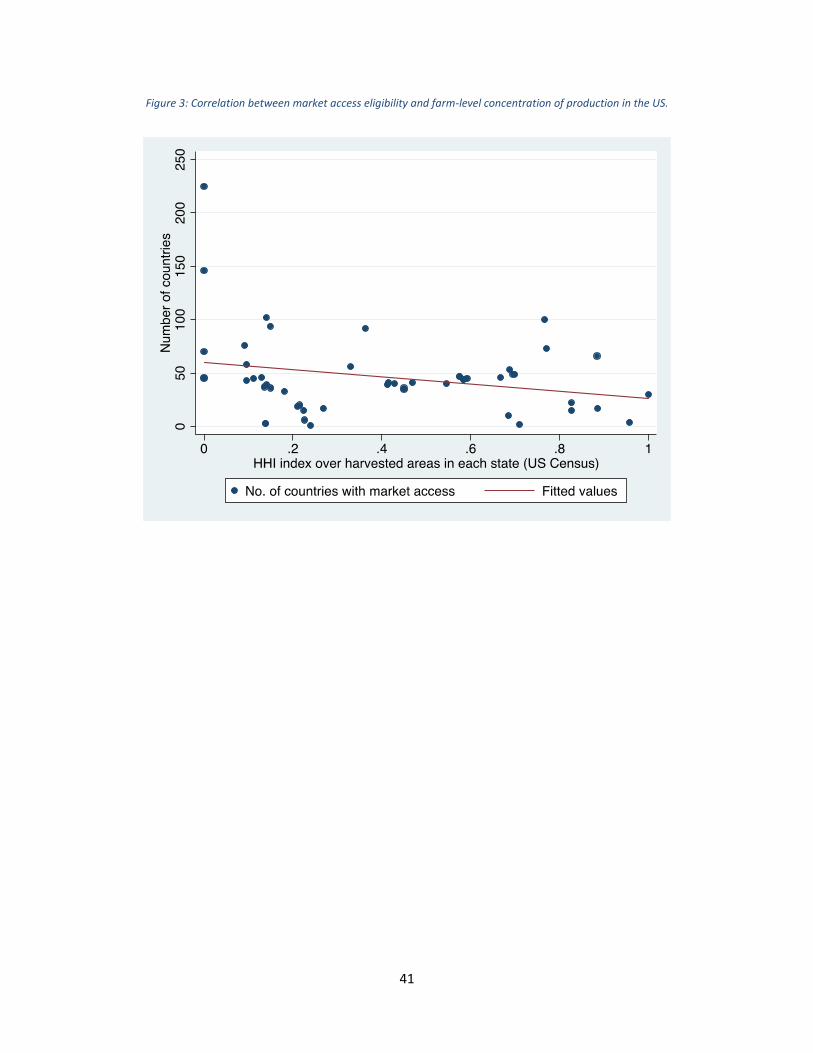
The political economy literature outside the Grossman and Helpman (1984) framework
identifies other variables that can be indicators of lobbying activity. One possibility is the
concentration of production across firms (farms), on the theory that a higher degree of
concentration is more likely to give birth to lobbying activity because it is easier for a small
number of large operators to overcome the transaction costs involved in establishing a
lobby. Based on this approach, we would expect to see a negative correlation between farm-
level production concentration (sourced from the US Census Bureau)24 and the number of
countries with market access to the US in FF&V sectors. Figure 3 shows that this is exactly
24 https://www.census.gov/
28
what the data suggest: the line of best fit is downward sloping, and the negative correlation
is statistically significant at the 10% level.
5 Conclusion and Policy Implications
This paper has shown that US phytosanitary measures that are primarily designed to protect
plants from pests represent a significant market access barrier in the FF&V sector,
particularly for developing countries where the human, technical, and financial resources
needed for compliance may be lacking. US market access is restricted in terms of the
number of countries authorized to export FF&V: the evolution over time of new entry into
the US market has been slow, and far fewer countries are allowed to export FF&V to the US
than to comparable third markets, such as the EU, or even Canada. Although traditional
trade policies and geographical factors also play some role in the number of exporters
actively engaged with different markets, the preliminary evidence suggests that
ph tosa ita easu es also pla a i po ta t ole. I pa ti ula , the positi e list
approach applied by the US—which bans all FF&V imports except from explicitly authorized
countries—amounts to a costly and often prohibitive non-tariff barrier for many developing
country exporters.
O e i po ta t a eat to ou esults is that e do ot o se e the hilli g effe t of the US
regime, namely the way in which it discourages potential exporters from even applying for
market access. Similarly, we do not observe applications that were made but which failed.
We only observe the final outcome, which is the number of countries that have market
access as of a particular date. With those constraints in mind, the data nonetheless show a
significant market access problem in the sectors covered by US phytosanitary measures.
29
We have also shown that one potential explanation for the restrictiveness of the US regime
in practice is the considerable space it leaves for the intrusion of domestic political economy
considerations into what should be a process driven primarily by science. There is
considerable anecdotal evidence on this point already, such as the role of US producers in
restricting market access for Mexican avocadoes and Argentinean citrus. This paper has
provided suggestive, but systematic, evidence that market access tends to be more
restricted in sectors that make political contributions as opposed to those that do not. It has
also demonstrated a negative correlation between domestic production concentration at the
farm-level, and the number of foreign producing countries granted access by US authorities.
Both pieces of evidence tend to suggest that organized sectors may be using the
phytosanitary regime as a way of insulating themselves from foreign competition—an
outcome that is quite contrary to the spirit of the SPS Agreement.
Although the policy debate on SPS measures has primarily focused on those instruments
designed to protect human health, the present paper suggests that the discussion needs to
be broadened to include phytosanitary measures as well. Indeed, developing country
exporters often indicate that plant protection issues represent more of a barrier to their
exports than food safety concerns. Future research could usefully explore this issue, focusing
in particular on the strategies successful developing country exporters have adopted to deal
with phytosanitary concerns in developed country markets, including the US.
30
References
Baldwin, Richard E. (1988). Hysteresis in Import Prices: The Beachhead Effect, The American
Economic Review, Vol. 78, No. 4, September, pp. 773-785.
Carman, H.F., Li, L. & Sexton, R.J. (2006). Impact of Sequential and Partial Trade
Liberalization for Mexican Hass Avocado Imports to the United States during 1998–2004.
Paper presented at AAEA Annual Meeting, Long Beach CA, 23–26 July.
Cororaton C.B., Orden, D. & Peterson, E. (2011). Economic Impact of Potential U.S
Regulatory Decisions Concerning Imports of Argentine Lemons. GII Working Paper No.2011-
1, April 2011.
European Commission. (2006). Guidance Document on Certain Key Questions Related to
Import Requirements and the New Rules on Food Hygiene and on Official Food Controls.
Health & Consumer Protection Directorate-General.
Food and Agriculture Organisation (FAO), International Standards for Phytosanitary
measures (ISPM). (2002). The use of Integrated Measures in a Systems Approach for Pest
Risk Management. No. 14
Federal Register. (2006). Proposed Rules. 71(81), Thursday, April 26.
Federal Register. (2007). Rules a d Regulatio s. Vol. , No. , Wed esda , Jul .
Huang S. & Huang K. (2007). Increased U.S. Imports of Fresh Fruit and Vegetables. Economic
Research Service, USDA, FTS-328-01.
Henson, S. & Jaffee, S. (2004). Standards and Agro-Food Exports from Developing Countries:
Rebalancing the Debate. Policy Research Working Paper No. 3348, World Bank.

31
IPPC. (2005). International Plant Health Risk Analysis Workshop.
Johnson, R. (2010). The U.S. Trade Situation for Fruit and Vegetable Products. Congressional
Research Service 7-5700.
Jouanjean, M.A. (2012). Market Access and Food Standards: Insights from the
Implementation of US Sanitary and Phytosanitary Regulations. Ph.D. Dissertation, Sciences
Po Paris.
Jouanjean, M.A., Maur, J.C. & Shepherd, B. (2012). Reputation Matters: Spillover Effects in
the Enforcement of US SPS Measures. Policy Research Working Paper No. 5935, World Bank.
Karov, Roberts, Grant & Peterson (2009). A Preliminary Empirical Assessment of the Effects
of Phytosanitary Regulations on US Fresh Fruit and Vegetable Imports.
http://purl.umn.edu/49345.
Ka p D. . F o Silk Road to Supe a ket, Chi a s F ag a t Pea s. The New York Times,
November 15.
Kee, H.L., Nicita, A. & Olarreaga, M. (2009). Estimating Trade Restrictiveness Indices.
Economic Journal, 119(534), 172-199.
Lamb, R.L. (2006). Rent Seeking in US Mexican Avocado Trade. Cato Journal, 26(1), 159–177.
Maertens, M. & Swinnen, J.F.M. (2009). Trade, Standards, and Poverty: Evidence from
Senegal. World Development, 37(1), 161-178.
McLean, M. (2004). The Impact of International Phytosanitary Requirements on the Lemon
Industry in Tucumán. Working Paper.
32
Miller, A.J. (2006). Opportunities and Requirements to Export Thai Food and Agricultural
Products to the US. Working Paper.
National Plant Board (2002). Preventing the Introduction of Plant Pathogens in the United
States: The Role a d Appli atio of the S ste s App oa h . A scientific review coordinated
by The National Plant Board for The United States Department of Agriculture Animal and
Plant Health Inspection Service Plant Protection and Quarantine, February.
Orden D., Narrod, C. & Glauber, J.W. (2001). Least Trade-Restrictive SPS Policies: An Analytic
Framework is There but Questions Remain. In Anderson, K., McRae, C. & Wilson, D. eds. The
Economics of Quarantine and the SPS Agreement. Adelaide: Centre for International
Economic Studies.
Peterson, E.B. & Orden, D. (2008a). Avocado Pests and Avocado Trade. American Journal of
Agricultural Economics, 90(2), 321-335.
Peterson, E. B. & Orden, D. (2008b). Risk and Economic Assessments for US Imports of
Mexican Avocados. Journal of International Agricultural Trade and Development, 4(1), 17-
34.
Roberts, D. & Orden, D. (1997). Determinants of Technical Barriers to Trade: The Case of US
Phytosanitary Restrictions on Mexican Avocados, 1972–1995. In Orden, D. & Roberts, D. eds.
Understanding Technical Barriers to Agricultural Trade. St. Paul, MN: University of
Minnesota, Department of Applied Economics, International Agricultural Trade Research
Consortium.
33
Romano, E. (1998). Two Essays on Sanitary and Phytosanitary Barriers Affecting Agricultural
Trade Between Mexico and the United States. Ph.D. Dissertation, Virginia Polytechnic
Institute and State University.
Salop, S. C. & S heff a , D. . Raisi g Ri al s Costs. American Economic Review, 73(2).
Stewart, T.P., & Schenewerk, C.B. (2004). The Conflict between Facilitating International
Trade and Protecting US Agriculture from Invasive Species: APHIS, the US Plant Protection
Laws, and the Argentine Citrus Dispute. The Florida State University Journal of Transnational
Law & Policy, 13(2), 305-346.
Thornsbury, S., and Romano, E. (2007). Economic Evaluation of SPS Regulations: Where Can
Progress be Made?. Department of Agricultural Economics Staff Paper 2007-07, Michigan
State University.
USDA. 2002. Commodity Preclearance Program Management Guidelines.
USDA APHIS. 2004. Aphis Preclearance Programs. http://www.aphis.usda.gov.
WTO Committee on Sanitary and Phytosanitary Measures. 2011. Specific Trade Concerns,
Issues not Considered in 2010, G/SPS/GEN/204/Rev.11/Add.2, 1 March 2011.

34
Table 1: New market access according to the new notice-based approach
Year Country Product Notice of decision to issue permits
2007
Ghana
Eggplant 72 FR 59239 - Notice of Decision To Issue Permits for the Importation of Eggplant and Okra From Ghana
Federal Register. Notices. Notice. Friday, October 19, 2007.
Okra 72 FR 59239 - Notice of Decision To Issue Permits for the Importation of Eggplant and Okra From Ghana
Kenya
Baby Corn 72 FR 59239 - Notice of Decision To Issue Permits for the Importation of Husked, Silk-Free Baby Corn From Kenya
Baby Carrots 72 FR 59240 - Notice of Decision To Issue Permits for the Importation of Peeled Baby Carrots From Kenya
South Africa
Blackcurrants 72 FR 59241 - Notice of Decision To Issue Permits for the Importation of Ribes Species Fruits From South Africa
2008
Panama Rocket 73 FR 839 - Notice of Decision To Issue Permits for the Importation of Arugula Leaves With Stems From Panama
Federal Register. Notices. Notice. Friday, January 4, 2008.
Autralia Cherries 73 FR 5495 - Notice of Decision to Issue Permits for the Importation of Sweet Cherries From Australia
Federal Register. Notices. Notice. Wednesday, January 30, 2008.
South Korea
Dropwoth leaves
73 FR 14956 - Notice of Decision To Issue Permits for the Importation of Dropwort Leaves With Stems from South Korea
Federal Register. Notices. Notice. Thursday, March 20, 2008.
Vietnam Pitaya 73 FR 44216 - Notice of Decision To Issue Permits for the Importation of Dragon Fruit From Vietnam
Federal Register. Notices. Notice. Wednesday, July 30, 2008.
Mexico Guavas 73 FR 60673 - Notice of Decision To Issue Permits for the Importation of Guavas From Mexico
Federal Register. Notices. Notice. Tuesday, October 14, 2008.
Senegal Asparagus 73 FR 77594 - Notice of Decision to Issue Permits for the Importation of Fresh White Asparagus From Senegal
Federal Register. Notices. Notice. Friday, December 19, 2008.
2010
Chile
Pomegranate 75 FR 26707 - Notice of Decision to Issue Permits for the Importation of Fresh Pomegranates and Baby Kiwi From Chile Federal Register. Notices. Notice.
Wednesday, May 12, 2010. Baby Kiwi 75 FR 26707 - Notice of Decision to Issue Permits for the Importation
of Fresh Pomegranates and Baby Kiwi From Chile
Israel squash flower
75 FR 29309 - Notice of Decision to Issue Permits for the Importation of Fresh Male Summer Squash Flowers From Israel
Federal Register. Notices. Notice. Tuesday, May 25, 2010.
Panama Coriander 75 FR 34687 - Notice of Decision to Issue Permits for the Importation of Fresh False Coriander From Panama
Federal Register. Notices. Notice. Friday, June 18, 2010.
Pakistan Mango 75 FR 52712 - Notice of Decision To Issue Permits for the Importation of Fresh Mango Fruit From Pakistan
Federal Register. Notices. Notice. Friday, August 27, 2010.
Mexico Sweet lime 75 FR 56981 - Notice of Decision To Issue Permits for the Importation of Sweet Limes From Mexico
Federal Register. Notices. Notice. Friday, September 17, 2010.
United Kingdom
Wall rocket leaves
75 FR 71415 - Notice of Decision To Issue Permits for the Importation of Wall Rocket Leaves From the United Kingdom
Federal Register. Notices. Notice. Tuesday, November 23, 2010.
2011
Jordan Strawberries 76 FR 8997 - Notice of Decision To Issue Permits for the Importation of Fresh Strawberries From Jordan
Federal Register. Notices. Notice. Wednesday, February 16, 2011.
Chile Fig 76 FR 18511 - Notice of Decision To Issue Permits for the Importation of Fresh Figs From Chile
Federal Register. Notices. Notice. Monday, April 4, 2011.
Malaysia Rambutan 76 FR 21854 - Notice of Decision To Authorize the Importation of Fresh Rambutan Fruit From Malaysia and Vietnam Federal Register. Notices. Notice.
Tuesday, April 19, 2011. Vietnam Rambutan 76 FR 21854 - Notice of Decision To Authorize the Importation of
Fresh Rambutan Fruit From Malaysia and Vietnam
2012 Colombia
Arugula 77 FR 29588 - Notice of Decision To Issue Permits for the Importation of Fresh Celery, Arugula, and Spinach From Colombia
Federal Register. Notices. Notice. Friday, May 18, 2012.
Celery 77 FR 29588 - Notice of Decision To Issue Permits for the Importation of Fresh Celery, Arugula, and Spinach From Colombia
Federal Register. Notices. Notice. Friday, May 18, 2012.
Spinach 77 FR 29588 - Notice of Decision To Issue Permits for the Importation of Fresh Celery, Arugula, and Spinach From Colombia
Federal Register. Notices. Notice. Friday, May 18, 2012.
2013 Egypt Strawberry 78 FR 13304 - Notice of Decision To Issue Permits for the Importation of Strawberry Fruit From Egypt
Federal Register. Notices. Notice. Wednesday, February 27, 2013.
35
Table 1: Exports of fresh vegetables eligible for importation into the United States.
Countries eligible to export to the United
States
Eligible production and exports as % of
world total volume 1/
Number of eligible countries within top 10
2009 Exports to European Union and United States: 5/
Commodity
Total number of countries
2/
Number of low- and
middle-income countries 3/
Producti
on 4/
Exports 4/
Producers
4/
Exporters 4/
No. of exporters
to EU
EU imports in '000 USD
No. of exporters
to US
US imports in '000 USD
HS Code
Artichokes 32 24 26 24 4 2 nd nd nd nd 70910
Asparagus 38 23 6 70 3 3 30 161,066 10 500,923 70920
Bell pepper 37 19 17 78 4 5 75 407,926 21 993,246 70960
Broccoli and cauliflower 51 23 12 56 4 8 27 2,963 3 10,569 70410
Brussels sprouts 51 23 nd nd nd nd 10 2,201 3 7,396 70420
Cabbage and other brassicas 55 23 13 46 2 7 39 20,899 10 169,220 70490
Carrot 54 26 23 45 3 4 35 37,973 6 56,679 70610
Celery 23 13 nd nd nd nd 15 2,873 4 17,940 70940
Cucumber 53 19 8 75 2 5 27 35,489 8 393,502 70700
Eggplant 39 20 2 60 1 4 48 16,334 10 70,734 70930
Escarole 7 3 nd nd nd nd 16 4,045 8 2,879 70529
Garlic 101 56 93 97 6 9 22 161,975 13 138,808 70320
Green bean 47 24 17 57 4 5 54 422,337 15 89,021 70820
Lettuce 51 23 15 67 3 5 19 8,857 5 79,118 70511
Mushroom 126 70 98 98 9 9 16 267 14 107,485 70951
Mustard greens 30 15 nd nd nd nd nd nd nd nd nd
Okra 42 23 3 nd 1 nd 98 298,303 31 470,404 70990
Onion 98 56 68 98 9 9 29 100,292 15 9,713 71220
Potato 9 4 0 0 0 1 15 851 9 1,661 71010
Pumpkin and squash 8 3 5 28 0 2 see okra
Radish 30 17 nd nd nd nd 36 6,261 18 21,692 70690
Spinach 37 17 7 0 3 3 25 3,343 4 10,708 70970
Sweet corn 47 27 nd nd 3 1 18 11,856 13 25,918 71040
Sweet potato 25 8 2 15 1 2 37 53,945 12 9,486 71420
Tomato 36 15 11 47 1 2 44 572,364 12 1,879,534 70200
Turnip greens 21 13 nd nd nd nd see carrots nd=no data. 1/ Represents an upper bound since FAO reports production and statistics for nations as a whole, though in some cases only specific regions of a country may be eligible to export to the United States. 2/ Countries eligible to export each commodity to the United States as of June 2010 according to USDA Animal and Plant Health Inspection Service regulations. 3/ According to country classification developed by World Bank for 2010. 4/ World production and export data for 2007 from the United Nations Food and Agriculture Organization, FAOSTAT. 5/ based on HS classification. Sources: Based on a table produced by the USDA, Economic Research Service, http://www.ers.usda.gov/Data/FruitVegPhyto/ and COMTRADE data

36
Table 2: Exports of fresh fruits eligible for importation into the United States
Countries eligible to export to the United States
Eligible country production and
exports as a percent of world total volume 1/
Number of eligible countries within top
ten
2010 Exports to European Union and United States: 5/
Commodity Total
number 2/
Low- and
middle-income
countries 3/
Production
4/
Exports 4/
Producers
4/
Exporters 4/
No. of exporters
to EU
EU imports in '000 USD
No. of exporters
to US
US imports in '000 USD
HS Code
notes
Apples 17 11 15 44 3 4 32 730,134 9 212,700 80810
Apricots 10 6 5 5 1 0 20 37,300 5 5,256 80910
Avocado 29 11 52 75 3 5 33 403,682 4 616,536 80440 6/
Bananas 75 48 31 73 4 6 47 3,673,086 24 2,126,108 80300 6/
Cantaloupe and Honeydew 44 19 18 88 3 8 42 320,608 13 286,730 80719
Cherries 6 3 5 19 0 0 20 174,699 9 82,987 80920
Cranberries and Blueberries 39 24 nd nd nd nd 28 122,987 12 453,966 81040
Dates 2 1 0 1 0 0 42 187,357 16 18,503 80410 6/
Figs 4 1 1 1 0 1 31 144,278 14 14,742 80420 6/
Grapefruit 43 23 39 45 2 2 33 334,438 6 2,307 80540 6/
Grapes 54 28 74 90 7 8 34 1,329,021 10 1,464,390 80610
Kiwi 12 3 95 82 7 5 17 282,393 8 71,672 81050
Lemons and Limes 59 31 40 69 4 6 51 536,753 18 235,420 80550
Mango 27 16 61 82 5 9 62 359,254 22 345,355 80450 8/
Olives 2 1 0 0 0 0 10 364 6 40,929 71120 7/
Oranges 45 25 30 70 2 6 45 740,952 16 119,182 80510 6/
Papayas 32 20 37 71 3 5 43 68,911 11 98,568 80720 6/
Peaches 15 8 7 13 1 3 23 69,257 4 85,256 80930 6/
Pears 14 8 9 39 2 3 26 351,206 8 96,323 80820 9/
Pineapple 72 50 65 76 6 7 43 746,987 21 585,167 80430 6/
Plums 15 11 8 36 1 3 25 124,162 10 49,392 80940
Raspberries and Blackberries 20 11 nd nd nd nd 25 263,497 21 79,868 81120
Strawberries 91 47 83 94 7 8 23 89,784 4 225,506 81010
Tangerines 43 23 21 62 3 4 34 393,824 11 252,103 80520
Watermelons 11 5 5 37 2 2 35 84,484 8 268,153 80711
37
nd=no data. 1/ Represents an upper bound since FAO reports production and statistics for nations as a whole, though in some cases only specific regions of a country may be eligible to export to the United States. 2/ Countries eligible to export each commodity to the United States as of June 2010 according to USDA Animal and Plant Health Inspection Service regulations. 3/ According to country classification developed by World Bank for 2010. 4/ World production and export data for 2007 from the United Nations Food and Agriculture Organization, FAOSTAT. 5/ based on HS classification 6 digit. 6/ fresh and dried. 7/ incl. provisionally preserved. 8/ incl. guava and mangosteen. 9/ incl. quince. Sources: Based on a table produced by the USDA, Economic Research Service, http://www.ers.usda.gov/Data/FruitVegPhyto/ and COMTRADE data
Table 3:
Australia Canada European Union Japan United States
HS
Code
Product Description No. Value in
1000
USD
No. Value in
1000
USD
No. Value in
1000 USD
No. Value in
1000
USD
No. Value in
1000 USD
80300 Bananas, including plantains, fresh 10 757 53 354,614 47 3,673,086 10 844,749 24 2,126,108
15
mo
st imp
orte
d p
rod
ucts
80610 Fresh grapes 1 19,156 27 391,660 34 1,329,021 5 28,371 10 1,464,390
70200 Tomatoes, fresh or chilled. 1 4,272 34 302,014 44 572,364 5 11,900 12 1,879,534
70960 Fruits of the genus Capsicum or of 1 7,369 51 215,793 75 407,926 5 111,045 21 993,246
80430 Pineapples 4 673 34 97,402 43 746,987 9 101,403 21 585,167
80440 Avocados 1 34,223 30 80,209 33 403,682 4 120,702 4 616,536
80510 Oranges 4 21,775 36 174,293 45 740,952 6 125,778 16 119,182
80810 Apples 21 184,223 32 730,134 1 340 9 212,700
71080 Other vegetables 24 16,092 43 42,878 57 354,339 32 259,753 44 465,368
70990 Other vegetables 6 685 71 146,848 98 298,303 18 116,383 31 470,404
80550 Lemons and limes 5 10,609 50 69,240 51 536,753 5 86,402 18 235,420
80620 Grapes, dried 14 41,641 25 72,143 33 682,670 11 73,828 20 37,570
80520 Mandarins (incl. tangerines and Satsuma) 4 3,470 36 166,036 34 393,824 6 16,421 11 252,103
80450 Guavas, mangoes and mangosteens 12 2,230 51 62,879 62 359,254 13 47,130 22 345,355
70920 Asparagus 9 8,386 33 73,860 30 161,066 15 74,951 10 500,923
71140 Cucumbers and gherkins 4 1,698 7 1,089 10 29,123 7 15,554 8 6,252
15
lea
st imp
orte
d p
rod
ucts
71332 Small red (Adzuki) beans (Phaseolus) 5 1,305 15 2,022 24 3,288 8 26,215 19 9,743
71390 Other dried, shelled leguminous vegetables 14 655 38 5,298 49 7,307 6 470 20 26,170
71010 Potatoes 7 312 10 1,159 15 851 7 23,337 9 1,661
70110 Seed 2 3,000 10 544 2 22,890
70890 Other leguminous vegetables 2 31 19 2,956 43 8,346 2 2,948 12 10,596
71232 Wood ears (Auricularia spp.) 3 286 10 281 11 4,618 3 19,256 1 358
71231 Mushrooms of the genus Agaricus 7 412 19 2,362 16 8,363 3 193 17 11,755
71350 Broad beans (Vicia faba var. major) 2 9 19 363 30 10,282 9 7,404 16 3,865
70529 Other fresh of chilled chicory 20 5,054 16 4,045 3 6,769 8 2,879
38
70420 Brussels sprouts 11 8,071 10 2,201 4 108 3 7,396
80590 Other fresh or dried citrus fruit 4 96 33 1,470 33 6,778 2 8 11 1,977
70521 Witloof chicory (Cichorium intybus 5 1,338 3 46 3 2,258 8 5,108
81060 Durians 2 55 4 1,294 3 2,541 1 495 1 2,323
71151 Mushrooms of the genus Agaricus 3 27 1 1,498 1 2,496 1 32
71233 Jelly fungi (Tremella spp.) 2 53 3 300 7 749 1 696 1 47
Table 5: Descriptive statistics for the number of authorized exporters to the US in FF&V sectors, 2007.
Average Standard Deviation Minimum Maximum
With political contributions 28.667 22.157 2.000 76.000
Without political contributions 58.258 42.275 1.000 225.000
T-Test of equal means: 2.940, prob. = 0.998.
Chi-2 test of equal medians: 6.470, prob. = 0.011.
39
Figure 1: Total number of countries exporting FF&V to the US, the EU – 15, and the world, averaged by HS 6-digit product.
40
Figure 2. Evolution of average concentration of exporters to the U.S. for all FF&V (1994-2012)
41
Figure 3: Correlation between market access eligibility and farm-level concentration of production in the US.


