
Using DRIFT Spectrometry with PLS Method for Determination of Oxygen Functionalities in Heterogeneous Materials
P. STRAKA and J. ENDRÝSOVÁ
Institute of Rock Structure and Mechanics, Academy of Sciences of the Czech Republic, CZ-182 09 Prague
Received 7 May 1998
To determine etheric/hydroxyl oxygen in chemically and physically heterogeneous materials the method combining diffuse reflectance infrared Fourier transform spectroscopy (DRIFTS) with the advanced statistic partial least-squares method (PLS) was developed. The DRIFTS-PLS method yields exact and accurate results, as it is demonstrated by the determination of etheric/hydroxyl oxygen in 40 samples. Quickness is an important feature of the method, as it reduces the duration of the determination from tens of hours to several minutes. For this reason, the method is suitable for analyses of large sets of heterogeneous samples.
The determination of oxygen functionalities is an important task in the determination of the structure of organic substances, further, in the determination of the individual components of mixtures as well as in practical applications. Classical chemical methods of determination lead to sufficiently accurate and correct results, only they require an experience with handling the material in question and with the procedure and especially they need a sufficient amount of time, as the determinations last even tens of hours. With analyses of large sets of heterogeneous samples, where hundreds of analyses are needed, it is purposeful (and in many cases necessary) to replace the time-consuming chemical determination by an instrumental technique which takes only several minutes. In our case, FTIR spectrometry was applied. If the infrared spectrometry should yield absolute values, e.g. w{—О—) of the material, a calibration is needed. Although for the calibration again chemical determinations are needed, their number is limited. In our case, fractions of coals as model heterogeneous material were chosen [1] and analyzed. Generally, the content of etheric/hydroxyl oxygen belongs to the important analytical parameters in the investigation of the problem of the constitution of the organic coal substances.
The aim of this work is to describe a method for rapid determination of etheric/hydroxyl oxygen in a large set of samples of a material which is from both chemical and physical points of view heterogeneous. By the rapid determination an analysis lasting several minutes is meant.
E X P E R I M E N T A L
Fractions of three bituminous coals from the
Ostrava-Karviná Mining District (coals A, B, and C) were used in the analyses. From each coal, solid fractions were separated by using a series of xylene— tetrachloromethane mixtures. Densities of these mixtures were 1.21 g cm - 3 , 1.24 g cm - 3 , 1.27 g cm - 3 ,1.33 g cm - 3 , 1.45 g cm"3 , and 1.50 g cm - 3 Densities of fractions obtained are shown in Table 1. The fractions obtained were characterized by their water content, mineral matters [2], volatile organics [3], and by elemental analysis (Table 1). The solid fractions obtained contained different contents of etheric/hydroxyl oxygen. From the physical point of view, they were characterized by density and amount of microscopically discernible particles (vitrinite, liptinite, and inertinite) (Table 1).
Etheric oxygen was determined with hydroiodic acid which quantitatively splits the etheric bonds with the formation of hydroxyl groups [4]. In our case, 4.5 to 5.0 g of coal with grain size under 0.2 mm were heated under a reflux cooler with 36 to 40 cm3 of 55—58 % HI for 8 h. After washing and shaking the sample with 10 % KI and subsequent elimination of potassium iodide with distilled water, the sample was dried for 2 h at 110°C. To the dried sample 50 cm3
of 0.1 M-KOH in ethanol were added and the mixture obtained was shaken with a shaking machine for 6 h. The unconsumed KOH was then titrated with 0.1 M-HC1. In a parallel blank experiment, 4.4—5.0 g of the coal fraction were shaken for the same time with the given amount of ethanolic KOH and then the amount of KOH present was determined. The content of hydroxyl groups determined in this way corresponded to the content of etheric oxygen. The procedure described was well reproducible. The standard deviation of an individual determination of etheric oxygen was
Chem. Papers 53 (5) 283—287 (1999) 283

P. STRAKA, J. ENDRYSOVÁ
Table 1. Characteristics of Fractions of Three Bituminous Coals of Ostrava-Karviná Coal District
P
g c m - 3 W a Ad
Fractions of coal A (samples 1—4) 1.21-1.24-1.27-1.33-
-1.24 -1.27 -1.33 -1.45
1.90 1.46 1.19 1.59
0.77 0.37 0.95 6.70
Fractions of coal В (samples 5—9) 1.21-1.24-1.27-1.33-over
-1.24 -1.27 -1.33 -1.45 1.50
3.58 2.26 1.57 1.89 1.29
3.80 1.75 1.53 5.07 37.1
ydaf
32.47 28.24 26.05 23.46
31.48 30.97 29.14 29.18 26.89
Fractions of coal С (samples 10—14) 1.21-1.24-1.27-1.33-
-1.24 -1.27 -1.33 -1.45
1.61 1.60 1.92 1.72
1.27 1.39 2.88 9.85
-40.15 36.21 33.76
H d a f
5.86 5.07 4.84 4.47
5.86 5.53 5.19 5.13 4.40
6.35 5.64 5.35 5.08
Wi/%
C d a f
87.82 87.53 88.54 87.88
86.36 86.41 86.41 86.38 85.95
83.72 83.66 84.23 84.49
S daf
0.39 0.34 0.40 0.21
0.32 0.31 0.34 0.34 0.83
0.55 0.55 0.45 0.52
N d a f
1.29 1.43 1.33 1.22
1.45 1.42 1.41 1.25 1.32
1.63 1.71 1.69 1.54
Qdaf
4.64 5.63 4.89 6.22
6.22 6.33 6.39 6.90 7.50
7.75 8.44 8.28 8.37
V
11 57 37 24
62 67 71 37 24
26 52 61 40
4>\l%
L
78 13 12 8
25 17 8 7 2
52 26 11 12
I
11 30 51 68
13 16 21 56 74
22 22 28 48
p - density of fraction, W a - water content, A d - mineral matters (dry sample), V d a f - volatile organics. H, C, S 0 , N, and O ( d a f ) - elemental analysis of organic coal substance. V, L, and I - vitrinite (V), liptinite (L), and inertinite (I) content (petrographic analysis).
1.3 %, the standard deviation of the mean value (n = 4) was 0.65 %.
The hydroxyl group was determined by acetylation of the coal samples with acetic anhydride in pyridine [5]. 800 mg of dry sample (grain size under 0.07 mm) were heated for 24 h under a reflux cooler with 10 cm3 of a mixture of acetic anhydride and pyridine (ipT
= 1 2). (With this ratio no significant effect on the coal substance occurs, as our experience shows.) The acetylated sample was filtered and heated at 105— 110 °C with 3.7 g of barium hydroxide in 40 cm3 for 5 h. After 12 h of standing 2 cm3 of 85 % phosphoric acid were added and the liquid from the mixture was distilled repeatedly (in our case 4 times, always 25 cm 3). After each distillation 25 cm3 of water was added. Acetic acid obtained corresponding to the amount of OH groups was determined by titration with 0.01 M-NaOH. The standard deviation of an individual determination of hydroxyl groups was 4 %, the standard deviation of the mean value (n = 4) was 1 %.
The samples analyzed by the chemical method were further analyzed with the FTIR spectrometer Nicolet 740 (Nicolet Analytical Instruments, Madison, Wisconsin) with the data station DSP 680 using the technique of diffuse reflectance. The diffuse reflectance cell by Spectra Tech was used. With the used adapter the angle of the radiation impact was 45°, the geometry of the adapter was of the type off axis. The wavenumbers were measured with the resolution of 2 c m - 1 , using 512 scans. A mirror was used as the reference standard. The spectra were processed with the program Omnic Software Version 1.20.
The calibration of the infrared spectra was per
formed by the multivariation method of partial least squares (PLS) [6, 7]. The PLS method was applied in the spectral range of 400—2000 cm" 1 . 26 and 33 calibration samples were used, the number of factors was optimized [6, 7] to 9 and 8. The calibration was performed with the program Omnic Turboquant, version 1.0. The reliability of the calibration, i.e. the reliability of the established analytical model, was tested. As calibration samples, solid fractions with other densities than those of the analyzed samples, namely Pi/(g cm" 3 ) 1.27—1.29, 1.29—1.31, 1.31—1.33, 1.33—1.35, over 1.4, and under 1.45 and others, were used. In this way it was ascertained that the concentration range of etheric oxygen in the calibration samples corresponds to the concentration ranges in the analyzed samples (Table 2). By this procedure the calibration samples were prepared by a random and independent variation of the concentration of etheric/hydroxyl oxygen.
R E S U L T S A N D D I S C U S S I O N
The three coals investigated were chosen with regard to the different oxygen content in the organic coal substance, which ascertained a different content of etheric/hydroxyl oxygen in the samples. In its native state, coal A contained 4.93 mass %, coal В 6.82 mass %, and coal С 8.46 mass % of oxygen (dry ash free samples). The mass fraction of etheric oxygen determined by the method of the splitting with hydrogen iodide varied with the fractions for coal A in the range of 2.46—3.89 % (i.e. 2.68—3.96 % for its organic coal substance), with the fractions for coal В in the range of 2.56—4.35 % (4.15—4.49 % for the
284 Chem. Papers 53 (5) 283—287 (1999)
DETERMINATION OF OXYGEN FUNCTIONALITIES
Table 2. Determination of Etheric Oxygen and Hydroxyl in Samples of Fractions of Three Bituminous Coals from Ostrava-Karviná Coal District by Classical Methods and Method Presented
Coal
A
В
С
Sample
I 2 3 4
5 6 7 8 9
10 11 12 13 14
P
g c m - 3
1.21-1.24-1.27-1.33-
1.21-1.24-1.27-1.33-over
-1.24 -1.27 -1.33 -1.45
-1.24 -1.27 -1.33 -1.45 1.50
under 1.2 1.21-1.24-1.27-1.33-
-1.24 -1.27 -1.33 -1.45
w(—0—)/%
DRIFTS-PLS
3.764 3.886 3.126 2.570
4.128 4.093 4.309 3.406 2.665
6.298 6.139 5.559 4.950 3.347
w(—O—)/%
HI method
3.753 3.886 3.060 2.455
4.149 4.110 4.346 3.364 2.559
6.507 6.334 5.704 5.042 3.300
Perr
%
-0.29 0.00
-2.16 -4.68
0.51 0.41 0.85
-1.25 -4.14
3.21 3.07 2.54 1.82
-1.42
w(OK)/%
DRIFTS -PLS
3.512 1.965 1.332 0.821
3.096 3.105 3.055 2.180 1.983
1.840 2.893 4.032 3.940 4.613
w(OU)/%
Acetylation method
3.541 1.872 1.340 0.754
3.110 3.120 3.068 2.162 1.958
1.809 2.900 4.080 4.005 4.682
Perr
%
-0.81 4.97
-0.61 8.89
-0.45 -0.48 -0.42 -0.83
1.28
1.71 -0.24 -1.18 -1.12 -1.47
difference between chemical and DRIFTS-PLS determination.
coal substance), and with the fractions for coal С in the range of 3.30—6.51 % (3.72—6.70 % for coal substance). These results agree with the data presented in former publications [4, 8—10] which give for bituminous coals with various carbon content (81—90 %, dry ash free samples) the etheric oxygen content in the range of 1.60—4.10 % for the coal substance.
The results obtained by determinations by the method using splitting with hydrogen iodide and by acetylation method together with the DRIFTS-PLS results are demonstrated in Table 2. The values given represent mean values of 3—5 analyses.
The choice of the statistic method used in the calibration is important. From critical evaluations of the statistic methods which come into consideration [6,11] it follows that in the cases in question the application of the multivariation method of partial least squares (PLS) represents the optimum.
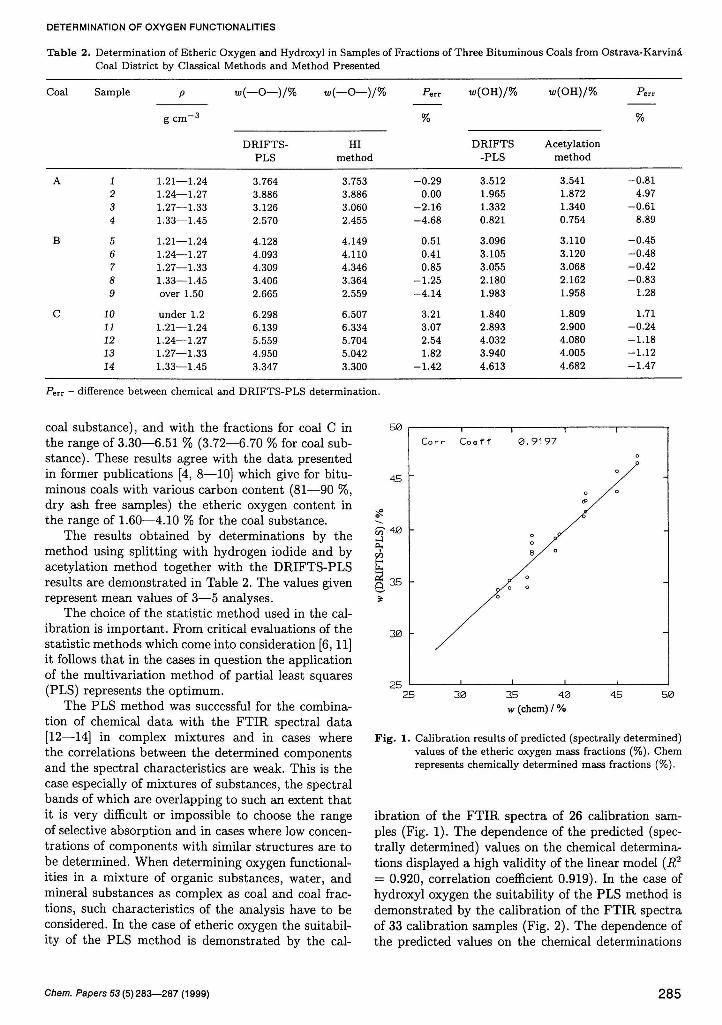
The PLS method was successful for the combination of chemical data with the FTIR spectral data [12—14] in complex mixtures and in cases where the correlations between the determined components and the spectral characteristics are weak. This is the case especially of mixtures of substances, the spectral bands of which are overlapping to such an extent that it is very difficult or impossible to choose the range of selective absorption and in cases where low concentrations of components with similar structures are to be determined. When determining oxygen functionalities in a mixture of organic substances, water, and mineral substances as complex as coal and coal fractions, such characteristics of the analysis have to be considered. In the case of etheric oxygen the suitability of the PLS method is demonstrated by the cal-
5.0
4.5
со 4.0 *-)
с/э
§ 3 5
30
25
_ 1 j r
C o e f f 0 . 9 1 9 7
25 3.0 35 40 w (chem) / %
45 50
Fig . 1. Calibration results of predicted (spectrally determined) values of the etheric oxygen mass fractions (%). Chem represents chemically determined mass fractions (%).
ibration of the FTIR spectra of 26 calibration samples (Fig. 1). The dependence of the predicted (spectrally determined) values on the chemical determinations displayed a high validity of the linear model (J?2
= 0.920, correlation coefficient 0.919). In the case of hydroxyl oxygen the suitability of the PLS method is demonstrated by the calibration of the FTIR spectra of 33 calibration samples (Fig. 2). The dependence of the predicted values on the chemical determinations
Chem. Papers 53 (5) 283—287 (1999) 285

P. STRAKA, J. ENDRÝSOVÁ
35
3.0
£ 25
°T Й
2 0
C 2 Q
V 1.5
1.0
1.0 1.5 2.0 Z5 w (chem) / %
30 35
Fig . 2. Calibration results of predicted (spectrally determined) values of hydroxyl mass fractions (%). Chem represents chemically determined mass fractions (%).
60
40
£ 20 -
-20
-40
8 о о
9-0 5
°8 8o
о i I !
10 20 w (chem) / %
30 40
Fig . 4. Cross-validation of predicted mass fractions of hydroxyl
groups.
6 0 0
Fig . 3. Optimization of the factor numbers for hydroxyl
groups. PRESS - predicted error sum of squares.
displayed also a high validity of the linear model (R2
= 0.963, correlation coefficient 0.956). As it has been already mentioned, the PLS method
applies in its statistic apparatus factor analysis, although the number of factors has to be optimized. The optimization is performed on the basis of the dependence of the predicted error sum of squares (PRESS) on the number of factors for component. With the increasing number of factors the values of PRESS should
converge to zero. In the case of hydroxyl content the number of factors was optimized to 8 (Fig. 3). Analogously, the number of factors was optimized to 9 for etheric oxygen content.
In order to determine the reliability of the analytical model formed, cross-validation was applied, where alternately one of the standards was eliminated and from the remaining calibration data a new analytical model was established. This model was then applied in the calculation of the vector of the mass fractions of the eliminated standard. The calculated deviations from the declared content of the considered component were then evaluated. The verification of the calibration was therefore performed by testing sets which were then measured as a calibration set. The results of the cross-validation are demonstrated in Fig. 4 (for hydroxyl content). The deviations from the declared (chemically determined) values in 29 of 33 cases varied in the range of 0.1—10 %, only in the remaining 4 cases they were higher. In these cases, samples with high content of mineral matter (about 30 %) were tested. In the case of etheric oxygen content the deviations from the declared (chemically determined) values in 23 of 26 cases varied in the range of 0.2 to 9 %, only in the remaining 3 cases they were higher (11 % in two cases and 21 % in one case). Therefore, it can be stated that the established analytical model is reliable.
With a given number of factors the criterion of the correctness is represented by the difference (eft) between the values of chemical analyses and those of the FTIR measurements or, as the case may be, the fraction difference (P e r r ) between the values obtained by chemical and FTIR determination defined as
286 Chem. Papers 53(5)283—287 (1999)

DETERMINATION OF OXYGEN FUNCTIONALITIES
Perr = (dl/Xchem) 100 (%) (1)
where XChem is the value obtained by chemical determination. For etheric oxygen, in 8 of 14 determinations the value of Perr did not exceed 2 %, in 5 determinations it was equal to 2—4 %, and only in a single case it exceeded 4 %. For hydroxyl, in 7 of 14 determinations the value of PeTT did not exceed 1 %, in 5 determinations it was equal to 1—2 %, and in two cases it was 5 % and 9 %. We may therefore conclude tha t the DRIFTS-PLS method leads to correct results and tha t it is suitable for the determination of etheric/hydroxyl oxygen in heterogeneous materials. It is evident tha t by this procedure we may determine the etheric/hydroxyl oxygen or hydroxyl in the organic substances, which is an important parameter of the chemical structure. For etheric oxygen, the standard deviation of the DRIFTS-PLS values (Fig. 1) was 0.1420 %, the s tandard deviation of the regression coefficient (0.920) was 0.055. For hydroxyl the standard deviation of the DRIFTS-PLS values (Fig. 2) was 0.1246 %, the s tandard deviation of the regression coefficient (0.956) was 0.034. Therefore, the method leads to accurate results.
The determination by the classic method with hydroiodic acid takes about 26 h, with acetylation method about 66 h. The methods described reduce the time of analysis to several min. The methods presented here are therefore suitable for the determination in large sets of samples of analogous heterogeneous materials (e.g. caustobioliths).
Acknowledgements. This investigation was supported by the Grant Agency of the Academy of Sciences of the Czech Republic as the grant project No. A2046902.
R E F E R E N C E S
1. Sýkorová, L, Ph.D. Thesis. Institute of Geology and Geotechnics, Czechoslovak Academy of Sciences, Prague, 1982.
2. Czechoslovak State Norm 44 1364. 3. Czechoslovak State Norm 44 1351. 4. Blom, L, Edelhausen, L., and van Krevelen, D. W., Fuel
36, 135 (1957). 5. Bhaumik, I. N., Murkherjee, A. K., Murkherjee, P. M.,
and Lahiri, A., Fuel 41, 443 (1962). 6. Haaland, D. M. and Thomas, E. V., Anal. Chem. 60,
1193 (1988). 7. Haaland, D. M. and Thomas, E. V., Anal. Chem. 60,
1202 (1988). 8. Angelova, G. and Lazárov, L., Fuel 47, 333 (1968). 9. Angelova, G. and Lazárov, L., Brennst-Chem. 46, 204
(1965). 10. Sindler, S., Macák, J., Mráziková, J., and Buryan, P.,
Scientific Papers of Inst, of Chem:' Technology Prague - Fuel Technology D 43, 37 (1981).
11. Mark, H. and Workman, J., Statistics in Spectroscopy. Academic Press, San Diego, 1991.
12. Linn, J. H. and Hanley, K. L., Appl. Spectrosc. 47, 2102 (1993).
13. Pell, R. L., Erickson, B. C , Hannah, R. W., Callis, J. В., and Kowalski, B. R., Anal. Chem. 60, 2824 (1988).
14. Haaland, D. M., Anal. Chem. 60, 1208 (1988).
Chem. Papers 53 (5) 283—287 (1999) 287


![Survey Contents[PDF - 2.56 MB]](https://cdn.vdocument.in/doc/165x107/5866cb861a28ab0b408b9066/survey-contentspdf-256-mb.jpg)


![4.35 :5|8][ - ( H-4](https://cdn.vdocument.in/doc/165x107/5e4fc2a9ed4a1a478e4dab08/-435-58-h-4.jpg)

