Download - Using Span of Control as a Strategic Tool
Using Spans and Layers
for Optimal Organizational Design
“Able” and “Charlie” Merger Integration
Privileged and Confidential
Situation: The combination of two large P&C companies (code named “Able” and “Charlie”) left management with a unique opportunity. Since the deal truly was a “merger of equals,” not only could management achieve synergies by removing redundant positions, but the new organization was in effect a “blank slate” that could be reinvented from the ground up.
Complication: The two legacy organizations had fundamentally different management philosophies and therefore spans of control. “Able” believed managers should also be “doers” and therefore kept spans lower and believed they had far fewer organizational layers. “Charlie” believed managers should “manage” and thus had higher spans of control.
Questions: What are some useful reference points to determine ‘optimal’ spans?
To what extent does performance data of the legacy organizations provide support for any particular span of control arrangement/level?
What are the organizational implications for adopting a different SoC standard, and how might it be implemented during the integration?
Hypothesis: The new company has an opportunity to move to a more cost-effective structure without putting at risk key performance metrics such as loss ratio, productivity/unit costs or customer satisfaction.
On the contrary, moving to a broader Span of Control may yield enhanced performance (as well as lower cost) in such areas as employee communication, satisfaction, customer service responsiveness and productivity
2
Future State Organizational Design: Spans and Layers
Privileged and Confidential
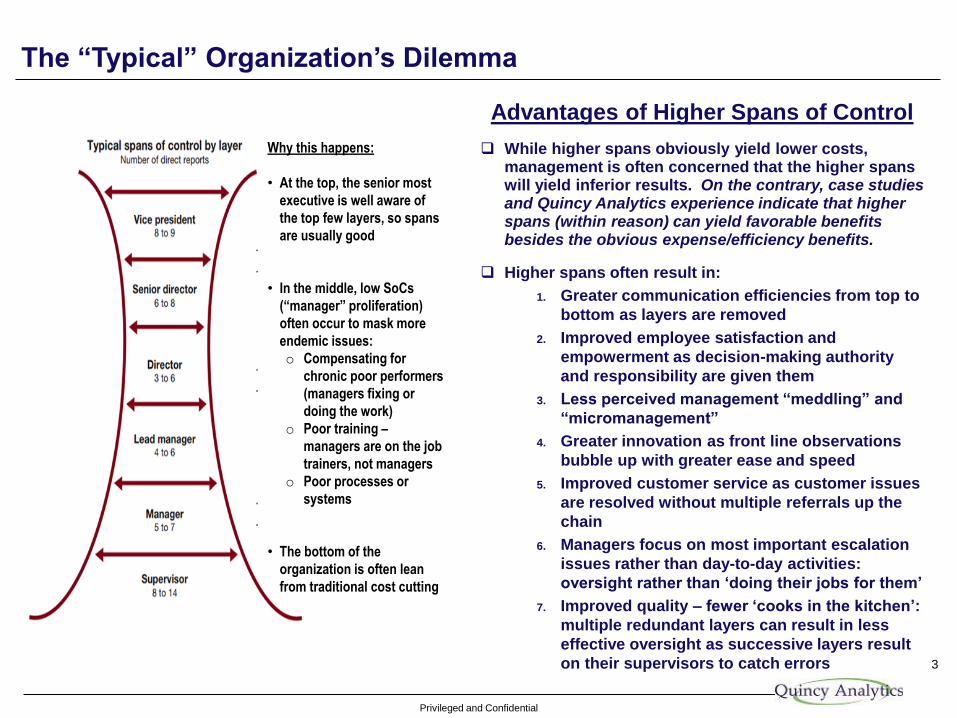
Advantages of Higher Spans of Control
While higher spans obviously yield lower costs, management is often concerned that the higher spans will yield inferior results. On the contrary, case studies and Quincy Analytics experience indicate that higher spans (within reason) can yield favorable benefits besides the obvious expense/efficiency benefits.
Higher spans often result in:
1. Greater communication efficiencies from top to
bottom as layers are removed
2. Improved employee satisfaction and
empowerment as decision-making authority
and responsibility are given them
3. Less perceived management “meddling” and
“micromanagement”
4. Greater innovation as front line observations
bubble up with greater ease and speed
5. Improved customer service as customer issues
are resolved without multiple referrals up the
chain
6. Managers focus on most important escalation
issues rather than day-to-day activities:
oversight rather than ‘doing their jobs for them’
7. Improved quality – fewer ‘cooks in the kitchen’:
multiple redundant layers can result in less
effective oversight as successive layers result
on their supervisors to catch errors 3
The “Typical” Organization’s Dilemma
Why this happens:
• At the top, the senior most
executive is well aware of
the top few layers, so spans
are usually good
• In the middle, low SoCs
(“manager” proliferation)
often occur to mask more
endemic issues:
o Compensating for
chronic poor performers
(managers fixing or
doing the work)
o Poor training –
managers are on the job
trainers, not managers
o Poor processes or
systems
• The bottom of the
organization is often lean
from traditional cost cutting
Privileged and Confidential
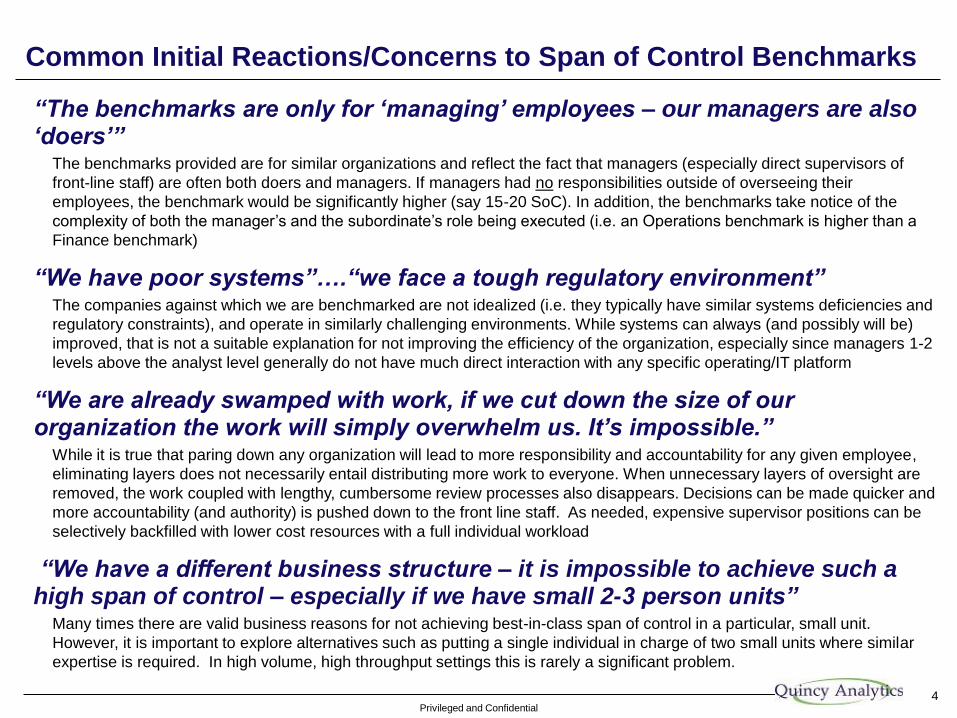
“The benchmarks are only for ‘managing’ employees – our managers are also ‘doers’”
The benchmarks provided are for similar organizations and reflect the fact that managers (especially direct supervisors of
front-line staff) are often both doers and managers. If managers had no responsibilities outside of overseeing their
employees, the benchmark would be significantly higher (say 15-20 SoC). In addition, the benchmarks take notice of the
complexity of both the manager’s and the subordinate’s role being executed (i.e. an Operations benchmark is higher than a
Finance benchmark)
“We have poor systems”….“we face a tough regulatory environment”The companies against which we are benchmarked are not idealized (i.e. they typically have similar systems deficiencies and
regulatory constraints), and operate in similarly challenging environments. While systems can always (and possibly will be)
improved, that is not a suitable explanation for not improving the efficiency of the organization, especially since managers 1-2
levels above the analyst level generally do not have much direct interaction with any specific operating/IT platform
“We are already swamped with work, if we cut down the size of our organization the work will simply overwhelm us. It’s impossible.”
While it is true that paring down any organization will lead to more responsibility and accountability for any given employee,
eliminating layers does not necessarily entail distributing more work to everyone. When unnecessary layers of oversight are
removed, the work coupled with lengthy, cumbersome review processes also disappears. Decisions can be made quicker and
more accountability (and authority) is pushed down to the front line staff. As needed, expensive supervisor positions can be
selectively backfilled with lower cost resources with a full individual workload
“We have a different business structure – it is impossible to achieve such a high span of control – especially if we have small 2-3 person units”
Many times there are valid business reasons for not achieving best-in-class span of control in a particular, small unit.
However, it is important to explore alternatives such as putting a single individual in charge of two small units where similar
expertise is required. In high volume, high throughput settings this is rarely a significant problem.
4
Common Initial Reactions/Concerns to Span of Control Benchmarks
Privileged and Confidential
Legacy and Future State Organizations
5
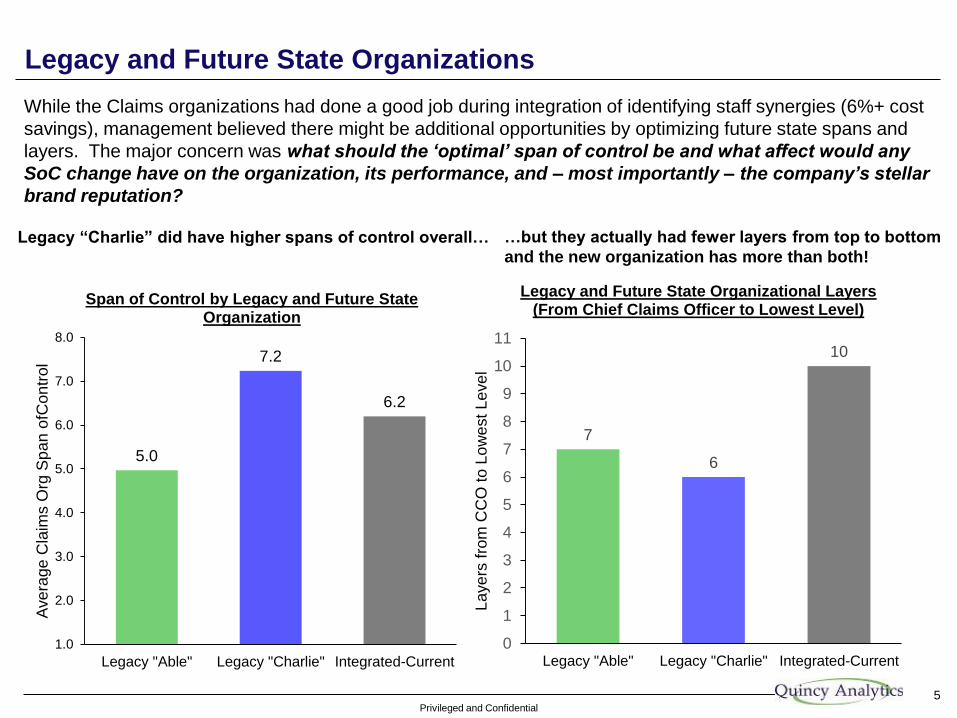
While the Claims organizations had done a good job during integration of identifying staff synergies (6%+ cost
savings), management believed there might be additional opportunities by optimizing future state spans and
layers. The major concern was what should the ‘optimal’ span of control be and what affect would any
SoC change have on the organization, its performance, and – most importantly – the company’s stellar
brand reputation?
5.0
7.2
6.2
1.0
2.0
3.0
4.0
5.0
6.0
7.0
8.0
Legacy "Able" Legacy "Charlie" Integrated-Current
Ave
rage
Cla
ims O
rg S
pa
n o
fCon
tro
l
Span of Control by Legacy and Future State Organization
7
6
10
0
1
2
3
4
5
6
7
8
9
10
11
Legacy "Able" Legacy "Charlie" Integrated-Current
La
ye
rs f
rom
CC
O t
o L
ow
est
Le
ve
l
Legacy and Future State Organizational Layers (From Chief Claims Officer to Lowest Level)
Legacy “Charlie” did have higher spans of control overall… …but they actually had fewer layers from top to bottom
and the new organization has more than both!
Privileged and Confidential
Future State Structure Reflecting Simple Combination of Legacy
0
10
20
30
40
50
60
70
1 2 3 4 5 6 7 8 9 10 11 12 13 14 15 16 17 18 19 20
Nu
mb
er
of M
an
ag
ers
Span of Control
Current State Integrated Able/Charlie
"Able" "Charlie"
6
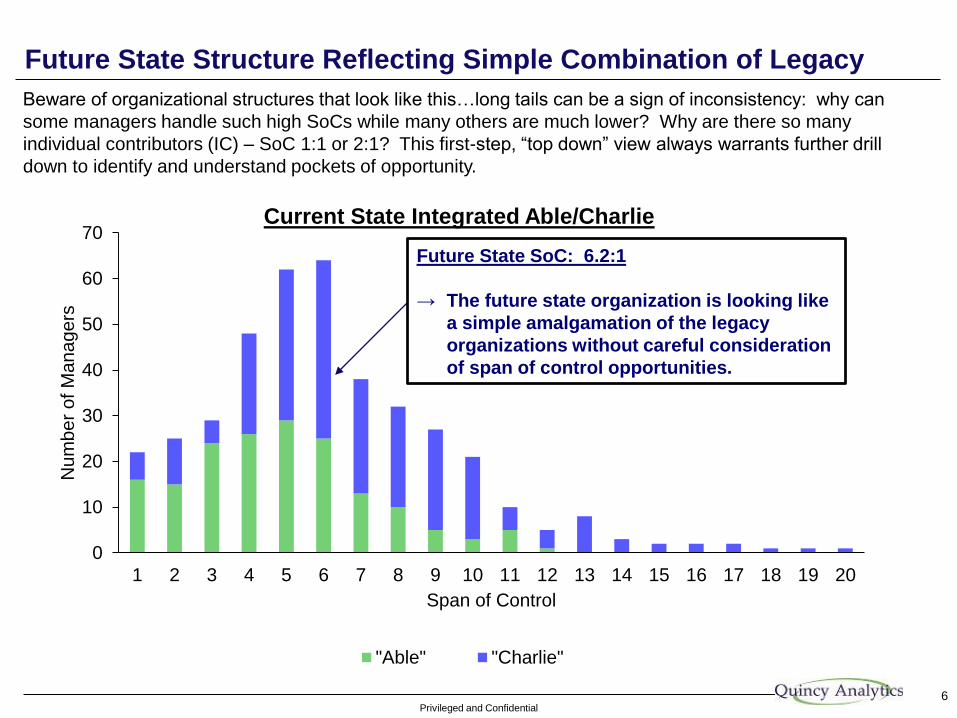
Future State SoC: 6.2:1
→ The future state organization is looking like
a simple amalgamation of the legacy
organizations without careful consideration
of span of control opportunities.
Beware of organizational structures that look like this…long tails can be a sign of inconsistency: why can
some managers handle such high SoCs while many others are much lower? Why are there so many
individual contributors (IC) – SoC 1:1 or 2:1? This first-step, “top down” view always warrants further drill
down to identify and understand pockets of opportunity.
Privileged and Confidential7
Span of Control by Future State Claims Sub-Unit
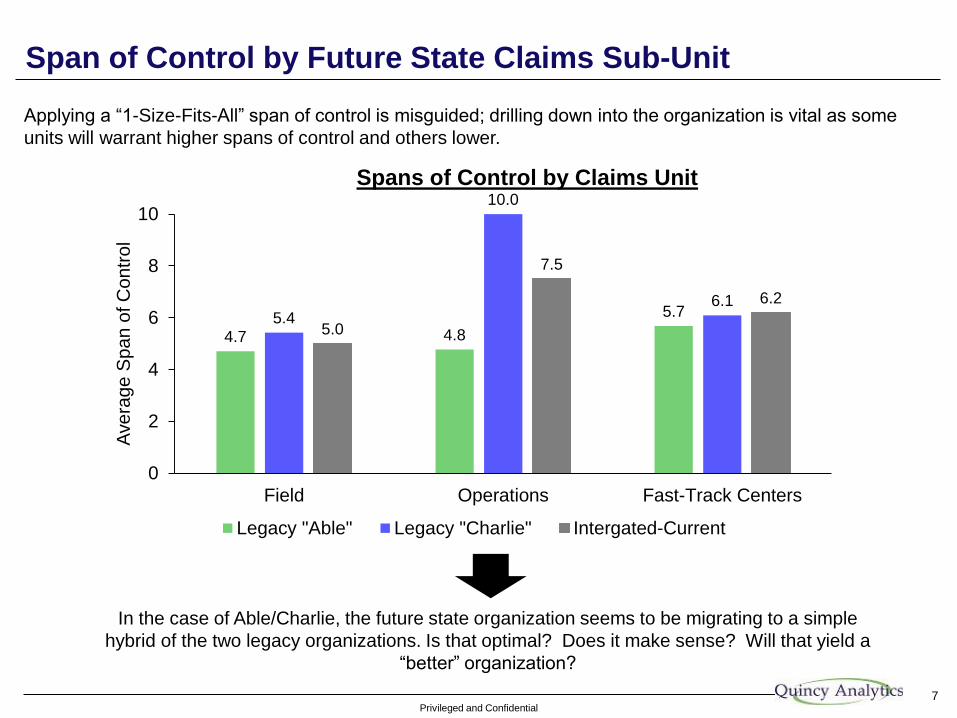
Applying a “1-Size-Fits-All” span of control is misguided; drilling down into the organization is vital as some
units will warrant higher spans of control and others lower.
In the case of Able/Charlie, the future state organization seems to be migrating to a simple
hybrid of the two legacy organizations. Is that optimal? Does it make sense? Will that yield a
“better” organization?
4.7 4.8
5.75.4
10.0
6.1
5.0
7.5
6.2
0
2
4
6
8
10
Field Operations Fast-Track Centers
Avera
ge S
pan o
f C
ontr
ol
Spans of Control by Claims Unit
Legacy "Able" Legacy "Charlie" Intergated-Current
Privileged and Confidential
Claims Field Organization: Spans Versus Layer Diagnostic
8
Paygrade
Layer High Low Grand TotalAvg SoC by
layer
0 2 2 5.5
1 1 5 5 11 3.6
2 1 10 6 13 3 2 1 36 5.1
3 6 4 30 33 17 13 14 13 8 4 142 4.7
4 10 43 53 39 41 12 19 22 239 5.9
5 12 23 79 39 5 1 6 165
Grand Total 3 6 21 10 53 91 95 132 94 30 28 32 595 5.0
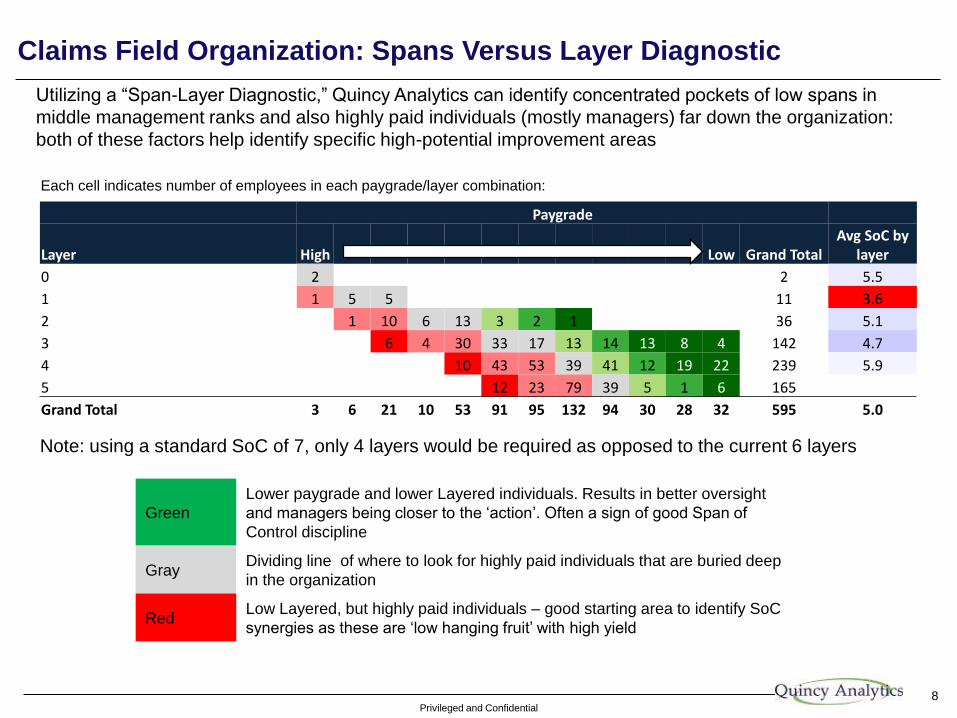
Note: using a standard SoC of 7, only 4 layers would be required as opposed to the current 6 layers
Green
Lower paygrade and lower Layered individuals. Results in better oversight
and managers being closer to the ‘action’. Often a sign of good Span of
Control discipline
GrayDividing line of where to look for highly paid individuals that are buried deep
in the organization
RedLow Layered, but highly paid individuals – good starting area to identify SoC
synergies as these are ‘low hanging fruit’ with high yield
Utilizing a “Span-Layer Diagnostic,” Quincy Analytics can identify concentrated pockets of low spans in
middle management ranks and also highly paid individuals (mostly managers) far down the organization:
both of these factors help identify specific high-potential improvement areas
Each cell indicates number of employees in each paygrade/layer combination:
Privileged and Confidential
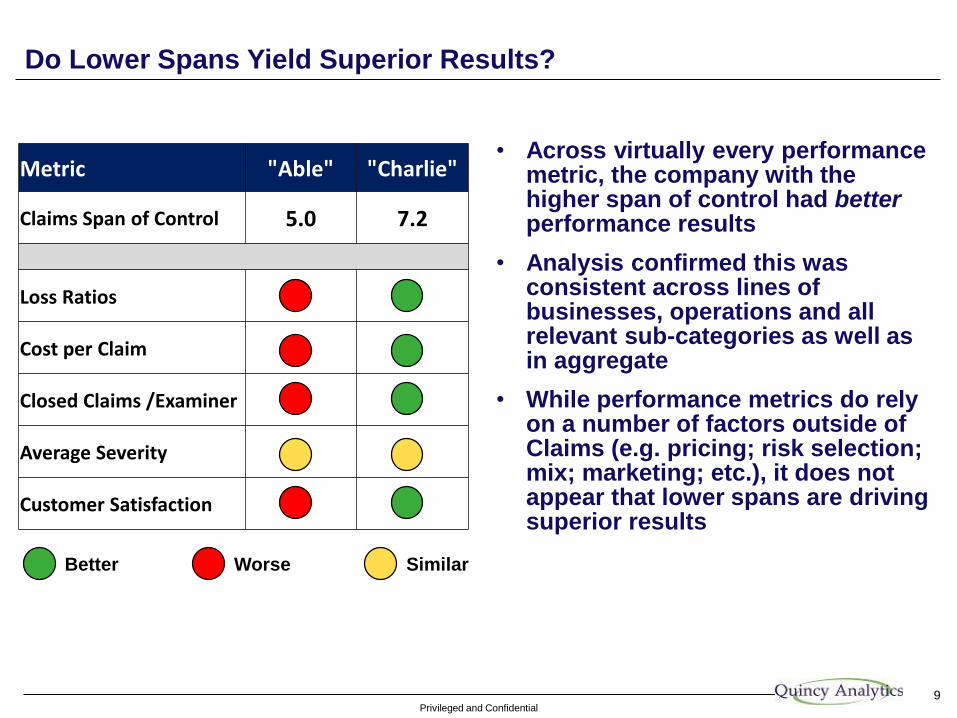
Do Lower Spans Yield Superior Results?
• Across virtually every performance metric, the company with the higher span of control had betterperformance results
• Analysis confirmed this was consistent across lines of businesses, operations and all relevant sub-categories as well as in aggregate
• While performance metrics do rely on a number of factors outside of Claims (e.g. pricing; risk selection; mix; marketing; etc.), it does not appear that lower spans are driving superior results
9
Metric "Able" "Charlie"
Claims Span of Control 5.0 7.2
Loss Ratios
Cost per Claim
Closed Claims /Examiner
Average Severity
Customer Satisfaction
Better Worse Similar
Privileged and Confidential
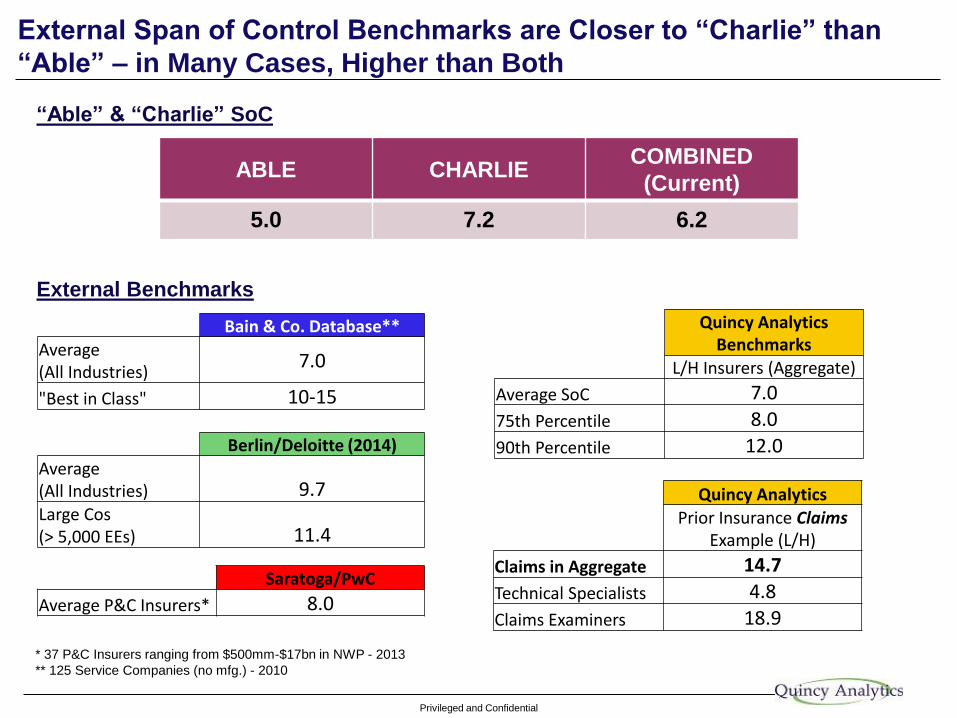
Bain & Co. Database**Average (All Industries)
7.0
"Best in Class" 10-15
Berlin/Deloitte (2014)Average (All Industries) 9.7Large Cos (> 5,000 EEs) 11.4
Quincy Analytics Benchmarks
L/H Insurers (Aggregate)
Average SoC 7.0
75th Percentile 8.0
90th Percentile 12.0
10
External Span of Control Benchmarks are Closer to “Charlie” than
“Able” – in Many Cases, Higher than Both
Quincy AnalyticsPrior Insurance Claims
Example (L/H)
Claims in Aggregate 14.7
Technical Specialists 4.8
Claims Examiners 18.9
* 37 P&C Insurers ranging from $500mm-$17bn in NWP - 2013
** 125 Service Companies (no mfg.) - 2010
Saratoga/PwC
Average P&C Insurers* 8.0
External Benchmarks
ABLE CHARLIECOMBINED
(Current)
5.0 7.2 6.2
“Able” & “Charlie” SoC
Privileged and Confidential
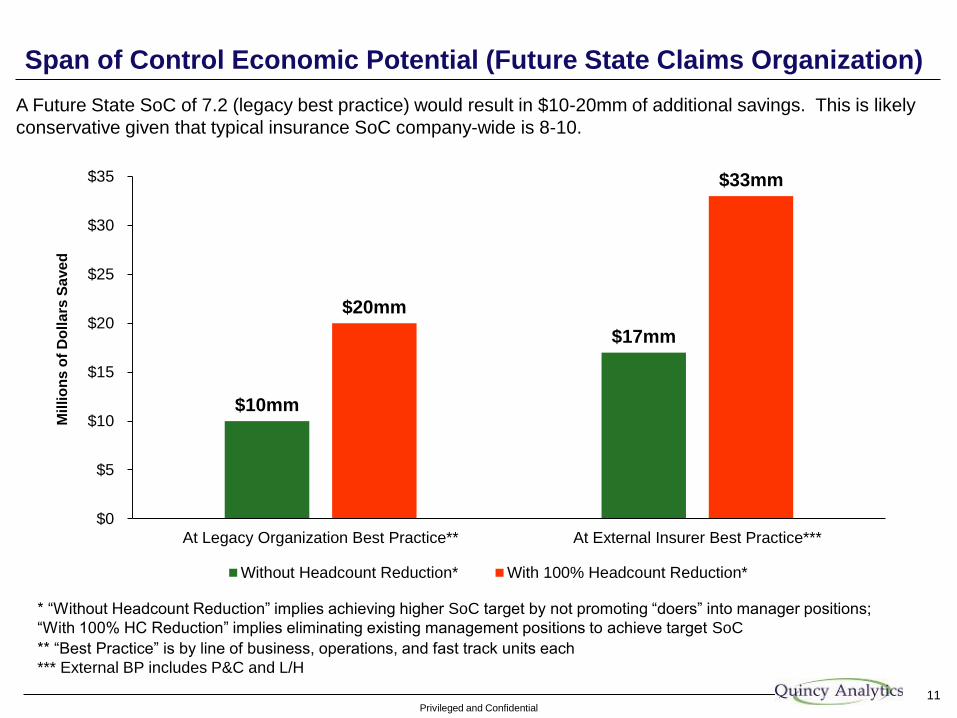
$10mm
$17mm
$20mm
$33mm
$0
$5
$10
$15
$20
$25
$30
$35
At Legacy Organization Best Practice** At External Insurer Best Practice***
Without Headcount Reduction* With 100% Headcount Reduction*
Span of Control Economic Potential (Future State Claims Organization)
11
* “Without Headcount Reduction” implies achieving higher SoC target by not promoting “doers” into manager positions;
“With 100% HC Reduction” implies eliminating existing management positions to achieve target SoC
** “Best Practice” is by line of business, operations, and fast track units each
*** External BP includes P&C and L/H
A Future State SoC of 7.2 (legacy best practice) would result in $10-20mm of additional savings. This is likely
conservative given that typical insurance SoC company-wide is 8-10.
Mil
lio
ns
of
Do
lla
rs S
ave
d
Privileged and Confidential
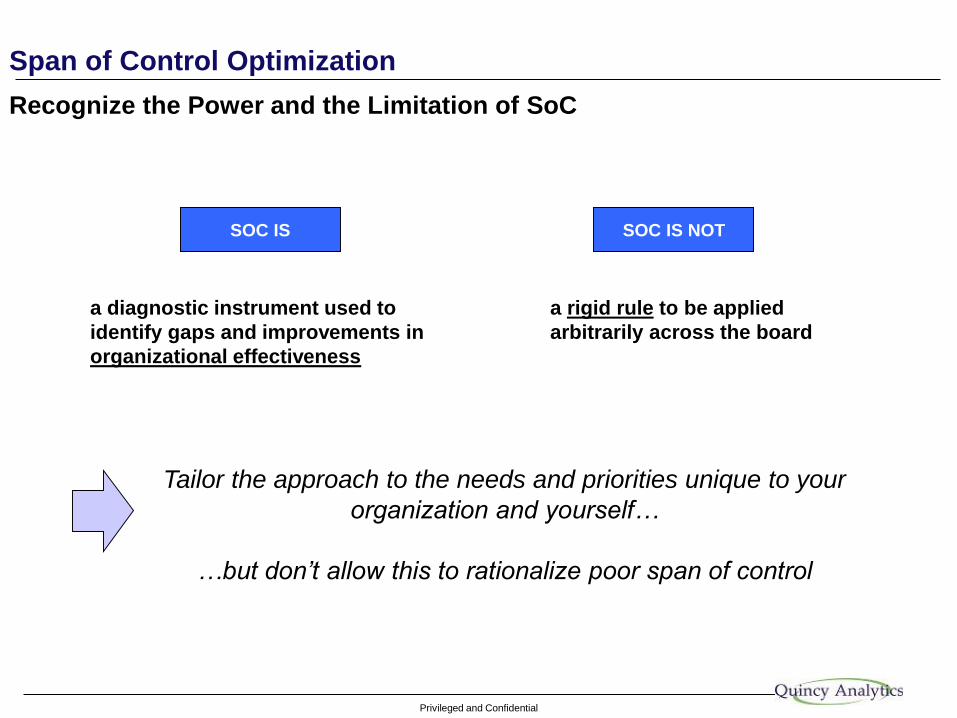
Span of Control Optimization
Recognize the Power and the Limitation of SoC
a diagnostic instrument used to
identify gaps and improvements in
organizational effectiveness
a rigid rule to be applied
arbitrarily across the board
Tailor the approach to the needs and priorities unique to your
organization and yourself…
…but don’t allow this to rationalize poor span of control
SOC IS SOC IS NOT
Privileged and Confidential
Span of Control Optimization
Key Principles
Start Bottom Up
Start with the front line – or ‘doer’ - layer, analyze what functions they perform, how many
managers there should be above them, and work your way up using benchmark spans of
control.
Eliminate “Busy” Work
Just because everyone is ‘busy’ does not mean that there are not opportunities to eliminate
layers. Typically many of the layers beget their own workload: additional review steps or
additional meetings and conference calls.
Focus on Positions
A manager with low SoC is not necessarily inefficient or lacking in capability, or should be
let go. Instead, understand how many manager ‘slots’ there should be, then finding the
proper managers to fill those slots. A talented person who happens to be in a low span of
control position can be redeployed to another position to replace another, less productive
individual.
Avoid “Cramming Down”
Care should be taken to avoid ‘cramming down’ senior staff into junior positions (effectively
removing a lower paid person to make way for a higher paid person). A good test is to
compare the compensation of all ‘doers’ at a certain level and make sure that
compensation is appropriate to the role. Another test is to confirm how many current
managers are being cut (rather than kept on board in another position).
Privileged and Confidential
The Quincy Analytics Approach
Ways in which we can support a Span of Control/De-Layering Initiative:
1. SOC Diagnostic:
Within as little as 10 business days of receiving an HRIS download, we can provide a comprehensive assessment of Span of Control improvement potential in aggregate as well as by senior executive, showing actual SoC by layer vs. benchmark and calculating the savings available by reaching benchmarks. We apply distinct benchmarks for each type of job function performed.
2. SOC Implementation:
We work with senior executives and their management teams to help reach the target SoCwith as little disruption to the organization as possible. The likelihood and necessity of headcount reduction can be a difficult process and we have experience supporting and mitigating (e.g. through attrition acceleration and early retirement initiatives) the “painful reality.” In addition, we use a variety of techniques such as unit consolidation, bottom up pyramiding, and function/job title consolidation to help executives find the best approach.
3. SOC Support:
We can provide a series of facilitated workshops to groups of individuals to help them deal with the standard challenges and objections to taking appropriate de-layering steps. We highlight the most common concerns and objections and illustrate ways to allay the concerns and counter reluctance to take action. Typically this is done once the diagnostic has been completed and certain individuals have been tasked internally to perform the de-layering work.


