1
Using the Emerald Ash Borer (EAB) Cost Calculator: A Case Study for Milford, Connecticut
Gabriela Doria & Chris Donnelly
Urban Forestry Program, Forestry Division Department of Energy and Environmental Protection
State of Connecticut 79 Elm Street, Hartford, CT 06106-5127
Phone: (860) 424-3178 Email: [email protected]
Website: www.ct.gov/deep/forestry

2
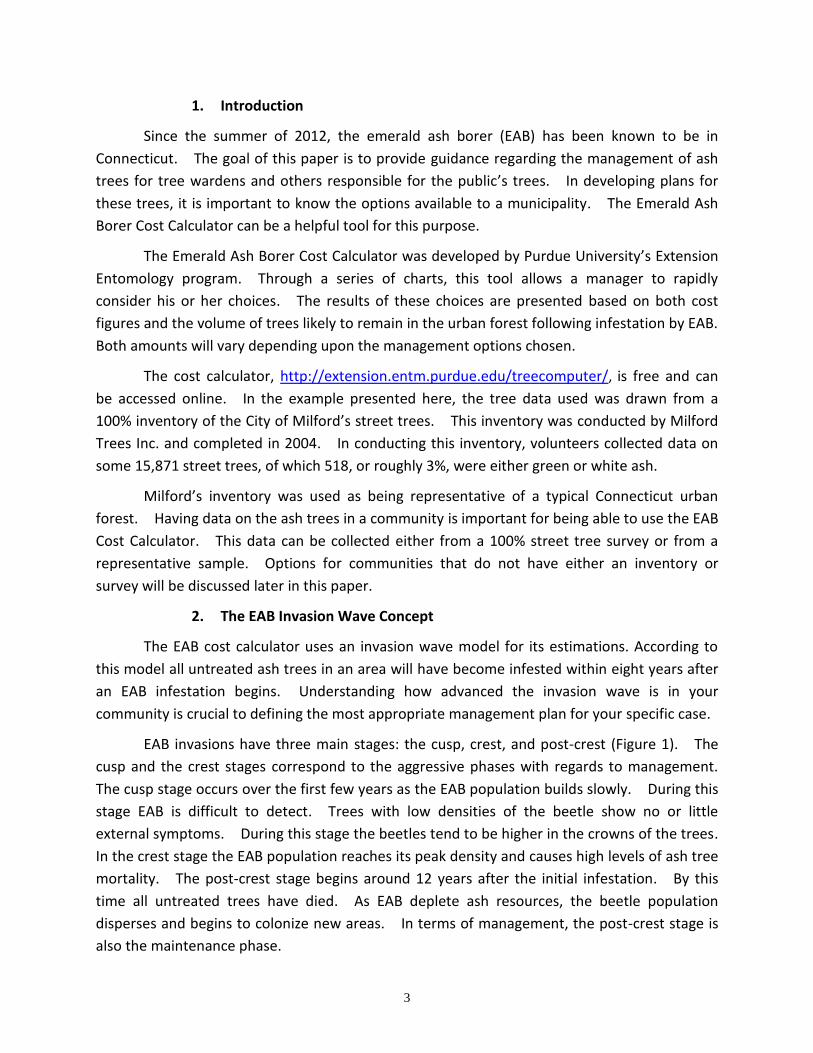
Plate I (opposite page). Life cycle of emerald ash borer (EAB). The biological characteristics of EAB
define the effects of the infestation in ash trees and forests. This paper introduces the use of the EAB
Cost Calculator, a web-based tool that considers aspects of the biology of EAB and its implications for
management of urban forests. EAB adults (upper left) lay eggs on bark crevices. Larvae (upper right)
hatch in about one week. Larva feed on the inner bark and phloem of the tree creating S-shaped
serpentine galleries (center left). Larvae go through four feeding stages and then excavate a pupal
chamber in the fall (center right showing overwintering larvae). Pupae (lower left) develop in late
spring. Adults emerge through D-shaped exit holes (lower right) in May and Early June. Upper left
image courtesy of Forestry Images. Photo credit Chris Donnelly and Gabriela Doria.
3
1. Introduction
Since the summer of 2012, the emerald ash borer (EAB) has been known to be in
Connecticut. The goal of this paper is to provide guidance regarding the management of ash
trees for tree wardens and others responsible for the public’s trees. In developing plans for
these trees, it is important to know the options available to a municipality. The Emerald Ash
Borer Cost Calculator can be a helpful tool for this purpose.
The Emerald Ash Borer Cost Calculator was developed by Purdue University’s Extension
Entomology program. Through a series of charts, this tool allows a manager to rapidly
consider his or her choices. The results of these choices are presented based on both cost
figures and the volume of trees likely to remain in the urban forest following infestation by EAB.
Both amounts will vary depending upon the management options chosen.
The cost calculator, http://extension.entm.purdue.edu/treecomputer/, is free and can
be accessed online. In the example presented here, the tree data used was drawn from a
100% inventory of the City of Milford’s street trees. This inventory was conducted by Milford
Trees Inc. and completed in 2004. In conducting this inventory, volunteers collected data on
some 15,871 street trees, of which 518, or roughly 3%, were either green or white ash.
Milford’s inventory was used as being representative of a typical Connecticut urban
forest. Having data on the ash trees in a community is important for being able to use the EAB
Cost Calculator. This data can be collected either from a 100% street tree survey or from a
representative sample. Options for communities that do not have either an inventory or
survey will be discussed later in this paper.
2. The EAB Invasion Wave Concept
The EAB cost calculator uses an invasion wave model for its estimations. According to
this model all untreated ash trees in an area will have become infested within eight years after
an EAB infestation begins. Understanding how advanced the invasion wave is in your
community is crucial to defining the most appropriate management plan for your specific case.
EAB invasions have three main stages: the cusp, crest, and post-crest (Figure 1). The
cusp and the crest stages correspond to the aggressive phases with regards to management.
The cusp stage occurs over the first few years as the EAB population builds slowly. During this
stage EAB is difficult to detect. Trees with low densities of the beetle show no or little
external symptoms. During this stage the beetles tend to be higher in the crowns of the trees.
In the crest stage the EAB population reaches its peak density and causes high levels of ash tree
mortality. The post-crest stage begins around 12 years after the initial infestation. By this
time all untreated trees have died. As EAB deplete ash resources, the beetle population
disperses and begins to colonize new areas. In terms of management, the post-crest stage is
also the maintenance phase.

4
EAB Cost Calculator management plans are based on two premises. As the infestation
begins and then when the EAB population is high (the cusp and crest stages), management
needs to be aggressive. During the post-crest stage, the inspection and treatment of the
remaining ash trees continues, but with the focus more on the maintaining of these remaining
trees than on the aggressive prevention of EAB becoming established and doing damage.
Figure 1. Emerald Ash Borer (EAB) Wave Infestation. Red arrow shows the approximate stage of infestation in Milford, CT. Adapted from EAB Cost Calculator website.
3. Using the EAB Cost Calculator
To use the EAB Cost Calculator it is best to have an inventory of the street tree
population in your municipality. A complete inventory is preferred, but a sample based survey
also works. The third alternative is to use an approach such as a ‘windshield survey’ of only
ash trees. The Cost Calculator is based on numbers, so the user will have to enter some
numeric input for the Calculator to work. The Cost Calculator does come with a set of
demonstration numbers. These allow the user to explore how the Calculator works and can
be modified if the user wishes to vary the scenarios. If you have inventory data, it can be
easily input into the calculator in just a few minutes. Simulations can be run immediately, and
interpretation of the results begun right away.
Milford, CT
5
If using local data, the user starts by entering the data on a municipality’s ash trees by
size class, using diameter at breast height (dbh). Inputting the distribution of tree sizes is
important because costs for treatment and removal vary by dbh. As size increases, insecticide
dosage increases and labor and equipment costs also rise. The EAB Cost Calculator does not
include maintenance costs beyond tree planting costs and EAB insecticide treatments specific
to individual options (Sadof et al., 2011).
To estimate the costs, the EAB Cost Calculator makes use of a range of inputs. Default
values can be used. However, inputting values reflective of your municipality will result in
more accurate economic analyses. The following values can be entered to the Calculator:
- Number of years over which the replacement/removal work will be completed
- Cost per dbh for insecticide treatments
- Frequency of insecticide applications during aggressive and maintenance phases of management
- Cost of replacing a tree
- Cost of removing a tree
- Discount rate
The calculator includes three simple strategies of management: (1) remove all trees, (2)
replace all trees and (3) treat all trees. It also includes eight options based on varying degrees
of these three simple strategies. You may also design new plans that might better fit your
municipality.
The EAB Cost Calculator represents the size of the urban forest size by calculating the
sum of all tree diameters. In the dbh total, the Cost Calculator includes both remaining ash
trees and any trees planted to replace ash trees, depending upon the option chosen. All trees
are assumed to grow at a constant rate. Costs and total dbh are each presented as an annual
total over a twenty-five year period, and also as a cumulative total over that same time period.
4. Milford’s Case
We used Milford’s tree inventory data to run simulations with the EAB Cost Calculator.
The results are an interesting illustration of factors to consider when selecting a management
plan.
Where the infestation is along the EAB invasion wave does influence the results. It
also allows one to predict how many trees will die or become hazardous at each point of time.
6
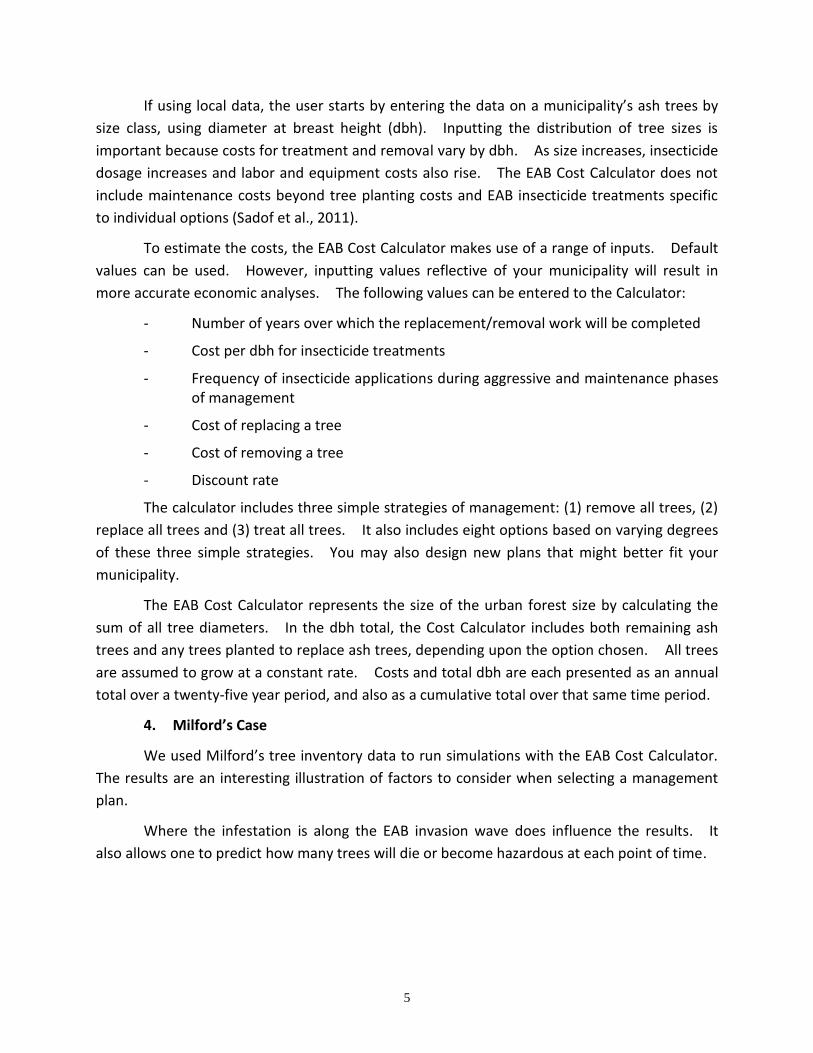
A
A B
C
Plate II. Symptoms of EAB infestation in ash trees include: branch dieback starting by the upper crown (A), s-shaped serpentine galleries in the bark (B), and epicormic branching on the tree trunk (C).
EAB was first detected in Connecticut in Prospect, New Haven County in 2012. Since
then it has been found in four counties and fifteen towns in the state. Hamden, in New Haven
County, 14 miles northeast of Milford, is the closest town with confirmed EAB. The first report
in Hamden is from May 2013.
On its own, an EAB infestation spreads at a rate of half a mile to one mile per year.
When carried by humans, such as in firewood, it can travel hundreds of miles in a very short
period of time. Connecticut towns where EAB is present (e.g. Hamden) are probably 3-4 years
into the infestation. All of these factors add up to a conclusion that EAB very likely is, or very
soon will be, present in Milford.
Hence, we chose “Year 0” as the starting point for our first simulation.
For our simulation we defined 10 dbh categories. For the most of the other inputs, we
used the default values suggested by the calculator. For replacement tree size we chose to
use trees 2.0” dbh and we used 5% for a discount rate on expenditures. We selected the most
inexpensive insecticide option (imidacloprid) and determined, when used, treatments will be
applied annually during the aggressive management phase (the cusp and crest stages - the first
12 years) and every three years during the post-crest stage.
We chose to run four options in our first simulation. These four were picked primarily
because the results differed enough that they provide a good contrast of what can be expected
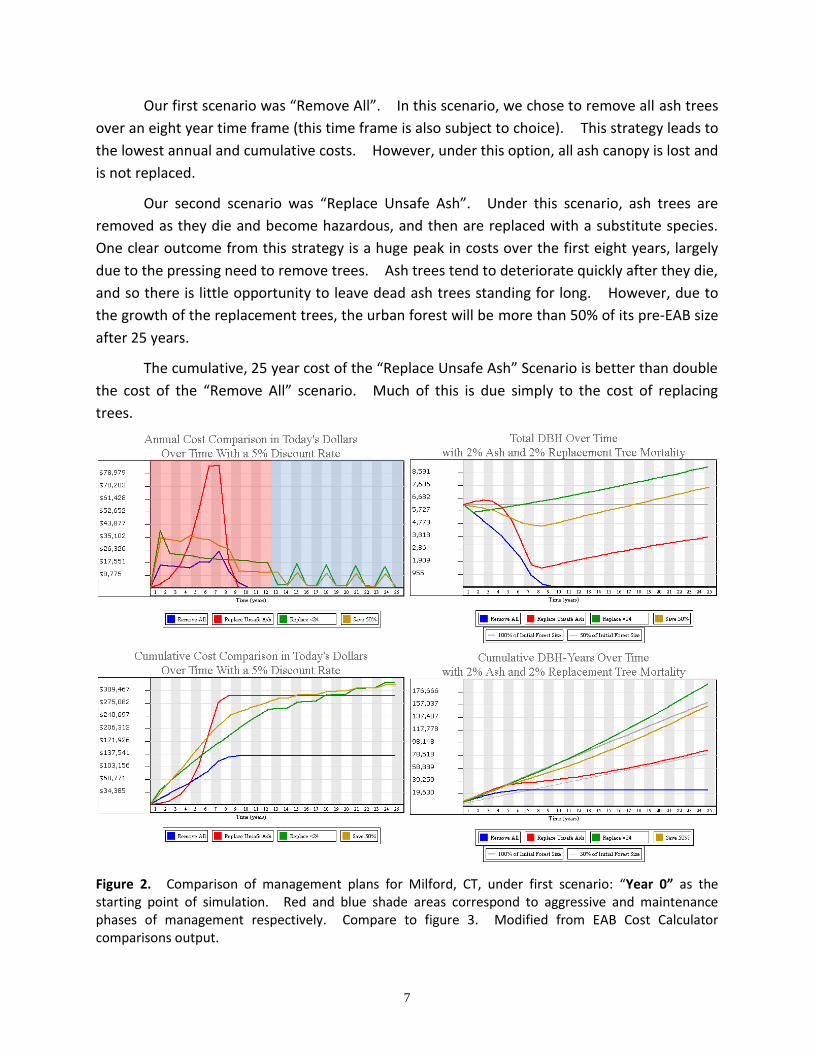
from the various options. The results are shown in the four charts depicted in Figure 2.
7
Our first scenario was “Remove All”. In this scenario, we chose to remove all ash trees
over an eight year time frame (this time frame is also subject to choice). This strategy leads to
the lowest annual and cumulative costs. However, under this option, all ash canopy is lost and
is not replaced.
Our second scenario was “Replace Unsafe Ash”. Under this scenario, ash trees are
removed as they die and become hazardous, and then are replaced with a substitute species.
One clear outcome from this strategy is a huge peak in costs over the first eight years, largely
due to the pressing need to remove trees. Ash trees tend to deteriorate quickly after they die,
and so there is little opportunity to leave dead ash trees standing for long. However, due to
the growth of the replacement trees, the urban forest will be more than 50% of its pre-EAB size
after 25 years.
The cumulative, 25 year cost of the “Replace Unsafe Ash” Scenario is better than double
the cost of the “Remove All” scenario. Much of this is due simply to the cost of replacing
trees.
Figure 2. Comparison of management plans for Milford, CT, under first scenario: “Year 0” as the starting point of simulation. Red and blue shade areas correspond to aggressive and maintenance phases of management respectively. Compare to figure 3. Modified from EAB Cost Calculator comparisons output.
8
The third option involves replacing all ash trees less than 24” dbh with substitute
plantings, and treating all ash trees 24” and greater with imidacloprid. Of the 518 ash trees in
Milford, 44 have dbh larger than 24”. One characteristic feature of this line on the chart is the
sawtooth pattern during the maintenance years, starting at Year 12. This is due to the
application of the insecticide to the remaining large ash trees, every third year for the
remainder of the scenario.
The other striking feature of this scenario is the “total dbh” at the end of 25 years. The
sum of tree dbh at this point is approximately 40% greater than was the original sum of ash dbh
prior to the infestation occurring. Of course, this comes at a cost. The cumulative cost for
this scenario at the end of 25 years is slightly greater than that of the “Replace Unsafe Ash
Scenario”.
These charts, of course, just outline two of the factors that would go into making a
decision. They highlight good reasons for considering a plan based on removing and replacing
smaller ash trees (<24 inches) and treating the larger trees (Kovacs, et al., 2010). From an
economics perspective, larger trees are of greater value. This value can be sustained with
treatment. The value of these trees is much greater than the treatment costs. Conversely,
removing and replacing small ash trees effectively exchanges the near-term benefits that would
come from the smaller ash trees for those that will come from the longer-living replacement
trees, without the need for EAB treatment. It is true that the cumulative cost of “Remove
<24” strategy is the highest in our comparison. However, the annual cost is relatively evenly
distributed during the 25 years of forest management, leading to easier budget projections.
The fourth alternative we considered was “Save 50%”. In this strategy half of the trees
in each size class would be treated and the other half would be replaced. Similar to “Remove
<24””, the “Save 50%” strategy illustrates the relative advantage of saving some of the
community ash trees. The outcome of this strategy is comparable, in terms of costs and
retained dbh total, to that of saving only the largest ash trees. However, the number of ash
trees from the original population preserved is much higher, at 259 trees compared to 44 in the
“Replace <24" strategy”. This is important as trees of various sizes could be deliberately
allowed to remain in certain specified areas (e.g. neighborhoods). Depending on the case,
considering which strategy would replace ash trees more equitably among the municipality’s
neighborhoods could be crucial to its acceptance.

9
Figure 3. Comparison of management plans for Milford CT under second scenario: “Year 4” as the starting point of simulation. Red and blue shade areas correspond to aggressive and maintenance phases of management respectively. Compare to figure 2. Modified from EAB Cost Calculator comparisons output.
We also explored the implications of a pro-active attitude versus a late response to the
infestation (Figure 3). We compared an infestation scenario where EAB has not yet been
detected (Year 0 of infestation – Figure 2) with a scenario in which response began after a
significant number of trees had become infested (Year 4 – Figure 3). We ran a second set of
simulations using the same treatment option but assuming implementation did not begin until
the fourth year of the infestation. This corresponds to the beginning of the crest phase when
about 8% of the ash trees are affected by EAB, and reduces the number of years of aggressive
removal from 12 to 8. We found that delaying the start of the response leads to higher short
term costs during the first years of management. This is because the cost of dealing with
massive die-back during the crest stage has to be compressed into four years instead of being
spread out over eight years. Interestingly, the long run cost of delaying the start of
management plan is lower. This is due to the fact that the time during which aggressive
insecticide treatment occurs is reduced by two years (Figure 3).
10
5. Integrating Tree Benefits
In comparing EAB management plans, it is important to consider the economic benefits
of the ash trees. Keeping mature ash trees and treating them with systemic insecticides can
produce gains in benefits that significantly exceed the cost of treatment.
Several tools are available to urban forest managers to quantify monetarily the
ecosystem services provided by urban trees. To estimate the monetary value of the benefits
provided by the current ash population in Milford we used i-Tree Streets (formerly known as
STRATUM, or the Street Tree Resource Analysis Tool for Urban forest Managers, available at
www.itreetools.org). This tool uses tree inventory data to quantify the dollar value of annual
environmental and aesthetic benefits provided by these trees. The benefits include energy
conservation, air quality improvement, carbon dioxide reduction, stormwater interception, and
increases in property value.
An ash population such as in the 2004 inventory of the City of Milford will produce
$64,418 in benefits per year. On average, that is $124.74 in benefits for each individual ash
tree. This model does not show the increase in benefits that would occur as these ash trees
increase in size over the course of twenty-five years, but the Emerald Ash Borer Calculator does
show that the cost for treating all ash trees in Milford in one year would be around $27,000, or
an average of $52 per tree.
The benefits produced by any one tree are in large part a function of the canopy volume
of that tree. As such, the benefits from a large tree are much greater than those from a tree
that is smaller in diameter and has a much smaller crown. This is another advantage of the
option modeled by the EAB cost calculator, in which all ash trees over 24" dbh are retained.
As the following table shows, keeping only these trees still allows the city to retain the majority
of the benefits from its ash tree population while giving time for the replacement trees to grow.
The 44 ash trees over 24” dbh in Milford represent 8.5% of the total ash tree population. This
sole fraction provides benefits worth $12,407 per year. This is almost 20% of the total
benefits that would provide the entire ash tree population ($64,418).

11
Table 2. Summary of the benefits provided by Milford’s ash tree population after removing
smaller ash trees (less than 24” dbh).
Annual Benefits of Milford's Ash Trees- After removing trees under 24” dbh ($/tree)
Species Energy CO2 Air Quality Stormwater Aesthetic/Other Total
Fraxinus americana $133.54 $3.71 $29.09 $42.29 $78.20 $286.84
Fraxinus pennsylvanica $129.25 $3.52 $27.77 $39.80 $75.84 $276.17
Average Fraxinus spp. $131.40 $3.62 $28.43 $41.05 $77.02 $281.51
Net Annual Benefits of Milford's Ash Trees-After removing trees under 24” dbh
Species Energy CO2 Air Quality Stormwater Aesthetic/Other Total
Fraxinus americana $3,204 $89 $698 $1,014 $1,876 $6,884
Fraxinus pennsylvanica $2,584 $70 $555 $795 $1,516 $5,523
Total Fraxinus spp. $5,789 $159 $1,253 $1,810 $3,393 $12,407
Table 1. Summary of the benefits provided by Milford’s ash trees population (all tree size
classes included)
Annual Benefits of Milford's Ash Trees ($/tree)
Species Energy CO2 Air Quality Stormwater Aesthetic/Other Total
Fraxinus americana $52.28 $1.07 $9.45 $11.63 $46.33 $120.76
Fraxinus pennsylvanica $57.02 $1.16 $10.25 $12.65 $47.64 $128.72
Average Fraxinus spp. $54.65 $1.12 $9.85 $12.14 $46.99 $124.74
Net Annual Benefits of Milford's Ash Trees- All ash trees
Species Energy CO2 Air Quality Stormwater Aesthetic/Other Total
Fraxinus americana $16,521 $339 $2,986 $3,674 $14,639 $38,160
Fraxinus pennsylvanica $11,632 $236 $2,091 $2,580 $9,718 $26,258
Total Fraxinus spp. $28,154 $575 $5,077 $6,254 $24,358 $64,418

12
6. Final Remarks
One clear lesson from the use of the EAB Cost Calculator is that it is not a good option to
simply wait to react to the insect after its arrival. Once ash trees die, they tend to fall apart
quickly and so need to be removed promptly to avoid their becoming a hazard. Waiting until
the emerald ash borer is known to be in a community means that the death of trees is apt to
drive the response. As the invasion wave concept chart shows, the rate of tree death
accelerates quickly. Although the wave occurs over about eight years, the presence of EAB is
typically not noted until the fourth or fifth year after the initial infestation. This means that
the period of intensive removal becomes concentrated into the about 4 or 5 years after the
infestation is noticed. Suddenly, resources need to be devoted to reactive tree removals while
other priorities are put on hold.
The EAB Cost Calculator also underscores the importance of having an inventory. For
planning purposes, it is important to know exactly how many ash trees a town is responsible
for. Inventories that include the location of individual trees facilitate monitoring for the
presence of EAB. Individual ash trees can be tracked and contractors, such as tree care
companies working for utilities, can be advised as to the location of ash trees and asked to
assist with the monitoring process.
If your municipality does not already have a 100% street tree inventory, there are other
options. For instance, an inventory of all trees in certain sections of town or along critical
streets and roadways could be used to focus attention on high priority areas. Specific
concerns can be noted and plans made for a scenic roadway or significant park in advance of
EAB’s arrival. Similarly, a sample survey, based on a selected number of street sections, can
be used to characterize the street tree population of the town as a whole. The researchers
behind i-Tree suggest that a 5% sample of the streets in a town should be sufficient to draw
some general conclusions, such as the total number of trees. One has to be careful when
using sample data to describe a sub-set of the larger population, but the results of a sample
survey can provide guidance as to the extent, condition and size distribution of the ash tree
population.
Another option, less formal than a full inventory or a sample survey, is to do what is
commonly called a ‘windshield survey’. Windshield surveys are usually performed using two
people, a driver and an observer. As the driver works his or her way through the streets of a
community, the observer takes notes on the size, condition and location of individual ash trees
throughout the community. As an alternative, a municipality could use information from
inventories from nearby municipalities. For example, towns near Milford could assume that
ash trees represent 3% of their street tree population.
Finally, EAB provides a great opportunity for public involvement. Individuals or groups
13
can be encouraged to ‘adopt’ individual ash trees, monitor them for indications that EAB is
present and then report their observations to some central location. This information can be
recorded formally, if desired. One of the more advanced technological tools being developed
for this sort of purpose can be used.
Each of these methods provides a means to make use of the EAB Cost Calculator based
on information on the extent of the ash population and, potentially, early recognition that EAB
is beginning to infest an area. Meanwhile, Connecticut’s Department of Energy and
Environmental Protection, the Connecticut Agricultural Experiment Station, the University of
Connecticut and the USDA Animal and Plant Health Inspection Service (APHIS) each continue to
support each other and local communities, as they seek to find where EAB is located in the
state and the extent of infestation. Communities are encouraged to keep up with the findings
of these state and federal agencies through regular visits to their websites and through
otherwise being aware of the information that is being shared.
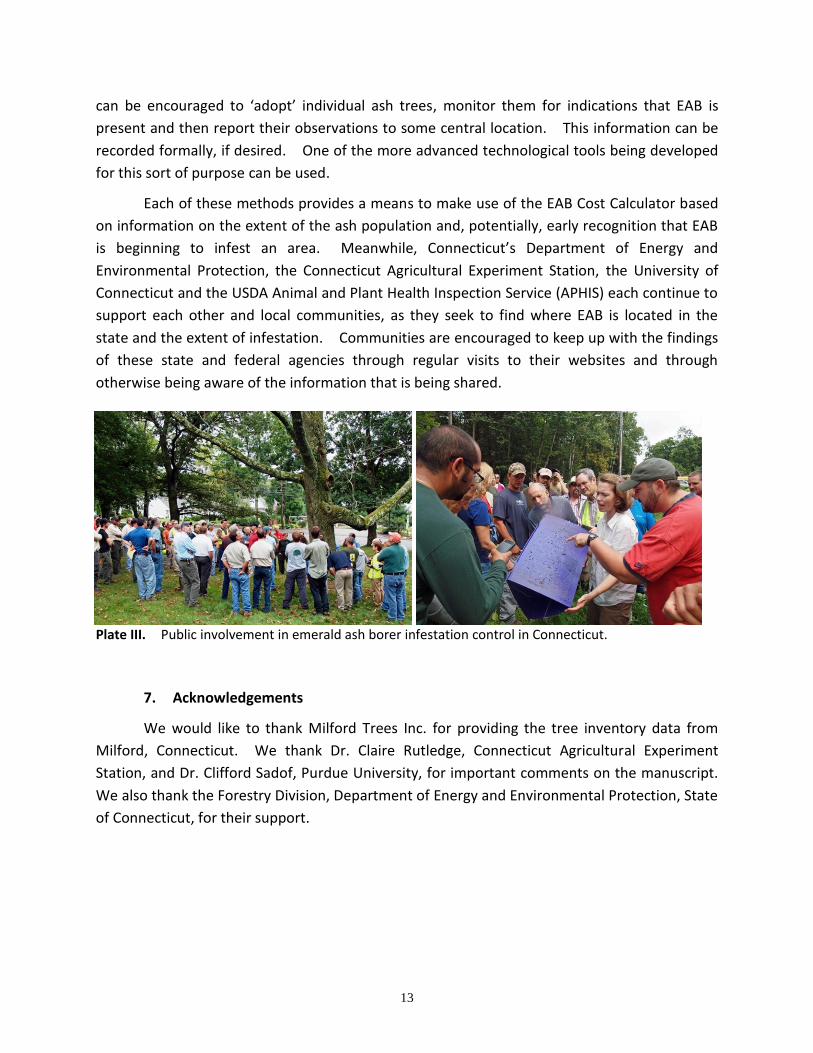
Plate III. Public involvement in emerald ash borer infestation control in Connecticut.
7. Acknowledgements
We would like to thank Milford Trees Inc. for providing the tree inventory data from
Milford, Connecticut. We thank Dr. Claire Rutledge, Connecticut Agricultural Experiment
Station, and Dr. Clifford Sadof, Purdue University, for important comments on the manuscript.
We also thank the Forestry Division, Department of Energy and Environmental Protection, State
of Connecticut, for their support.

14
8. References
Kovacs, K. F., Haight, R. G., McCullough, D. G., Mercader, R. J., Siegert, N. W., & Liebhold, A. M. (2010).
Cost of potential emerald ash borer damage in U.S. communities, 2009–2019. Ecological
Economics, 69(3), 569–578.
Sadof, C. S., Purcell, L., Bishop, F. J., Quesada, C., & Zhang, Z. (2011). Evaluating Restoration Capacity
and Costs of Managing the Emerald Ash Borer with a Web-based Cost Calculator in Urban
Forests. Arboriculture and Urban Forestry 37(2), 74–83.
9. On-line Resources
Department of Energy and Environmental Protection, State of Connecticut, EAB Educational Page, http://www.ct.gov/deep/eab
Connecticut Agriculture Experimental Station EAB Page, http://www.ct.gov/caes/eab
United States Department of Agriculture (USDA), - Animal and Plant Health Inspection Service
(APHIS), http://www.aphis.usda.gov/wps/portal/aphis/ourfocus/planthealth
Emerald Ash Borer Information Summary Web Site, http://www.emeraldashborer.info
Neighbors Against Bad Bugs, http://extension.entm.purdue.edu/eab
Dr. Richard Cowles, Connecticut Agriculture Experimental Station, Guidelines for preserving trees in
the presence of emerald ash borer, http://www.ct.gov/caes/eab
Coalition for Urban Ash Tree Conservation- EAB Management Statement ,
http://emeraldashborer.info/files/conserve_ash.pdf
Dr. Jeff Ward’s, Connecticut Agriculture Experimental Station, Summary of CT’s Roadside Tree
Population, http://www.cturbanforestcouncil.org/CUFCJeff.pdf
i-Tree Tools for Assessing and Managing Community Forests, http://www.itreetools.org
Firewood Movement and Regulations (DEEP page), http://www.ct.gov/deep/forestry


