
APPROVED:
Cloyd Hyten, Major Professor Richard Smith, Committee Member and Chair of
the Department of Behavior Analysis Sigrid Glenn, Committee Member Thomas Evenson, Dean of the School of Public
Affairs and Community Service Sandra L. Terrell, Dean of the Robert B. Toulouse
School of Graduate Studies
UTILIZING STAFF TRAINING METHODS FOR DEVELOPING A MATHETICS ERROR
CORRECTION PROCEDURE IN A UNIVERSITY CLASSROOM
Donald Michael Staff, B. S.
Thesis Prepared for the Degree of
MASTER OF SCIENCE
UNIVERSITY OF NORTH TEXAS
December 2008

Staff, Donald Michael. Utilizing staff training methods for developing a mathetics
error correction procedure in a university classroom. Master of Science (Behavior
Analysis), December 2008, 42 pp, 10 figures, references, 17 titles.
The education community agrees that correcting student errors is important for
learning. They do not agree on the components that define successful error correcting.
Some theories suggest that detailed feedback facilitates adult learning and some suggest
that less detail is needed for these learners. Gilbert (1962) applied the scientifically
derived methods of Behavior Analysis when designing instruction. This study attempted
to develop an efficient error correction procedure for university teachers. Throughout the
semester, error correction design efforts between the teachers and the experimenter
became more collaborative. While error correction procedures never showed systematic
effects on student grades, later versions were viewed more favorably by both teachers and
students and were more likely to be implemented accurately. Decreased teacher practice
opportunities, due to low student participation, may have decreased the procedure’s
effectiveness.

ii
Copyright 2008
by
Donald Michael Staff

iii
ACKNOWLEDGEMENTS
There are many individuals responsible for my passion and enthusiasm in
behavior analysis. Particularly, I would like to thank Dr. Richard Smith for his
encouragement and mentorship throughout my student career. I would like to thank Dr.
Manish Vaidya for teaching me the value of high standards and methodology in research.
I sincerely thank Dr. Cloyd Hyten for setting expectations for a high caliber of
professionalism, and showing me how science is part of everyday life. I am very grateful
to Drs. Glenn, Hyten, Smith and Vaidya for modeling merit in scientist-behavior. I am
also very appreciative to Drs. Hyten, Smith and Glenn for sitting on my thesis committee.
While working on this project, I received help from members of the TA/TF
system. I would like to thank Ethan Hahn for his assistance and diligence in data
collection throughout this project. I appreciate the patience of all the TFs that allowed me
to conduct research in their classes.
I am grateful to my friends and family who supported me during my graduate
education. First, I would like to thank Kris, Craig and Myia Staff for their love and
support. I would like to thank Martha Staff, my sister, roommate and best friend for
supporting and encouraging me. I would also like to thank my dearest friend and
companion Valori Berends for her support, professionalism and assistance throughout my
graduate career. Finally, I would like to thank my friends Shane Isley, Brandyn Williams,
Mathew Lucas, Ocie Vest, Stephen Walker, Jared Fuller and Chris Lockwood for
challenging, encouraging, and collaborating with me during my many years of education.

iv
TABLE OF CONTENTS
Page
ACKNOWLEDGMENTS ................................................................................................. iii
Chapters
1. INTRODUCTION .......................................................................................1
2. METHOD ....................................................................................................7
3. RESULTS ..................................................................................................14
4. DISCUSSION............................................................................................28
REFERENCES ..................................................................................................................42

1
CHAPTER 1
INTRODUCTION
The art of effective teaching follows a logical methodology, and teaching at the
college level requires particular sophistication and finesse. To be successful, an instructor
begins by clearly defining the goals of the instructional process to the learner (Merrill,
Tennyson, & Posey, 1992). Then, the instructor organizes instructional materials that
highlight the critical defining attributes of the concept being learned. Doing this allows
the instructor to sequence discrimination trials emphasizing the differences between
critical and non-critical attributes of the concept. Finally, Merrill et al. emphasized the
importance of objectively evaluating the instructional materials. The purpose of this step
is to determine the degree to which the learner can successfully label novel occurrences
of the concept, and thereby confirm that the instructional materials meet the goals and
objectives of the course of study. Evaluating the instructional materials on a regular basis
provides the instructor with feedback used to inform instructional changes.
Johnson and Johnson (1993) defined feedback as “information made available to
individuals that makes possible the comparison of actual performance with some standard
of performance.” That is, when the instructor knows the performance of a student, the
instructor can compare the student’s demonstrated ability with the desirable level of
achievement. Several studies have been conducted to empirically test feedback comp1nts
for young learners with and without disabilities. These studies suggested that learner
responses should be followed by verification of correct or incorrect responding,

2
and incorrect trials should be repeated (Albert-Morgan, Ramp, Anderson & Martin, 2007;
Alvarado-Gomez & Belfiore, 2000; Nelson, Alber & Gordy, 2004; Worsdell, Iwata,
Dozier, Johnson, Neidert & Thomason, 2005). The dependent variables being measured
in these experiments were overt verbal behavior such as reading or reciting foreign
words.
Smith, Mruzek, Wheat and Hughes (2006) taught 6 children with autism, ages
ranging from 3 to 7, to match words to their corresponding pictures. Smith et al.
separately tested 3 different error correction methods: 1) no feedback, 2) modeling and 3)
error statement. During the no feedback trials, the experimenters provided no corrective
feedback following student errors, and instead, followed incorrect responses with the
subsequent teaching trial. During modeling conditions, the experimenters demonstrated
the correct response following a student error. In the error statement trials, the
experimenters consequated incorrect student responses by saying “no,” and proceeding to
the next trial. Smith et al. found idiosyncratic effects of the error correction methods
among the 6 participants.
There are several theories concerning the amount and type of feedback necessary
to promote the most efficient learning of new material by college students. Some authors
believe that the more informative the feedback, the more effective it is as a teaching tool
(Nielson, 1990). Nielson’s data suggested that an increase in the amount of information
provided to college students during feedback instances significantly influenced posttest
performance. Other researchers have indicated that repeating incorrect learning trials can
intensify the effects of feedback methods (reference). This is conventionally labeled as

3
answer-until-correct (AUC). This additional error correction step adheres to a long-
standing principle of learning, which indicates that the last response made by a student
should be the correct one (Guthrie, 1935). In contrast, Merrill (1987) found that neither
isolation of critical concept attributes during feedback instances nor verification of
correct/incorrect and instructional passage repetition significantly increased college
students’ ability to recognize instances of fictitious science concepts.
As feedback design systems change through the advancement of educational
technologies, hybrid versions of these feedback methods begin to emerge with new
elements. For example, during the Teacher Survival Skills interactive videodisc (Caswell,
1989), students were provided with live models of the desired performance and feedback
detailing the accuracy of their imitation of the model’s behavior. Tribble-MacDonald
(1989) used a videodisc series called Employability Skills to teach students interview
techniques, appropriate business apparel, and social behaviors. These videos provided
students with rules and models exemplifying accurate examples of each of these skills.
After viewing the video, the students practiced the skills with feedback. According to
Hannafin, Hannafin, and Dalton (1993), these technologically advanced hybrid feedback
methods are “perhaps the most commonly used in learning settings” (p. 278).
Although all of these authors agree that feedback is an important instructional
piece during the initial learning of new concepts, there is still confusion surrounding two
of the dimensions of effective feedback. First, there is no consensus on the amount
and level of detail of feedback that is optimal when teaching adults. Some authors
indicate that adults require very little feedback during learning trials, while others suggest
4
that more feedback is necessary for learning to occur. Researchers also dispute which
feedback elements are critical for insuring learning in typically developing adults.
Second, until the critical comp1nts of effective feedback are fully identified, superior
feedback procedures for new teachers cannot be constructed. Without explicit direction
and guidance when managing and instructing students, first-time teachers are left to
determine best practices in teaching serendipitously.
As early as 1962, in the Journal of Mathetics, Tom Gilbert recognized the need
for a scientifically derived technology for teaching people. He called this educational
technology mathetics. Based mostly on the work of B. F. Skinner, mathetics is the
“systematic application of reinforcement theory to the analysis and reconstruction of
those complex behavior repertoires usually known as ‘subject-matter mastery,’
‘knowledge’ and skill’” (Gilbert, 1962, p. 8). Mathetics first provides an instructional
design guide. According to the mathetics model, there are several stages through which
an instructional sequence must progress in order to be complete. First, a thorough
description of the behaviors that comprise mastery performance is developed. This is
called the prescription. The prescription details only the behaviors needed for mastery
performance. Second, an example of the mastery performance is directly observed by the
instructional designer and described in behavioral detail. This stage is called development
of the domain theory. The domain theory is only relevant to the subject matter reflected in
the prescription. The third stage, characterization, describes the generalizations to be
taught, existing elements of the environment and the learner’s behavioral repertoire that
may be in competition with adequate performance, and the skills necessary to overcome

5
this competition. Finally, the instructional designer creates an exercise design. The
exercise design is “a formal specification of exercise structure and content” (Gilbert,
1962, p. 15). The exercise structures are derivatives of behavioral principles.
By applying the methodology of mathetics and conducting a comprehensive
behavioral analysis of the study habits of college students, Fox (1962) determined three
obstacles to good study habits: stimulus control, amount of reinforcement, and competing
reinforcers. First, study behaviors needed to be placed under tight and distinctive stimulus
control. Fox reported that students studied in irregular settings at various times of the day.
Therefore, studying any particular set of class materials was rarely, if ever, d1 in the same
way on subsequent occasions, making predictions of studying efficiency nearly
impossible. In order to rectify this, Fox changed study occasions so that good study habits
were more likely to happen. Fox also insured that these improved study habits would be
accomplished at a reasonable cost to the student while using few professionals and
reaching a large population of students. By using simple behavioral modification
principles (maximizing the use of available reinforcement, the principle of successive
approximations, and schedules of reinforcement) and aligning them with the subject
matter’s defined mastery performance, Fox was able to show measurable gains in the
efficiency of several students’ studying behavior. These results represented a general
method for improving self-instruction and showed significant improvements while using
little time and few resources. It was Fox’s assumption that these efficient behavior
change methods could be used to produce a studying instruction book that would serve
most students’ study needs.

6
The purpose of the current study was to use the strategies embodied in Gilbert’s
(1962) mathetics program to develop an efficient error correction procedure for college-
level teachers. By adhering to the definition of mathetics menti1d above, the use of
behavior analytic principles was an integral comp1nt of the design of an error correction
procedure used in a lecture format in a college course. The course, Behavior Principles I,
uses teaching fellows (TFs) to teach basic behavioral concepts across multiple sections.
The procedure will be referred to as the mathetics error correction procedure (MECP).
This study examined the effects of training TFs in the error correction procedure,
measuring both how well the TFs implemented the procedures during their lectures and
the effects that the MECP had on student quizzes and overall student grades. Because
this was the first systematic attempt to develop a standardized error correction procedure,
this study was more of a development and staff-training project than a well-controlled
experiment with fixed conditions. The error correction procedure was revised several
times based on TF and student feedback, and TF training became more collaborative as
the semester progressed.

7
CHAPTER 2
METHOD
Participants and Setting
During the fall 2007 semester, 5 University of North Texas (UNT) teaching
fellows (TFs) were divided into 1 of 3 groups according to teaching experience and class
meeting time: Experimental Group 1 (EG1), Experimental Group 2 (EG2), or non-
experimental group (NEG). Two of the TFs were assigned to EG1, 2 were assigned to
EG2, and 1 was assigned to the NEG. All 5 TFs taught the same undergraduate behavior
analysis class at UNT. Each TF had a student population between 25 and 35 students.
Each student was provided with a desktop computer they were to use during
quizzes and tests. Students were required to read 1 or 2 chapters from Principles of
Everyday Behavior Analysis (Miller, 2006), and complete 2 homework assignments
before the first day of each week. Classes were held on Monday, Wednesday and Friday
(MWF), Tuesday and Thursday (TTH), or Monday nights (M), depending on the class’s
section. EG1 and EG2 each consisted of 1 MWF class and 1 TTH class. The NEG held
class on M. During the first class meeting of each week, TFs discussed and extended the
chapter material read by the students by delivering a lecture accompanied by a
PowerPoint presentation. All TFs gave the same lecture, collaboratively created and
vetted by the TFs, their teaching assistants (TA), and the system’s supervisor (a Ph.D.-
level faculty member).

8
Students were asked to participate during the lecture by listening to the TF read
examples relating to the concepts being taught and vocally answering questions posed to
them by the TF. For example, a TF might read a fictional scenario and ask the students to
determine which behavior analytic procedure someone was using in the example.
The presentation was followed by an in-class exercise (ICE) intended to test and
extend the student’s understanding of the concept covered in the lecture. Students could
complete the ICE in groups or individually. These ICEs were graded by the TFs and TAs
and returned to each student at the beginning of the subsequent class meeting.
Following the return of students’ graded ICEs, all students were required to take a
10-question cumulative quiz using their computers, which covered all the concepts they
had learned thus far in the semester. All students were allowed to take each quiz twice,
and could receive individualized tutoring from their TAs between quiz attempts.
Procedure
MECP Version 1
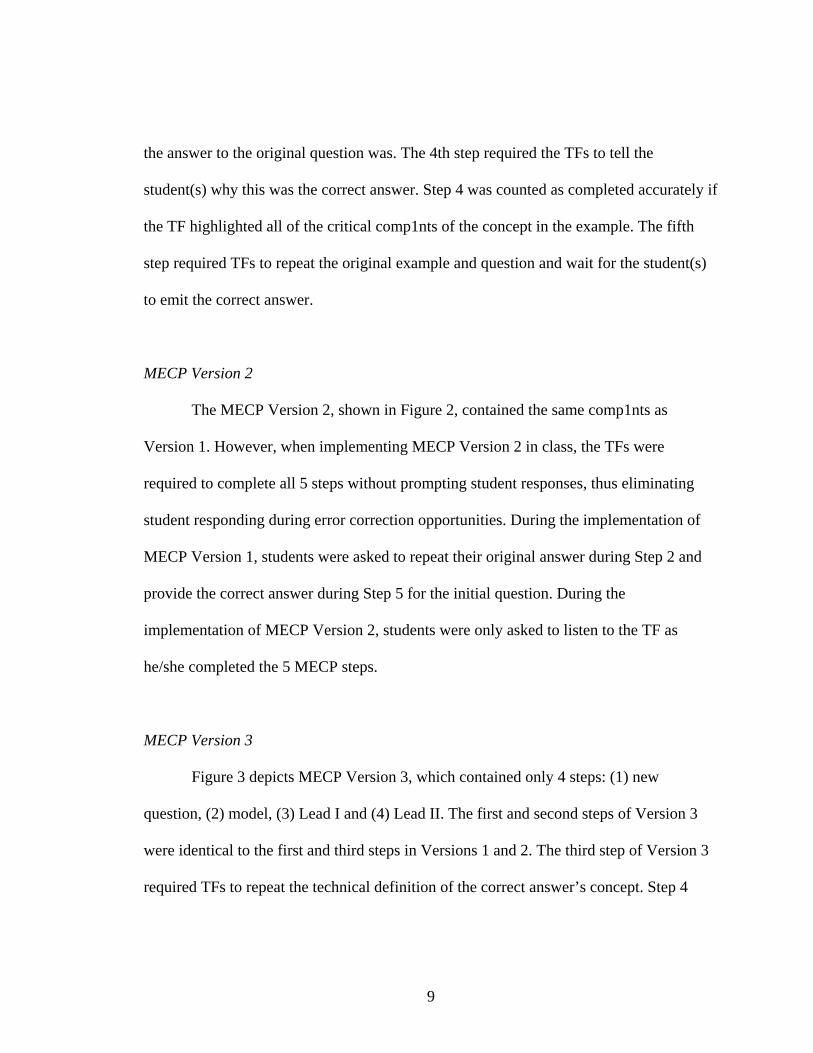
When a student incorrectly answered a question during the lecture, the TF was to
implement the mathetics error correction procedure (MECP). As shown in Figure 1, the
MECP Version 1 included 5 steps: (1) new question, (2) prompt, (3) model, (4) lead and
(5) test. Step 1 required TFs to reword the example and question posed to the student(s)
in a way that would increase the likelihood of a correct answer. Step 2 required TFs to
deliver a prompt for the student(s) to repeat the correct answer, at which point the TF
would deliver a praise statement. The third step required TFs to tell the student(s) what
9
the answer to the original question was. The 4th step required the TFs to tell the
student(s) why this was the correct answer. Step 4 was counted as completed accurately if
the TF highlighted all of the critical comp1nts of the concept in the example. The fifth
step required TFs to repeat the original example and question and wait for the student(s)
to emit the correct answer.
MECP Version 2
The MECP Version 2, shown in Figure 2, contained the same comp1nts as
Version 1. However, when implementing MECP Version 2 in class, the TFs were
required to complete all 5 steps without prompting student responses, thus eliminating
student responding during error correction opportunities. During the implementation of
MECP Version 1, students were asked to repeat their original answer during Step 2 and
provide the correct answer during Step 5 for the initial question. During the
implementation of MECP Version 2, students were only asked to listen to the TF as
he/she completed the 5 MECP steps.
MECP Version 3
Figure 3 depicts MECP Version 3, which contained only 4 steps: (1) new
question, (2) model, (3) Lead I and (4) Lead II. The first and second steps of Version 3
were identical to the first and third steps in Versions 1 and 2. The third step of Version 3
required TFs to repeat the technical definition of the correct answer’s concept. Step 4

10
required TFs to identify each of the concept’s critical comp1nts in the example shown in
the TF’s lecture.
Training
TFs in both experimental groups were trained to implement the MECP Version 1
during their office hours (the hour before the first class meeting of the week). Training
trials were split into remedial and advanced trial types by the experimenter. An equal
number of both trial types were presented randomly during training sessions. While
training EG1, the experimenter asked the TF a question that would later be posed to the
TF’s students. The TF then gave an incorrect answer, at which point the experimenter
modeled the correct implementation of MECP Version 1 Step 1. The TF then asked the
experimenter a different lecture question and the experimenter gave the TF an incorrect
answer. The TF was then asked to attempt Step 1 of the MECP. Following the TFs error
correction attempt, the experimenter gave the TF feedback detailing the accuracy of
his/her response.
After the TF correctly implemented Step 1, the experimenter modeled Steps 1 and
2. The TF then attempted Steps 1 and 2, and received feedback detailing the accuracy of
their response. This process repeated until the TF correctly implemented all 5 MECP
Version 1 steps in order. The TF was then advised to attempt using the MECP Version 1
in his/her classroom during the lecture.
The training protocol for EG2 was identical to EG1, except that the experimenter
did not model MECP Version 1 Step 4 (lead) or provide the TF with feedback concerning

11
the accuracy of Step 4, in order to experimentally test the learning impacts of Step 4 of
the MECP. The EG2 participants were provided only a verbal description of the
comp1nts of Step 4 and were asked to include it when error correcting during their
lecture. This provided the experimenter with a comparison of the effects of using
feedback to train TFs to implement Step 4. All TFs were considered proficient in delivery
of MECP Version 1 when they were able to accurately correct a simulated error during 4
advanced trials in a row during training. Training lasted approximately 50 minutes. TFs
were trained to implement Version 2 during a 1-hour workshop conducted by the
experimenter. This workshop included a full description of the MECP Version 2 and a
demonstration by the experimenter. All TFs were then asked to implement Version 2 in
the presence of the experimenter during mock trials types. The experimenter gave
feedback to those who required it.
MECP Version 3 was designed, trained, and implemented in the same way as
Version 2.
Experimental Design
All participants experienced 4 weeks of baseline trials, during which no training
of any MECP occurred. Before week 5, each TF was trained according to the protocol of
the experimental group to which they had been assigned. During the first phase of
training (Tell & Train), EG1 was required to accurately correct 4 advanced errors in a
row in order to move to the next phase: Stopped Training. The Stopped training was
constructed as a test for maintenance of skills, and did not contain MECP training.
12
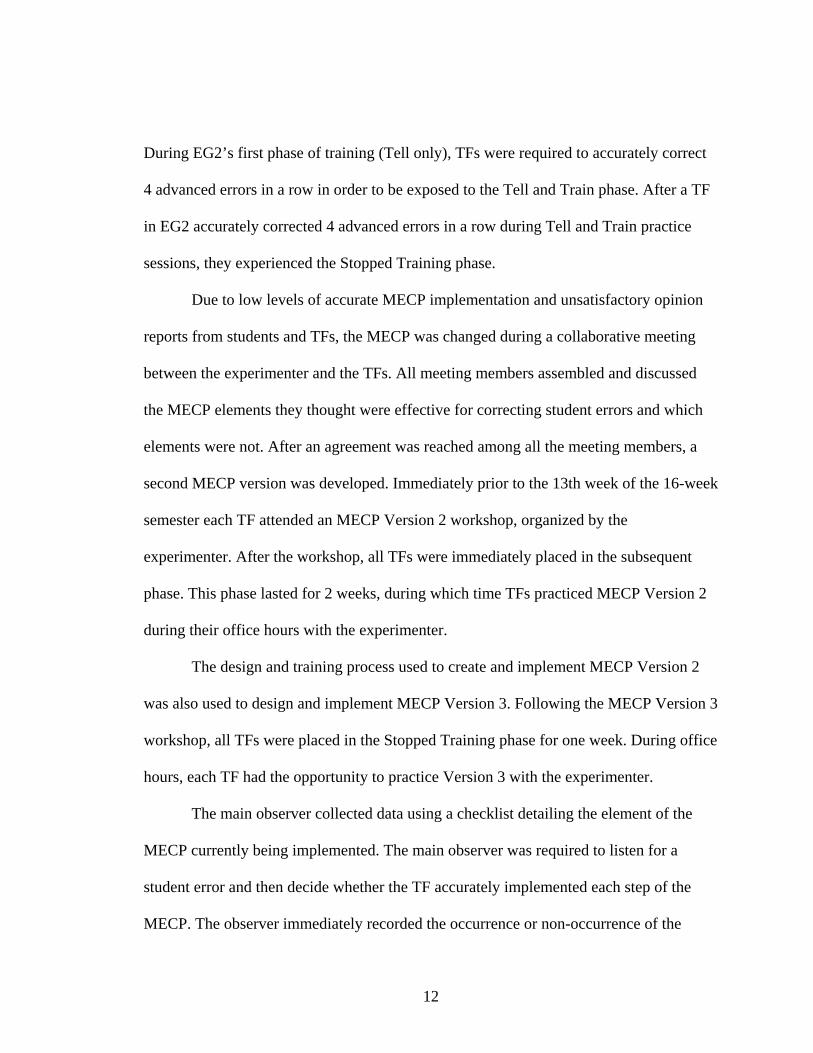
During EG2’s first phase of training (Tell only), TFs were required to accurately correct
4 advanced errors in a row in order to be exposed to the Tell and Train phase. After a TF
in EG2 accurately corrected 4 advanced errors in a row during Tell and Train practice
sessions, they experienced the Stopped Training phase.
Due to low levels of accurate MECP implementation and unsatisfactory opinion
reports from students and TFs, the MECP was changed during a collaborative meeting
between the experimenter and the TFs. All meeting members assembled and discussed
the MECP elements they thought were effective for correcting student errors and which
elements were not. After an agreement was reached among all the meeting members, a
second MECP version was developed. Immediately prior to the 13th week of the 16-week
semester each TF attended an MECP Version 2 workshop, organized by the
experimenter. After the workshop, all TFs were immediately placed in the subsequent
phase. This phase lasted for 2 weeks, during which time TFs practiced MECP Version 2
during their office hours with the experimenter.
The design and training process used to create and implement MECP Version 2
was also used to design and implement MECP Version 3. Following the MECP Version 3
workshop, all TFs were placed in the Stopped Training phase for one week. During office
hours, each TF had the opportunity to practice Version 3 with the experimenter.
The main observer collected data using a checklist detailing the element of the
MECP currently being implemented. The main observer was required to listen for a
student error and then decide whether the TF accurately implemented each step of the
MECP. The observer immediately recorded the occurrence or non-occurrence of the
13
MECP steps on a computer and saved the data to a ne2rk drive, thereby allowing the
experimenter remote access to the data. The experimenter then accessed those data and
transformed them using graphic displays of MECP implementation accuracy. These
graphs are described in detail in the following section.
Interobserver agreement (IOA) measures were conducted by an independent
observer. The primary and IOA observers simultaneously but independently observed
and recorded the TFs’ implementation of MECP. While recording the level of accurate
MECP implementation, the main and IOA observer indicated the presentation slide
during which the student error occurred. This allowed the experimenter to compare IOA
on accurate MECP implementation as well as student errors. The main observer’s and the
IOA observer’s data are displayed in detail in the following section.

14
CHAPTER 3
RESULTS
Quiz Performance
Student
Figure 4 shows the average number of correct student quiz answers on the first
quiz attempt for each class across 13 teaching modules. The maximum number of correct
responses any student could emit per teaching module was 10, with the exception of the
midterm and final for which there were 25 possible correct responses. The y-axis scale
extends only to 10 so that the reader can easily notice differences between the average
numbers of correct student quiz answers across the majority of teaching modules. Each of
the data bars has a number in the bottom center of the bar indicating the exact value of
the data bar. The y-error bars show 1 standard deviation from the mean.
Non-experimental Group
The top graph in Figure 4 shows the average number of correct student quiz
answers for the students in the non-experimental group taught by teaching fellow T001.
On average, 33 students in T001’s class completed the first attempt of each quiz across
teaching modules. As seen in the graph, mean scores ranged from 7.7 to over 8 in the
first 5 modules prior to the midterm exam. There was a decrease in the average number
of correct student answers following the midterm, as well as an increase in the amount of

15
variation from the mean score. There was a slight decrease in the average number of
correct student quiz scores during the final in comparison to the midterm.
Experimental Group 1
The second panel in Figure 4 shows the average number of correct student quiz
answers made by the students in T002’s class. At the top of that graph all experimental
phases are labeled. Subject T002 experienced both the Tell Only Version 1 and the Tell
& Train Version 1 before progressing to the training stopped phase, followed by Versions
2 and 3. On average, 35 students in T002’s class completed the first attempt of each quiz.
This graph does not show a systematic change in the number of correct student answers
following the implementation of any particular mathetics error correction procedure
(MECP) version. Unlike T001, there was not a decrease in the average number of correct
student answers until the interval schedules module. Similar to T001, there was an
increase in the amount of standard deviation following the midterm and a decrease in the
average number of correct student answers during the final when compared to the
midterm.
The third panel of Figure 4 shows the average number of correct student quiz
answers made by the students in T004’s class. Subject T004 experienced both the Tell
Only Version 1 and the Tell & Train Version 1 before progressing to the Training
Stopped phase, followed by Versions 2 and 3. On average, 33 students in T004’s class
completed the first attempt of each teaching module’s quiz. This graph does not show a
systematic change in the number of correct student answers following the implementation

16
of any MECP version. Unlike T001 and T002, there was not a systematic decrease in the
average number of correct student answers until the punishment module and there was
not a significant change in the amount of standard deviation across teaching modules.
Experimental Group 2
The 4th panel in Figure 4 shows the average number of correct student quiz
answers made by the students in T003’s class. The text boxes below the x-axis show
which TF was responsible for teaching that week’s module. Unlike the subjects in
Experimental Group 1, subject T003 experienced only the Tell & Train Version1 before
progressing to the Training Stopped phase, followed by Versions 2 and 3. On average, 40
students in T003’s class completed the first attempt of each teaching module’s quiz. This
graph does not show a systematic change in the number of correct student answers
following the implementation of any version of MECP. Similar to T004, there was a
decrease in the average number of correct student responses during the quiz that covered
the punishment module. After training of Version 1 was completed there was a slight
increase in the amount of standard deviation from the class mean quiz scores. There was
a decrease in the average number of correct student answers during the final when
compared to the midterm. Similar to T001 and T004, the lowest average numbers of
correct student quiz answers were observed during the punishment and negative
reinforcement modules.
The bottom panel of Figure 4 shows the average number of correct student quiz
answers made by the students in T005’s class. Unlike subjects in Experimental Group 1

17
(T002 and T004), subject T005 experienced only the Tell & Train Version1 before
progressing to the Training Stopped phase, followed by Versions 2 and 3. On average, 30
students in T003’s class completed the first attempt of each teaching module’s quiz. This
graph does not show a systematic change in the number of correct student answers
following the implementation of any version of MECP. Unlike the other subjects, T005’s
students did not show significant decreases in average number of correct quiz answers
during any particular teaching module. There were slight decreases in average number of
correct student quiz answers during the punishment and negative reinforcement modules;
however, this decrease was less than the decrease seen across other subjects’ classes. No
significant change in the amount of standard deviation from the mean number of correct
student answers was seen for T005’s students. Similar to other subjects’ student’s
performance, the average number of correct answers on the final was slightly lower than
midterm levels.
In summary, the graphs in Figure 4 show declining trends in student scores in the
modules after the midterm. This was evident in the non-experimental group as well as all
of the experimental groups. Whatever the cause of these lower scores, the error
correction routines did not seem to prevent the decline.
Teaching Fellows
Non-experimental Group
Figure 5 shows T001’s MECP performance during lecture across teaching
modules. The top graph shows the number of student errors on the y-axis and the

18
teaching modules across the x-axis. The individual data cells detail the TF’s (T001)
performance given a particular student error. The key located directly below the top
graph tells the reader how to interpret the cell coloring within the graph. For every
student error there is 5 cells on the graph corresponding to each MECP Version 1 step
that could have been completed. These 5 steps are identified in the key in the order they
appear on the graph. On the right side of the key is a shading key that defines the cell
colors. According to the key, if the TF correctly completed a MECP step the cell
corresponding to that step was shaded grey. Any MECP step that was omitted or
incorrectly executed by the TF was left unfilled. According to the key and the graph axes,
there were three student errors during the basic concepts teaching module. Following
those three errors, the TF did not correctly complete any of the MECP steps. During the
midterm review, the data collector recorded eight student errors and no MECP steps were
correctly emitted by the TF. The lecture during which there was the largest number of
student errors was the negative reinforcement lecture. The TF correctly executed the first
step (new question) following the ninth student error. This graph also indicates times
when data were not collected during the extinction lecture and there were no student
errors during the coercion lecture. This graph shows that the T001 accurately
implemented only one step (new question) of the MECP throughout the analysis, and
implemented that step only twice of x opportunities.
The bottom graph of Figure 8 shows this participant’s overall accuracy of MECP
implementation across teaching modules. This graph is a summary of the top graph. It
shows a comparison between the number of correct and incorrect MECP steps completed

19
by the TF for each teaching module. The numbers above the data bars indicate the exact
value of the bar. The solid black data bars indicate the number of incorrect or un-
attempted MECP steps recorded by the data collector during a lecture, while the grey data
bars indicate the number of accurately completed MECP steps executed by the TF during
their lecture for each teaching module. Both of these graphs show that the TF accurately
implemented the MECP during .68% of trials across the entire study (2 accurate
responses out of a possible 268 opportunities). One of the accurate MECP responses
emitted by the TF was following the ninth student error during the lecture delivered by
the TF at the beginning of the negative reinforcement teaching module. The second
accurate MECP response emitted by the TF was following the 4th student error during
the lecture delivered by the TF during the final review.
Experimental Group 2
Figure 6 shows the number of student errors and the accuracy of the Teaching
Fellows’ (T003 & T005) MECP performance during class lectures across teaching
modules. The numbers on the y-axis indicate the number of student errors. For modules
in which IOA data were collected, IOA data are shown to the left of the primary data
collector’s results. Across the top of the top graph in Figure 6 are text boxes identifying
the phases that both subjects experienced throughout the experiment. The key at the
bottom right of the figure lists the MECP Version 3 steps and details the coloring code
for accurate MECP step execution. The key at the bottom left of the figure can be read as
described in Figure 2.

20
The top graph in Figure 6 shows the number of student errors and the accuracy of
subject T003’s MECP performance during class lectures across teaching modules. Across
the x-axis are ‘A’ and ‘B’ text boxes identifying the TF responsible for delivering that
module’s lecture and correcting student errors during lecture delivery. T003B presented
the lecture for the reinforcement module. The primary data collector recorded 5 student
errors and zero accurate Version 1 MECP steps. During the same lecture, the IOA data
collector recorded 7 student errors and zero accurate Version 1 MECP steps. Together,
T003A and T003B showed an increase in accurate MECP implementation from 0% (0
out of 55) during baseline to 38.5% (82 out of 213) average accuracy during subsequent
phases. While implementing the MECP, participants T003A and T003B showed an
increase in accuracy from 0% (0 out of 55) during baseline to 45.5% (50 out of 110)
following initial training of MECP Version 1 (Tell & Train). T003A and T003B’s MECP
accuracy decreased to 34.5% (19 out of 55) during the Version 1 evaluation phase
(Stopped Training). Their accuracy of implementation of Version 2 and Version 3, by
T003A and T003B collectively, was 15% (6 out of 40) and 87.5% (7 out of 8),
respectively. T003A showed the greatest accuracy of implementation of the MECP when
implementing version 3.
According to Figure 6, T003’s students made the largest number of errors during
the Negative Reinforcement module lecture. T003 correctly followed 5 of those student
errors with MECP steps. Following the first student error, T003B correctly implemented
the first (New Question) and third (Model) steps of the MECP. T003’s students emitted
two errors during the final review and T003A accurately followed both of those errors

21
with MECP steps. Following the first student error, T003A accurately implemented all 4
Version 3 MECP steps. Following the second student error, T003A accurately executed
the first three Version 3 MECP steps.
The bottom graph in Figure 6 shows the number of student errors and the
accuracy of subject T005’s MECP performance during class lectures across teaching
modules. T005’s highest number of student errors occurred also during the Negative
Reinforcement and Punishment module’s lectures. T005 more accurately followed
student errors with MECP steps when implementing MECP Version 2 than when
implementing Version 1. The primary data collector reported that T005 accurately
implemented 23 out of 25 Version 2 MECP steps during the lecture given in the Negative
Reinforcement module. The IOA data collector reported one more student error during
the Punishment module than did the primary data collector. The graph shows that when
the two data collectors observed the same student error, they had high levels of
agreement concerning the accuracy of T005’s MECP performance. This graph shows that
T005’s accuracy of MECP implementation increased from 0% (0 out of 40) during
baseline to 64.57% (82 out of 127) during subsequent phases. While implementing the
MECP, participant T005 showed an increase in accuracy from 0% (0 out of 40) during
baseline to 45.7% (16 out of 35) following initial training of MECP Version 1 (Tell &
Train). T005’s MECP accuracy increased to 66.7% (30 out of 45) during the subsequent
Version 1 training evaluation phase (Stopped Training). The accuracy of implementation
of Version 2 and Version 3 was 74.3% (26 out of 35) and 83.3% (10 out of 12),

22
respectively. T005 showed the greatest accuracy of implementation of the MECP when
implementing Version 3.
Experimental Group 1
As shown in Figure 7, T002’s MECP implementation accuracy increased from
1% (1 out of 100) during baseline to 27.41% (88 out of 321), average accuracy, during
subsequent phases. Participant T002 showed an increase in accuracy from 1% (1 out of
100) during baseline to 23.4% (34 out of 145) following initial training of MECP Version
1 (Tell Only). After being exposed to the Tell & Train phase, T002 accurately
implemented the MECP during 25% (5 out of 20) of opportunities. T002’s MECP
accuracy decreased to 21.3% (17 out of 80) during the subsequent Version 1 training
evaluation phase (Stopped Training). The accuracy of implementation of MECP Version
2 and Version 3, by T002, was 36.7% (22 out of 60) and 62.5% (10 out of 16),
respectively. T002 showed the greatest accuracy of implementation of the MECP when
implementing Version 3. The students in T002’s class had the overall highest number of
errors compared to the other classes.
As shown in the bottom graph of Figure 7, T004 showed an increase in
implementation accuracy of the MECP from 0% (0 out of 60) during baseline to 43.84%
(96 out of 219) during subsequent phases. While implementing the MECP, participant
T004 showed an increase in accuracy from 0% (0 out of 60) during baseline to 39% (41
out of 105) following initial training of MECP Version 1 (Tell Only). After being
exposed to the Tell & Train phase, T004 accurately implemented the MECP during 20%

23
(1 out of 5) of opportunities. T004’s MECP accuracy increased to 44.4% (20 out of 45)
during the subsequent Version 1 training evaluation phase (Stopped Training). The
accuracy of implementation of Version 2 and Version 3, by T004, was 50% (30 out of
60) and 100% (4 out of 4), respectively. T004 showed the greatest accuracy of
implementation of the MECP when implementing version 3.
Figure 8 shows the overall accuracy of MECP implementation for all
experimental group TFs across teaching modules. The data shows the number of correct
and incorrect MECP steps implemented by the TF during each teaching module’s lecture.
The black data bars represent incorrect or skipped MECP steps and the light grey bars
represent the number of correctly implemented MECP steps. The numbers above each
data bar show the exact value of the bar.
During baseline, all subjects emitted zero or very few correct MECP steps during
their lectures. All subjects showed an increase in correct MECP steps implemented
during intervention phases. Subject T002 only showed a higher number of correctly
implemented steps compared to incorrectly implemented steps during the Version 3
phase. Subjects T004 and T003 consistently emitted accurate MECP steps during the
Version 3 phase. Subject T005 was the only subject to regularly show a higher rate of
correctly implemented MECP steps compared to incorrectly implemented steps following
baseline.

24
Satisfaction Surveys
Student
Students were given two opinion surveys throughout the semester. One survey
was given in the middle of the semester, during the stopped training phase, and the same
survey was given again at the end of the semester, after the final review. The students
were asked whether they liked the MECP, how it affected their grades, and whether they
would like to see it used in other classes in the future. Students were asked to rate their
opinions using a 5-point scale. Figure 9 shows the average class rating for each survey
question. The light grey data bars show the average class rating per survey question on
the first survey given to the students. The white data bars show the average class rating
per survey question on the second survey given to the students. The survey questions are
detailed along the x-axis. The text boxes specify the answer options per survey question.
The y-error bars show 1 standard deviation from the class mean score.
When asked “How do the error correction methods the TF uses in your class
affect your ability to understand the material being taught?” the students in T003’s class
said that the error correction procedures used in their class slightly helped them
understand the material being taught (mean score just above 4). These students answered
that question in the same way on both surveys. The first time the students in T003’s class
were asked “To what degree do you like the error correction methods used in this class?”
they responded with a rating of 3.93, indicating that they were closer to indicating they
liked it than not caring about it. The second time the students were asked this same
25
question, on average, they rated it a 4.13, suggesting that they liked the later error
correction procedures more than the first MECP version.
The students in T002, T004 and T005’s classes gave slightly lower scores on the
second survey than on the first. In all three classes, more students indicated that they
liked the first version of the MECP more than later versions. However, the students in
T004’s class said they were more likely to suggest one of the later MECP versions to
future teachers compared to MECP Version 1. When asked if they would use the MECP
procedure in classrooms they taught, T004’s class said they were equally likely to use
either version. When the students in T005’s class were asked if the MECP procedure
affected how well they did on quizzes, these students said the later MECP versions
helped slightly more than the first MECP version.
Teaching Fellows
TFs were given two opinion surveys throughout the semester. One survey was
given in the middle of the semester, during the evaluation phase, and the same survey
was given again at the end of the semester, after the final review. The TFs were asked
whether their students liked the MECP, how it affected their student’s grades, and
whether they would use the procedure in other classes in the future. TFs were asked to
rate their opinions using a 5-point scale. Figure 10 shows the TFs’ rating for each survey
question. The light grey data bars show the TFs’ ratings on the first survey and the white
data bars show the TFs’ ratings on the second survey. The second graph from the top
show the scores given by subject T003. Because subject T003 is composed of 2 TFs, each

26
TF’s ratings are shown. The black data bars show TF_A’s ratings on the first survey and
the white bars show TF_A’s ratings on the second survey. The light grey data bars show
TF_B’s ratings on the first survey and the dark grey bars show TF_B’s ratings on the
second survey. The survey questions are detailed along the x-axis. The text boxes specify
the answer options for each survey question.
T002 indicated that the error correction procedures used in the last part of the
semester were more likely to affect their student’s grades and more likely to be liked by
their students than the procedures used earlier. The score of 2 indicated that this TF felt
that the first error correction procedure slightly hindered student performance. This TF
felt that the last error correction procedure helped students a great deal. The TF answered
all the other questions on the survey the same way both times.
T003, TF_A, answered the first three questions the same way on both surveys, but
indicated that the time put into learning the later MECP versions was a better use of their
time compared to the MECP Version 1. This TF also stated that they were more likely to
use one of the later MECP versions in the future than MECP Version 1. T003, TF_B,
rated the later MECP version higher than MECP Version 1. All the TFs, except T003
TF_B, said their students liked the later version of the MECP more than Version 1.
T004 indicated that the workshop style training they received for the later MECP
versions was more helpful than the 1-on-1 training they received for MECP Version 1.
This TF also thought their students liked the later MECP version better than the first one.
T004 rated all other survey questions the same on both surveys. T005 was the only TF to
give a lower rating score for a question on the second survey. This TF said that the

27
training they received for MECP Version 1 was slightly superior to the training received
for later MECP versions. This TF indicated that all MECP versions were equally likely to
help student’s grades. T005 indicated that their students liked the later MECP versions
better than Version 1, that the time invested into implementing the later version was a
better use of their time, and that they were more likely to use the later MECP version in
the future than Version 1.
In general, all TFs rated the later MECP procedures higher than the first one. 4
out of 5 TFs said that their students liked the later MECP version better than Version 1. 4
out of 5 TFs indicated that n1 of the MECP versions were any more likely to affect
students’ grades than another one.
Interobserver Agreement
The primary and IOA observers agreed on the occurrence of MECP steps 67% of
the time across all MECP versions and all 5 TFs. When observing T002, the IOA and
primary observer agreed on the occurrence of MECP steps 72% of the time across all
MECP versions. When observing T003, the IOA and primary observer agreed on the
occurrence of MECP steps 58% of the time across all MECP versions. When observing
T004, the IOA and primary observer agreed on the occurrence of MECP steps 60% of the
time across all MECP versions. When observing T005, the IOA and primary observer
agreed on the occurrence of MECP steps 83% of the time across all MECP versions.

28
CHAPTER 4
DISCUSSION
The implementation of the mathetics error correction procedure (MECP) did not
significantly affect student quiz performance regardless of MECP version. No significant
or systematic difference in accurate MECP implementation or student quiz grades was
seen between Experimental Group 1 (EG1), Experimental Group 2 (EG2) and the non-
experimental group (NEG). An increase in the accuracy of the implementation of the
MECP Version 3 was seen for all 4 experimental group teaching fellows (TFs) and not
seen for the NEG group. TFs reported valuing MECP Version 3 more than MECP
Version 1. The students, on average, did not report differentially valuing any particular
MECP version. Students did, however, rate error correction procedures as generally
favorable.
Changing one small variable (the lead step of the MECP) while teaching basic
behavior analytic principles did not affect the majority of student’s quiz performances.
The addition of a systematic and consistent error correction procedure to the teaching
methods used in these classes did not seem to have a significant effect on any critical
teaching outcomes (quiz scores or overall student grades). The lack of intervention
effects could be due to several variables. First, the error correction procedures might have
had interactions with other teaching module elements. These interacting elements might
include, but are not limited to: required homework, the lecture delivered by the TF, in
class exercises (ICEs) and/or discussion of behavior analytic concepts with TFs, teaching

29
assistants (Tas) and peers. When the MECP was integrated with these teaching module
elements as a total teaching package, the MECP did not seem to be a significant
contributor to learning. Second, the training procedures used in the current project did not
appear to be sufficient to lead to consistent implementation by the TFs for Versions 1 and
2 of the MECP. TF satisfaction data suggests that TFs may not have been motivated to
use the early version error correction procedures because they found them cumbersome.
Without “buy-in” from the staff, even a more rigorous training protocol might not have
been sufficient to promote implementation. With poor implementation fidelity, it is not
surprising that student outcomes were not affected. It is possible that more consistent
implementation would have led to improved student performance.
Finally, there were relatively few opportunities for TFs to implement MECP
procedures. During most classes, the majority of students did not audibly emit answers to
TF questions. Therefore, TFs may not have had sufficient classroom opportunities to
practice their implementation skills. Anecdotal reports from TFs indicated that those
students who were most likely to respond audibly during lectures were likely to emit
correct answers. This could partially explain the low number of opportunities to
implement the MECP. Furthermore, Version 3 was implemented at the end of the
semester; if Version 3 had been utilized throughout the semester, perhaps it would have
had a positive effect on student learning.
As a development project and case study in staff management, this study suggests
the importance of collaborative group efforts when designing staff training protocols. TFs
were more likely to correctly implement the later MECP versions than Version 1. This
30
TF design team was also responsible for determining the protocol used to train TFs to
implement Versions 2 and 3. Even when TFs did not accurately execute the MECP, they
were more likely to attempt the later MECP versions than Version 1. These results might
indicate that the TFs were more motivated to implement the MECP versions they took
part in designing.
Most of the TFs rated the value of the later MECP versions higher than Version 1
on the satisfaction survey. In fact, 60% (3 out of 5) gave higher satisfaction ratings on the
second survey when asked if the amount of time spent implementing the MECP was
worth the achieved results. The other 30% (2 out of 3 TFs) said that the time spent
implementing all three versions was either probably, or definitely, a good use of their
time. Overall, the surveys indicated that TFs felt as though the time spent developing,
training and implementing the later versions of the MECP was more productive and
satisfying.
Student opinions, however, are not as easily interpreted. There are several
instances in which responses were inconsistent within class sections. For example, the
students in T005’s class indicated that they liked the later versions of the MECP less, and
that later versions were slightly less likely to help them understand the material being
taught. However, the same class indicated that they were slightly more likely to achieve
better quiz grades with the later MECP versions. A similar effect was seen across surveys
given to T004 and T002’s class.
Future research could investigate error correction procedures during which
student responses are more reliably gathered than through vocal participation.

31
Technologies exist that allow students to answer questions posed by the instructor via
electronic devices. These types of in-class response tools allow TFs to instantly view
responses from the entire class and provide feedback based on answering patterns.
Perhaps error correction procedures are more potent when evidence of incorrect
responses is more saliently presented to students via graphical display instead of via
listening to mass vocal responses.
Future researchers could also compare a collaborative approach to developing TF
error correction protocols with a supervisor-designed approach in order to isolate the
effects of TF involvement in the successful implementation of such procedures. These
two approaches were blended in this study and it was impossible to systematically
evaluate their independent effects. However, from a staff management point of view, the
involvement of TFs in the design of the later error correction procedures appeared to have
had beneficial effects not only on implementation, but also on staff morale. Perhaps
future studies could try to measure these indirect effects as well.

Figure 1. Sequence of instructional steps in MECP Version 1.
Question
posed to the class
32

Figure 2. Sequence of instructional steps in MECP Version 2.
33

Figure 3. Sequence of instructional steps in MECP Version 3.
34

35
Figure 4. Average number of correct student responses on 1st quiz attempt per teaching
module. Error bars represent 1 standard deviation from the mean class score.
35

Figure 5. Accuracy of MECP implementation for the Non-Intervention group (NEG).
The top graph shows TF performance across teaching modules per student error. The key details
the separate MECP elements of Version 1.0 and how to determine the TF’s accuracy on each
element. The bottom graph shows overall TF accuracy across teaching modules. The key
indicates whether a data point shows overall correct or incorrect implementation of the MECP.
36

Figure 6. Shows TF performance across teaching modules per student error for Experimental
Group 2. The key on the left side details the separate MECP elements of Versions 1.0 and 2.0
and how to determine the TF’s accuracy on each element. The key on the right side details the
separate MECP elements of Version 3.0 and how to determine the TF’s accuracy on each
element.
37

Figure 7. Shows TF performance across teaching modules per student error for Experimental
Group 1. The key on the left side details the separate MECP elements of Versions 1.0 and 2.0
and how to determine the TF’s accuracy on each element. The key on the right side details the
separate MECP elements of Version 3.0 and how to determine the TF’s accuracy on each
element.
38

Figure 8. Shows all experimental group TF’s overall accuracy when implementing the MECP.
The key at the top right-hand corner indicates whether a data point shows overall correct implementation of the MECP or incorrect implementation
39
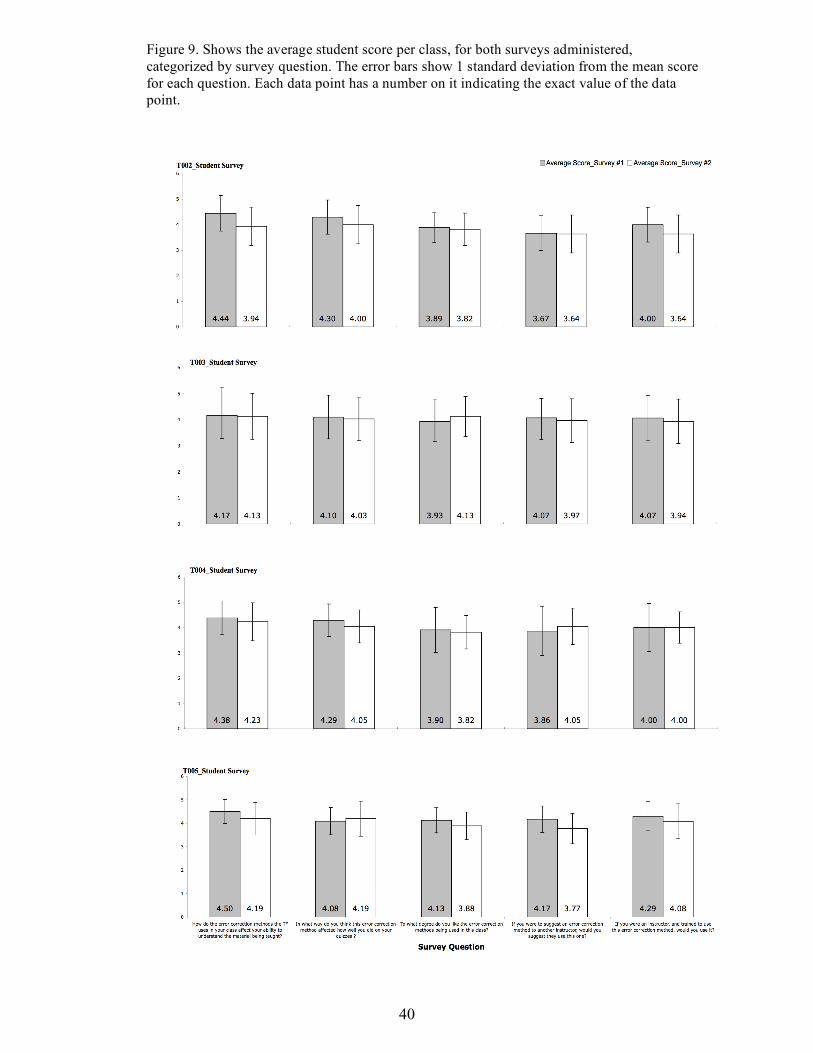
Figure 9. Shows the average student score per class, for both surveys administered,
categorized by survey question. The error bars show 1 standard deviation from the mean score
for each question. Each data point has a number on it indicating the exact value of the data
point.
40

1= Hindered a great deal; 2= Slightly hindered; 3= Did not affect; 4= Slightly helped; 5= Helped a great deal
1= Hindered a great deal; 2= Slightly hindered; 3= Did not affect; 4= Slightly helped; 5= Helped a great deal
1= Hate it; 2= Dislike it; 3= Don’t care about it; 4= Like it; 5= Love it
1= Definitely not; 2= Probably not; 3= Not sure; 4= Probably was; 5= Definitely was
1= Definitely won’t; 2= Probably won’t; 3=
Not su
re; 4= Probably will; 5= Definitely will
Figure 10. Shows the average TF score for both surveys administered, categorized by survey
question. Text boxes detail TF answer choices for each survey question.
41
42
REFERENCES
Albert-Morgan, S. R., Ramp, E. M., Anderson, L. L., & Martin, C. M. (2007). Effects of repeated readings, error correction, and performance feedback on the fluency and comprehension of middle school students with behavior problems. Journal of Special Education, 41(1), 17-30.
Alvarado-Gomez, M., & Belfiore, P. J. (2001). Effects of error correction on spanish spelling words for students whose primary language is spanish. Journal of Behavioral Education, 10(4), 213-221.
Caswell, D. (1989). Surviving day 1. [interactive video program] Florida Vocational Journal, 14(6), 14.
Fox, L. (1962). Affecting the use of efficient study habits. Journal of Mathetics, 1(1), 75-86.
Geller, D. (1996). Knowledge –of-correct-response vs. copying-of-correct-response a study of discrimination learning. Unpublished master's thesis, University of North Texas, Denton, Texas.
Gilbert, T. F. (1962). Mathetics: The technology of education. Journal of Mathetics, 1(1), 7-73.
Guthrie, E. R. (1935). The psychology of learning (1st ed.). New York: Harper & Brothers.
Hannafin, M. J., Hannafin, K. M., & Dalton, D. W. (1993). Feedback and emerging instructional technologies. In J. V. Dempsey & G. C. Sales (Eds.), Interactive instruction and feedback (p. 278). Englewood Cliffs, NJ: Educational Technology Publications, Inc.
Johnson, D. W., & Johnson, R. T. (1993). Cooperative learning and feedback in technology-based instruction. In J. V. Dempsey & G. C. Sales (Eds.), Interactive instruction and feedback (p. 135). Englewood Cliffs, NJ: Educational Technology Publications, Inc.
Merrill, M. D., Tennyson, R. D., & Posey, L. O. (1992). Teaching concepts: An instructional design guide (2nd ed.) . Englewood Cliffs, NJ: Educational Technology Publications, Inc.
Miller, K. L. (2006). Principals of everyday behavior analysis. Portland, OR: Wadsworth Publishing Co.

42
Merrill, J. (1987). Levels of questioning and forms of feedback: Instructional factors in courseware design. Journal of Computer-based Instruction, 14(1), 18-22.
Nelson, J. S., Alber, S. R., & Gordy, A. (2004). Effects of systematic error correction and repeated readings on the reading accuracy and proficiency of second graders with disabilities. Education and Treatment of Children, 27(3), 186-198.
Nielson, M.C. (1990). The impact of informational feedback and a second attempt at practice questions on concept learning in a computer-aided instruction. Unpublished dissertation, University of Texas at Austin.
Smith, T., Mruzek, D. W., Wheat, L. A., & Hughes, C. (2006). Error correction in discrimination training for children with autism. Behavioral Interventions, 21, 145-163.
Tribble-MacDonald, L. (1989). Laserdisc: 1 solution to the problem of adult literacy: A closer look at available hardware and generic software. Instructional Delivery Systems, 2(5), 14-18.
Worsdell, A. S., Iwata, B. A., Dozier, C. L., Johnson, A. D., Neidert, P. L., & Thomason, J. L. (2005). Analysis of response repetition as an error-correction strategy during sight-word reading. Journal of Applied Behavior Analysis, 38(4), 511-527.


