tvh/DRAFTSIP/2015-16/SIP 06/10/15 page 1 of 14
Buttershaw Business & Enterprise College
DRAFT School Improvement Plan 2015-16
Values Skills Aspiration

tvh/DRAFTSIP/2015-16/SIP 06/10/15 page 2 of 14
As a result of our school improving, the Buttershaw student will increasingly be:
Values Driven
Wise: able to make good choices about life, leisure, employment and study
Just
Compassionate
Honest
Ambitious
Personally Confident
Reflective
Resilient
Skilled
Articulate
Analytical
Creative
Evaluative
Literate
Numerate
Socially and emotionally capable
Confident with new technologies
A good team worker
Able effectively to absorb, understand and recall key information and concepts
Able to manage their health and risks to their wellbeing
Aspirational
Motivated and hard working
Curious
Keen, and able, to lead others and be a role model
Keen and able to help others
Politically and culturally aware
Financially and economically aware
Aesthetically aware
Clear about career opportunities and aspirations
Clear about next steps
Reading for pleasure

tvh/DRAFTSIP/2015-16/SIP 06/10/15 page 3 of 14
In order to help our students achieve we will support the development of:
Values Skills Aspiration Staff Model appropriate behaviour and
ambitions
Model the key school values of:
Wisdom
Integrity
Justice
Compassion
ambition
Be professional, enthusiastic, consistent and determined in all things.
Model social and emotional literacy
Use appropriate language
Develop literacy strategies
Be competent with new technologies
Deliver subject skills expertly
Ensure student safety and health and teach them how to manage risk
Set and mark homework regularly
Deliver effective period 3 activities
Be aware of FE and HE requirements
Teach lessons that have pace and challenge and develop independence
Provide appropriately differentiated work
Parents Have the confidence to discuss learning issues constructively
Support the school ethos by reinforcing its expectations of students in all areas of school life.
Understand student courses and their general skill demands
Help their children develop basic literacy
Attend parents evenings regularly
Access student data and curriculum information via the SLG
Understand the new career opportunities and challenges for students
Show they want their children to do well by checking planners and homework
Support students into sixth form, college and HE
Partners Employers
Be clear about employability requirements
Offer direct curriculum support
Employers
Support mentoring schemes
Provide adult role models
Employers
Offer work experience/internships
Offer CV/interview training
Support student leadership training
Other schools/Bradford Partnership Support and challenge improvements in behaviour for learning.
Other schools/Bradford Partnership
Support and challenge improvements in teaching
Other schools/Bradford Partnership
Support joint careers/HE events
Engage in a joint curriculum offer

tvh/DRAFTSIP/2015-16/SIP 06/10/15 page 4 of 14
Our Strategic Intents for 2015-17 Leadership and Management
School leadership at all levels will be focused on the continual improvement of student life chances through a rigorous emphasis on raising standards, improving learning and opening student minds to new possibilities. In particular all leaders will consistently:
model appropriate behaviour and high expectations.
rigorously challenge and support other staff and students.
plan for, and monitor, the impact of actions with clarity and vigour.
be committed to continual and urgent improvement.
Teaching and Provision
Teaching will be consistently good or outstanding, with practitioners who lead learning both inside and outside the classroom, motivating and directing students effectively.
Quality assurance will take place termly to ensure effective planning, delivery and feedback.
Student voice will also inform developments in teaching and learning.
Literacy, numeracy and communication skills will be a key focus for development.
The curriculum will cater for all learners, providing a clear core that builds key competencies and a menu of choice both between and within courses.
The school will be proactive in tackling/dealing with bullying.
All students will be known well through effective tracking and tutoring. Where additional help is needed, there will be professional services available in appropriate in-school environments.
Transition from primary schools will be very effective, as will work with partner agencies, ensuring that students receive appropriate support from age 10 to age 16 or 19.
The school will actively seek to support students’ parents, carers and families and involve them fully in the life and work of the school.
Attitudes to learning and life
Students will leave Buttershaw fully equipped emotionally, socially and academically for the demands of a full and rich adult life as employees, family members and global citizens.
Employability, creativity and functional skills will be developed within a broad-based curriculum that values all achievement.
Students will be effective learners and responsible citizens, understanding and applying the school’s values. They will be ambitious for themselves, their community and their city.
Students will be equipped with the skills to learn independently. They will understand their own strengths and areas for improvement and will be able to set their own targets and plan elements of their own learning.
Students will be able to make informed and wise choices in all aspects of their life and to help each other to succeed.
Achievement and Standards
Students will achieve their academic potential and thus the typical Buttershaw student will make progress above national expectations. In consequence, achievement will exceed national benchmarks and the school will:
have a significantly positive Progress 8 figure.
be at national attainment for English and maths crossover.
see the NE:ET figure is below 1%
achieve above expectations at level 3 post-16.
allow students to achieve well in sport, the arts and as responsible citizens.

tvh/DRAFTSIP/2015-16/SIP 06/10/15 page 5 of 14
Three Year Outline Plan and Improvement Trajectory 2015-17 Priority and Diagnosis Success Criteria Year 1 2016 Success Criteria Year 2 2017 Success Criteria Year 4 2018 1 Priority 1
Improving leadership at all levels. Diagnosis Leadership has been effective at improving many aspects of the school’s work, but impact must be both greater and sustained.
Leadership is judged to be at least good at all levels, including governance.
Student outcomes continue to improve to compare well with national rates and in-school gaps decrease.
2A*-C (disadvantaged) at 40%.
3+ disadvantaged En at 65%; 4+ at 25%; ma at 50%; 4+ at 15%.
Leadership is judged to be at least good at all levels, including governance, with clear elements of outstanding practice.
Student outcomes continue to improve to compare well with national rates and in-school gaps decrease.
2G5 (E/m) (disadvantaged) at 35%.
3+ disadvantaged En at 65%; 4+ at 25%; ma at 50%; 4+ at 20%.
Leadership is judged to be outstanding.
Student outcomes are consistently above national rates of progress.
2L5 (E/m) disadvantaged at 40%.
3+ disadvantaged En at 70%; 4+ at 30%; ma at 55%; 4+ at 25%.
2 Priority Improving teaching so that student aspiration is raised. Diagnosis Teaching needs to improve so that student aspirations and progress are raised in all years and across all abilities, but especially amongst disadvantaged students.
Teaching is judged to be at least good.
All inadequate teaching is eradicated.
Literacy and numeracy provision is good.
All teachers are offered support whose student progress is not yet good.
SEN provision is good.
80% of staff agree that training is appropriate and of good quality.
3A*-A at 15%.
5A*-B at 30%.
NEET at 1%.
Teaching is good, with more outstanding practice.
Some literacy and numeracy provision is outstanding, whilst all is good.
SEN additional provision is outstanding and classroom provision is consistently good.
3A*-A at 18%.
5A*-B at 35%
NEET below 1%.
Teaching is consistently good, with much outstanding practice.
Literacy and numeracy provision is outstanding.
SEN provision is outstanding.
3G7+ at 25%.
5G6+ at 30%
NEET below 1%.
3 Priority 3 Improving student safety, values, attitudes and behaviour even further. Diagnosis Whilst the overwhelming majority of students conform to school rules, they do not take enough responsibility for their own learning. A small, but significant number do not consistently reflect the school values in their attitudes.
Low level disruption is rare.
Safeguarding is judged to be outstanding.
Disadvantaged attendance is improving at a faster rate than that for non-disadvantaged students.
Rising Stars improve by at least 0.2 in all years.
Whole school attendance is 95.2% or above.
Attitudes to learning are consistently good and often outstanding.
Low level disruption is exceptionally rare.
Safeguarding remains outstanding.
Disadvantaged attendance is improving at a faster rate than that for non-disadvantaged students.
Rising stars improve by at least 0.2 in all years.
Whole school attendance is at 95.5% or above.
Attitudes to learning are consistently good and often outstanding.
Low level disruption is exceptionally rare.
Safeguarding remains outstanding.
Disadvantaged attendance is improving at a faster rate than that for non-disadvantaged students.
Rising stars improve by at least 0.1 in all years.
Whole school attendance is at 95.8% or above.
4 Priority 4 Improving student skills, qualifications and success. Diagnosis Achievement is on an improving trajectory, but is not good enough. In consequence insufficient numbers of students leave with the skills they need for the next stage of education or for employment.
Progress 8 positive.
2A*-C (E/m) is at 52% or above.
KS3 progress accelerates.
3+ levels of progress English at 70% or above.
3+ levels of progress maths at 60% or above.
4+ levels of progress English at 28%.
4+ levels of progress maths at 25%.
Sixth Form level 3 progress is at ALPs 3 or above.
Disadvantaged students’ achievement rises more quickly than that for non-disadvantaged students.
Progress in science is at national rates for 3+ and 4+ levels of progress.
Progress 8 is at 0.2 or above.
2G5 (E/m) at 48% or above.
KS3 progress is above national KS2-4 rates.
3+ levels of progress English at 75%.
3+ levels of progress maths at 67%.
4+ levels of progress English at 30%.
4+ levels of progress maths at 28%.
Sixth Form level 3 progress is at ALPs 4 or above.
Disadvantaged students’ achievement rises more quickly than that for non-disadvantaged students.
Progress in science is above national rates for 3+ and 4+ levels of progress.
Progress 8 is at 0.3 or above.
2G5 (E/m)
KS3 progressi s above national KS2-4 rates
3+ levels English at 80%
3+ levels maths at 73%
4+ levels English at 33%
4+ levels maths at 30%
Sixth Form level 3 progress is at ALPs 4 or above.
Disadvantaged students’ achievement rises more quickly than that for non-disadvantaged students.
Progress in science is above national rates for 3+ and 4+ levels of progress.

tvh/DRAFTSIP/2015-16/SIP 06/10/15 page 6 of 14
School Improvement Trajectory 2015-2016
Achievement
Year 13 2014 2015 2015 Aut 1 2015 Aut 2 2016 Spr 2 2016 Target
% of departments rated at ALPs 6+ 70% 73% 33% 50% 75% 90%
% of departments rated at ALPs 3+ 30% 47% 0% 10% 30% 50%
Retention N/A 91%
Year 12 2014 2015 expected 2015 Aut 1 2015 Aut 2 2016 Spr 2 2016 Target
% of departments rated at ALPs 6+ 30% 53% 20% 40% 50% 70%
% of departments rated at ALPs 3+ 5% 7% 0% 10% 20% 35%
Retention N/A 95%
2014 2015 2015 Aut 1 CWA 2015 Aut 2 CWA 2016 Spr 1 CWA 2016 Target
Year 11 Disadvantaged
Non- Disadvant
aged
Overall Disadvantaged
Non- Disadvant
aged
Overall Disadvantaged
Non- Disadvant
aged
Overall Disadvantaged
Non- Disadvant
aged
Overall Disadvantaged
Non- Disadvant
aged
Overall Disadvantaged
Non- Disadvan
taged
Overall
Progress 8 -0.3 +0.2 Positive
A*-C(E/m) 22% 40% 32% 23% 54% 44% 10% 40% 25% 18% 45% 35% 27% 55% 4% 38% 64% 52%
5A*-B 10% 25% 19% 16% 31% 25% 3% 20% 12% 8% 30% 20% 17% 30% 28% 23% 36% 30%
3A*-A 4% 14% 9% 6% 16% 12% 3% 8% 5% 5% 12% 8% 7% 18% 12% 10% 22% 15%
Ebacc 10% 26% 19% 17% 37% 29% 25% 41% 35%
Maths 3+ 40% 63% 53% 32% 60% 49% 16% 52% 34% 26% 62% 44% 34% 70% 52% 50% 78% 60%
Maths 4+ 10% 16% 14% 10% 25% 19% 5% 10% 8% 12% 18% 15% 15% 24% 20% 20% 30% 25%
English 3+ 38% 55% 48% 47% 70% 60% 49% 60% 55% 55% 65% 60% 60% 70% 65% 67% 73% 70%
English 4+ 8% 17% 13% 15% 27% 22% 12% 16% 14% 15% 21% 18% 18% 26% 22% 24% 32% 28%
2015 end Yr9 CWA 2015 Aut 1 CWA 2015 Aut 2 CWA 2016 Spr 1 CWA 2016 Target CWA 2017 Target
Year 10 Disadvantaged
Non- Disadvant
aged
Overall Disadvantaged
Non- Disadvant
aged
Overall Disadvantaged
Non- Disadvant
aged
Overall Disadvantaged
Non- Disadvant
aged
Overall Disadvantaged
Non- Disadvant
aged
Overall Disadvantaged
Non- Disadvan
taged
Overall
Progress 8 .0 +0.4 +0.2
2G5 26% 35% 30%
G6 25% 34% 30%
G7 15% 26% 20%
Maths 3+ * 60% 82% 67%
Maths 4+ * 25% 36% 25%
English 3+ * 75% 86% 75%
English 4+ * 40% 52% 30%
NB The Year 10 trajectory will be completed by January 2016, when more information is available on new GCSE grading and national flightpaths. * or equivalent, to be worked out when trajectory is available.

tvh/DRAFTSIP/2015-16/SIP 06/10/15 page 7 of 14
Teaching Quality
2014 * 2015 2015 Aut 2016 Spr 2016 Sum 2016 Sum target
Departments judged as having good or better teaching (%)
40% 50% 70% 80% 80%
Feedback judged as good or better (%) 60% 75% 90% 100% 100%
Teaching typicality judged as good or better (%) 50% 60% 80% 85% 85%
Attitudes to Learning
2014 * 2015 2015 Aut 1* 2015 Aut 2 2016 Spr 1 2016 Sum target
Lessons where attitudes to learning are judged as good (%)
60 70 75 90
Exits to the BSU (average daily number)
8 10 8 7 6
Disadvantaged exits to the BSU (average daily number)
4 5 4 4 3
Attendance
2014 2015 2015 Aut 1 2015 Aut 2 2016 Spr 1 2016 Sum target 2017
Overall school attendance (%)
93.9 94 94.5 94.8 95 95.2 95.6
Disadvantaged overall attendance (%)
90.6 91.5 91.7 91.9 92.1 93.0
Persistent Absenteeism 85% 8.7 9.2 8.8 8.5 8.3 8 7
Persistent Absenteeism 90% 16.6 20.2 18 16 15 14 12
Disadvantaged Persistent Absenteeism Gap -9.4 -10.1 -9 -8.8 -8.5 -8.2 -7.5
*N/A signifies a data series where previous comparisons are misleading or absent

tvh/DRAFTSIP/2015-16/SIP 06/10/15 page 8 of 14
Intended outcomes: Impact Milestones (1-6)
Milestone 1 Half term 1 Sept 2015
Milestone 2 Half term 2 Nov 2015
Milestone 3 Half term 3 Jan 2015
Milestone 4 Half term 4 March 2015
Milestone 5 Half term 5 May 2016
Milestone 6 Half term 6 July 2016
AFI 1
First departmental audits of teaching
quality, including planning, marking and
feedback have taken place.
New data analysis available for all groups
including more prominently for SEND.
Homework and presentation policy
expectations are clarified and reinforced.
Teaching quality judgements recalibrated
in light of summer results; departments
prioritised and support plans agreed as a
consequence.
Departmental reviews and audits
completed and showing significant
improvement in teaching quality.
Data conversations taking place
regularly and data is clearly used in
planning.
Homework and presentation audits
have taken place and show clear
improvements.
Support plans in place as required.
Teaching quality has improved in line
with school trajectory.
Data conversations are informing
planning for all groups.
Students’ progress matches school
trajectory for Years 10-13.
Progress in other year groups is
(significantly) improved.
75% compliance with school
homework and presentation policies
are achieved.
Support plan impacts are resulting in
improved teaching.
Teaching quality has improved in line
with school trajectory.
Students’ progress matches school
trajectory for Years 10-13.
Progress in other year groups is
(significantly) improved.
85% compliance with school
homework and presentation policies
are achieved.
Teaching quality continues to improve
in line with school trajectory.
Students’ progress matches school
trajectory for Years 10-13.
Student progress in Years 7-9 is
improved on 2014-15.
Progress in other year groups is
(significantly) improved.
Teaching quality has improved in line with
school trajectory and Ofsted expectations.
Year 10 and 11 examination predictions are
in line with the school trajectory.
Students’ Progress in Years 7-9 is
significantly improved on 2014-15.
Students’ progress matches school
trajectory for Years 10-13.
Progress in other year groups is
(significantly) improved.
90% compliance with school homework and
presentation policies are achieved.
Progress (RAG)
AFI 2
New attendance strategy and reviews in
place.
Disadvantaged students ‘ achievement
report for 2014-15 is produced.
SEND progress is available alongside other
data both to leaders and class teachers.
Actions in place for PA students
around improved attendance.
Disadvantaged funding is closely
targeted at improving
Disadvantaged students’ progress in
English and maths.
Teachers area confident about key
actions for improving progress for
SEND students.
PA has reduced and matches school
trajectory.
Progress of disadvantaged students has
improved and matches school
trajectory.
Progress of SEND students has
increased by 5% in English and maths
by 10%.
Whole school attendance strategies
have led to 0.7% improvement.
Mock exams show progress of
disadvantaged students has closed the
gap by at least 10%
Key interventions in place to ensure
significant improvement in progress of
SEND students.
Attendance of key groups shows at
least 1% improvement on 2015.
Progress of disadvantaged students
matches trajectory in English and
maths.
Progress of SEND students has
increased by 8% in English and 15% in
maths.
Whole school attendance strategies have
led to 1% improvement in attendance.
PA has reduced by ?%.
Progress of SEND students in all years has
improved significantly – gap has closed.
Progress (RAG)
AFI 3
Baseline testing is organised for all groups.
Sixth form leaders are involved in QA of
teaching quality.
Sixth form attendance tracking is
reviewed.
Sixth form tracking now shows leaders
disadvantaged and SEND students’
progress separately.
Baseline testing has taken place and
students are in appropriate groups.
Sixth form leaders have a teaching
quality tracker that is being used to
target challenge and support.
Sixth form tracking has been used
to target support for students and
challenge for teachers.
95% agree that confident to report
bullying and would do so.
The gap between the progress of
disadvantaged and SEND with other
students is narrowing.
95% agree that confident to report
bullying and would do so.
In addition to visual learning walks,
sixth form leaders have conducted a
learning walk focused on sixth form
issues.
All groups of students are progressing
in line with ALPs national average for
all students.
95% agree that confident to report
bullying and would do so.
In addition to visual learning walks,
sixth form leaders have conducted a
learning walk focused on sixth form
issues.
All groups of students are progressing
in line with ALPs national average for
all students.
Examination predictions show student
progress is in line with school trajectory.
Examination predictions for all groups of
students show no gap in performance.
Progress (RAG)
AFI 4
School targets agreed and shared with all
leaders.
New QA processes in place.
New MIS (PARs) is in school.
Disadvantaged and governance audits are
organised.
Proposed PM and pay policy is agreed by
senior team.
Targeted bullying action plan is in place.
Attendance plan actions in place.
SIP is amended, to incorporate and cross
reference to, AFIs as necessary.
Work scrutiny and learning walk
shows improvements in marking
and feedback and book ethos.
Pupil Premium spending audit has
taken place.
First half-termly report is published
on key indicators in behaviour and
attendance, showing improvements
in line with trajectory.
PM and pay policy is in place
Bullying assemblies have taken
place to where to go for support.
QA shows improvements in
assessment dialogue and
differentiation.
Governance audit has taken place.
Support plans are being effectively
used to raise teacher performance.
Key indicators for disadvantaged and
SEND students especially, show
improvements.
95% of students agree that they are
confident to report bullying and would
do so.
Teaching quality has improved in line
with school trajectory.
Appropriate planning for actions
arising from audits is in place.
Improvement to attitudes to learning
evident through QA and key indicators
report.
100% of students agree that they are
confident to report bullying and would
do so.
Teaching quality continues to improve
in line with school trajectory.
Actions from audits are on track.
Attitudes to learning show
improvement and match relevant
trajectory.
100% of students agree that they are
confident to report bullying and would
do so.
Teaching quality has improved in line with
school trajectory and Ofsted expectations.
Actions from audits are on track.
Key indicators show significant
improvement I attitudes to learning in the
classroom and around school.
100% of students agree that they are
confident to report bullying and would do
so.
Progress (RAG)

tvh/DRAFTSIP/2015-16/SIP 06/10/15 page 9 of 14
Ofsted Areas for Improvement Mapped to School Improvement Plan
Area for Improvement identified in report SIP references
1) Teaching
Improve the quality of teaching so that it is consistently good and enables all groups of students to achieve well, by ensuring that:
1. work set matches the needs and abilities of all groups of students and is adjusted appropriately if they are not making at least good progress
2. there are high expectations of what students can achieve 3. interesting work is planned to engage students in their learning and consequently encourage them to behave
well at all times so they make at least good progress 4. when teachers mark students’ work clear advice is given to students about how they can make the necessary
improvements 5. homework is used consistently well to drive up standards and to challenge students to contribute well to their
progress 6. students’ presentation of work is always good and accurate spelling is insisted upon at all times.
2.1.1 2.1.3, 1.1.3, 1.3.1 2.1.1 2.1.1 2.1.4 2.1.4
2) Achievement
Improve the overall achievement of disadvantaged students, disabled students and those with special educational needs, by ensuring:
1. the attendance of students in those groups who do not attend well urgently improves so they can make an effective contribution to their learning
2. the disadvantaged funding is used effectively to improve the achievement of disadvantaged students so that the attainment gaps of these students, when compared to non-disadvantaged students nationally, close quickly
3. information on the progress of disabled students and those who have special educational needs is made available and used effectively by leaders to take actions that lead to these students making at least good achievement.
3.4.1 4.2.3 4.2.4
3) Sixth Form
Improve the provision in the sixth form by:
1. making sure that the attendance of students improves so that all make an effective contribution to their learning
2. ensuring that leaders in the sixth form thoroughly check the quality of teaching across all subjects, especially in terms of its impact on students’ achievement over time and take action where it is not good enough
3. making sure leaders check the progress of all groups of students, including the disadvantaged and take action where necessary, to prevent students from falling behind.
4.4.1 4.4.1 4.4.1
4) Leadership
Rapidly improve the impact of leadership, management and governance by ensuring:
1. teaching is at least consistently good and all leaders promote high expectations and ambition for all students 2. subject leaders check the quality of students’ work thoroughly and take effective action to improve teaching
and the achievement of all groups of students 3. all students are confident to report bullying whenever it occurs 4. governors hold the school to account for the effective use of use of the disadvantaged funding and the
performance of all groups of students.
1.1, 1.3.2, 2.4.1 1.1.5 3.3 1.2, 1.4.2
tvh/DRAFTSIP/2015-16/SIP 06/10/15 page 10 of 14
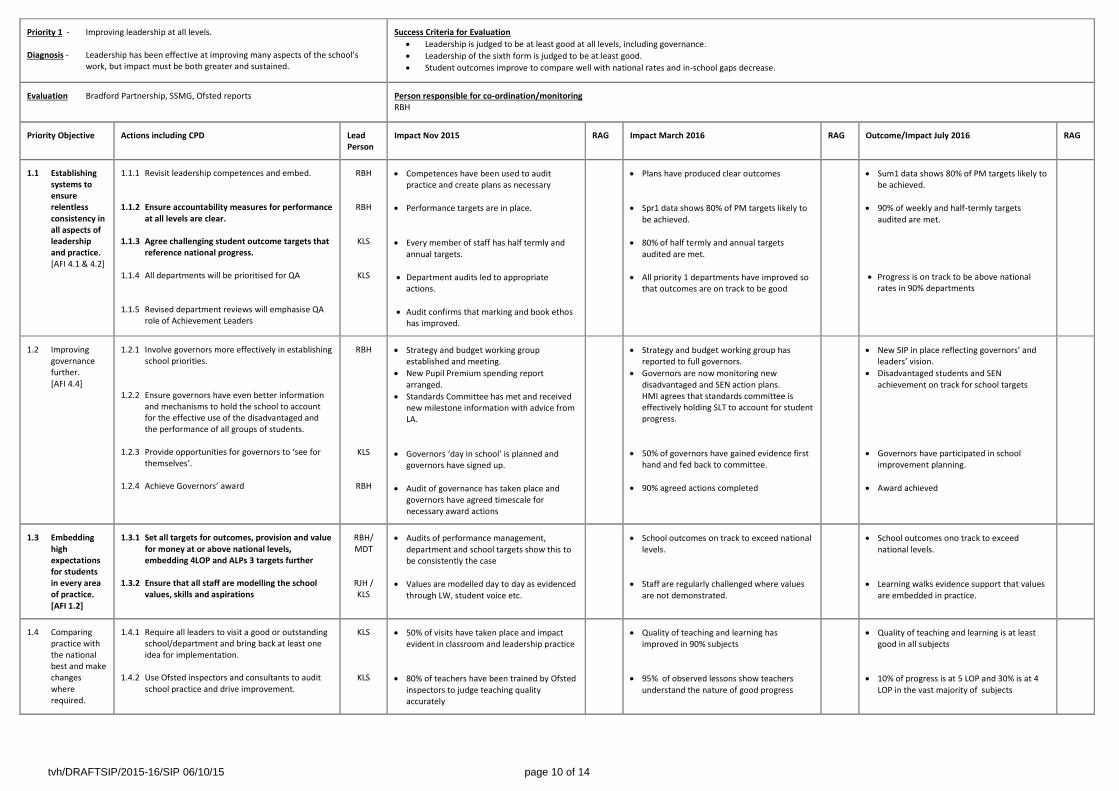
Priority 1 - Improving leadership at all levels. Diagnosis - Leadership has been effective at improving many aspects of the school’s
work, but impact must be both greater and sustained.
Success Criteria for Evaluation
Leadership is judged to be at least good at all levels, including governance.
Leadership of the sixth form is judged to be at least good.
Student outcomes improve to compare well with national rates and in-school gaps decrease.
Evaluation Bradford Partnership, SSMG, Ofsted reports
Person responsible for co-ordination/monitoring RBH
Priority Objective Actions including CPD Lead Person
Impact Nov 2015 RAG Impact March 2016 RAG Outcome/Impact July 2016 RAG
1.1 Establishing systems to ensure relentless consistency in all aspects of leadership and practice. [AFI 4.1 & 4.2]
1.1.1 Revisit leadership competences and embed.
1.1.2 Ensure accountability measures for performance at all levels are clear.
1.1.3 Agree challenging student outcome targets that reference national progress.
1.1.4 All departments will be prioritised for QA
1.1.5 Revised department reviews will emphasise QA role of Achievement Leaders
RBH
RBH
KLS
KLS
Competences have been used to audit practice and create plans as necessary
Performance targets are in place.
Every member of staff has half termly and annual targets.
Department audits led to appropriate actions.
Audit confirms that marking and book ethos has improved.
Plans have produced clear outcomes
Spr1 data shows 80% of PM targets likely to be achieved.
80% of half termly and annual targets audited are met.
All priority 1 departments have improved so that outcomes are on track to be good
Sum1 data shows 80% of PM targets likely to be achieved.
90% of weekly and half-termly targets audited are met.
Progress is on track to be above national rates in 90% departments
1.2 Improving governance further. [AFI 4.4]
1.2.1 Involve governors more effectively in establishing school priorities.
1.2.2 Ensure governors have even better information and mechanisms to hold the school to account for the effective use of the disadvantaged and the performance of all groups of students.
1.2.3 Provide opportunities for governors to ‘see for
themselves’.
1.2.4 Achieve Governors’ award
RBH
KLS
RBH
Strategy and budget working group established and meeting.
New Pupil Premium spending report arranged.
Standards Committee has met and received new milestone information with advice from LA.
Governors ‘day in school’ is planned and governors have signed up.
Audit of governance has taken place and governors have agreed timescale for necessary award actions
Strategy and budget working group has reported to full governors.
Governors are now monitoring new disadvantaged and SEN action plans. HMI agrees that standards committee is effectively holding SLT to account for student progress.
50% of governors have gained evidence first hand and fed back to committee.
90% agreed actions completed
New SIP in place reflecting governors’ and leaders’ vision.
Disadvantaged students and SEN achievement on track for school targets
Governors have participated in school improvement planning.
Award achieved
1.3 Embedding high expectations for students in every area of practice. [AFI 1.2]
1.3.1 Set all targets for outcomes, provision and value for money at or above national levels, embedding 4LOP and ALPs 3 targets further
1.3.2 Ensure that all staff are modelling the school values, skills and aspirations
RBH/ MDT
RJH / KLS
Audits of performance management, department and school targets show this to be consistently the case
Values are modelled day to day as evidenced through LW, student voice etc.
School outcomes on track to exceed national levels.
Staff are regularly challenged where values are not demonstrated.
School outcomes ono track to exceed national levels.
Learning walks evidence support that values are embedded in practice.
1.4 Comparing practice with the national best and make changes where required.
1.4.1 Require all leaders to visit a good or outstanding school/department and bring back at least one idea for implementation.
1.4.2 Use Ofsted inspectors and consultants to audit school practice and drive improvement.
KLS
KLS
50% of visits have taken place and impact evident in classroom and leadership practice
80% of teachers have been trained by Ofsted inspectors to judge teaching quality accurately
Quality of teaching and learning has improved in 90% subjects
95% of observed lessons show teachers understand the nature of good progress
Quality of teaching and learning is at least good in all subjects
10% of progress is at 5 LOP and 30% is at 4 LOP in the vast majority of subjects
tvh/DRAFTSIP/2015-16/SIP 06/10/15 page 11 of 14
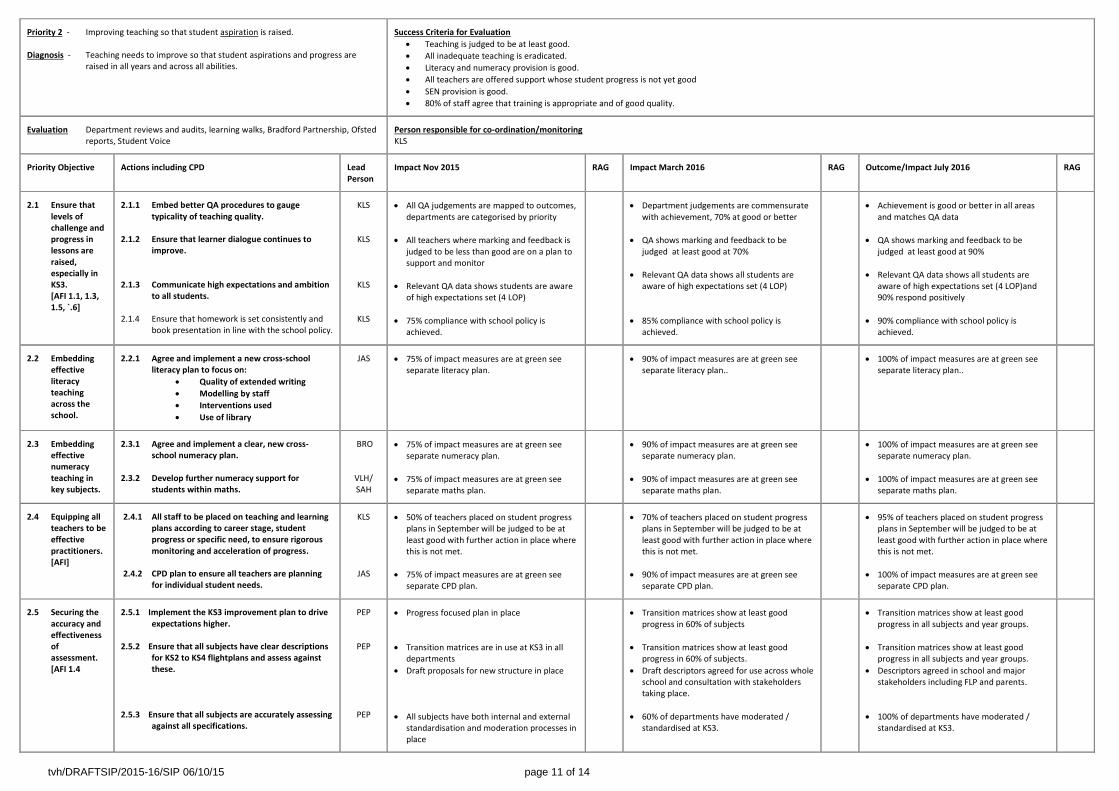
Priority 2 - Improving teaching so that student aspiration is raised. Diagnosis - Teaching needs to improve so that student aspirations and progress are
raised in all years and across all abilities.
Success Criteria for Evaluation
Teaching is judged to be at least good.
All inadequate teaching is eradicated.
Literacy and numeracy provision is good.
All teachers are offered support whose student progress is not yet good
SEN provision is good.
80% of staff agree that training is appropriate and of good quality.
Evaluation Department reviews and audits, learning walks, Bradford Partnership, Ofsted reports, Student Voice
Person responsible for co-ordination/monitoring KLS
Priority Objective Actions including CPD Lead Person
Impact Nov 2015 RAG Impact March 2016 RAG Outcome/Impact July 2016 RAG
2.1 Ensure that levels of challenge and progress in lessons are raised, especially in KS3. [AFI 1.1, 1.3, 1.5, `.6]
2.1.1 Embed better QA procedures to gauge typicality of teaching quality.
2.1.2 Ensure that learner dialogue continues to improve.
2.1.3 Communicate high expectations and ambition
to all students. 2.1.4 Ensure that homework is set consistently and
book presentation in line with the school policy.
KLS
KLS
KLS
KLS
All QA judgements are mapped to outcomes, departments are categorised by priority
All teachers where marking and feedback is judged to be less than good are on a plan to support and monitor
Relevant QA data shows students are aware of high expectations set (4 LOP)
75% compliance with school policy is achieved.
Department judgements are commensurate with achievement, 70% at good or better
QA shows marking and feedback to be judged at least good at 70%
Relevant QA data shows all students are aware of high expectations set (4 LOP)
85% compliance with school policy is achieved.
Achievement is good or better in all areas and matches QA data
QA shows marking and feedback to be judged at least good at 90%
Relevant QA data shows all students are aware of high expectations set (4 LOP)and 90% respond positively
90% compliance with school policy is achieved.
2.2 Embedding effective literacy teaching across the school.
2.2.1 Agree and implement a new cross-school literacy plan to focus on:
Quality of extended writing
Modelling by staff
Interventions used
Use of library
JAS
75% of impact measures are at green see separate literacy plan.
90% of impact measures are at green see separate literacy plan..
100% of impact measures are at green see separate literacy plan..
2.3 Embedding effective numeracy teaching in key subjects.
2.3.1 Agree and implement a clear, new cross-school numeracy plan.
2.3.2 Develop further numeracy support for
students within maths.
BRO
VLH/ SAH
75% of impact measures are at green see separate numeracy plan.
75% of impact measures are at green see separate maths plan.
90% of impact measures are at green see separate numeracy plan.
90% of impact measures are at green see separate maths plan.
100% of impact measures are at green see separate numeracy plan.
100% of impact measures are at green see separate maths plan.
2.4 Equipping all teachers to be effective practitioners. [AFI]
2.4.1 All staff to be placed on teaching and learning plans according to career stage, student progress or specific need, to ensure rigorous monitoring and acceleration of progress.
2.4.2 CPD plan to ensure all teachers are planning for individual student needs.
KLS
JAS
50% of teachers placed on student progress plans in September will be judged to be at least good with further action in place where this is not met.
75% of impact measures are at green see separate CPD plan.
70% of teachers placed on student progress plans in September will be judged to be at least good with further action in place where this is not met.
90% of impact measures are at green see separate CPD plan.
95% of teachers placed on student progress plans in September will be judged to be at least good with further action in place where this is not met.
100% of impact measures are at green see separate CPD plan.
2.5 Securing the accuracy and effectiveness of assessment. [AFI 1.4
2.5.1 Implement the KS3 improvement plan to drive expectations higher.
2.5.2 Ensure that all subjects have clear descriptions for KS2 to KS4 flightplans and assess against these.
2.5.3 Ensure that all subjects are accurately assessing
against all specifications.
PEP
PEP
PEP
Progress focused plan in place
Transition matrices are in use at KS3 in all departments
Draft proposals for new structure in place
All subjects have both internal and external standardisation and moderation processes in place
Transition matrices show at least good progress in 60% of subjects
Transition matrices show at least good progress in 60% of subjects.
Draft descriptors agreed for use across whole school and consultation with stakeholders taking place.
60% of departments have moderated / standardised at KS3.
Transition matrices show at least good progress in all subjects and year groups.
Transition matrices show at least good progress in all subjects and year groups.
Descriptors agreed in school and major stakeholders including FLP and parents.
100% of departments have moderated / standardised at KS3.
tvh/DRAFTSIP/2015-16/SIP 06/10/15 page 12 of 14
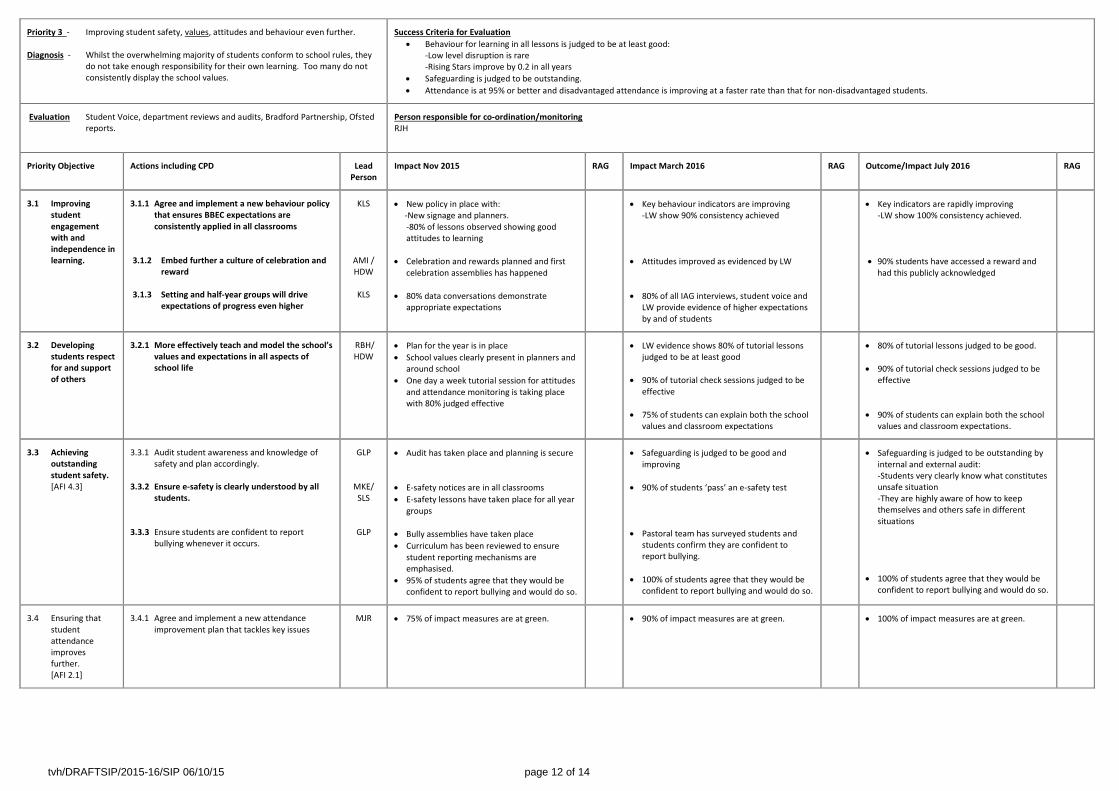
Priority 3 - Improving student safety, values, attitudes and behaviour even further. Diagnosis - Whilst the overwhelming majority of students conform to school rules, they
do not take enough responsibility for their own learning. Too many do not consistently display the school values.
Success Criteria for Evaluation
Behaviour for learning in all lessons is judged to be at least good: -Low level disruption is rare -Rising Stars improve by 0.2 in all years
Safeguarding is judged to be outstanding.
Attendance is at 95% or better and disadvantaged attendance is improving at a faster rate than that for non-disadvantaged students.
Evaluation Student Voice, department reviews and audits, Bradford Partnership, Ofsted reports.
Person responsible for co-ordination/monitoring RJH
Priority Objective Actions including CPD Lead Person
Impact Nov 2015 RAG Impact March 2016 RAG Outcome/Impact July 2016 RAG
3.1 Improving student engagement with and independence in learning.
3.1.1 Agree and implement a new behaviour policy that ensures BBEC expectations are consistently applied in all classrooms
3.1.2 Embed further a culture of celebration and reward
3.1.3 Setting and half-year groups will drive
expectations of progress even higher
KLS
AMI / HDW
KLS
New policy in place with: -New signage and planners.
-80% of lessons observed showing good attitudes to learning
Celebration and rewards planned and first celebration assemblies has happened
80% data conversations demonstrate appropriate expectations
Key behaviour indicators are improving -LW show 90% consistency achieved
Attitudes improved as evidenced by LW
80% of all IAG interviews, student voice and LW provide evidence of higher expectations by and of students
Key indicators are rapidly improving -LW show 100% consistency achieved.
90% students have accessed a reward and had this publicly acknowledged
3.2 Developing students respect for and support of others
3.2.1 More effectively teach and model the school’s values and expectations in all aspects of school life
RBH/ HDW
Plan for the year is in place
School values clearly present in planners and around school
One day a week tutorial session for attitudes and attendance monitoring is taking place with 80% judged effective
LW evidence shows 80% of tutorial lessons judged to be at least good
90% of tutorial check sessions judged to be effective
75% of students can explain both the school values and classroom expectations
80% of tutorial lessons judged to be good.
90% of tutorial check sessions judged to be effective
90% of students can explain both the school values and classroom expectations.
3.3 Achieving outstanding student safety. [AFI 4.3]
3.3.1 Audit student awareness and knowledge of safety and plan accordingly.
3.3.2 Ensure e-safety is clearly understood by all students.
3.3.3 Ensure students are confident to report bullying whenever it occurs.
GLP
MKE/ SLS
GLP
Audit has taken place and planning is secure
E-safety notices are in all classrooms
E-safety lessons have taken place for all year groups
Bully assemblies have taken place
Curriculum has been reviewed to ensure student reporting mechanisms are emphasised.
95% of students agree that they would be confident to report bullying and would do so.
Safeguarding is judged to be good and improving
90% of students ‘pass’ an e-safety test
Pastoral team has surveyed students and students confirm they are confident to report bullying.
100% of students agree that they would be confident to report bullying and would do so.
Safeguarding is judged to be outstanding by internal and external audit: -Students very clearly know what constitutes unsafe situation -They are highly aware of how to keep themselves and others safe in different situations
100% of students agree that they would be confident to report bullying and would do so.
3.4 Ensuring that student attendance improves further. [AFI 2.1]
3.4.1 Agree and implement a new attendance improvement plan that tackles key issues
MJR
75% of impact measures are at green.
90% of impact measures are at green. 100% of impact measures are at green.

tvh/DRAFTSIP/2015-16/SIP 06/10/15 page 13 of 14
Priority 4 - Improving student skills, qualifications and success. Diagnosis - Achievement is on an improving trajectory, but is not yet consistently good.
In consequence insufficient numbers of students leave with the skills they need for the next stage of education or for employment.
Success Criteria for Evaluation
Progress 8 is positive.
English and maths A*-C crossover is at 55% or above.
Disadvantaged students’ achievement rises more quickly than that for non-disadvantaged students.
KS3 progress accelerates.
Progress in science and maths is at national rates for 3+ and 4+ levels of progress.
Evaluation Half-termly data collections, based on standardised, moderated assessments. Examination results.
Person responsible for co-ordination/monitoring RBH
Priority Objective Actions including CPD Lead Person
Impact Nov 2015 RAG Impact March 2016 RAG Outcome/Impact July 2016 RAG
4.1 Ensuring that overall school achievement is above national progress.
4.1.1 Ensure the use of transition matrices in all data conversations.
4.1.2 Within performance management, all teachers have a target that encompasses all groups’ progress compared to national rates.
4.1.3 Develop Wave 1 intervention across the
school.
RJH
RJH
PEP
100% of data conversations show use of transition matrices for all groups.
In place.
All classes have Wave 1 plans.
Standard is maintained.
80% of teachers are on track to meet the PM targets.
All classes have Wave 1 plans and 50% of targeted students have closed the gap.
Standard is maintained.
80% of teachers are on track to meet the PM targets.
All classes have Wave 1 plans and 80% of targeted students have closed the gap.
4.2 Raising disadvantaged and SEND students’ achievement more quickly than both non-disadvantaged students in school and all students nationally. [AFI 2.2, 2.3]
4.2.1 Ensure disadvantaged students are a focus in all data conversations with more effective use of data.
4.2.2 Develop motivational schemes further.
4.2.3 Ensure that Pupil Premium money is well spent so that outcomes of disadvantaged students rise rapidly..
4.2.4 Implement new SEND strategy.
RJH
AMI
RBH
SEK
Audit shows that this is the case and that disadvantaged students’ progress is improving in line with school trajectory.
League tables extended to all of KS4.
Governors have approved disadvantaged spend and external audit confirms appropriateness of disadvantaged spend.
New offer is on website and review of provision is on track. All teachers and leaders are confident about what key actions to take to improve progress for SEND students.
Progress is maintained.
School targets for disadvantaged students are on course to be achieved.
Disadvantaged students on track to close 3+ levels gap with national by 18% in both maths and English.
SEND students’ progress has improved by 5% in English and 10% in maths.
Progress is maintained.
School targets for disadvantaged students are on course to be achieved.
Disadvantaged students close the 3+ levels gap with national by 18% in both maths and English.
School targets for SEND students are on course to be achieved.
4.3 Accelerating progress at KS3.
4.3.1 Introduce new tracking system for KS3 that compares to national expectations.
4.3.2 Ensure that KS3 leaders are using the new
tracking system for all intervention decisions.
4.3.3 KS3 assessments in English and maths will
be moderated against primary colleagues’ and external secondary expertise.
MKE
RJH
PEP
System in place and being used in all KS3 data conversations.
AL conversations show this is the case in 90% cases.
Moderation has taken place and assessment is deemed accurate.
Standard is maintained and progress in Yr7 and 8 is in line with national rates.
Standard is maintained progress in Yr7 and 8 is in line with national rates.
4.4 Ensuring better than good progress at KS5. [AFI 2.1, 2.2, 2.3]
4.4.1 Implement the Sixth Form plan effectively, ensuring attendance and outcomes rise further.
MDT 75% of impact measures are at green, including attendance
Sixth form progress trajectory is on track.
90% of impact measures are at green.
Sixth form progress trajectory is on track.
ALPs at grade 3.
Sixth form judged to be good
Sixth form progress trajectory is on track.
4.5 Continually modifying the curriculum to ensure success
4.5.1 Ensure the curriculum is personalised and leads to successful outcomes
4.5.2 Develop a new, innovative high quality ‘in-
KLS
GLP
Predicted Progress 8 at 0.2 above national level.
Students on external provision are achieving
Data shows that curriculum is appropriate
Students on external provision are achieving
Data shows that curriculum is appropriate
In house alternative students are on track to

tvh/DRAFTSIP/2015-16/SIP 06/10/15 page 14 of 14
for all. house’ approach to alternative provision with appropriate courses and qualifications
4.5.3 Implement the new science action plan
DRO
progress above last years’ cohort and closing the gap on other students
80% of plan targets are at green
progress above last years’ cohort and closing the gap further on other students
80% of plan targets are at green
achieve national rates of progress in 5 subjects including English and maths.
Achievement in science subjects is in line with national rates
Improvement Plan Costings
Minimal or zero cost objectives and actions omitted
Priority 1 Additional Cost Comment / Timescale
Priority 2
2.4.1 CPD budget to be maintained at current level despite costs pressures: IIP Reward £3,000.
Priority 3
3.3.2 Cost of entering small cohort of students for moderation purposes. Likely to be iro £500.
Priority 4
4.2.2 Incentive schemes for students. Costs offset against savings from ending VIVOs scheme.
4.5.2 ICE Manager Focus Manager KS3 Focus Co-ordinator
Costs offset against reduction in alternative provider costs – nil net cost.
All additional costs are in the school budget, with the exception of any further legal costs.
Governors’ Standards Committee Meeting
Date SIP Trajectory RJH/KLS SIP Milestones
RBH SIP Impact Measures
RBH Minutes to full governors
on: Student Progress Other Measures
16 November Autumn 1 data Milestone 2 November 23 November
25 January Autumn 2 data Autumn Milestone 3 1 February
14 March Spring 1 data Milestone 4 March 25 April
23 May Spring 2 data Spring Milestone 5 20 June
11 July Sum1 data Summer Milestone 6 July September


