
UvA-DARE is a service provided by the library of the University of Amsterdam (http://dare.uva.nl)
UvA-DARE (Digital Academic Repository)
PEPCK mRNA localization in proximal tubule and gene regulation during metabolic acidosis
Drewnoska, K.D.; Craig, M.R.; Digiovanni, S.R.; McCarty, J.M.; Moorman, A.F.M.; Lamers,W.H.; Schoolwerth, A.C.Published in:Journal of Physiology and Pharmacology
Link to publication
Citation for published version (APA):Drewnoska, K. D., Craig, M. R., Digiovanni, S. R., McCarty, J. M., Moorman, A. F. M., Lamers, W. H., &Schoolwerth, A. C. (2002). PEPCK mRNA localization in proximal tubule and gene regulation during metabolicacidosis. Journal of Physiology and Pharmacology, 53(1), 3-20.
General rightsIt is not permitted to download or to forward/distribute the text or part of it without the consent of the author(s) and/or copyright holder(s),other than for strictly personal, individual use, unless the work is under an open content license (like Creative Commons).
Disclaimer/Complaints regulationsIf you believe that digital publication of certain material infringes any of your rights or (privacy) interests, please let the Library know, statingyour reasons. In case of a legitimate complaint, the Library will make the material inaccessible and/or remove it from the website. Please Askthe Library: https://uba.uva.nl/en/contact, or a letter to: Library of the University of Amsterdam, Secretariat, Singel 425, 1012 WP Amsterdam,The Netherlands. You will be contacted as soon as possible.
Download date: 24 May 2020
K.D. DREWNOWSKA*, M.R. CRAIG*, S.R. DIGIOVANNI*, J.M. MCCARTY*,
A.F.M. MOORMAN**, W.H. LAMERS**, A.C. SCHOOLWERTH*
PEPCK mRNA LOCALIZATION
IN PROXIMAL TUBULE AND GENE REGULATION
DURING METABOLIC ACIDOSIS
*Department of Medicine, Virginia Commonwealth University, Richmond, Virginia;**Anatomy and Embryology Laboratory, University of Amsterdam, The Netherlands
To identify the nephron segments expressing PEPCK in control and acidotic conditions,PEPCK mRNA was localized in rat kidney using the technique of reverse transcriptionand polymerase chain reaction (RT-PCR) in individual microdissected S
1, S
2, and S
3
segments of the rat proximal tubule. In controls, the number of tubules expressing PEPCKmRNA was greatest in the S
3 segment, moderate in the S
2 segment, and least in the S
1
segment of the proximal tubule. After NH4Cl feeding, strong signals for PEPCK mRNA
were detected in all three proximal tubule segments. In situ hybridization demonstratedexpression of PEPCK mRNA only in the medullary rays in controls. After NH
4Cl, PEPCK
mRNA was expressed throughout the cortex, confirming the RT-PCR results. These datademonstrate the ability of the rat kidney cortex to modulate the expression of PEPCKmRNA during metabolic acidosis by recruitment of additional cells in the proximalnephrons. Studies with cultured LLC-PK
1-F+ cells indicated that increased PEPCK gene
transcription at acid pH required a cis-acting element (enhancer) in the more distal 5’flanking region of the promoter.
K e y w o r d s: Phosphoenolpyruvate carboxykinase; pH; RT-PCR; LLC-PK1-F+ cells;
transfections
INTRODUCTION
The kidney, like the liver, is capable of synthesizing glucose from its precursors
including lactate, pyruvate, glycerol and several amino acids. The ability of the kidney
to synthesize glucose exceeds that of the liver on a per weight basis, and increases
dramatically during several pathophysiologic conditions such as potassium depletion,
Original articles
JOURNAL OF PHYSIOLOGY AND PHARMACOLOGY 2002, 53, 1, 3—20
http://www.jpp.krakow.pl
acidosis, starvation, and a low carbohydrate diet (see 1). The gluconeogenic enzyme
phosphoenolpyruvate carboxykinase (PEPCK) catalyzes the first committed step of
gluconeogenesis, viz., the conversion of oxaloacetate to phosphoenolpyruvate.
Metabolic acidosis markedly stimulates renal ammonium synthesis and excretion
from glutamine, the principal substrate for ammoniagenesis (2,3). As part of this process,
the activities of the enzymes phosphate dependent glutaminase (PDG), glutamate
dehydrogenase (GDH), and PEPCK increase dramatically (2,3). In metabolic acidosis,
PEPCK acts to stimulate glutamine metabolism by converting α-ketoglutarate, the end
product of the deamination and deamidation of glutamine, to glucose. Temporally,
PEPCK is the first enzyme with measurable stimulation in activity after a metabolic
acidosis induced by NH4Cl administration. This stimulation is due to increased synthesis
of the enzyme (4-6). Curthoys and Lowry were the first to demonstrate that the activity
of PEPCK increased only in the proximal tubule after NH4Cl feeding (7).
In additional experiments, Curthoys and colleagues reported the results of nuclear
run-on experiments demonstrating that the acute induction of PEPCK mRNA was
due to an increased rate of transcription (8). PEPCK has also been characterized in
LLC-PK1-F+ cells, a mutant strain of cells derived from pig kidney (9,10). LLC-PK
1-
F+ cells have the enzymes necessary for glucose synthesis and are capable of growing
in the absence of glucose in the medium (9). The enzyme is located in both cytoplasm
and mitochondria of these cells in a ratio of 2:1, but only cytoplasmic PEPCK activity
increases in acidic medium (10). Kaiser and Curthoys (11) demonstrated an increased
rate of PEPCK transcription in LLC-PK1-F+ cells incubated in acidic medium.
Recently, Schoolwerth et al. showed that after NH4Cl gavage feeding PEPCK
mRNA content increased in kidney cortex within 4 hours, with maximal levels of
mRNA achieved at 10 hours (12). In addition, using in situ hybridization, they
demonstrated that PEPCK mRNA was localized to the medullary rays of kidneys
from control rats. Ten hours after NH4Cl administration, the expression of PEPCK
mRNA spread throughout the entire cortex. This study was the first to demonstrate a
change in distribution pattern of PEPCK mRNA in the kidney cortex. However, because
cDNA rather than cRNA probes were used, this in situ hybridization study did not
provide sufficient resolution to determine precisely which portions of the tubule
expressed mRNA. To further reduce background and to enhance sensitivity of the
signal, in situ hybridization was repeated in the present study using a riboprobe
complementary to PEPCK mRNA (13). The present study also utilized the technique
of reverse transcription-polymerase chain reaction (RT-PCR) carried out on
microdissected tubule segments to provide a more precise topographical localization
of PEPCK mRNA along the proximal tubule.
Finally, the present studies evaluated the transcriptional regulation of PEPCK in
acidosis. Previous studies have provided conflicting data as to whether sequences in
the PEPCK promoter could account for the accelerated rate of transcription observed
at acid pH. We tested the hypothesis that an acid response element serves as an enhancer
4

to accelerate renal PEPCK expression. The activation of PEPCK at acid pH in vitro,
simulating in vivo metabolic acidosis, was evaluated by transfecting 5’ flanking
sequence elements of the PEPCK gene ligated to a reporter system into cultured
LLC-PK1-F+ renal cells. Our studies indicate that an acid response element resides in
an 1,850 bp fragment in this upstream region of the PEPCK promoter.
MATERIALS AND METHODS
Materials
PCR primers were synthesized by Operon Technologies, Alameda, California. All chemicals
and materials were molecular biology grade and were either purchased as, or treated to become,
Ribonuclease (RNAse) free.
Experimental animals
Male rats weighing 150-200g were obtained from either Harlan Sprague Dawley, Indianapolis,
Indiana, the National Cancer Institute, Frederick, Maryland, or Harlan Sprague Dawley, Zeist, the
Netherlands. The animals were housed in the Animal Resource facility of Virginia Commonwealth
University or in the Animalium of the Academic Medical Center, Amsterdam. The Animal Care
and Use Committee approved all animal protocols. Animals were allowed free access to commercial
rat chow and water. Acute metabolic acidosis was induced by a single gavage feeding of 20 mmol
NH4Cl/ kg body weight. Acidotic animals were subsequently sacrificed ten hours after the gavage.
Control animals were housed in similar cages but were not manipulated. The ten-hour time point
was chosen as Schoolwerth et al. had previously demonstrated that this was the peak time of
PEPCK mRNA expression after gavage feeding of NH4Cl (12).
Arterial blood samples were taken from a small group of NH4Cl-fed and control rats to verify
induction of acidosis with this protocol. Following anesthesia with a single intramuscular injection of
xylazine and ketamine, the arterial blood samples were obtained from the abdominal aorta. Blood pH
and [HCO3
-] were determined using an automated blood gas analyzer. The pH was 7.22 ± 0.10 and
plasma HCO3
- 17.3±6.2 compared to 7.36 and 26.65, in acidotic rats and control rats, respectively.
In situ Hybridization
In situ hybridization was performed using standard techniques, previously published (13), except
that 35S-labeled RNA probes instead of DNA probes were used.
Microdissection of Individual Proximal Tubule Segments
The method of tubule dissection was modified from the technique of Moriyama et al. (14) and
has been previously described by Ecelbarger et al. (15). Individual 1-2 mm proximal tubule segments
were dissected in the VRC dissection solution on a Wild M8 dissection microscope. Tubular segments
were identified using established criteria (16,17) . Any attached blood vessels, tissue, or glomeruli
5
were carefully removed before transfer of the tubule. A total of 2 mm of tubule(s) were washed and
transferred to a PCR tube containing a hypotonic solution of ribonuclease inhibitor and dithiothreitol
and frozen on dry ice until reverse transcription. The harvest of tubules was completed within one
hour. Two hundred tubule segments were harvested from 16 rats, yielding 73 S1, 61 S
2, and 66 S
3
segments for RT-PCR analysis.
Reverse Transcription-Polymerase Chain Reaction
The permeabilized tubules were reverse transcribed in a 30 ml reaction volume containing the
following reactants (final concentration in mM): 50 Tris-HCl (pH 8.3), 75 KCl, 3.0 MgCl2, 10 DTT,
0.25 each dNTP, plus 0.5 µM Oligo-dT and 200 units of MMLV-RT). A control sample without the
addition of reverse transcriptase was also run in parallel with the experimental samples to rule out
genomic amplification. The reaction tubes were incubated at 42°C for 60 minutes. The samples were
then maintained at 4°C (if PCR was done the same day) or stored frozen at -20°C until PCR analysis.
PEPCK mRNA was amplified in 20 µl of the RT mixture in the same tube using primers
specific for PEPCK. The primer sequences used for PEPCK were as follows: sense (1493-1513): 5'
GCAGCATGGGGTGTTTGTAGG 3' and antisense (2139-2159): 5’TCCCTAGCCTGTTC-
TCTGTGC 3'. The expected PCR product was 667 base pairs in length. The PCR was performed in
a final volume of 60 µl and the final concentrations of the reactants were (in mM): 50 KCl, 10 Tris-
HCl, 1.5 MgCl2, 2.0 each dNTP, plus 0.5 µM of each PEPCK primer and 1.5 units of Taq polymerase.
The contents of each reaction tube were amplified in a TempCycler (Coy Labs, Ann Arbor, Michigan)
in the following sequence: 3 minutes at 94°C, 35 cycles of 94°C for 30 seconds, 58°C for 30
seconds and 72°C for 45 seconds with a final extension of 7 minutes at 72°C. All the tubes were
kept at 4°C until analysis by agarose gel electrophoresis. A sample without template (water blank)
was performed in parallel with each PCR reaction to monitor for contamination.
To verify transfer and permeabilization of the tubule, and the integrity and reverse transcription
of the mRNA population, one-third of the prepared cDNA (10 µl) was amplified with primers
specific for β-actin cDNA according to the protocol of Nudel, et al. (18). The predicted PCR
product was 698 base pairs in length. This „control” reaction was performed first. PCR for PEPCK
was performed subsequently only on those samples that were positive for β-actin. Of the total, 95
samples were not found to be positive for β-actin and therefore felt to contain degraded mRNA.
These were not further analyzed.
Analysis of PCR Products
For analysis of PCR products, the entire volume was electrophoresed in a 1.5% agarose gel in
TBE buffer (45 mM Tris-borate and 1 mM EDTA). The DNA was stained with ethidium bromide
and visualized with UV light. Each microdissected, reverse transcribed and amplified tubule segment
was scored as positive or negative for either β-actin or PEPCK based on the presence or absence of
the predicted PCR product of proper size. The water blank was negative in each reaction indicating
the absence of contamination. No attempt was made to quantitate the PCR products.
The identity of the PCR products was confirmed by restriction enzyme digestion analysis. The
PCR product for β-actin was cut with PvuII producing two fragments of 235 and 463 base pairs as
predicted (data not shown). The PEPCK PCR product was cut with EcoRI producing two fragments
of 398 and 269 base pairs as predicted (data not shown).
6

Cells
LLC-PK1-F+ cells were grown in large culture flasks in Dulbecco’s Modified Eagle Medium
(D-MEM: 5.5 mM glucose; pH 7.4; osmolarity 300 mOsm) supplemented with 10% fetal bovine
serum (FBS), 2 mM L-glutamine, 100 U/ml penicillin G, and 100 mg/ml streptomycin. Cells were
grown in 5% CO2 /air-balanced incubator at 37°C for 10-14 days. Cells were collected using
0.25% trypsin and 0.02% EDTA in PBS. They were washed twice with serum-free medium, and
1 ml of splitting solution/flask was added. Cells, resuspended in 3-5 ml of medium containing 10%
FBS, were placed in a 10ml tube and centrifuged at 500 rpm at 4°C for 10 min. After removal of
the supernatant, medium containing serum was added, and this cell suspension was used for transient
transfections. Periodically, cells cultured for several days in the absence of antibiotics were tested
for mycoplasma contamination using PCR technique (Stratagene instruction manual).
Isolation of DNA fragments of the PEPCK gene
Two fragments from genomic DNA coding for the PEPCK gene were isolated and cloned into the
expression vector pCT1 containing the chloramphenicol acetyltransferase (CAT) gene as a reporter
system. These two fragments are subclones of the genomic DNA clones that were described earlier
(19). The constructs of pCT1
were made as follows. A 550 bp genomic DNA fragment was isolated
from PAX plasmid by digestion with XbaI and BglII, and was subsequently ligated into pCT1 between
Fig. 1. ProPEP (Fig. 1a) and H+PEP (Fig. 1b) constructs
7
the HindIII and XbaI sites. This 550 bp segment, corresponding to –480 to +72 bp in the PEPCK
promoter region, was named ProPEP (Fig. 1, top panel). An 1,850 bp genomic DNA fragment was
isolated from PAX using XbaI and was subsequently cloned into the „550” with XbaI, to yield a
2,400 bp fragment of the PEPCK gene, named H+PEP (Fig. 1, bottom panel). To confirm that the
fragment was ligated in the right orientation, plasmid minipreps were digested with HindIII and
KpnI, and placed on an agarose gel. The sequence of the entire 2,400 bp fragment was compared against
the Genbank database to confirm that it represented native rat PEPCK genomic sequence (see below).
Sequencing of the promoter and adjacent 5’ fragment of the PEPCK gene
The 550 bp and 2,400 bp DNA segments were sequenced using an ABI Prism 377 XL Automated
DNA Sequencer (Perkin Elmer/Applied Biosystems, employing FS-DNA sequencing kit/dye
terminator chemistry). The GenBank accession number for rat PEPCK is K03243.
Transient transfections of LLC-PK1-F+ cells with DNA fragments from the 5’
flanking region of the PEPCK gene
Cells were transfected with the following expression vectors using liposomes to deliver the
DNA fragment, ProPEP or H+PEP. 24-48 hrs prior to transfection, confluent cells were split and
plated in 6-well tissue culture dishes (1-2 x 10⁶ cells/well). For each transfection 5-10 mg of DNA
diluted in 100 ml in OPTI-MEM I reduced-serum medium and 10-15 ml of lipofectamine diluted
in 100 ml of the above medium were combined and incubated for 15-30 min at room temperature.
After incubation, 800 ml of OPTI-MEM I was added to the DNA/liposome complex and 1 ml of
this mixture was overlaid onto cells pre-washed with 2 ml of OPTI-MEM I. Cells were incubated
for 24 hrs at 37°C in a CO2 incubator. The next day, the DNA-containing medium was replaced
with fresh medium containing 10% FBS; pH was adjusted to 7.40±0.01 or 6.99±0.01 (at 37°C).
The cells were harvested 48 hrs later (i.e., 72 hrs after adding DNA/lipid complex). Several
experiments were performed with both LLC-PK1-F+ cells grown to subconfluence and confluence.
We observed no difference under these two conditions; thus the results were pooled. Co-transfections
were performed with control vector pCAT3, a positive control vector, to monitor transfection
efficiencies in LLC-PK1-F+ cells and to normalize CAT expression.
Harvesting/lysing transfected cells
After the third day of culture following transfection, cells were washed with PBS and then
exposed to ice-cold PBS plus 2 mM EDTA for 5 min. After centrifugation, cells were lysed with
0.1% Triton X-100. A sample of each lysate (5-10 ml) was taken for determinations of protein
concentration (207±14 mg/lysate, n=49). The cell lysates were frozen rapidly by placing each tube
at -70°C for 15 min and stored at -20°C for further analysis.
Statistics
The number of β-actin positive tubules expressing PEPCK mRNA in each proximal tubule
segment from control and acidotic rats were compared using Chi-square analysis with a p< 0.05
indicating a statistical difference. CAT activities from transfected cells incubated at pH 7.4 and 7.0
were analyzed using the Student t-test for unpaired data. Data manipulation and statistical analysis
was performed using Microsoft Excel (v. 7.0) software.
8
RESULTS
Animal studies. In situ hybridization.
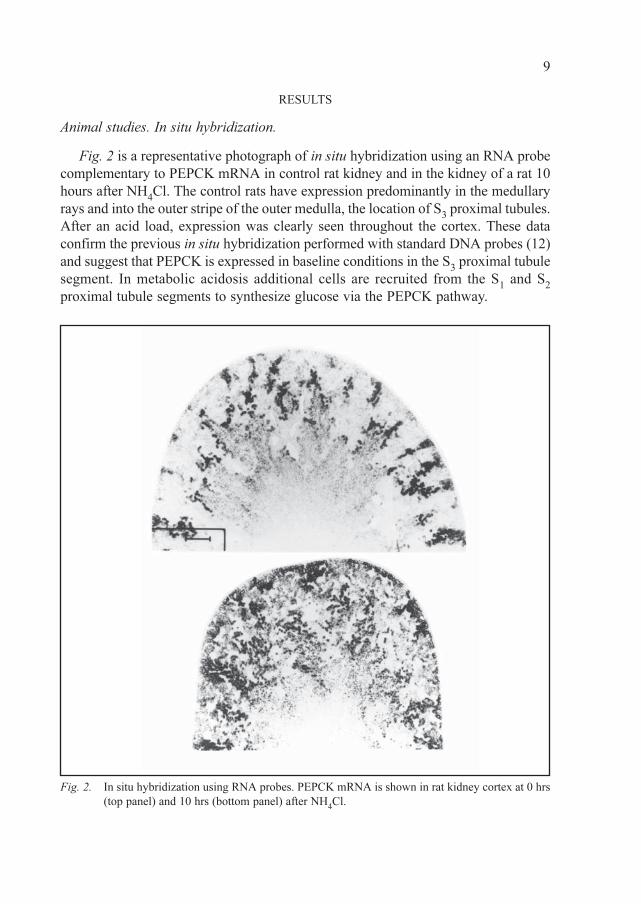
Fig. 2 is a representative photograph of in situ hybridization using an RNA probe
complementary to PEPCK mRNA in control rat kidney and in the kidney of a rat 10
hours after NH4Cl. The control rats have expression predominantly in the medullary
rays and into the outer stripe of the outer medulla, the location of S3 proximal tubules.
After an acid load, expression was clearly seen throughout the cortex. These data
confirm the previous in situ hybridization performed with standard DNA probes (12)
and suggest that PEPCK is expressed in baseline conditions in the S3 proximal tubule
segment. In metabolic acidosis additional cells are recruited from the S1 and S
2
proximal tubule segments to synthesize glucose via the PEPCK pathway.
Fig. 2. In situ hybridization using RNA probes. PEPCK mRNA is shown in rat kidney cortex at 0 hrs
(top panel) and 10 hrs (bottom panel) after NH4Cl.
9
RT-PCR
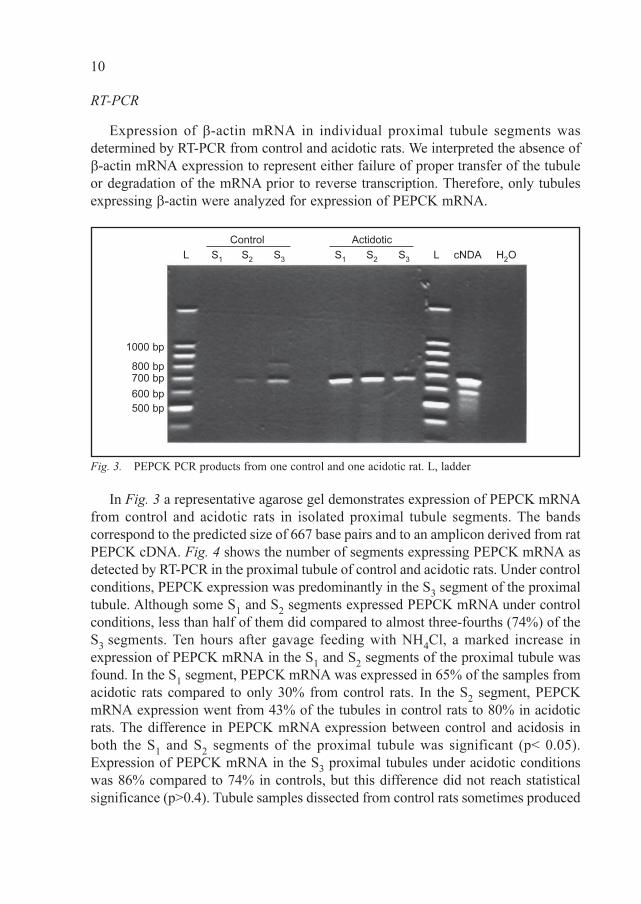
Expression of β-actin mRNA in individual proximal tubule segments was
determined by RT-PCR from control and acidotic rats. We interpreted the absence of
β-actin mRNA expression to represent either failure of proper transfer of the tubule
or degradation of the mRNA prior to reverse transcription. Therefore, only tubules
expressing β-actin were analyzed for expression of PEPCK mRNA.
In Fig. 3 a representative agarose gel demonstrates expression of PEPCK mRNA
from control and acidotic rats in isolated proximal tubule segments. The bands
correspond to the predicted size of 667 base pairs and to an amplicon derived from rat
PEPCK cDNA. Fig. 4 shows the number of segments expressing PEPCK mRNA as
detected by RT-PCR in the proximal tubule of control and acidotic rats. Under control
conditions, PEPCK expression was predominantly in the S3 segment of the proximal
tubule. Although some S1 and S
2 segments expressed PEPCK mRNA under control
conditions, less than half of them did compared to almost three-fourths (74%) of the
S3
segments. Ten hours after gavage feeding with NH4Cl, a marked increase in
expression of PEPCK mRNA in the S1 and S
2 segments of the proximal tubule was
found. In the S1 segment, PEPCK mRNA was expressed in 65% of the samples from
acidotic rats compared to only 30% from control rats. In the S2 segment, PEPCK
mRNA expression went from 43% of the tubules in control rats to 80% in acidotic
rats. The difference in PEPCK mRNA expression between control and acidosis in
both the S1 and S
2 segments of the proximal tubule was significant (p< 0.05).
Expression of PEPCK mRNA in the S3 proximal tubules under acidotic conditions
was 86% compared to 74% in controls, but this difference did not reach statistical
significance (p>0.4). Tubule samples dissected from control rats sometimes produced
1000 bp
800 bp700 bp
600 bp
500 bp
Control Actidotic
L S1
S2
S3
S1
S2
S3
L cNDA H2O
Fig. 3. PEPCK PCR products from one control and one acidotic rat. L, ladder
10

a second band (approximately 1000bp), representing amplification of genomic DNA.
This second band also was present in the absence of the reverse transcription step,
and when samples were pretreated with DNase B this band no longer appeared (studies
not shown), thus confirming its identity as genomic DNA. This band was not present
in tubules dissected from acidotic rats. We speculate that significant genomic
amplification occurs only when the PEPCK mRNA in the tubule is not abundant.
Nucleotide sequences of the promoter and adjacent 5’ DNA fragment of the
PEPCK gene
The nucleotide sequence of ProPEP and H+PEP were determined for two reasons.
One, GenBank data were available only for the minimal PEPCK promoter and adjacent
5’ flanking sequences to –1,000 bp. We wished to determine the sequence of the
entire 2,400 bp construct. Second, it was important to show that the sequences of
H+PEP were adjacent to and contiguous with ProPEP. The 550 bp and 2,400 bp DNA
segment sequences are shown on Fig. 5; the 2,400 bp DNA fragment (H+PEP) contains
the minimal PEPCK promoter (ProPEP) and immediately adjacent 5’ DNA sequences
(nucleotides –2330 to +72 relative to the transcription start site). Based on GenBank
comparison, this segment shows 99.9% nucleotide sequence homology with the rat
PEPCK gene sequences, including the minimal promoter region and the 1,000 bp
fragment immediately upstream from this minimal promoter region (20). A detailed
restriction map of the 2,400 bp clone is also virtually identical with that reported
earlier (19), and confirms the location of sites identified in both constructs used in
this study (data not shown).
Fig. 4. Summary of PEPCK expression in S1, S2, and S
3 tubule segments in control and acidotic rats.
The number of segments expressing PEPCK mRNA as detected by RT-PCR in the S1, S2, and
S3 segments of proximal tubule in control and acidotic rats, ten hours after administration of 20
mmol/l NH4Cl/kg. The data were tested from 6-14 control tubule segments and 12-15 segments
from acidotic rats. *, p<0.05, acidosis vs. control.
11
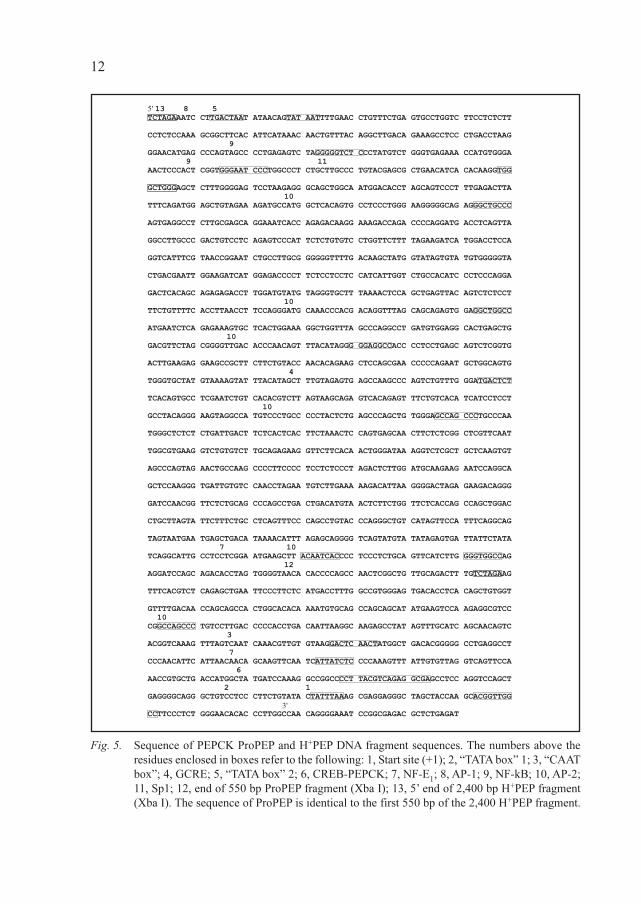
Fig. 5. Sequence of PEPCK ProPEP and H+PEP DNA fragment sequences. The numbers above the
residues enclosed in boxes refer to the following: 1, Start site (+1); 2, “TATA box” 1; 3, “CAAT
box”; 4, GCRE; 5, “TATA box” 2; 6, CREB-PEPCK; 7, NF-E1; 8, AP-1; 9, NF-kB; 10, AP-2;
11, Sp1; 12, end of 550 bp ProPEP fragment (Xba I); 13, 5’ end of 2,400 bp H+PEP fragment
(Xba I). The sequence of ProPEP is identical to the first 550 bp of the 2,400 H+PEP fragment.
12
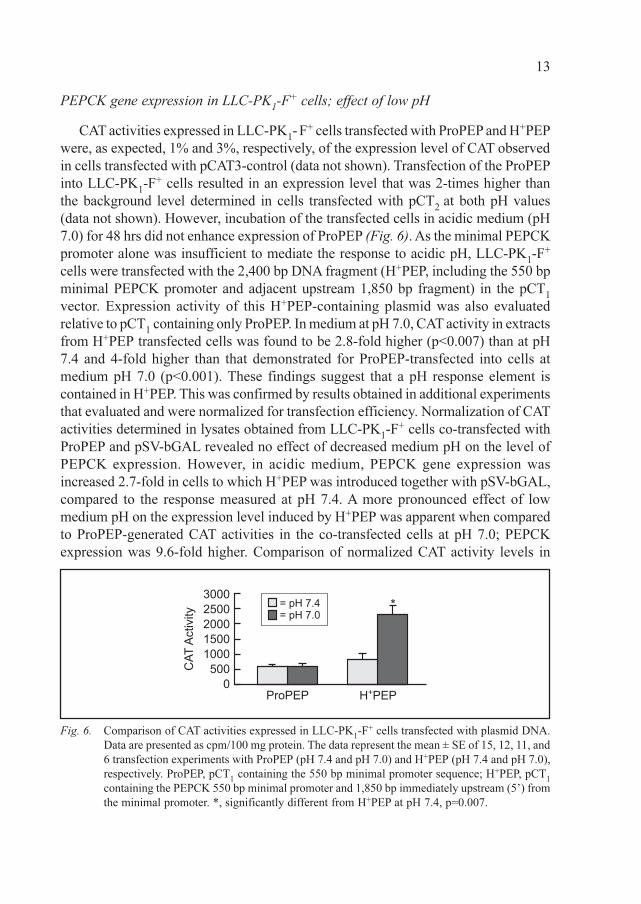
PEPCK gene expression in LLC-PK1-F+ cells; effect of low pH
CAT activities expressed in LLC-PK1- F+ cells transfected with ProPEP and H+PEP
were, as expected, 1% and 3%, respectively, of the expression level of CAT observed
in cells transfected with pCAT3-control (data not shown). Transfection of the ProPEP
into LLC-PK1-F+ cells resulted in an expression level that was 2-times higher than
the background level determined in cells transfected with pCT2
at both pH values
(data not shown). However, incubation of the transfected cells in acidic medium (pH
7.0) for 48 hrs did not enhance expression of ProPEP (Fig. 6). As the minimal PEPCK
promoter alone was insufficient to mediate the response to acidic pH, LLC-PK1-F+
cells were transfected with the 2,400 bp DNA fragment (H+PEP, including the 550 bp
minimal PEPCK promoter and adjacent upstream 1,850 bp fragment) in the pCT1
vector. Expression activity of this H+PEP-containing plasmid was also evaluated
relative to pCT1 containing only ProPEP. In medium at pH 7.0, CAT activity in extracts
from H+PEP transfected cells was found to be 2.8-fold higher (p<0.007) than at pH
7.4 and 4-fold higher than that demonstrated for ProPEP-transfected into cells at
medium pH 7.0 (p<0.001). These findings suggest that a pH response element is
contained in H+PEP. This was confirmed by results obtained in additional experiments
that evaluated and were normalized for transfection efficiency. Normalization of CAT
activities determined in lysates obtained from LLC-PK1-F+ cells co-transfected with
ProPEP and pSV-bGAL revealed no effect of decreased medium pH on the level of
PEPCK expression. However, in acidic medium, PEPCK gene expression was
increased 2.7-fold in cells to which H+PEP was introduced together with pSV-bGAL,
compared to the response measured at pH 7.4. A more pronounced effect of low
medium pH on the expression level induced by H+PEP was apparent when compared
to ProPEP-generated CAT activities in the co-transfected cells at pH 7.0; PEPCK
expression was 9.6-fold higher. Comparison of normalized CAT activity levels in
Fig. 6. Comparison of CAT activities expressed in LLC-PK1-F+ cells transfected with plasmid DNA.
Data are presented as cpm/100 mg protein. The data represent the mean ± SE of 15, 12, 11, and
6 transfection experiments with ProPEP (pH 7.4 and pH 7.0) and H+PEP (pH 7.4 and pH 7.0),
respectively. ProPEP, pCT1 containing the 550 bp minimal promoter sequence; H+PEP, pCT
1
containing the PEPCK 550 bp minimal promoter and 1,850 bp immediately upstream (5’) from
the minimal promoter. *, significantly different from H+PEP at pH 7.4, p=0.007.
13

cells cotransfected with pCAT3-control and pSV-bGAL at two pH values confirmed
that transfection efficiency was unchanged by medium H+ content.
DISCUSSION
The observations presented in this study further extend information on the renal
localization of PEPCK mRNA expression in the proximal tubule of the rat under
control conditions and acute metabolic acidosis. Under physiological conditions,
PEPCK mRNA expression along the nephron was found to be statistically dependent
on segment location and was confined predominantly to the S3 segment of the proximal
tubule of the rat nephron. PEPCK mRNA could be detected in some S1 segments of
β-actin positive proximal tubules, but the number of S1 segments expressing PEPCK
mRNA was found to be significantly less than expected when compared to S2 and S
3.
The conclusion that under normal physiological conditions PEPCK mRNA expression
is localized to the S3 portion is consistent with in situ hybridization studies presented
here, and with our previous data, demonstrating that PEPCK mRNA is confined
primarily to the medullary rays of control kidneys (12).
Ten hours following gavage feeding of NH4Cl, a significant increase in the number
of S1 and S
2 segments expressing PEPCK mRNA was detected but no significant change
in the number of S3 tubules expressing PEPCK mRNA was observed. The number of S
1
and S2 proximal tubules expressing PEPCK mRNA in response to acidosis was almost
twice that of control levels. Schoolwerth et al. demonstrated that PEPCK mRNA message
reached a maximum distribution throughout the entire cortex of the rat kidney ten hours
after NH4Cl administration (12). The present data together with the previous results
suggest that the increase in expression of PEPCK mRNA in the S1 and S
2 segments of
the proximal tubule is maximal after ten hours of acidosis (12).
These results indicate that under physiological conditions, the S3 segment of the
Fig. 7. Normalized CAT activities expressed in LLC-PK1-F+ cells co-transfected with pSV-βGAL.
Data were normalized by dividing CAT activity (cpm/100 mg protein) by β-galactosidase activity
(OD/100 mg protein) in 2-3 experiments. The ratio of normalized CAT activity with H+PEP at
pH 7.0 was 2.7-times that at pH 7.4.
14

rat proximal tubule maintains a basal level of expression of PEPCK mRNA greater
than that of the S1 and S
2 segments. The S
1 and S
2 segments of the proximal tubule
may contribute some, if only very little, of the PEPCK mRNA for enzyme synthesis.
However, in response to an acid insult, cells of the S1 and S
2 proximal rat nephron,
not previously expressing PEPCK mRNA, are recruited to express PEPCK mRNA.
These findings provide evidence of a proximal tubule mechanism that is finely
controlled and sensitive to perturbations in acid-base balance. These findings suggest
that if pH is the governing principle in PEPCK expression in the kidney, under normal
conditions the intracellular pH in the S3 segment is lower than in S
1 and S
2. However,
to our knowledge there are no data to indicate a difference in intracellular pH between
these nephron segments. While the transcription rate of renal PEPCK is known to be
accelerated by glucocorticoids and cAMP, we are unaware of data indicating altered
levels of these substances between renal proximal tubule segments (21,5,22) .
The present data also coincide with previous data demonstrating that PEPCK
enzyme activity is localized to the rat proximal tubule and increases significantly in
the cortex of acidotic rats when compared to control (23,24) . This increase was
described as greatest in the proximal convoluted tubule and less in the proximal straight
tubule, with no increase in the last portion of the proximal straight tubule. These
findings correlate well with those of the current study when “proximal convoluted
tubule”, “proximal straight tubule” and “late proximal straight tubule” are extrapolated
to the S1, S2 and S
3 portions of the proximal tubule, respectively. Such an extrapolation
may be tenuous as data by these investigators was contributed a decade or more
before standardization of kidney ultrastructure (16). Although in situ hybridization
may not provide sufficient resolution to determine precisely which portions of the
tubule are expressing the mRNA, we have obtained similar findings using different
PEPCK probes. In contrast, the technique of RT-PCR in microdissected tubules, in
which confirmation of the identity of the tubules was determined by light microscopic
appearance and location within the tissue slice, is precise in defining the localization
of mRNA expression.
The significant increase in PEPCK mRNA expression in S1 and S
2 proximal tubules
suggests that cells not previously expressing PEPCK mRNA, and subsequently not
producing PEPCK enzyme protein, were induced to express PEPCK mRNA in
response to metabolic acidosis. Other investigators have demonstrated an increase in
PEPCK mRNA along a similarly acute time line and with relatively similar increases
in expression. Pollock demonstrated a three-fold increase in renal PEPCK mRNA by
quantitative Northern analysis four hours after NH4Cl (10 mmol/kg) feeding (25).
Iynedjian and Hanson utilized a cell-free wheat germ translational assay to determine
that PEPCK mRNA increased three-fold six hours after gavage feeding of 10 mmol/
kg NH4Cl (6). Cimbala et al. revealed by Northern blotting with poly (A)+ RNA that
NH4Cl administration resulted in a four-fold increase in PEPCK mRNA within six
hours (20). Hwang and Curthoys employed nuclear run-on experiments to demonstrate
15
that the mRNA for cytosolic PEPCK increased six-fold relative to β-actin
approximately eight hours after feeding of 20 mmol/kg NH4Cl, thus demonstrating
that the increase in PEPCK mRNA is due to synthesis of new mRNA rather than
increased stability of mRNA (8). As mentioned, Schoolwerth et al. showed a 16-fold
increase in renal cortex PEPCK mRNA by dot-blot analysis ten hours following NH4Cl
(20 mmol/kg) (12). These data plus the data of the present investigation indicate that
the large increase in PEPCK mRNA detected in the kidney cortex is due to an increased
amount of PEPCK mRNA transcribed by cells of the S1 and S
2 proximal nephron.
Thus, some sort of signaling pathway probably exists for cells not previously expressing
PEPCK to begin transcribing PEPCK mRNA. The nature of the signal that mediates
this increase is not known and remains to be elucidated. We hypothesize that the
situation is analogous to pericentral and periportal enzyme gradients in hepatocytes
(26). As with those hepatic enzymes that increase in cellular concentration from the
pericentral toward the periportal regions under certain physiological conditions, renal
PEPCK gradients likely exist with an increase in enzyme content proceeding from S3
toward S1 and S
2 nephron segments in acidosis. Christoffels et al. proposed that
inducing factors are synthesized by the upstream cells (26). With regard to renal
PEPCK, this would posit that unidentified inducing factors (possibly transcription
factors) are synthesized in S1 and/or S
2 segments “upstream” from S
3 cells.
Intrinsic drawbacks of the reverse transcription and amplification systems exist
that restrict the methods from being reliably quantitative. These drawbacks include,
but are not limited to, degradation of mRNA template during the reverse transcription
step, incomplete reverse transcription of the mRNA population, probably related to
accessibility of mRNA in the tubules, and inconsistencies in the amplification of the
cDNA produced. A variable number of enzyme inhibitors can also be present, and
can vary from tube to tube even among replicate samples. However, the amount of
product obtained from a given sample following reverse transcription and a given
number of PCR cycles can be assumed to reflect the presence of starting material
(15) even though it cannot provide a precise quantitation of this amount. Because of
these drawbacks, each examination of individual dissected tubules in this report was
scored on a dichotomous positive/negative basis, describing whether or not a band
could be visualized on an agarose gel after 35 cycles, which should be sufficient
amplification for PEPCK mRNA species present in meaningful concentrations in the
tubule segments. The use of ethidium bromide in an agarose gel as a detection method
has also been described as being limited to 5 nanograms or more of DNA. For a PCR
reaction of 35 cycles, this represents only a few copies of starting material. Thus, we
can be reasonably sure that the samples were truly positive or negative for PEPCK
mRNA expression. The use of the β-actin as a control eliminated many false negative
samples where failure to visualize a band was due to factors other than the presence
or absence of PEPCK mRNA in the dissected tubule segments.
16
The in situ hybridization data demonstrate that, in response to NH4Cl-induced
metabolic acidosis, expression of PEPCK expands from the medullary rays throughout
the cortex, confirming our previous finding (12). Regional differences in optical density
within a section represent equivalent differences in local mRNA concentration under
the conditions used (27). The microdissection and in situ hybridization data therefore
complement each other: The microdissection data are precise with respect to the tubular
segments that are analyzed, but suffer from a number of inherent weaknesses with
respect to mRNA quantitation (see above). The in situ hybridization data are precise
with respect to topography and mRNA quantification but, due to the protease and
detergent treatments, do not leave sufficient morphological details to identify individual
tubule segments for correlation with the number of silver grains.
Our results also provide information to indicate that the sequences in the proximal
550 bp of the PEPCK promoter region are insufficient to explain the accelerated rate
of gene transcription at acid pH. Rather, the data support the hypothesis that a cis-
acting element in the more distal 5’ flanking region of the PEPCK promoter serves as
an enhancer. The relevant sequences are contained in an 1,850 bp segment in this
flanking region.
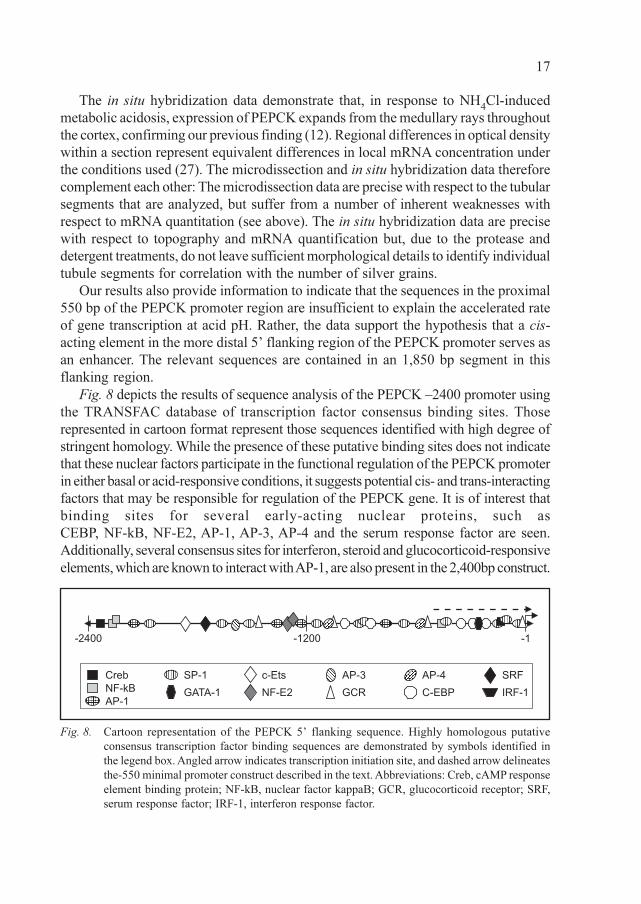
Fig. 8 depicts the results of sequence analysis of the PEPCK –2400 promoter using
the TRANSFAC database of transcription factor consensus binding sites. Those
represented in cartoon format represent those sequences identified with high degree of
stringent homology. While the presence of these putative binding sites does not indicate
that these nuclear factors participate in the functional regulation of the PEPCK promoter
in either basal or acid-responsive conditions, it suggests potential cis- and trans-interacting
factors that may be responsible for regulation of the PEPCK gene. It is of interest that
binding sites for several early-acting nuclear proteins, such as
CEBP, NF-kB, NF-E2, AP-1, AP-3, AP-4 and the serum response factor are seen.
Additionally, several consensus sites for interferon, steroid and glucocorticoid-responsive
elements, which are known to interact with AP-1, are also present in the 2,400bp construct.
Fig. 8. Cartoon representation of the PEPCK 5’ flanking sequence. Highly homologous putative
consensus transcription factor binding sequences are demonstrated by symbols identified in
the legend box. Angled arrow indicates transcription initiation site, and dashed arrow delineates
the-550 minimal promoter construct described in the text. Abbreviations: Creb, cAMP response
element binding protein; NF-kB, nuclear factor kappaB; GCR, glucocorticoid receptor; SRF,
serum response factor; IRF-1, interferon response factor.
17
Demonstration of nuclear protein binding to these sequences awaits DNAse I footprinting
and electrophoretic mobility shift assays. Confirmation of functional relevance of the cis-
and trans interacting factors thus identified will require functional analysis in reporter
gene assays in which these putative binding sites are specifically mutated.
Divergent results have been published on the site of transcriptional regulation of
renal PEPCK. Holcomb, et al (28) showed reproducible but low initial levels of CAT
activity in LLC-PK1-F+ cells transfected with PEPCK promoter (-460 to +73 bp);
CAT activity was elevated 3.5-fold after incubation in acidic medium for 24 hours.
More recently, these workers have not been able to duplicate these findings (personal
communication). Cassuto, et al. (29) utilized several different cells, including parental
LLC-PK1 cells, PK22 cells, and LLC-PK
1-F+ cells. They reported a 2.5-fold increase
in CAT activity in PK22 cells transfected with a PEPCK promoter construct (597 bp,
from the 5’ flanking sequences proximal to the coding sequences) at pH 6.9 compared
to pH 7.4. They did not report results obtained in LLC-PK1-F+ cells. We do not know
if the additional 45 bp of their construct (our ProPEP construct contains nucleotides –
480 to +72, or 552 bp) contain information which could resolve the different results
from those we obtained.
More recently, Curthoys and Gstraunthaler (30) have postulated that the induction
of PEPCK occurs via activation of the p38 stress-activated protein kinase and
subsequent phosphorylation of transcription factor ATF-2. They hypothesize that ATF-
2 binds to cAMP-response element 1 within the PEPCK promoter and may increase
PEPCK transcription during metabolic acidosis ( 31).
In summary, we have demonstrated that metabolic acidosis induced by NH4Cl
results in recruitment of cells from the S1 and S
2 proximal tubule to express PEPCK
mRNA. A mechanism apparently exists for some signal of acidosis to be sensed by
these cells to initiate synthesis of PEPCK mRNA. The identity and mechanism of this
signal to turn on transcription in response to acidosis remain to be elucidated. We
hypothesize that inducing factors are synthesized in S1 and S
2 nephron segments in
response to a reduction in cell pH.
The data obtained in this study also indicate that a cis-acting element likely is
pivotal in the enhanced rate of PEPCK gene transcription that occurs at acid pH.
They provide a base for future investigations on the molecular mechanisms responsible
for basal and inducible tissue-specific PEPCK gene regulation in vitro and in vivo.
The future identification of functionally relevant cis-acting sequences will provide
information necessary to define the trans-acting factors that contribute to the pH-
inducible regulation of the PEPCK gene.
Acknowledgments: This work has been presented in preliminary form (32,33). Matthew R.
Craig performed the RT-PCR studies in partial fulfillment of a Master of Science in Physiology
degree from Virginia Commonwealth University. These studies were supported in part by the
National Institute of Diabetes and Digestive and Kidney Diseases Grant DK-36922, a Fogarty
International Fellowship TWO01711, and the Netherlands Organization for Scientific Research.
18

REFERENCES
1. Schoolwerth AC, Smith BC, Culpepper RM. Renal Gluconeogenesis. Min Electrolyte Metab
1988; 14: 347-361.
2. Schoolwerth AC. Regulation of renal ammoniagenesis in metabolic acidosis. Kidney Int. 1991;
40: 961-973.
3. Tannen RL. Renal Ammonia Production and Excretion. In: Handbook of Physiology: Renal
Physiology., edited by E.E. Windhager. Bethesda: Oxford University Press, 1992, p. 1017-
1059.
4. Alleyne GAO, Scullard GH. Renal metabolic response to acid-base changes. I. Enzymatic
control of ammoniagenesis in the rat. J Clin Invest 1969; 48: 364-370.
5. Iynedjian PB, Ballard F, Hanson RW. The regulation of phosphoenolpyruvate carboxykinase
synthesis in rat kidney cortex. J Biol Chem 1975; 250: 5596-5603.
6. Iynedjian PB, Hanson RW. Messenger RNA for renal phosphoenolpyruvate carboxykinase
(GTP). J Biol Chem 1977; 252: 8398-8403.
7. Curthoys NP, Lowry OH. The distribution of glutaminase isoenzymes in the various structures
of the nephron in normal, acidotic and alkalotic rat kidney. J Biol Chem 1973; 248: 162-168.
8. Hwang J, Curthoys NP. Effect of acute alterations in acid-base balance in rat renal glutaminase
and phosphoenolpyruvate carboxykinase gene expression. J Biol Chem 1991; 266:9392-9396.
9. Gstraunthaler G, Handler JS. Isolation, growth, and characterization of a gluconeogenic strain
of renal cells. Am J Physiol 1987; 252: C232-C238.
10. Holcomb T, Curthoys NP, Gstraunthaler G. Subcellular localization of PEPCK and metabolism
of gluconeogenic substrains of renal cell lines. Am J Physiol 1995; 268: C449-C457.
11. Kaiser S, Curthoys NP. Effect of pH and bicarbonate on phosphoenolpyruvate carboxykinase
and glutaminase mRNA levels in cultured renal epithelial cells. J Biol Chem 1991; 266: 9397-
9402.
12. Schoolwerth AC, De Boer PA, Moorman AFM, Lamers WH. Changes in mRNAs for enzymes
of glutamine metabolism in kidney and liver during ammonium chloride induced acidosis. Am
J Physiol 1994; 267: F400-F406.
13. Moorman AFM, De Boer PA, Vermeulen JLM, Charles R, Lamers WH. Practical aspects of
radio-isotopic in situ hybridization on RNA. Histochemistry 1993; 25: 251-266.
14. Moriyama T, Murphy HR, Martin BM, Garcia-Perez A. Detection of specific mRNAs in single
nephron segments by use of the polymerase chain reaction. Am J Physiol 1990; 258: F1470-
F1474.
15. Ecelbarger CA, Chou C-L, Lolait SJ, Knepper MA, DiGiovanni SR. Evidence for dual signalling
pathways for V2 vasopressin receptor in rat inner medullary collecting duct. Am J Physiol
1996; 270: F623-F633.
16. Kriz W, Bankir L. A standard nomenclature for structures of the kidney. Pflügers Arch 1988;
411: 113-120.
17. Wright PA, Knepper MA. Glutamate dehydrogenase activities in microdissected rat nephron
segments: Effects of acid-base loading. Am J Physiol 1990; 259: F53-F59.
18. Nudel U, Zakut R, Shani M, Neuman S, Levy Z, Yaffe D. The nucleotide sequence of the rat
cytoplasmic -actin gene. Nucl Acids Res 1983; 11: 1759-1771.
19. Yoo-Warren H, Monahan JE, Short J, et al. Isolation and characterization of the gene coding
for cytosolic phosphoenolpyruvate carboxykinase (GTP) from the rat. Proc Nat Acad Sci USA
1983; 80: 3656-3660.
20. Beale EG, Chrapkiewicz NB, Scoble HA, et al. Rat hepatic cytosolic phosphoenolpyruvate
19

carboxykinase (GTP): Structure of the protein, messenger RNA, and gene. J Biol Chem 1985;
260: 10748-10760.
21. Cimbala MA, Lamers WH, Nelson K, Monahan JE, Yoo-Warren H, Hanson RW. Rapid changes
in the concentration of phosphoenolpyruvate carboxykinase mRNA in rat liver and kidney.
J Biol Chem 1982; 257: 7629-7636.
22. Meisner H, Loose DS, Hanson RW. Effect of hormones on transcription of the gene for cytosolic
phosphoenolpyruvate carboxykinase (GTP) in rat kidney. Biochemistry 1985; 24: 421-425.
23. Burch HB, Narins RG, Chu C, et al. Distribution along the rat nephron of three enzymes of
gluconeogenesis in acidosis and starvation. Am J Physiol 1978; 234: F246-F253.
24. Schmidt U, Guder WG, Funk B, Dubach UC. Metabolic patterns in various structures of the rat
nephron. In: Biochemical Aspects of Renal Function, edited by S. Angielski and U.C. Dubach.
Bern: Hans Huber, 1975, p. 22-32.
25. Saiki RK, Scharf SJ, Faloona FA, et al. Enzymatic Amplification of β-globin genomic sequences
and restriction site analysis for diagnosis of sickle cell anemia. Science 1985; 230: 1350-1354.
26. Christoffels VM, Sassi H, Ruijter JM, Moorman AFM, Grance T, Lamers WH. A mechanistic
model for development and maintenance of procentral gradients in gene expression in the liver.
Hepatology 1999; 29: 1180-1192.
27. Jonker A, De Boer PA, van den Hoff MJB, Lamers WH. Towards a quantitative in situ detection
of CPS mRNA in rat intestinal epithelium. J Histochem Cytochem 1997; 45: 413-423.
28. Holcomb T, Liu W, Snyder R, Shapiro RA, Curthoys NP. Promoter elements that mediate the
pH response of PCK mRNA in LLC-PK1-F+ cells. Am J Physiol 1996; 271: F340-F346.
29. Cassuto H, Olswang Y, Livoff AF, Nechustan H, Hanson RW, Reshef L. Involvement of HNF-
1 in the regulation of phosphoenolpyruvate carboxykinase gene expression in the kidney. FEBS
Letters 1997; 412: 597-602.
30. Curthoys NP, Gstraunthaler G. Mechanism of increased renal gene expression during metabolic
acidosis. Am J Physiol 2001; 281:F381-F390.
31. Liu X, Curthoys NP. cAMP activation of phosphoenolpyruvate carboxykinase transcription in
renal LLC-PK1-F+ cells. Am J Physiol 1996; 271:F347-F355.
32. Craig MR, DiGiovanni SR, Drewnowska K, Schoolwerth AC. RT-PCR localization of
phosphoenolpyruvate carboxykinase in the proximal tubule of the rat during metabolic acidosis.
Contrib Nephrol 1997; 121: 163-167.
33. Drewnowska K, Lamers WH, Schoolwerth AC. Stimulation of phosphoenolpyruvate
carboxykinase (PEPCK) gene expression in cultured LLC-PK1-F+ cells. Contrib Nephrol 1997;
121: 25-30.
R e c e i v e d: January 2, 2002
A c c e p t e d: January 17, 2002
Author’s address: Anton C. Schoolwerth, M.D., M.S.H.A., Department of Medicine, Division
of Nephrology, Box 980160, 1101 E. Marshall Street, Richmond, Virginia 23298-0160, tel: (804)
828-9682, fax: (804) 828-7567, e-mail: [email protected]
20


