
Validation of a New Rating Scale for use in a Formative OSCE
Drs. Debra Pugh, Claire Touchie, Timothy J. Wood, & Susan Humphrey-Murto Department of Medicine, University of Ottawa RCPSC International Conference on Residency Education September 24, 2011
Background – Formative OSCE
• University of Ottawa Internal Medicine (IM) Residency Program: – Annual formative Objective Structured
Clinical Examination (OSCE) – Residents from PGY-1 to PGY-4 – All residents participate in the same
examination
Background – Formative OSCE
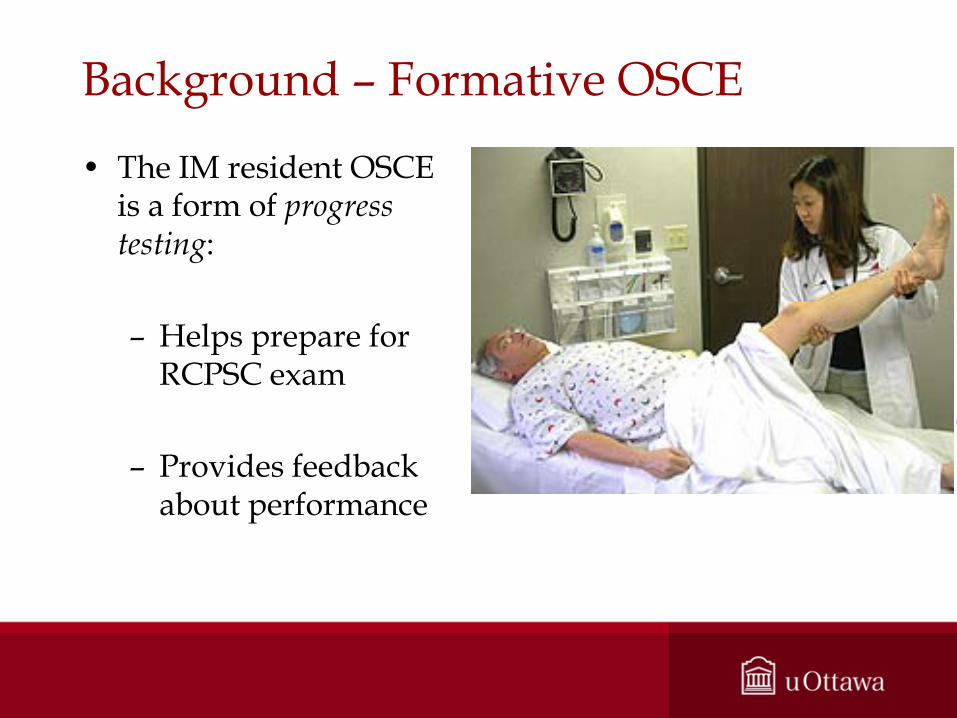
• The IM resident OSCE is a form of progress testing:
– Helps prepare for
RCPSC exam
– Provides feedback about performance
Background – Progress Testing
• Progress testing – Form of assessment in which learners from
different levels of training participate in the same test
Freeman A, Van der Vleuten C, Nouns Z, Ricketts C. Progress testing internationally. Medical Teacher 2010; 32: 451-456.
Background – Features of Progress Testing
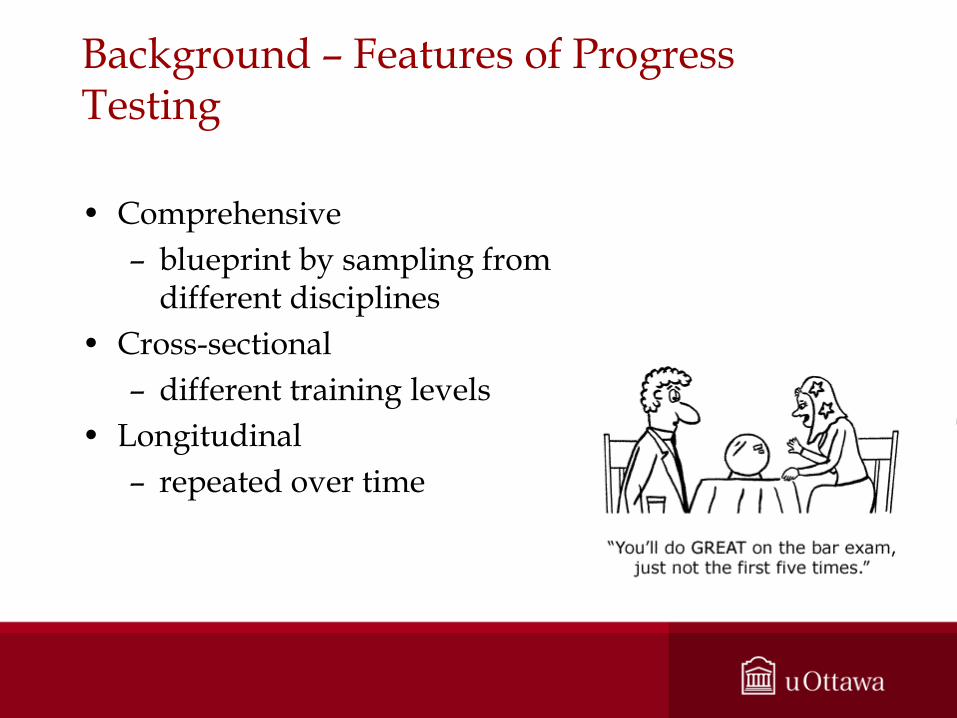
• Comprehensive
– blueprint by sampling from different disciplines
• Cross-sectional – different training levels
• Longitudinal – repeated over time
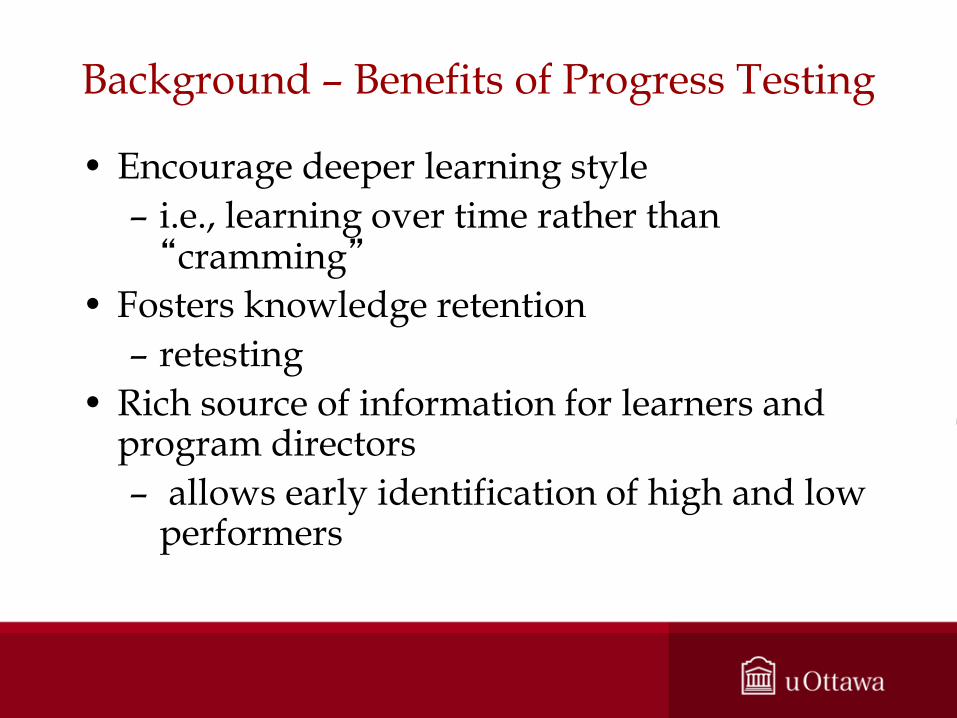
Background – Benefits of Progress Testing
• Encourage deeper learning style – i.e., learning over time rather than
“cramming” • Fosters knowledge retention
– retesting • Rich source of information for learners and
program directors – allows early identification of high and low
performers

Background – Progress Testing and OSCE
• Literature on progress testing focused on written tests
• Little about OSCEs used for progress testing
• How can we use OSCEs to assess and provide useful information about trainees’ performance when trainees are from different levels of training?
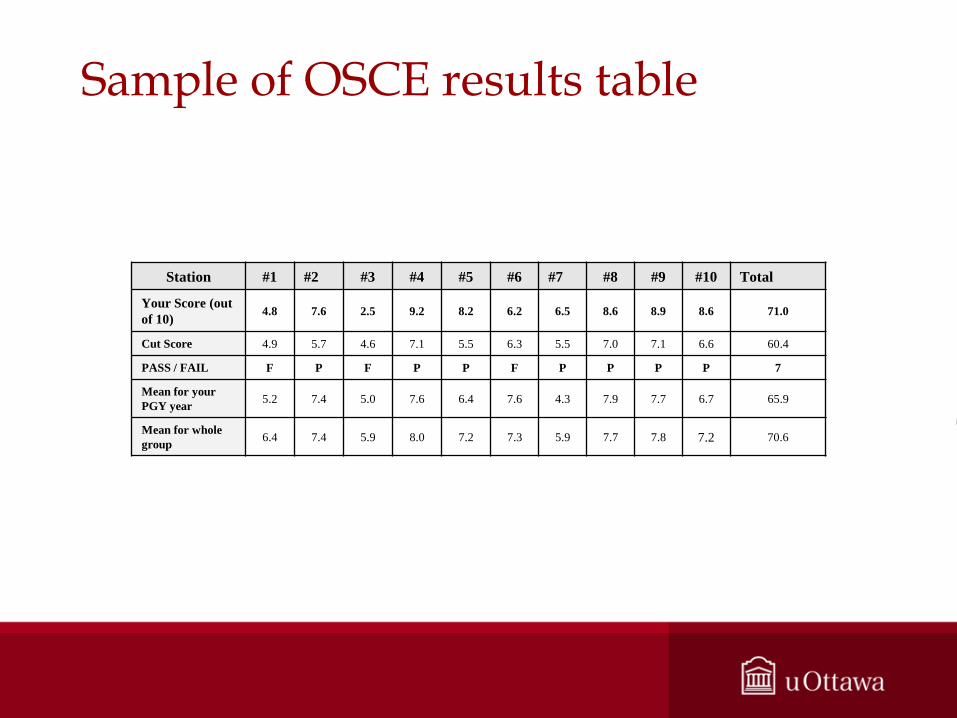
Station #1 #2 #3 #4 #5 #6 #7 #8 #9 #10 Total
Your Score (out of 10) 4.8 7.6 2.5 9.2 8.2 6.2 6.5 8.6 8.9 8.6 71.0
Cut Score 4.9 5.7 4.6 7.1 5.5 6.3 5.5 7.0 7.1 6.6 60.4
PASS / FAIL F P F P P F P P P P 7
Mean for your PGY year 5.2 7.4 5.0 7.6 6.4 7.6 4.3 7.9 7.7 6.7 65.9
Mean for whole group 6.4 7.4 5.9 8.0 7.2 7.3 5.9 7.7 7.8 7.2 70.6
Sample of OSCE results table
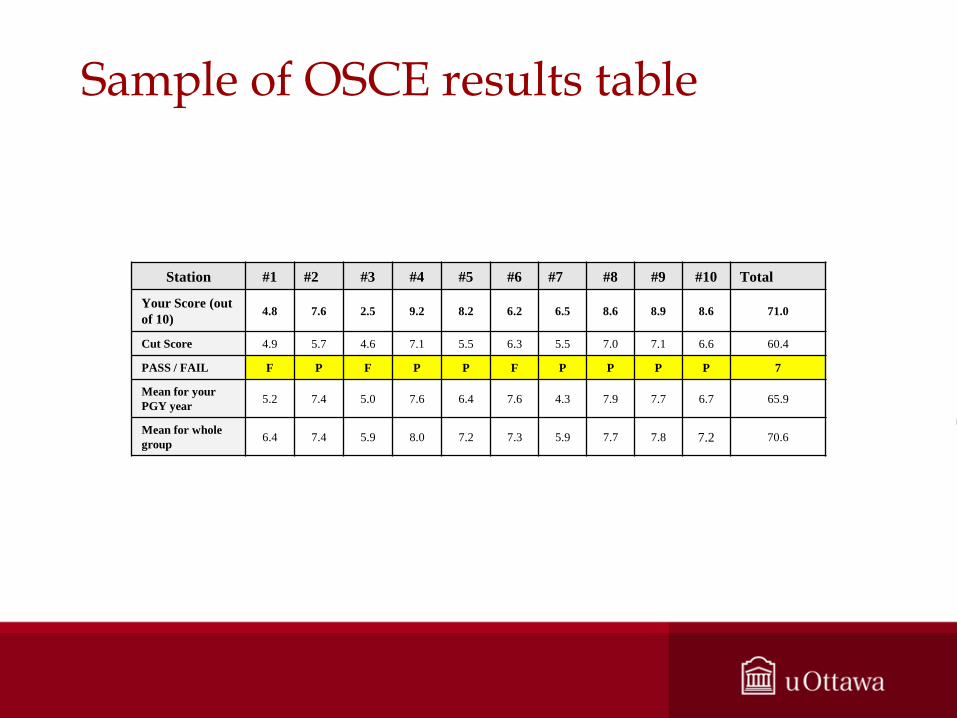
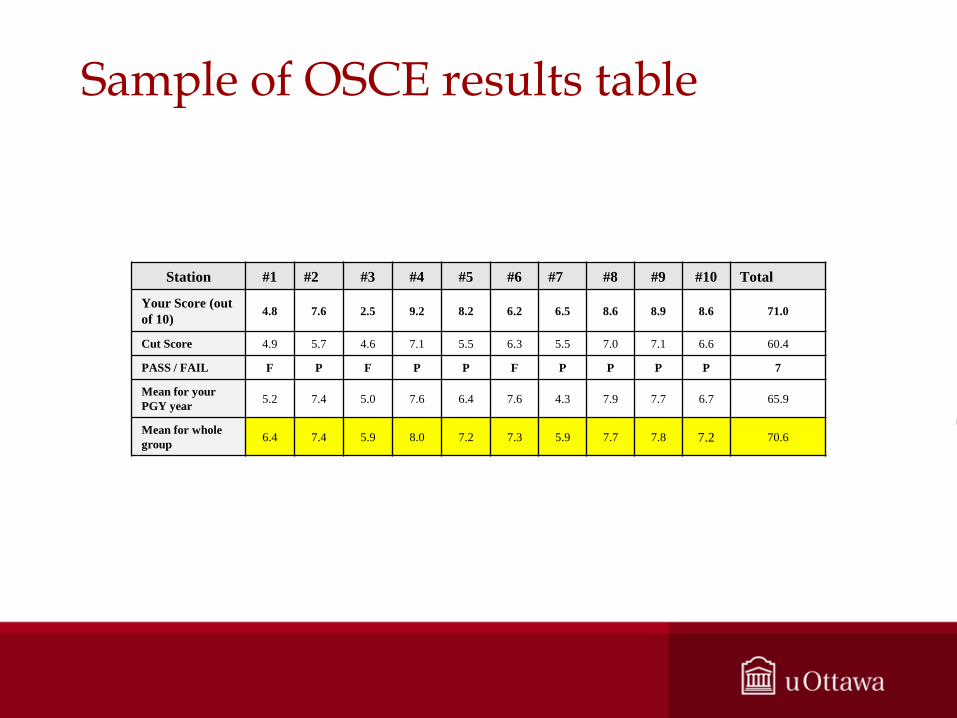

What’s the problem?
• Candidates might: – “fail” the OSCE, but still be performing at
appropriate level – “pass” the OSCE, but be performing below
the expected level • Misleading results for PGY means due to
small n in each group – skewed by a few high or low performers
within a group

Purpose
• To develop and validate a new type of rating scale to specifically address the issue of assessing residents from various levels of training in the same OSCE

Methods
• 10 station OSCE – Structured orals, physical examinations (on
SPs), procedures (on mannequins) and communication stations
• Candidates from PGY-1 to PGY-4
• Difficulty of exam set at PGY-4 level

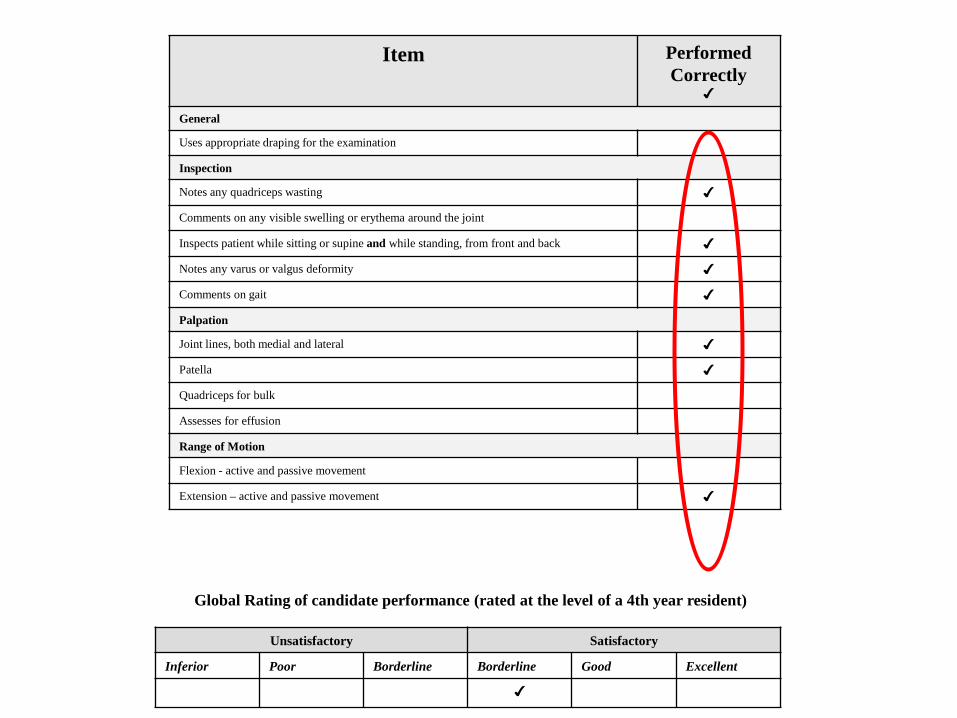
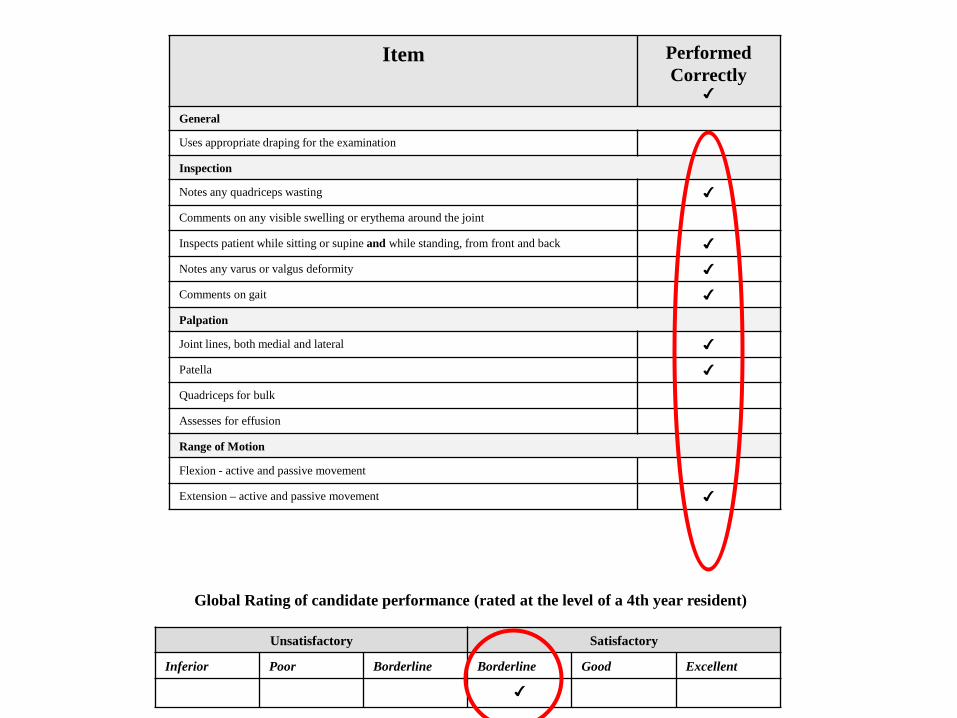
Methods - Scoring
• Assessed by physician examiners using: – Checklist (dichotomous)
– Global Rating Scale (expert judgment)
– Newly developed Training Level Rating
Scale (from Medical Student to PGY-4) •Type of GRS

Item Performed Correctly
✔
General
Uses appropriate draping for the examination
Inspection
Notes any quadriceps wasting ✔
Comments on any visible swelling or erythema around the joint
Inspects patient while sitting or supine and while standing, from front and back ✔
Notes any varus or valgus deformity ✔
Comments on gait ✔
Palpation
Joint lines, both medial and lateral ✔
Patella ✔
Quadriceps for bulk
Assesses for effusion
Range of Motion
Flexion - active and passive movement
Extension – active and passive movement ✔
Unsatisfactory Satisfactory
Inferior Poor Borderline Borderline Good Excellent
✔
Global Rating of candidate performance (rated at the level of a 4th year resident)

Medical Student
PGY-1 PGY-2 PGY-3 PGY-4
In your opinion, this resident is functioning at the level of a:
Training Level Rating Scale

Methods - Survey
• Survey about rating scale preferences
– Residents
– Examiners
– Program directors (for IM and sub-specialities)

Results…

Mean Overall Score
Number of Failures
Percentage of Failures
PGY-1 n = 21
53.6 13 61.9%
PGY-2 n = 17
65.2 2 11.8%
PGY-3 n = 13
66.0 4 30.8%
PGY-4 n =18
72.6 1 5.6%
Average score by PGY level
• 69 participants • 20 failures (29%)

Mean Overall Score
Number of Failures
Percentage of Failures
PGY-1 n = 21
53.6 13 61.9%
PGY-2 n = 17
65.2 2 11.8%
PGY-3 n = 13
66.0 4 30.8%
PGY-4 n =18
72.6 1 5.6%
Average score by PGY level
• 69 participants • 20 failures (29%)
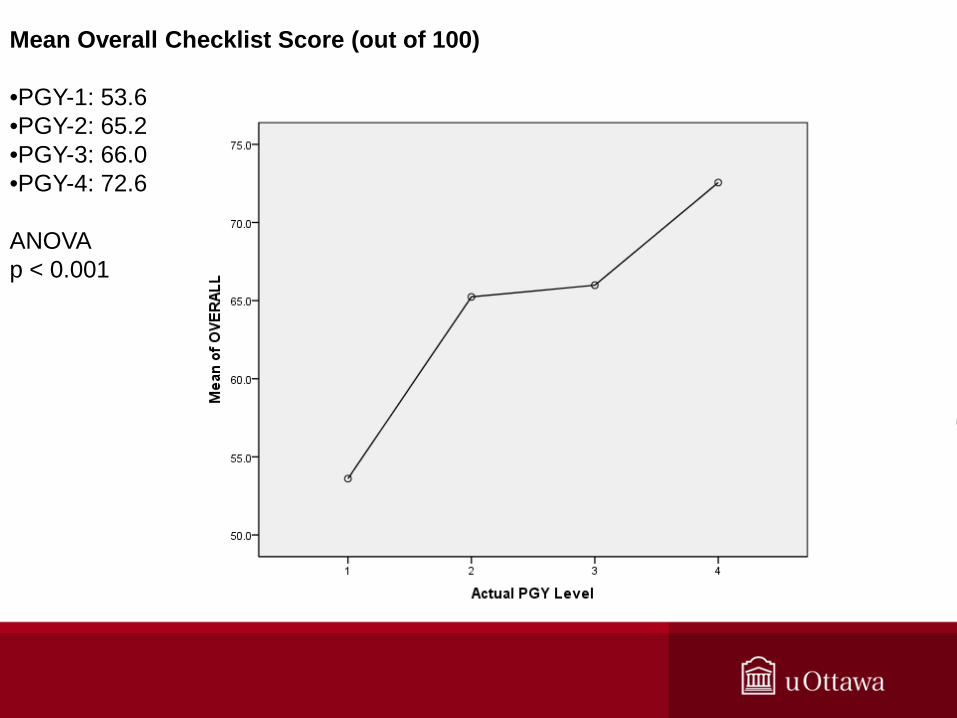
Mean Overall Checklist Score (out of 100)
•PGY-1: 53.6 •PGY-2: 65.2 •PGY-3: 66.0 •PGY-4: 72.6 ANOVA p < 0.001

Mean Global Rating Scale Score (Inferior = 1; Excellent = 6) •PGY-1: 3.5 •PGY-2: 4.4 •PGY-3: 4.5 •PGY-4: 5.0 ANOVA p < 0.001

Mean Training Level Rating Score (Med Student = 0; PGY4 = 4) •PGY-1: 1.3 •PGY-2: 2.4 •PGY-3: 2.6 •PGY-4: 3.1 ANOVA p < 0.001
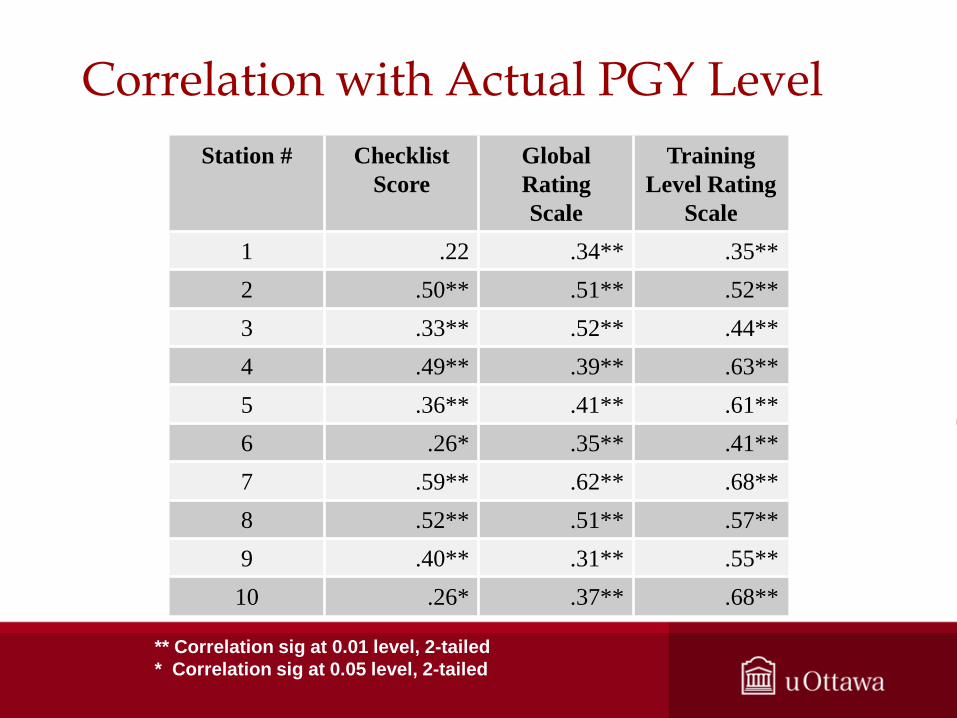
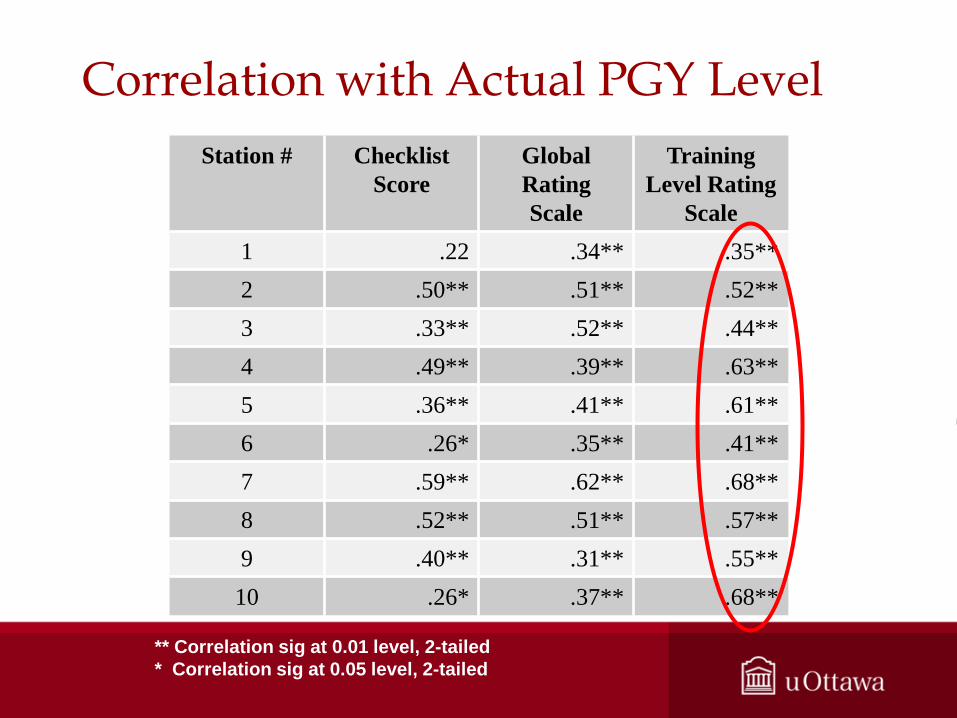
Station # Checklist Score
Global Rating Scale
Training Level Rating
Scale 1 .22 .34** .35** 2 .50** .51** .52** 3 .33** .52** .44** 4 .49** .39** .63** 5 .36** .41** .61** 6 .26* .35** .41** 7 .59** .62** .68** 8 .52** .51** .57** 9 .40** .31** .55**
10 .26* .37** .68**
Correlation with Actual PGY Level
** Correlation sig at 0.01 level, 2-tailed * Correlation sig at 0.05 level, 2-tailed

PGY Level
Global Rating Score
Transformed (out of 10)
Training Level Rating Score Transformed
(out of 10)
Significance
1 5.8 2.6 P < 0.001 2 7.3 4.7 P < 0.001 3 7.5 5.1 P < 0.001 4 8.3 6.2 P < 0.001
Are Global Rating Scale Scores Inflated? Paired t-test

PGY Level
Global Rating Score
Transformed (out of 10)
Training Level Rating Score Transformed
(out of 10)
Significance
1 5.8 2.6 P < 0.001 2 7.3 4.7 P < 0.001 3 7.5 5.1 P < 0.001 4 8.3 6.2 P < 0.001
Are Global Rating Scale Scores Inflated? Paired t-test

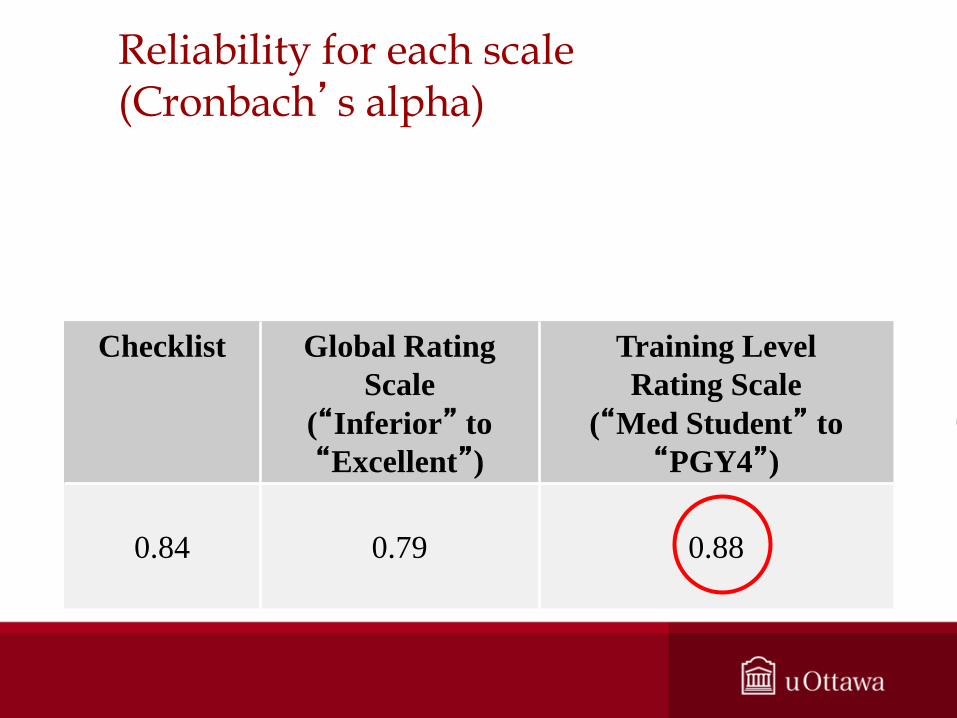
Reliability for each scale (Cronbach’s alpha)
Checklist Global Rating Scale
(“Inferior” to “Excellent”)
Training Level Rating Scale
(“Med Student” to “PGY4”)
0.84
0.79
0.88
Reliability for each scale (Cronbach’s alpha)
Checklist Global Rating Scale
(“Inferior” to “Excellent”)
Training Level Rating Scale
(“Med Student” to “PGY4”)
0.84
0.79
0.88
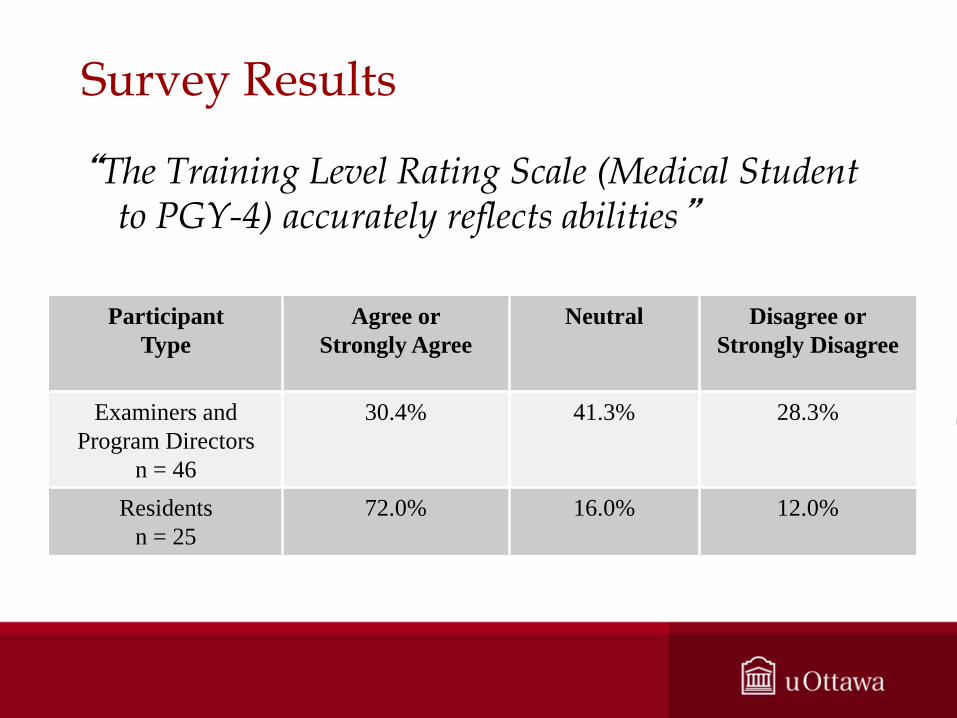
Participant Type
Agree or Strongly Agree
Neutral Disagree or Strongly Disagree
Examiners and Program Directors
n = 46
30.4% 41.3% 28.3%
Residents n = 25
72.0% 16.0% 12.0%
Survey Results
“The Training Level Rating Scale (Medical Student to PGY-4) accurately reflects abilities”

Participant Type
Agree or Strongly Agree
Neutral Disagree or Strongly Disagree
Examiners and Program Directors
n = 46
30.4% 41.3% 28.3%
Residents n = 25
72.0% 16.0% 12.0%
Survey Results
“The Training Level Rating Scale (Medical Student to PGY-4) accurately reflects abilities”

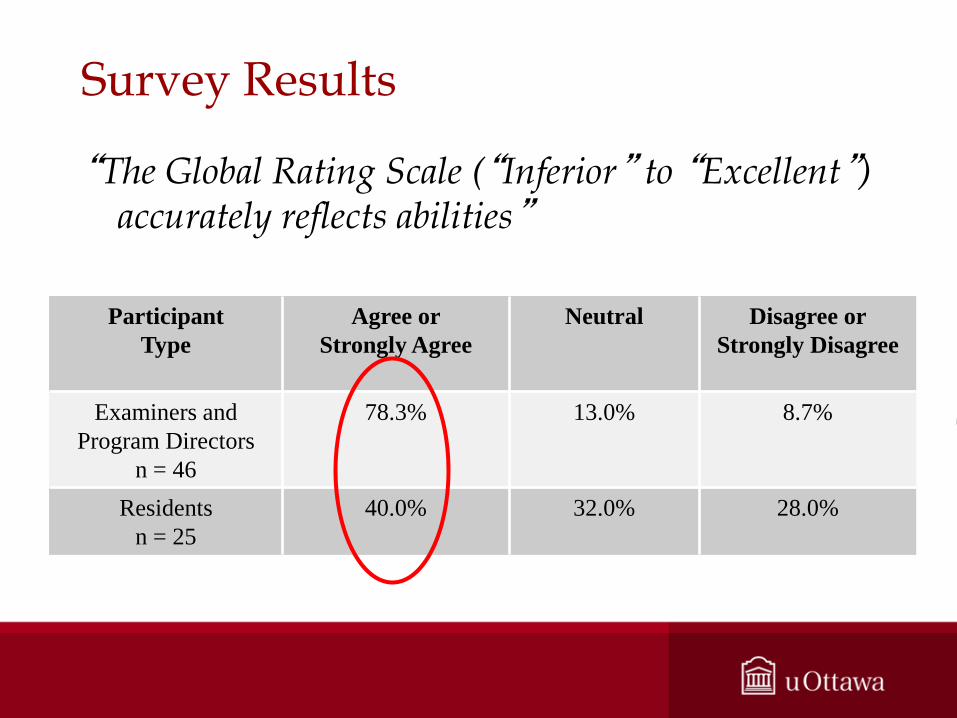
Participant Type
Agree or Strongly Agree
Neutral Disagree or Strongly Disagree
Examiners and Program Directors
n = 46
78.3% 13.0% 8.7%
Residents n = 25
40.0% 32.0% 28.0%
Survey Results
“The Global Rating Scale (“Inferior” to “Excellent”) accurately reflects abilities”
Participant Type
Agree or Strongly Agree
Neutral Disagree or Strongly Disagree
Examiners and Program Directors
n = 46
78.3% 13.0% 8.7%
Residents n = 25
40.0% 32.0% 28.0%
Survey Results
“The Global Rating Scale (“Inferior” to “Excellent”) accurately reflects abilities”

Conclusions • A Training Level Rating Scale can be useful for
assessing trainees from different levels of training in an OSCE – Correlates moderately with actual level of training – Less “halo” effect – Excellent reliability – Acceptability by trainees
• We hope this information can be used:
– by learners for feedback – by Program Directors to identify poor performers
early in their training

Acknowledgments
• Dr. Claire Touchie • Dr. Timothy J. Wood • Dr. Susan Humphrey-Murto
• Ottawa Exam Centre Staff

An examinee with a sense of humour…


