
VALUE CHAIN ANALYSIS OF THEARTISANAL FISHERIES - MAURITIUS
June 2012
REPORT/RAPPORT : SF/2012/8
EuropeanUnion
Funded by
Photo by Yann Yvergniaux

Implementation of a Regional Fisheries Stategy For The Eastern-Southern Africa And Indian Ocean Region
10th European Development FundAgreement No: RSO/FED/2009/021-330
“This publication has been produced with the assistance of the European Union. The contents of this publication are the sole responsibility of the author and can in no way be taken to the views of the European Union.”

Implementation of a Regional Fisheries StrategyFor The Eastern-Southern Africa and India Ocean Region
Programme pour la mise en oeuvre d'une stratégie de pêche pour laregion Afrique orientale-australe et Océan indien
Value Chain Assessment of the Artisanal Fisheries - Mauritius
SF/2012/8Soobaschand Sweenarain
This report has been prepared with the technical assistance ofLe présent rapport a été réalisé par l'assistance technique de
Juin 2012
EuropeanUnion
Funded by
Implementation of a Regional Fisheries Stategy For The Eastern-Southern Africa And Indian Ocean Region
10th European Development FundAgreement No: RSO/FED/2009/021-330
“This publication has been produced with the assistance of the European Union. The contents of this publication are the sole responsibility of the author and can in no way be taken to the views of the European Union.”


Table of Content
List of Abbreviations & Acronyms …………………................................................ 5
Acknowledgements……………………………………………................................... 6
Preface……………………………………………………………………....................... 7
Layman’s Summary………………………………………………................................ 11
Résumé des Non-initiés……………………………………….................................... 11
Executive Summary……………………………………………................................... 11
Résumé Analytique…………………………………………….................................... 17
1.0 Introduction.................................................................................................................. 25 1.1 Work Plan and Implementation ........................................................................... 25 1.2 Methodology.... .................................................................................................... 26 1.3 Analysis................................................................................................................ 27
2.0 Overview of the Artisanal Fisheries Sub-sector.................................................... 28 2.1 Fisheries Policies................................................................................................... 28 2.2 Supporting Institutions ....................................................................................... 28 2.3 On-going Programmes in the Artisanal Fisheries .................................................. 29 2.4 Coastal Fisheries Infrastructure ........................................................................... 29 2.5 Fish Resources in the Lagoon and Off-lagoon..... .................................................. 30 2.6 Supply of Fresh Fish.............................................................................................. 31 2.7 Fisher Community................................................................................................. 31 2.8 Fishing Equipment................................................................................................ 31 2.9 Fishing Gears........................................................................................................ 32 2.10 Preservation of Fish on Board............................................................................... 33
3.0 VCA of Fishing Enterprises........................................................................................ 34 3.1 Case Study I – Hand Line Fishing Unit / Enterprise................................................ 35 3.2 Case Study II – Basket Trap Fishing Unit................................................................ 37 3.3 Case Study III – Large Net Fishing Cooperative / Enterprise................................... 38 3.4 Case Study IV – Non-Motorized Boat Hand Line Unit ........................................... 39 3.5 Case Study V - On-foot Hand Line & Harpoon Fishing.......................................... 40 3.6 Summary of Economic Indicators of Artisanal Fisheries........................................ 41 3.7 ProfitabilityofFishingEnterprise–Rs/Kg............................................................. 42 3.8 Cash Flow Management....................................................................................... 42 3.9 Bio-Economic Approach of the Artisanal Fisheries................................................ 43
4.0 Fresh Fish Trade in Mauritius.................................................................................... 46 4.1 Fishmongers......................................................................................................... 47 4.2 Marketing and Distribution Logistics.................................................................... 48 4.3 Pricing Mechanism............................................................................................... 49
5.0 VCA of Marketing Channels..................................................................................... 51 5.1 Case Study VI – Integrated Coastal Retailer of Hand Line Harvested Fish.............. 51 5.2 CaseStudyVII–IntegratedCoastalRetailerofBasketTrapHarvestedfish...........52

5.3. Case study VIII – Wholesaler of Large Net & Basket Trap Harvested Fish............... 53 5.4. Case study IX – Municipal Fish Retail Outlet......................................................... 54 5.5. Case Study X – Fish Stall in a Hypermarket........................................................... 55
6.0 Distribution of Value Added Between Fishing and Marketing Functions.....56 6.1 HL Integrated (Fishing and Marketing) Activities .................................................. 56 6.2 BT Integrated (Fishing and Marketing) Activities.................................................. 57 6.3 HL and Supermarket Fish Stall Integrated Activities.............................................. 57 6.4 LN Fishing and Institutional Fish Market Integrated Activities.............................. 57 6.5 Integrated Fishing and Marketing Activities – Non-Motorized HL Boats............... 58 6.6 On-foot Fishers - Integrated Fishing and Marketing Activities.............................. 58 6.7 Summary of Case Study Results............................................................................ 59
7.0 Results and Discussions ............................................................................................ 60 7.1 Management and Monitoring Measures .............................................................. 60 7.2 FLS and LFC as the Focal Point.............................................................................. 61 7.3 Handling and Preservation of Fresh Fish............................................................... 62 7.4 Processing and Value Added Activities..................................................................62 7.5 New Concept of Fish Terminal...............................................................................63
8.0 Recommendations...................................................................................................... 64
Appendix 1: Terms of Reference........................................................................................... 69
Appendix 2: Commercial Category of Fish Harvested by the Artisanal Fisheries... 71
Appendix 3: Fishing Business Model................................................................................... 73
Appendix 4: Consolidated Data – Reg. Fishers / Fishing Boats / Fishmongers........ 75
Appendix 5: Catch Composition of the Artisanal Fisheries - Year 2010................. 75
Appendix 6: Questionnaire 2 - Distribution and Marketing Channels................... 76
Appendix 7: Questionnaire 2 – Fishing Enterprise................................................ 79
Appendix 8: Fish Landing Stations (FLS) Around Mauritius.................................. 82
Appendix 9: List of Persons Met........................................................................................ 83
Appendix 10: References........................................................................................................ 84
List of Publications ................................................................................................................. 85

7SmartFish Programme Report SF/2012/8
LIST OF ABBREVIATIONS & ACRONYMSAFRC Albion Fisheries Research CentreBDS Business Development ServicesCA Competent AuthorityCOP Code of PracticeCOP Cost of ProductionCOS Cost of SalesCPBL Catch Per Boat LandingCPFD Catch Per Fisherman DayCSP Consumer Sale Price DBM Development Bank of Mauritius EEZ Exclusive Economic Zone EFAM Electronic Fish Auction Market ESA – IO East-Southern Africa - Indian Ocean EU European Union FD Fisheries Department FAD Fish Aggregating Device FGD Focus Group Discussion FIT Fishermen Investment Trust FITEC Fishermen Investment Trust Extension Centre FLS Fish Landing Station FPO FisheriesProtectionOfficer HACCP Hazard Analysis and Critical Control PointsHP Horse Power IFAD International Fund for Agricultural DevelopmentIFRS Implementation of Fisheries Regional StrategiesIOC Indian Ocean Commission L/T Long Term LFC Local Fisher Community M/T Medium term MC Marketing Cost MdP Maison des Pêcheurs MM Marketing Margin MOFR Ministry of Fisheries and Rodrigues MP MarketingProfit MSY Maximum Sustainable Yield PM ProfitMargin PSP Producer Sale Price RRA Rural Rapid Appraisal S/T Short Term SMEDA Small Medium Enterprises Development AuthoritySTE Short Term Expertise T Metric Tonne TC Total Cost VCA Value Chain Analysis WSP Wholesale Price
8 SmartFish Programme Report SF/2012/8
ACKNOWLEDGEMENTS
The consultant wishes to thank the following institutions and people for their valuable assistance in bringing up this report.
Ministry of Fisheries and Rodrigues• Mr.D.Mauree• Mr.VishnuSoondroon• Mr.MarayvenNallee• Mr.SatishKheedun
Fisheries Enumerators• Mr.Munisami• Mr.FBBholah• Mr.D.Bolaky• Mr.S.SokAppadu• Mr.S.Mohabir• Mr.SRamkisson
Ministry of Cooperatives, Small and Medium Business Enterprises• Dr.ManojNandooarsingh
Fishermen Investments Trust• Mr.AdilBunwaree
Fishermen Investments Trust Extension Centre• Mr.B.Ramcharrun
Mauritius Fishermen Cooperative Federation• Mr.PatrickFortuno
AuriflaLimited• Mr.RPermall

9SmartFish Programme Report SF/2012/8
PREFACE
Value Chain Assessment: Artisanal Fisheries of Mauritius & Rodrigues
Within the broader framework of the IOC SmartFish programme (Implementation of a Regional Fisheries Strategy for ESA-IO programme), component Result 4, Regional Trade Development, this report has been prepared to assist theMinistryofFisheries&Rodrigues inMauritiustobetterunderstandthesituation intheartisanalfisheryfromaneconomic and value perspective. This will allow for objective planning for potential interventions to assist in the move towardsamoremarketdrivenandsustainablefisherythatwillenhanceandcontributetothegrowingdemandforfishinthecountryinthelong-term,whilstmaintainingthesocio-economicvalueofthefisheryinthecountry.
Thisreportlookscloselyatthedifferenttypesoffishingmethodswithintheartisanalsub-sector,suchasthehand-line(motorizedandnon-motorized)fishery,thebaskettrapfishery,thelargenetfisheryaswellastheon-footfishery.Itprovides a detailed analysis of performance in terms of typical business models for each unit and makes assessments of performance with respect to catch potential, capacity /over-capacity vs. stocks and estimated MSY. Ultimately the impactonthelocalfishingcommunities,aswellasthebroaderissueofincreasingdemandinthecountry,isaddressedandhowtore-modelandempowertheartisanalfisherytobetterservetheeconomy,aswellasthelocalpopulation.Recommendations for short-term interventions are made to inform the many stakeholders of what works and what doesn’tworksowellandaviewtothefutureforeveryone’sbenefit.
Regionally,smallislandartisanalfisheries,aswellasregionalcoastalartisanalfisheriesarealldealingwithissuesofover-capacity and depleted stocks in coastal lagoons, as well as deciding how to ensure future productivity of the sector wherelocalfishersderiveasignificantpartoftheirlivelihoodsfromfishing.Thisreportwillcontributetotheregionalknowledge in this regard and inform other initiatives to be planned regionally under the SmartFish programme.
Thisreport isthefirststepandasimilarexerciseistobeimplementedfortheislandofRodrigues.Althoughsomesimilaritiesareexpected,thereareverydifferentaspectstoeachofthesefisheriestobeunderstood.

10 SmartFish Programme Report SF/2012/8
LAYMAN’S SUMMARY
The study has carried out an economic appraisal of the production and marketing systems in the artisanal fisheries in Mauritius. The results have shed some light on the profitability of the different enterprises involved in the supply chain and on the distribution of value added or profit between fishing and marketing. The major problems identified in the fisheries are namely; open access which is tantamount to overfishing; obsoleteness of fisheries infrastructure; over-investments in fishing operations; and, absence of a food safety and quality standard for the fresh fish on the local markets. Appropriate measures have been recommended to drive the artisanal fisheries on the path socio-economic and ecological sustainability.
RÉSUMÉ DES NON-INITIÉS
Uneétuded’analyseéconomiqueestentreprisedanslesfilièresdelapêcheetdelacommercialisationdanslesecteurde la pêche artisanale à Maurice. L’étude a apporté un éclairage sur la rentabilité des différentes entreprises dans la filièreetsurlepartagedelavaleurajoutéeentrelescomposantesdelapêcheetcellesdelacommercialisation.Lesproblèmes identifiésdans lesous-secteursontentreautres, le libreaccèscequicomporteunrisquepotentieldesurpêche,surinvestissementsdans lesoutilsdeproduction,mauvaisétatdes infrastructuresdelapêchecôtièreetl’absence des normes sanitaires et de qualité des produits de pêche sur les marchés locaux. Des actions nécessaires ont été recommandées pour que la pêche artisanale soit socio-économiquement et écologiquement soutenable.
EXECUTIVE SUMMARY
This study was commissioned by the Ministry of Fisheries and Rodrigues of Mauritius and executed by the Implementation of Regional Fisheries Strategies for the ESA-OI under the aegis of the Indian Ocean Commission funded by the EuropeanUnion. Itsprincipalobjective is tocarryout avaluechainanalysisof theartisanal fisheries sub-sector inMauritius to assess the economic performance of its production functions and marketing channels. Based on the findings,recommendationsaremadetoenhanceoverallefficienciesintheartisanalfisherieswhiletakingintoaccountthe social and ecological implications.
Actuallytheartisanalfisheriesarethemainsuppliersoffreshfishtothelocalmarketswithanannualproductionof830metrictonnes.Asof2010therewere1,620registeredfishers,1,605fishingboatsand400activefishmongersinthesub-sector.ThetargetedfishstockshaveattainedtheirMSY.TheCPFDisat6.4kgoverthepast3years.TheMOFRprovidesaplethoraofincentivestodivertfishingeffortsfromthelagoontooff-lagoondeep-seaFADanddemersalfisheriesinordertorelievefishingpressureinthelagoon. Thereare60FishLandingStations(FLS)aroundMauritiusthatserveasoperationalbasetothecoastalfishingfleet.Theyaremandatedforunloadingoffish,datacollectionandprimarysaleoffish.Intheearly70’stheywereconceivedtoprovidebasicfacilitiesforcleaning,sortingandmarketingoffish.Actuallymostofthemhaveoutlivedtheirpurposesand are out of use. The decline of the Local Fishing Community (LFS) has had a negative impact on the development andmanagementofthecoastalfisheriesandtheorganisationoftheLFC.EffortsarebeingmadebytheMinistrytorehabilitate the FLS network around the island in consultation with the LFC.
Amajorconcernfortheartisanalfisheriesistheabsenceofafoodsafetyandqualitystandardalongthesupplychain,fromcapturetoconsumption.Preservationoffishonboardisrudimentaryornon-existent.FlakeIceisnotavailablearoundtheislandparticularlyattheFLS.Traditionalboatsarenotequippedwithfishholdsandiceissimplynotused.
11SmartFish Programme Report SF/2012/8
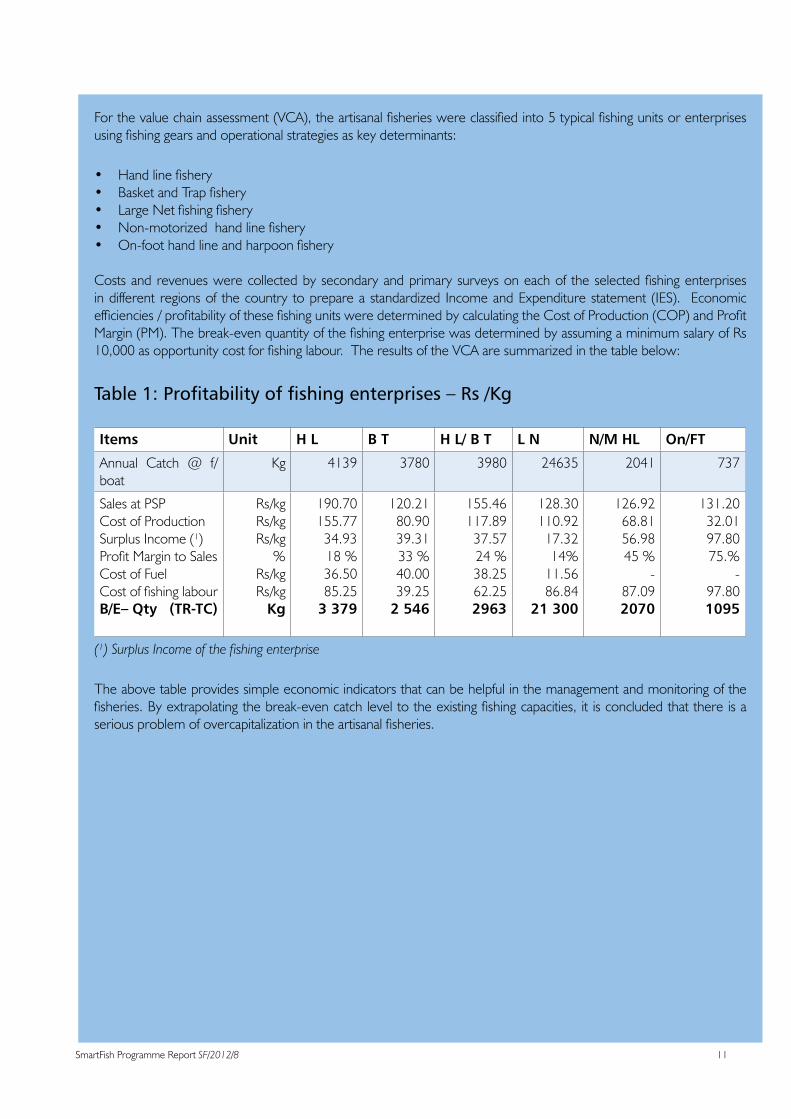
Forthevaluechainassessment(VCA),theartisanalfisherieswereclassifiedinto5typicalfishingunitsorenterprisesusingfishinggearsandoperationalstrategiesaskeydeterminants:
• Handlinefishery• BasketandTrapfishery• LargeNetfishingfishery• Non-motorizedhandlinefishery• On-foothandlineandharpoonfishery
Costs and revenueswerecollectedby secondaryandprimary surveysoneachof the selectedfishingenterprisesin different regions of the country to prepare a standardized Income and Expenditure statement (IES). Economic efficiencies/profitabilityofthesefishingunitsweredeterminedbycalculatingtheCostofProduction(COP)andProfitMargin(PM).Thebreak-evenquantityofthefishingenterprisewasdeterminedbyassumingaminimumsalaryofRs10,000asopportunitycostforfishinglabour.TheresultsoftheVCAaresummarizedinthetablebelow:
Table1:Profitabilityoffishingenterprises–Rs/Kg
Items Unit H L B T H L/ B T L N N/M HL On/FT
Annual Catch @ f/ boat
Kg 4139 3780 3980 24635 2041 737
Sales at PSPCost of Production Surplus Income (¹)ProfitMargintoSalesCost of FuelCostoffishinglabourB/E– Qty (TR-TC)
Rs/kgRs/kgRs/kg
%Rs/kgRs/kg
Kg
190.70155.7734.9318 %36.5085.25
3 379
120.2180.9039.3133%40.0039.25
2 546
155.46117.8937.5724 %38.2562.252963
128.30110.9217.3214%11.5686.84
21 300
126.9268.8156.9845%
-87.092070
131.2032.0197.8075.%
-97.801095
(¹) Surplus Income of the fishing enterprise
The above table provides simple economic indicators that can be helpful in the management and monitoring of the fisheries.Byextrapolatingthebreak-evencatchleveltotheexistingfishingcapacities, it isconcludedthatthereisaseriousproblemofovercapitalizationintheartisanalfisheries.

12 SmartFish Programme Report SF/2012/8
Table2:EstimatesofSurplusfishingcapacitiesatcurrentMSYlevel
Items HL BT BT/HL LN O/f–HL/H TOTAL
Annual Catch PercentageMean Catch @ f/ boat (kg)
22712%
4 139
26711%
3780
2836%
3960
2226%
24635
8735%737
831100%
Optimal No. f/boats (N)Optimal On-foot fishers (N)
54-
150-
7-
27-
-118
238
ActivefishingboatsActiveon-footfishers
678 761 139 27 -134
1605
Surplus fishing boats (N)Surplus On-foot fishers (N)
624-
611-
132-
0-
-16
1367
AtthecurrentMSY,theartisanalfisheriescansustain238fishingboatsand832fishersincluding118on-footfishers.Thereisasurplusof1367boatsand788registeredfishersincluding16on-footfishers.Thesituationismorealarminginrealitybecausethecoastalfisheries,withtheexceptionoftheLNfisheryareopenaccess.On the marketing side, a preliminary survey was carried out to have an in-depth understanding on the market structures andmarketingchannelsof theartisanalfisheries.Toaddress theVCA in themarketingchannels,MarketingMargin(MM),MarketingCost(MC)andMarketingProfit(MP)weredetermined.Thefreshfishmarketissupplydrivenandthemarketpricehashighvolatile.Infacttherearenearly400activefishmongerschasing830metrictonnesoffreshfishannually.Anincreasingnumberoffishmongersareownersoffishingboatsasapartofabusinessstrategytosecurearegularsupplyoffish.Someotherswouldactasindigenousbankerstofishingenterprisestogainpriorityoftheircatch.Alsoanincreasinglylargenumberoffishingenterprisesinthecoastalareashavediversifiedintoroadsidefishretailingas a household business.
Figure1:FlowchartofthemarketchannelsoffreshfishinMauritius
End Consumers Exports
Super / hyper MarketsFish Shops Hotel & Restaurants
Retailer / Wholesalers F/boat owner (N= 150)
Wholesaler/ Distributors(N= 10)
Fishers (N=1655) – F/Boats (N=1700) – Production (830 t)
Retailers FLS(N=100)
N:3
Inland Retail Outlets:Town & Large Village Markets, 340Roadside & Ambulant vendors
L
O
G
I
S
T
I
C
S
13SmartFish Programme Report SF/2012/8
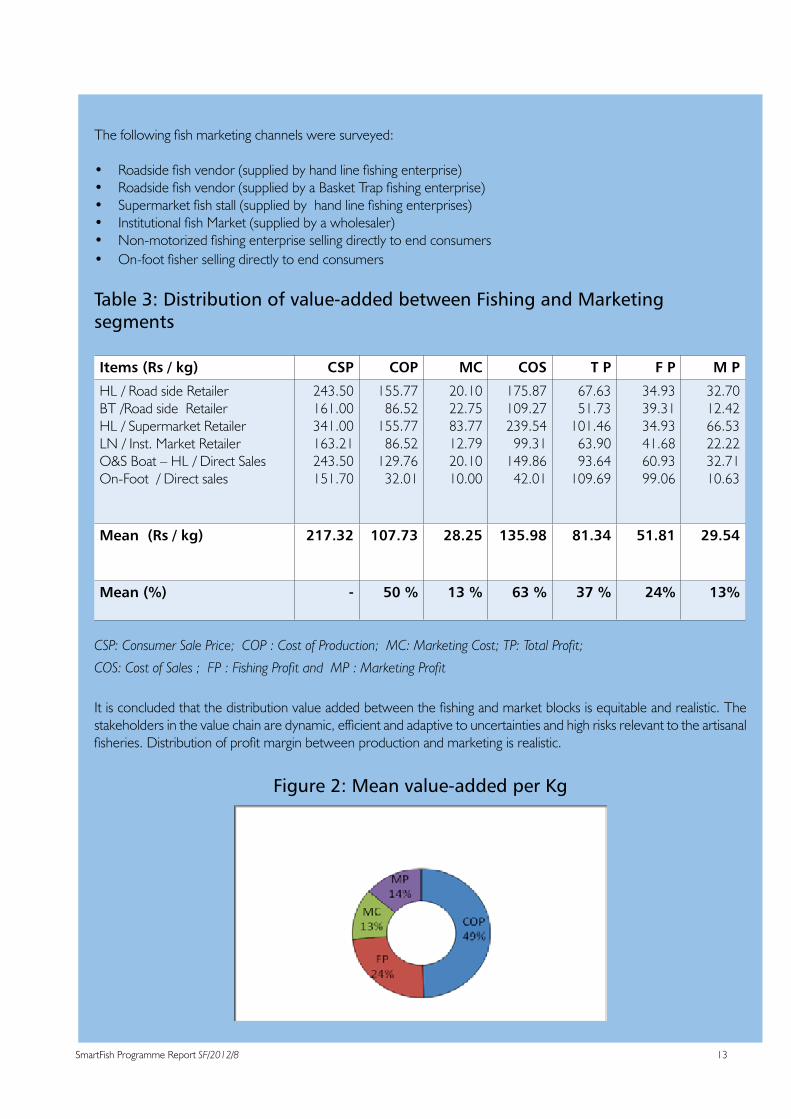
Thefollowingfishmarketingchannelsweresurveyed:
• Roadsidefishvendor(suppliedbyhandlinefishingenterprise)• Roadsidefishvendor(suppliedbyaBasketTrapfishingenterprise)• Supermarketfishstall(suppliedbyhandlinefishingenterprises)• InstitutionalfishMarket(suppliedbyawholesaler)• Non-motorizedfishingenterprisesellingdirectlytoendconsumers• On-footfishersellingdirectlytoendconsumers
Table 3: Distribution of value-added between Fishing and Marketing segments
Items (Rs / kg) CSP COP MC COS T P F P M P
HL / Road side RetailerBT /Road side RetailerHL / Supermarket RetailerLN / Inst. Market RetailerO&S Boat – HL / Direct SalesOn-Foot / Direct sales
243.50161.00341.00163.21243.50151.70
155.7786.52155.7786.52
129.7632.01
20.1022.7583.7712.7920.1010.00
175.87109.27239.5499.31
149.8642.01
67.6351.73
101.4663.9093.64
109.69
34.9339.3134.9341.6860.9399.06
32.7012.4266.5322.2232.7110.63
Mean (Rs / kg) 217.32 107.73 28.25 135.98 81.34 51.81 29.54
Mean (%) - 50 % 13 % 63 % 37 % 24% 13%
CSP: Consumer Sale Price; COP : Cost of Production; MC: Marketing Cost; TP: Total Profit;
COS: Cost of Sales ; FP : Fishing Profit and MP : Marketing Profit
Itisconcludedthatthedistributionvalueaddedbetweenthefishingandmarketblocksisequitableandrealistic.Thestakeholdersinthevaluechainaredynamic,efficientandadaptivetouncertaintiesandhighrisksrelevanttotheartisanalfisheries.Distributionofprofitmarginbetweenproductionandmarketingisrealistic.
Figure2:Meanvalue-addedperKg

14 SmartFish Programme Report SF/2012/8
MarketingCostisnegligibleoftheshortdistributionnetworkandlowcapitalinvestmentinlogistics.Itrepresents13%oftheCSP.Howevermarketingcostfordedicatedfishstallinsupermarketsishigher(25%oftheCSP)andobviouslyitisrewardedbyahigherprofitmargin(20%).Theimplementationforfoodsafetyandqualitystandardhastobeviewedas market opportunities instead of cost constraints. There should be no resistance on the part of marketing channels to comply with a food safety and quality standard. Actually the development of micro and small processing and value addedenterprisesisonstandstillmainlyduetoshortageofsupplyoffreshfishandabsenceoffoodsafetyandqualitynorms.Howeverthemarketprospectsaregood.Theculturalheritageoftheartisanalfisheriescanbepromotedasanattractionforthetourismindustry.Anewconceptoffishterminalisproposedtotapadditionalrevenueforfishercommunity from the growing number of foreign visitors in the country. Thestudyhasconcludedandrecommendedthefollowing:• There is a potential risk of overfishing in the artisanal fisheries because the active fishing capacities exceed inmanifoldthesustainablelevel.Thereisanurgentneedtoundertakeariskassessmentonfishstocksharvestedinthe lagoon and off-lagoon.
• The coastal ecosystem is under more intense pressure from an increasingly large number of (non-registered) professional,amateurandsportfishers.Todoawaywiththeprevailingopenaccessenvironment,itisrecommendedto conduct a survey on the activities of the amateur and sport fisheries leading to the implementation of anappropriateregulatoryframeworktomanageandmonitorthesefisheriesatparwiththeartisanalfisheries.
• Thepresentfisheriesstatisticalmodel includingsamplinganddatacollectionstrategieshasoutlived itspurposeand it is high time to replace it. The new system must be capable of integrating the activities of amateur and sport fisheries.
• Anappropriatebio-economicmodelfortheartisanalfisherieshastobedevelopedtoserveasamanagementtool
kit.
• AnEconomicUnitheadedbyafisherieseconomisthastobesetwithintheAFRC.Itwillberesponsibleforallsocio-economicissuesrelatedthefisheriessector,inparticulartheartisanalfisheries.
• TheFLSnetworkhastoberehabilitatedattheearliestwiththeinvolvementofthelocalfishercommunities.LFCshave to be empowered with local governance, leadership and co-management skills to bring about a shift from an externalenforcementapproachtosharedgoalsandresponsibilitiesinfisheriesmanagement.ItisindicatedthatIFAD-MARS is committed to fund a study on a comprehensive management plan for the lagoon and off-lagoon fisherieswithintheframeworkoftheupcomingFisheriesMasterPlan.
• There should be no compromise regarding safety and quality of fresh fish placed on the localmarkets. TheguidelineforadetailedactionplanfortheenforcementoftheCOP–HandlingandPreservationoffreshfishisenumeratedasfollows:
- Launch an awareness campaign at the national level using audio-visual means and FGD to sensitize consumersandproducersofthecriticalneedforfoodsafetyandqualityoffreshfishonthelocalmarketsandparticularlytheuseofice-flakesforfishpreservation.
- Conductanauditontheexistingfisheriesinfrastructurefromtheperspectiveoftheimplementationof the COP – “Handling and Preservation of Fresh Fish” as minimum food safety and quality in the artisanalfisheries.
- EnforcementoftheCOP–HandlingandPreservationof freshfishbytheMOFRasanationalfoodsafetyandqualitystandardforthemarketingoffreshfish.

15SmartFish Programme Report SF/2012/8
- Development of a human resources plan at public and private sector levels to ensure the smooth implementation of the safety and quality standard.
- Implement a pilot project on COP – Handling and Preservation of Fresh Fish based on
voluntary compliance at Tamarin or Trou d’eau Douce where an ice-plants exists, to showcase its importance.
• To develop a new concept of a Fish Terminal at strategic locations to serve equally as a tourist attraction, as a strategy tomaximise revenueof the artisanal fisheries.The cultural heritageof the fisher communities, theeveryday activities at the fishingwharf and seafoodmarketwill bemain theme of this concept. The projectwillcreatepositiveinteractions/synergiesbetweenartisanalfisheriesandthetourismsector.Itisproposedtoprepare a pre-feasibility study and business plan for the development of a pilot project to be located at “Maison des Pêcheurs” complex, Fishermen Village of Mahebourg Waterfront.
• The prospects for the development of micro and small scale processing and value addition activities will grow progressivelywithan increase inthesupplyof freshfish.FITECwillhavetoadoptapro-activeandone-stop-shop approach to assist promoters through project facilitation, training in technical and entrepreneurial skills and mentoring.
• To strengthen management and extension capacities of AFRC, by creating an Economic Observatory headed by afisherieseconomist.Itwillberesponsibleforallsocio-economicissuesrelatedtothefisheriessectorinteralias,cost-benefitanalysisofpolicy-decisions,socio-economicsurveysandtechnicalsupportstoFITEC.
• Apilotprojecttoempowerlocalfishercommunitiesinlocalgovernance,leadershipparticipatorymanagementleading shared commitment and responsibility in policy formulation and voluntary compliance; and co-management oflocalfisheriesinfrastructuresuchasFLS.
Many international and regional organisations as well as inter-governmental Co-operations are active in the artisanal fisheriessub-sector.AnewFisheriesMasterPlanisintheprocessofapprovalbytheCabinet.Aconcertedapproachwill be necessary to allocate adequate technical and financial resources for the implementation of the aboverecommendations.

16 SmartFish Programme Report SF/2012/8
RÉSUMÉ EXECUTIF
LaprésenteétudeaétécommandéeparleMinistèredelaPêcheetdeRodrigues(MOFR)deMauriceeteffectuéepar le Programme pour la Mise en oeuvre d’une Stratégie Régionale de la pêche pour la région Afrique Orientale et Australe-OcéanIndien(AOA-OI)sousl’égidedelaCommissiondel’OcéanIndien(COI)aveclefinancementdel’Union européenne (UE). L’objectif principal consistait à entreprendre une étude de la chaîne de valeur du sous-secteur de la pêche artisanale à Maurice dans le but d’évaluer la performance économique de ses fonctions de production et de sescanauxdecommercialisation.Surlabasedesconclusions,desrecommandationssontformuléesafinderenforcerl’efficacitéglobaledelapêcheartisanaletoutentenantcomptedesimplicationssocialesetécologiques.
La pêche artisanale constitue en fait la principale source d’approvisionnement des marchés locaux en poisson frais, avec uneproductionannuellede830tonnesmétriques.En2010,oncomptait1620pêcheursenregistrés,1605bateauxde pêche et 400 mareyeurs actifs dans le sous-secteur. Les stocks de poissons ciblés ont atteint leur rendement maximal durable(RMD).Lescapturesparpêcheurparjoursesontélevéesà6,4kgaucoursdestroisdernièresannées.LeMOFR fournit une pléthore de mesures incitatives pour détourner l’effort de pêche vers l’extérieur du lagon, sur les pêcherieseneauxprofondes,démersalesousurDCP,afindediminuerlapressiondepêchedanslelagon. IlexisteautourdeMaurice60stationsdedébarquementdupoisson(SDP)quiserventdebased’opérationsàlaflottedepêchecôtière.Ellessonthabilitéesàdéchargerlepoisson,recueillirlesdonnéeseteffectuerlapremièreventedupoisson. Au début des années 70, ils étaient conçus de sorte à offrir les installations élémentaires pour le nettoyage, le tri et la commercialisation du poisson. En fait, la plupart d’entre elles ont fait leur temps et sont hors d’usage. Le déclin des communautés de pêche locales (CPL) a eu un impact négatif sur le développement et la gestion des pêches côtièresetl’organisationdesSDP.LeMinistèreentreprendactuellementdeseffortsafinderéhabiliterleréseaudesitesde débarquement autour de l’île en consultation avec les CPL.
Unesourcemajeuredepréoccupationpour lapêcheartisanales’avèreêtre l’absencedenormesdequalitéetdesécurité alimentaire le long de la chaîne d’approvisionnement, de la capture à la consommation. Les mesures de préservation du poisson à bord des bateaux sont rudimentaires ou non existantes. La glace en flocons n’est pasdisponible autourde l’île, enparticulier auxdébarcadères.Lesbateaux traditionnelsne sontpasmunisde cales àpoisson et la glace n’est simplement pas utilisée.
Auxfinsdel’analysedelachaînedevaleur(ACV),lapêcheartisanaleaétéclasséeencinqtypesd’unitésoud’entreprisesdepêche,enutilisantlesenginsdepêcheetlesstratégiesopérationnellescommedéterminantsclés:
• pêche à la ligne (HL) ;• pêche au panier et au casier (BT) ; • pêcheaugrandfilet(LN);• pêche à la ligne non motorisée (NM HL) ; • pêche à la ligne à pied et pêche au harpon (On/FT).
Desdonnéessurlescoûtsetlesrevenusontétérecueilliesgrâceàdesenquêtessecondairesetprimairesauprèsdechacunedesentreprisesdepêchesélectionnéesdansdifférentesrégionsdupaysafindepréparerunétatstandardisédes revenus et des dépenses (IES). L’efficience et la profitabilité de ces unités de pêche ont été déterminées encalculantlecoûtdeproduction(CP)etlamargedeprofit(MP).Laquantitérequisepourlarentabilitédel’unitédepêche a été déterminée en supposant qu’il y ait un salaire minimal de Rs 10 000 comme coût d’opportunité pour la maind’œuvredepêche.Letableausuivantprésenteunrésumédesconclusionsdel’ACV:

17SmartFish Programme Report SF/2012/8
Tableau 1: Rentabilité des entreprises de pêche - Rs/kg
Eléments Unité HL BT HL / BT LN N/M HL On / FT
Prise annuelle par bateau Kg 4139 3780 3960 24635 2041 737
Ventes aux PSPCoûts de production Revenus en excédent (¹)Marge de profit parrapport aux ventesCoût du carburantCoût de la main d’œuvre de pêche
B/E– Qté (TR-TC)
Rs/kgRs/kgRs/kg
%
Rs/kgRs/kg
Kg
190.70155.7734.9318 %
36.5085.25
3 379
120.2180.9039.3133%
40.0039.25
2 546
155.46117.8937.5724 %
38.2562.25
2963
128.30110.9217.3214%
11.5686.84
21 300
126.9268.8156.9845%
-87.09
2070
131.2032.0197.8075.%
-97.80
1095
(¹) Revenus en excédent de l’entreprise de pêche
Le tableau ci-dessus fournit des indicateurs économiques simples qui peuvent être utiles dans la gestion et la surveillance des pêches. En extrapolant le niveau des prises nécessaires pour atteindre le seuil de rentabilité des capacités de pêche existantes (B/E–Qté), l’onconclutqu’ilexisteunsérieuxproblèmedesurcapitalisationdans lesous-secteurde lapêche artisanale.
Tableau 2 : Estimations des capacités de pêche excédentaires au niveau actuel de RMD (rendement maximal durable)
Eléments HL BT BT / HL LN O/F - HL / H TOTAL
Prise annuelle PourcentagePrise moyenne par bateau (kg)
22712%4139
26711%3780
2836%3960
2226%
24635
8735%737
831100%
Nombre de bateaux de pêche optimal (N)Nombre de pêcheurs à pied optimal (N)
54
-
150
-
7
-
27
-
-
118
238
-
Bateaux de pêche actifs Pêcheurs à pied actifs
678 761 139 27 -134
1605
Nombre de bateaux de pêche en surplus (N)Nombre de pêcheurs à pied en surplus (N)
624
-
611
-
132
-
0
-
-
16
1367
18 SmartFish Programme Report SF/2012/8
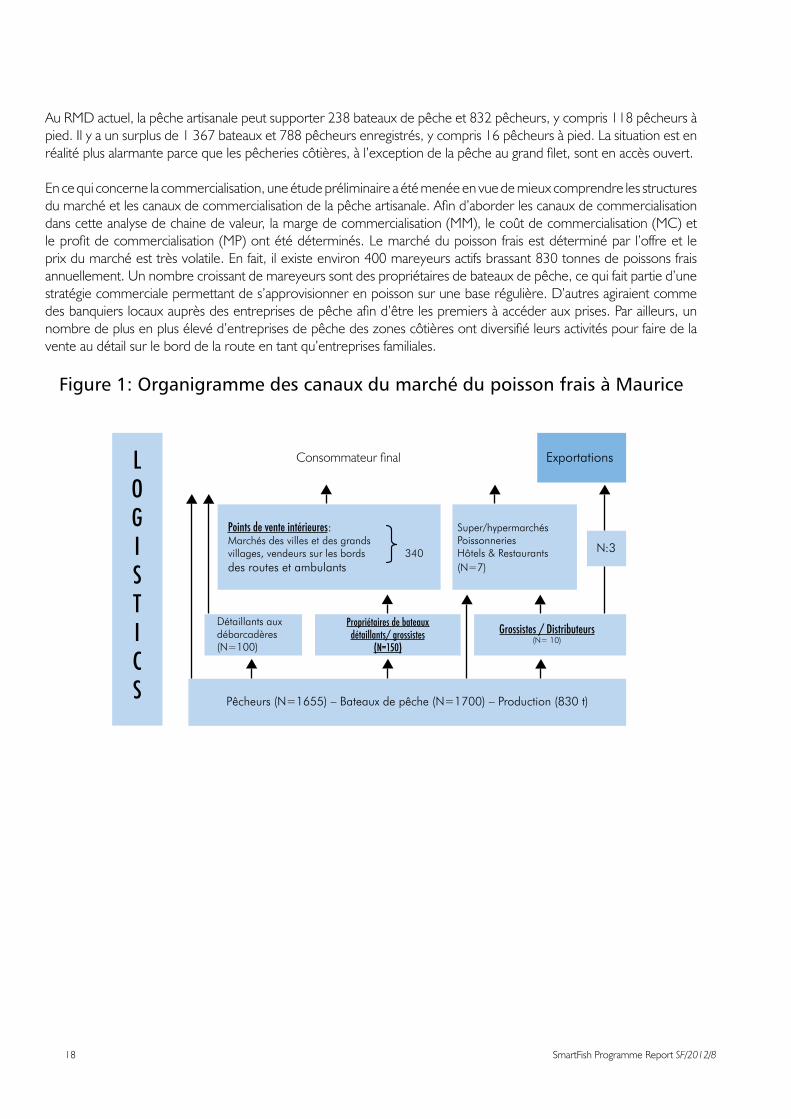
AuRMDactuel,lapêcheartisanalepeutsupporter238bateauxdepêcheet832pêcheurs,ycompris118pêcheursàpied.Ilyaunsurplusde1367bateauxet788pêcheursenregistrés,ycompris16pêcheursàpied.Lasituationestenréalitéplusalarmanteparcequelespêcheriescôtières,àl’exceptiondelapêcheaugrandfilet,sontenaccèsouvert.
En ce qui concerne la commercialisation, une étude préliminaire a été menée en vue de mieux comprendre les structures dumarchéetlescanauxdecommercialisationdelapêcheartisanale.Afind’aborderlescanauxdecommercialisationdans cette analyse de chaine de valeur, la marge de commercialisation (MM), le coût de commercialisation (MC) et leprofitdecommercialisation(MP)ontétédéterminés.Lemarchédupoisson fraisestdéterminépar l’offreet leprixdumarchéesttrèsvolatile.Enfait,ilexisteenviron400mareyeursactifsbrassant830tonnesdepoissonsfraisannuellement. Un nombre croissant de mareyeurs sont des propriétaires de bateaux de pêche, ce qui fait partie d’une stratégiecommercialepermettantdes’approvisionnerenpoissonsurunebaserégulière.D’autresagiraientcommedesbanquierslocauxauprèsdesentreprisesdepêcheafind’êtrelespremiersàaccéderauxprises.Parailleurs,unnombredeplusenplusélevéd’entreprisesdepêchedeszonescôtièresontdiversifiéleursactivitéspourfairedelavente au détail sur le bord de la route en tant qu’entreprises familiales.
Figure 1: Organigramme des canaux du marché du poisson frais à Maurice
Consommateurfinal Exportations
Super/hypermarchésPoissonneriesHôtels & Restaurants(N=7)
Propriétaires de bateauxdétaillants/ grossistes
(N=150)
Grossistes / Distributeurs(N= 10)
Pêcheurs (N=1655) – Bateaux de pêche (N=1700) – Production (830 t)
Détaillants aux débarcadères(N=100)
N:3
Points de vente intérieures:Marchés des villes et des grandsvillages, vendeurs sur les bords 340des routes et ambulants
LOGISTICS

19SmartFish Programme Report SF/2012/8
Les canaux suivants de commercialisation du poisson ont fait l’objet d’une étude :
• Vendeur de poisson sur les bords des routes (approvisionné par une entreprise de pêche à la ligne) ;• Vendeur de poisson sur les bords des routes (approvisionné par une entreprise de pêche au panier/casier) ;• Étal de poisson de supermarché (approvisionné par des entreprises de pêche à la ligne) ;• Marché au poisson institutionnel (approvisionné par un grossiste) ; • Entreprisedepêchenon-motoriséevendantdirectementauxconsommateursfinaux;• Pêcheuràpiedvendantdirectementauxconsommateursfinaux.
Tableau3:Distributiondelavaleurajoutéeentrelessegmentsdelapêcheetde la commercialisation
Eléments (Rs / Kg) CSP COP MC COS T P F P M P
HL / Détaillant sur les bords des routesBT / Détaillant sur les bords des routesHL / Détaillant au supermarchéLN / Détaillant au marché institutionnel O&S Bateau – HL /Ventes directesÀ pied/Ventes directes
243.50161.00341.00163.21243.50151.70
155.7786.52155.7786.52
129.7632.01
20.1022.7583.7712.7920.1010.00
175.87109.27239.5499.31
149.8642.01
67.6351.73
101.4663.9093.64
109.69
34.9339.3134.9341.6860.9399.06
32.7012.4266.5322.2232.7110.63
Moyenne (Rs / kg) 217.32 107.73 28.25 135.98 81.34 51.81 29.54
Moyenne (%) - 50% 13% 63% 37% 24% 13%
CSP: Prix de vente au consommateur ; COP : Coût de production; MC: Coût de commercialisation ; TP: Profit total ; COS : Coût des ventes ; FP : Profit des pêches ; MP : Profit de commercialisation
L’on conclut que la distribution de la valeur ajoutée entre la pêche et la commercialisation est équitable et réaliste. Lespartiesprenantesdelachaînedevaleursontdynamiques,efficacesets’adaptentauxincertitudesetauxrisquesélevésafférentsàlapêcheartisanale.Ladistributiondelamargedeprofitentrelaproductionetlacommercialisationest réaliste.

20 SmartFish Programme Report SF/2012/8
Figure 2 : Valeur ajoutée moyenne/kg
Les coûts de commercialisation sont négligeables pour le court réseau de distribution et le faible investissement en capitaldanslalogistique.Ilreprésente13%duCSP.Toutefois,lescoûtsdecommercialisationpourlesétalsdepoissondédiésdanslessupermarchéssontplusélevés(25%duCSP)et,manifestement,unemargedeprofitsupérieure(20%) en découle.
La mise en œuvre de normes de sécurité alimentaire et de qualité doit être perçue comme des opportunités de marché plutôt que comme des contraintes coûteuses. Les canaux de commercialisation ne devraient nullement s’opposer au respect des normes de sécurité alimentaire et de qualité. En fait, le développement de micro et petites entreprises de transformationetd’ajoutdevaleurestaupointmort,particulièrementenraisond’unepénuried’approvisionnementen poisson frais et de l’absence de normes de sécurité alimentaire et de qualité. Cependant, les perspectives de marché sont satisfaisantes. Il est possible de promouvoir l’héritage culturel de la pêche artisanale comme une attraction pour l’industrie du tourisme. Il est proposé de créer un nouveau concept de terminal de poisson pour engendrer des revenusadditionnelsenfaveurdelacommunautédespêcheursauprèsdunombrecroissantdevisiteursétrangersdans le pays.
Lesconclusionsetlesrecommandationsdel’étudesontlessuivantes:
• Ilexisteunrisquepotentieldesurpêchedanslapêcheartisanaleparcequelescapacitésactivesdepêche dépassenttrèslargementleniveaudurable.Ilestextrêmementurgentdemeneruneévaluationdesrisques en ce qui concerne les stocks de poisson ciblés à l’intérieur et hors du lagon.• L’écosystèmecôtiersubitdeplusenplusdepressiond’unnombregrandissantdepêcheursprofessionnels, amateursetsportifs(nonenregistrés).Afindesedébarrasserdecetenvironnementd’accèsouvert,ilest recommandé de mener une étude sur les activités de la pêche amateur et sportive, qui aboutira à la mise en œuvre d’un cadre réglementaire approprié pour gérer et surveiller ces pêcheries comme c’est le cas dans la pêche artisanale.• Leprésentmodèlestatistiqueenmatièredepêche,notammentl’échantillonnageetlacollectededonnées, estdevenuobsolèteetilestgrandtempsdeleremplacer.Lenouveausystèmedoitêtreenmesure d’intégrer les activités de la pêche amateur et sportive.
21SmartFish Programme Report SF/2012/8
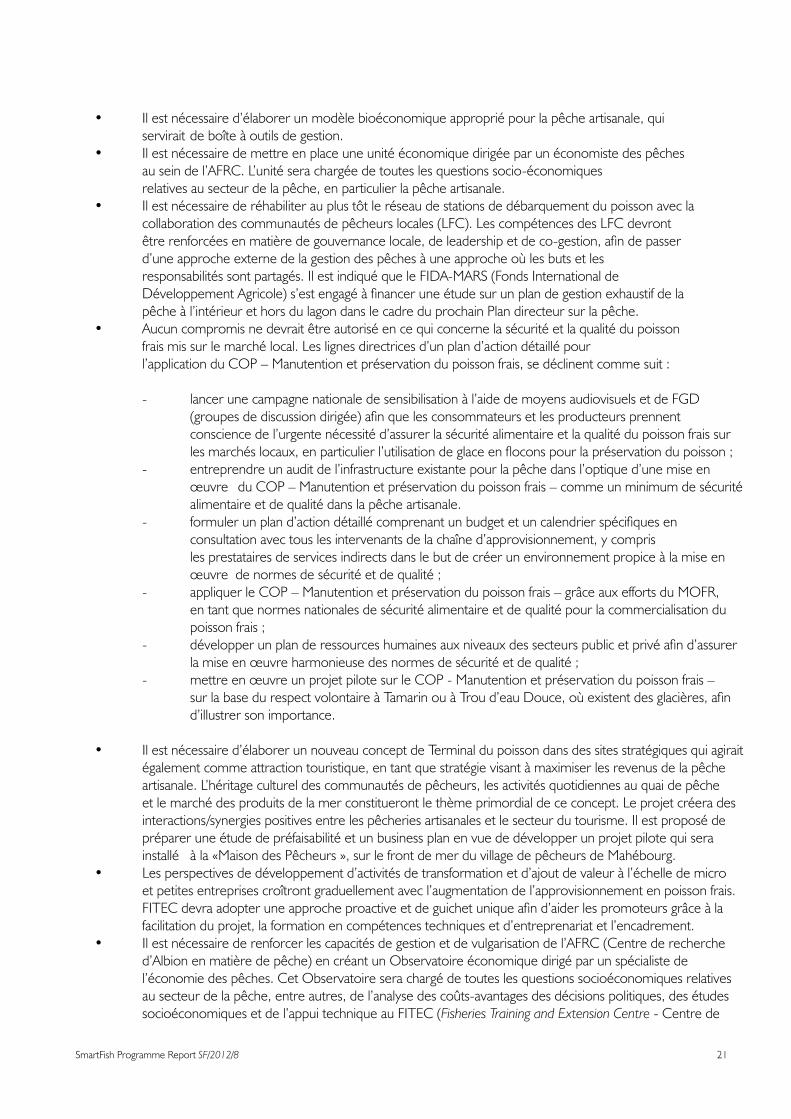
• Ilestnécessaired’élaborerunmodèlebioéconomiqueappropriépourlapêcheartisanale,qui servirait de boîte à outils de gestion.• Ilestnécessairedemettreenplaceuneunitééconomiquedirigéeparunéconomistedespêches au sein de l’AFRC. L’unité sera chargée de toutes les questions socio-économiques relatives au secteur de la pêche, en particulier la pêche artisanale.• Ilestnécessairederéhabiliterauplustôtleréseaudestationsdedébarquementdupoissonavecla collaboration des communautés de pêcheurs locales (LFC). Les compétences des LFC devront êtrerenforcéesenmatièredegouvernancelocale,deleadershipetdeco-gestion,afindepasser d’une approche externe de la gestion des pêches à une approche où les buts et les responsabilités sont partagés. Il est indiqué que le FIDA-MARS (Fonds International de DéveloppementAgricole)s’estengagéàfinanceruneétudesurunplandegestionexhaustifdela pêche à l’intérieur et hors du lagon dans le cadre du prochain Plan directeur sur la pêche.• Aucuncompromisnedevraitêtreautoriséencequiconcernelasécuritéetlaqualitédupoisson frais mis sur le marché local. Les lignes directrices d’un plan d’action détaillé pour l’applicationduCOP–Manutentionetpréservationdupoissonfrais,sedéclinentcommesuit:
- lancer une campagne nationale de sensibilisation à l’aide de moyens audiovisuels et de FGD (groupesdediscussiondirigée)afinquelesconsommateursetlesproducteursprennent conscience de l’urgente nécessité d’assurer la sécurité alimentaire et la qualité du poisson frais sur lesmarchéslocaux,enparticulierl’utilisationdeglaceenfloconspourlapréservationdupoisson; - entreprendre un audit de l’infrastructure existante pour la pêche dans l’optique d’une mise en œuvre du COP – Manutention et préservation du poisson frais – comme un minimum de sécurité alimentaire et de qualité dans la pêche artisanale. - formulerunpland’actiondétaillécomprenantunbudgetetuncalendrierspécifiquesen consultation avec tous les intervenants de la chaîne d’approvisionnement, y compris les prestataires de services indirects dans le but de créer un environnement propice à la mise en œuvre de normes de sécurité et de qualité ; - appliquer le COP – Manutention et préservation du poisson frais – grâce aux efforts du MOFR, en tant que normes nationales de sécurité alimentaire et de qualité pour la commercialisation du poisson frais ; - développerunplanderessourceshumainesauxniveauxdessecteurspublicetprivéafind’assurer la mise en œuvre harmonieuse des normes de sécurité et de qualité ; - mettre en œuvre un projet pilote sur le COP - Manutention et préservation du poisson frais – surlabasedurespectvolontaireàTamarinouàTroud’eauDouce,oùexistentdesglacières,afin d’illustrer son importance.
• Ilestnécessaired’élaborerunnouveauconceptdeTerminaldupoissondansdessitesstratégiquesquiagirait également comme attraction touristique, en tant que stratégie visant à maximiser les revenus de la pêche artisanale. L’héritage culturel des communautés de pêcheurs, les activités quotidiennes au quai de pêche etlemarchédesproduitsdelamerconstituerontlethèmeprimordialdececoncept.Leprojetcréerades interactions/synergies positives entre les pêcheries artisanales et le secteur du tourisme. Il est proposé de préparer une étude de préfaisabilité et un business plan en vue de développer un projet pilote qui sera installé à la «Maison des Pêcheurs », sur le front de mer du village de pêcheurs de Mahébourg.• Lesperspectivesdedéveloppementd’activitésdetransformationetd’ajoutdevaleuràl’échelledemicro et petites entreprises croîtront graduellement avec l’augmentation de l’approvisionnement en poisson frais. FITECdevraadopteruneapprocheproactiveetdeguichetuniqueafind’aiderlespromoteursgrâceàla facilitation du projet, la formation en compétences techniques et d’entreprenariat et l’encadrement.• Ilestnécessairederenforcerlescapacitésdegestionetdevulgarisationdel’AFRC(Centrederecherche d’Albionenmatièredepêche)encréantunObservatoireéconomiquedirigéparunspécialistede l’économie des pêches. Cet Observatoire sera chargé de toutes les questions socioéconomiques relatives au secteur de la pêche, entre autres, de l’analyse des coûts-avantages des décisions politiques, des études socioéconomiques et de l’appui technique au FITEC (Fisheries Training and Extension Centre - Centre de

22 SmartFish Programme Report SF/2012/8
formationetdevulgarisationenmatièredepêche).• Ilestnécessairedemettreenplaceunprojetpiloteenvuederenforcerlescapacitésdescommunautés de pêcheurs locales en gouvernance locale, en leadership et gestion participative, de sorte qu’elles se partagent l’engagement et la responsabilité dans la formulation des décisions et le respect volontaire des normes ; et en co-gestion des infrastructures de pêche locales telle que les stations de débarquement.
De nombreuses organisations internationales et régionales ainsi que des initiatives de coopération intergouvernementales sont actives dans le sous-secteur de la pêche artisanale. Un nouveau Plan directeur sur la pêche est en voie d’approbation par le Conseil des ministres. Il est nécessaire d’adopter une approche concertée en vue d’allouer des ressources techniquesetfinancièressuffisantespourmettreenœuvrelesrecommandationssusmentionnées.

Introduction
23SmartFish Programme Report SF/2012/8
1.0 Introduction
TheGovernmentofMauritiusaccordshighprioritytothesustainabledevelopmentoftheartisanalfisheriessub-sectorbecause of its crucial role in providing employment opportunities and protein diets to some 4,000 households in themarginalcoastalregionsofthecountryandthuscontributingsignificantlytopovertyalleviation,foodsecurityandgender emancipation. Artisanalfisheriesarethemainsuppliersof freshfishtothedomesticmarkets inMauritius.Asmallquantityofhighgradereeffish,mainlychilledsnappers isalsoexportedtoRéunionIsland.Currentlythetotalcatch isestimatedat830tonnes,whichisclosetotheMSYofthetargetedfishstocks.Asof2010therewere2,303registeredfishersapartfromanincreasinglylargenumberofnon-registeredactiveamateursandsportfishersoperatinginthelagoonandoff-lagoon.Therewere2,525registeredfishingboatsbutaccordingtoarecentsurveyoftheAFRC,only70%oftheseregisteredfishersandfishingboatsareactive.Themarketingfunctionsareperformedbysome400licensedfishmongersatwholesaleandretaillevels.
This study is conducted under the “Implementation of Fisheries Regional Strategies for the ESA-OI” under the aegis of the IOC and funded by the EU. The overall objective of the Programme is to enhance socio-economic and environmentaldevelopmentanddeeperregionalintegrationintheESA-OIthroughsustainableexploitationoffisheriesresources.ThisassignmentfallsspecificallyundertheModuleofResult4relatedtotheimplementationofstrategicimprovementtoproductionandsupplyoffish.TheaimofthisVCA12is to gain a deeper understanding of the value chain with particular emphasis on the production functions, market structures and marketing channels of the artisanal fisheriessub-sector,soastoassessitseconomicefficiencies.Thestudywillalsoexaminetheunderlyingprospectsandweaknessestocomeupwithanactionplantoenhancesustainabledevelopmentoftheartisanalfisheriesinahighlydynamic and competitive global environment.
1.1 Work Plan and Implementation
• Toexaminethemarketstructuresandmarketingsystemsoffishproductionoftheartisanalfisheriessub-sector;
• Todeterminethemarketingcostandmarketingmarginofthefishmongersinthedistributionandmarketstructures;
• Tocollectcriticaldataonproductioncosts(fishingoperations),marketingcost(logisticcost)andproductpricesindifferent market channels (PSP, WSP and CSP);
• Toexaminethevaluechainoffreshfishandfishproductsaimingtodeterminethevalueadditiontomarketedfishat different levels of market channels;
• To investigate the key factors for improvement of preservation, quality, value addition, processing and marketing of fishproductionoftheartisanalfisheries.
1 The terms of reference of the study is given in Appendix 1

24 SmartFish Programme Report SF/2012/8
1.2 Methodology
ThisisthefirstVCA23intheartisanalfisheriesofMauritius.Itwasnotpossibletoconductaclassicalstratifiedsurveyofthe sub-sector. A preliminary survey was carried out to determine cost and revenue data which were readily available and those that had to be collected or derived to perform the study. A systemic approach was adopted to gather quantitative and qualitative data through primary and secondary surveys without compromising the consistency of the study. RRA and FGD were primarily conducted to have a deeper understanding of structural and functional features of thesupplychainthatincluded:
• Fishers’statuswithregardtoownershipoffishingassets;• Types of gears used; • Commercial grades and market prices of fresh; • Fishmonger status and marketing channels;• Verticalintegrationanddiversificationinsupplychain;• Technologicalandenvironmentalfactors–fishinggears,fishingareas…• Hardandsoftfisheriesinfrastructure:FLS,MdP,Institutionalfishmarkets...• Fisheries regulations; management and monitoring measures;• Seasonal/ regional/variation of catch and market prices;• Location of main production and market centres;• Safetyandqualityoffreshfishonlocalmarkets.• Processing and Value addition activities.
1.2.1 Primary and Secondary Sources
Data were collected both from primary and secondary sources. Fisheries Statistics, PSP and CSP time series of the MOFRwereactualizedthroughfieldworks.DiscussionswereheldwithFIT,FITECandMFFC.FocusgroupdiscussionswereorganisedwithfishersandfishmongersatlandingcentresintheNorth,EastandWest.Literatureresearchwasfocusedonthesestudyreports:
• Annual Fisheries Statistics and Fish Price data from 2009 and 2010 (unpublished) of the MOFR;• Study on Fish Handling, Preservation and Marketing in Mauritius & Rodrigues– Final Report, Volume 1 and 2,
Appavoo & Associates, 2007;• FishHandling,processingandMarketinginMauritius,FAO,2005;• Enquête socio-économique sur la pêche artisanale à Maurice, sous l’égide du Projet Thonier régional Phase II de laCOI/EU,S.Sweenarain,1995.
Following the preliminary surveys, two questionnaires3 werepreparedtocollect inputsandcostdata fromfishingunits4 and marketing enterprises. One–to–one interviews were also arranged with selected stakeholders to cross-check data / information so as to ascertain their accuracy. PSP and CSP data of the FD are limited to the FLS. Complementarypricedataweregatheredfrominstitutionalfishmarketsinmaintownsandvillages;fishpeddlersandhawkers;dedicatedfishshopsandfishstallsinsuper/hypermarkets.
2 The theory of Value Chain Analysis was developed by Micheal Porter in 1980. It is applied to determine the efficiencies of each and every component of a business enterprise so as to improve its over comparative advantages and competitiveness on the markets.
3 Given in Appendices 2 and 3 4 A fishing Unit or enterprise is considered as an economic unit and is defined in terms of ownership of fishing assets and control of fishing operations and marketing of harvested fish. This concept leads to a better understanding of the economic role of fishing labour / crew in the artisanal fisheries.

Methodology
25SmartFish Programme Report SF/2012/8
1.3 Analysis
The analytical works aim at determining the economic efficiencies and income generating capacity/profitability ofenterprisesinvolvedinthesupplychainoftheartisanalfisheries.Astandardizedbusinessmodel5 was used to prepare IncomeandExpenditureStatements for thevarious typesof fishingactivities. Economicefficiency ismeasured intermsofprofitability,costofproduction(COP),break-even(B/E)revenueandotherrelevantfinancialratios.TheB/ERevenue was assumed on the basis of a minimum monthly salary of Rs 10,000 as an opportunity cost of labour. A specificcasestudywaspreparedforeachoneofthetypicalfishingenterprises:
• HandLinefishery• Basket Trap Fishery • Large Net Fishery• Non-motorizedhandline(lagoon)fishery• On-footLine&Harpoon(lagoon)fishery
In the VCA of the marketing channels, two important variables were measured namely marketing cost and marketing margin. While marketing margin represents the difference between consumer and producer price, marketing cost consistsofmaterial andnon-material costs involved inperformingmarketing functionsby the fishmongers.Thesefunctionsincludetransportation,grading,storage,processing,financingandotherdirectservices.Themainplayersinthe marketing channels are wholesalers/distributors and different types of retailers.
Verticalintegrationorlinkagebetweenproductionandmarketstructuresanddiversificationarecommonintheartisanalfisherieswhereby:
• Anincreasingnumberoffishingunitsareinvolvedinretailmarketingeitherbydirectsaleorthroughahouseholdroadsidefishstall.Fishersdonotrequireafishmongerlicensetoselltheircatchtoendconsumers.
• About25%oflicensedfishmongersareownersofupto3fishingboats(Appavoo&Associates,2007).Itispartoftheirbusinessstrategytosecureregularandadequatesupplyoffish.Theynormallymanagethefishingoperationsbycontractingfishingcrew/labour.
5 The fishing Business Model used for the Value Chain Assessment is given in Appendix 4
26 SmartFish Programme Report SF/2012/8
2.0 Overview of the Artisanal Fisheries Sub-sector 2.1 Fisheries Policies
With an EEZ of 1.9 million km², the Government of Mauritius envisions the land based oceanic industries as a strategy for extracting more value from the ocean to spearhead sustainable economic growth. Development of the seafood hub6,1themarine fisheries and aquaculture forms part of the aforesaid strategy. Actually the fisheries sector has acontribution of about 1% of the GDP and provides some 20,000 direct and indirect jobs.
Government through its “People First” philosophy is laying special emphasis on the development of the artisanal fisheriessub-sectorandonthewelfareofcoastalfishercommunitiesthroughvarious institutionsandprogrammes.It isrecognizedthatthesocialwelfareprogrammeinfavourofprofessionalfishersinMauritius isuniqueandhighlygenerous. However, this approach may be appropriate for socio-economic and ecological sustainability of the coastal fisheries.
The Fisheries and Marine Resources Act 2007 provides a policy framework of the Government with regards to the developmentoftheartisanalfisheriessub-sectorthatfocusesonaccesstoinvestmentcapitalthroughtheEmpowermentFund,SMEDA,SMEPartnershipFundandextensionservicestoempowertraditionalfisherstoparticipateactivelyinthedevelopmentofFADanddeep-seademersalfisheries.AnambitiousFisheriesMasterPlan is in theprocessofapproval by the Cabinet.
FITECwassetup toprovide tailor-cut trainingcourses infishing technologyandfishhandlingandpreservation toenhanceoverallcapabilitiesofregisteredfishersandlicensedfishmongers.TheextensionservicesdispensedbyFITEChave to be further oriented towards effective BDS including facilitation and mentoring of new entrants in the extended artisanal fisheries. Itwillhaveakey role toplay inpromotingmicroand small scaleprocessingandvalueadditionactivitiesintheartisanalfisheries.
FITwassetupin2006toactasaninvestmentarmoftheGovernmentinfisheriessectorandmandatedbyitsparentMinistrytoinvestinfishing,processing,logisticsandmarketingactivities.RegisteredfishersareshareholdersoftheFITand are represented on the Board of Directors. It will have to take the lead in promoting investment in promoting viablecommercialprojectssuchasintegratedfishterminals,iceplantsandlogisticsservicesintheartisanalfisheries.Governmenthaspromoted“SyndicatdesPêcheurs”toencouragelocalfishercommunities(LFC)toparticipateinpolicyformulationandinjointmanagementofthefisheriesecosystemsandinfrastructure.Thisorganisationhastobeequippedwith local governance, leadership and participatory management skills through capacity building programmes. Emphasis hastobelaidonthesocialimplicationsofvoluntarycompliancetofisheriesregulations,sustainablemanagementandconservation of marine resources.
2.2 Supporting Institutions
The Fisheries Division (FD) is under the organisational structure of the MOFR and is responsible for the overall managementanddevelopmentofmarineresourcesintheEEZofMauritiusincludingfisheries,aquacultureandtheseafood hub. It is organized into various services to cater for Research & Development, Management and Protection
6 Seafood hub is defined as an efficient and attractive environment for the supply of value added processes and services related to the sourcing and market of sea food products.

Overview of the Artisanal Fisheries Sub-sector
27SmartFish Programme Report SF/2012/8
of marine resources and so on. AFRC and FITEC are also under the aegis of FD. An audit is underway at AFRC to align its organisational and functional structures to the challenges and opportunities ahead of the Mauritian seafood sector. MFFCregroupsover600registeredfishersincluding16LNfishercooperativesocietiesinMauritius.Itwasestablishedinthe1970stoemancipateandempowerthefishercommunities.ActuallytheMFFCisvettedbytheMOFRandMOC for theoperationalizationof3 integratedfish landing centres commonly knownas “MaisonsdesPêcheurs”(MdP) at Cap Malheureux, Tamarin and Mahebourg. The MdP at Cap Malheureux is inactive while the other ones at TamarinandMahebourgareunderutilized.MFFCisanimportantplayerinthedistributionandmarketingoffreshfish.Theyhaveanice-plantof500kgperdaycapacityatTamarin,whichcanbeincludedinapilotprojectforpreservationoffreshfishintheregion. TheseMdParelocatedatstrategicpointsofthecoastalfisheriesandmajortouristhubsontheisland.Itisproposedto prepare a pre-feasibility for the conversion of the MdP at Fishermen Village of Mahebourg Waterfront into an integrated Fish Terminal cum dedicated commercial complex as a pilot project to create positive synergies with the tourism industry.
TheCompetentAuthority(CA)istheapexorganisationwithregardtohealthandsanitarystandardsforfishandfishproducts. It is responsible for compliance with HACCP and EU health and sanitary standard in the seafood export industry. It also provides a one-stop-shop for export formalities to the seafood hub in Port Louis. Actually there is no foodsafetyandqualitystandardapplicabletotheartisanalfisheries.Theseworldclassstandardsmightbeanidealfortheartisanalfisheriesinthelong-run.However,thejourneymuststartwiththecreationofanadequateenvironmentfortheenforcementoftheCOPforhandlingandpreservationoffreshfishandCPCFestablishedbyFITEC.
2.3 On-going Programmes in the Artisanal Fisheries
Thereareseveralon-goingnational,regionalandinternationaltechnicalassistanceprogrammesintheartisanalfisheriesandcoastalmarineecosystems.Theseprogrammesincludeamongstothers:• The electronic fish auction market (EFAM) project at Fort William was sponsored financially by the Greek
Government and implemented by the MOFR. The project is nearing completion this year and its operationalization will be entrusted to the Private Sector. The assistance of SmartFish is sought to provide STE for the preparation of a feasibility study in view of preparing an international bidding exercise to allocate a service provider contract. The project is due to become operational next year.
• IFAD-MARSinitiativetoconductaValueChainAnalysisintheFADfisheries.Itisindicatedthatthebiddingprocessisunderway. This institution is also committed to provide technical assistance in the preparation of a comprehensive managementplanforthelagoonandoff-lagoonfisherieswithintheframeworkofthenewFisheriesMasterPlan.
• MauritiusisanactiveparticipantofSWIOFPandACP-FISHII,whicharedeliveringtechnicalandscientificassistancesinfishstockassessmentandmanagementintheartisanalfisheries.Thereisanurgentneedtoundertakeariskassessmentstudyonfishstockcommonlyexploitedby theartisanalfisheries.The technicalassistancemaybeextended to create a bio-economic model to serve as an effective tool for management and monitoring.
FDalsobenefits from the technical assistance frombilateral cooperationwith Japan,Norway andAustralia in thefisheriessector.
2.4 Coastal Fisheries Infrastructure
Thereare60FLSaroundMauritius that serveasoperationalbases tocoastal fishingactivities.Statutorily theyaremandatedforunloadingfishandforfisheriesdatacollection.Theyconsistofsmallconcretestructureswithbasicutilitiessuchaswater,electricity(atsomeplaces)thatservefordischarging,cleaning,gradingandprimarysaleoffish.Theyaremanaged by FD and maintained by the Local Authorities. These FLS have outlived their purposes and most of them

28 SmartFish Programme Report SF/2012/8
havebecomeobsoleteforthefollowingreasons:• They are not accessible during low tides (dredging works required);• They are far from the Fisheries Post and traditional landing sites;• They are in an unhygienic condition;• There is no attached washroom and toilet;• Absenceofactiveparticipationofthelocalfishercommunities.
TheMOFRhasstartedmodernizingsomeoftheseFLS.Thenewonese.g.theoneatAlbion,ismorefisher-friendly.Itprovidesforlockerstostackfishinggearsandoutboardengines.Localfishercommunitiesandfishmongersarethemain users of the FLS and therefore they have to be consulted on any rehabilitation works / development of new facilities.TheyshouldbeempoweredtoparticipateinthemanagementofthefisheriesinfrastructuretogetherwiththeFD and the local authorities.
2.5 Fish Resources in the Lagoon and Off-lagoon
Todateabout60%offishharvestedbytheartisanalfisheriesisstillfromthelagoon.Fishstocksinthelagoonandoff-lagoon are exploited to their MSY levels (Boyer & Soondron, 2009). A series of restrictions such as; a close season of sixmonthsforthenetfisheries,abanonimportsofsmallhooksandacrackdownonillegalfishing,areimplementedbytheFDtohelpthefishstockstorecover.Animpactassessmentoffishgearsusedbytheartisanalfisheriesonthemarineecosystemandnon-targetedfishspecieshastobecarriedoutsoastoimprovemanagementandconservationpolicies.
AplethoraofincentiveshavebeenintroducedbytheMOFRtodivertfishingeffortsfromthecoastalfishingzonestodeep-seaFADanddemersalfisheries.However,themobilityoftraditionalfishersisusuallyveryslowduetheiraversiontonewtechnologiesandreluctancetochange.Consumers’preferencefortraditionalreefanddemersalfishisalsoresponsibletosomeextentfortheslowdevelopmentoftheFADfisheryinMauritius.Itwasassumedthatconsumerswould readily accept tuna and tuna-like species. It is necessary to embark on a nation-wide awareness campaign tosensitizeconsumersandthepopulationat largeontheneedtomodifytheirfishconsumptionhabit infavouroflargepelagicfish.BysodoingtheywillcontributesignificantlytotheconservationoffishstocksinthelagoonandinpromotingprivateinvestmentsintheFADfishery.Thereisunlimitedscopeforprocessingandvalueaddedactivitiesof raw tuna for the local and export markets. Similar development models can be adapted from the experience of countries like Hawaii, Bangladesh, Uganda and so.
Theactualcoastalfisheriesmanagementandconservationmeasurescannotyieldtheexpectedresultsbecauseoftheprevailing open-access environment,whichistantamounttothehighriskofoverexploitationofthefishstocks.Thenumberofnon-registeredactive,amateurandsportfishersactiveincoastalfisheriessignificantlyexceedsthenumberof registered fishers7.2To attain socio-economic and ecological sustainability in the artisanal fisheries, developmentstrategiesmustfocusonselectionoffishinggears8,quality,valueadditionandefficientmarketing,asultimatemeanstomaximiseeconomicrentofthefishresourcesandrevenueofthestakeholders.
7 According to a Survey conducted by the Ministry of Fisheries and Cooperatives in 2003, there were over 25500 of amateur fishers operating regularly in the coastal fisheries. It is likely that this figure has increased significantly.
8 Selectivity of fishing gears promotes eco-friendly technologies so as to reduce negative impacts of fishing activities on the marine ecosystem. They are instrumental to avoid untargeted fish species and undersized fish with low commercial value.
Overview of the Artisanal Fisheries Sub-sector
29SmartFish Programme Report SF/2012/8
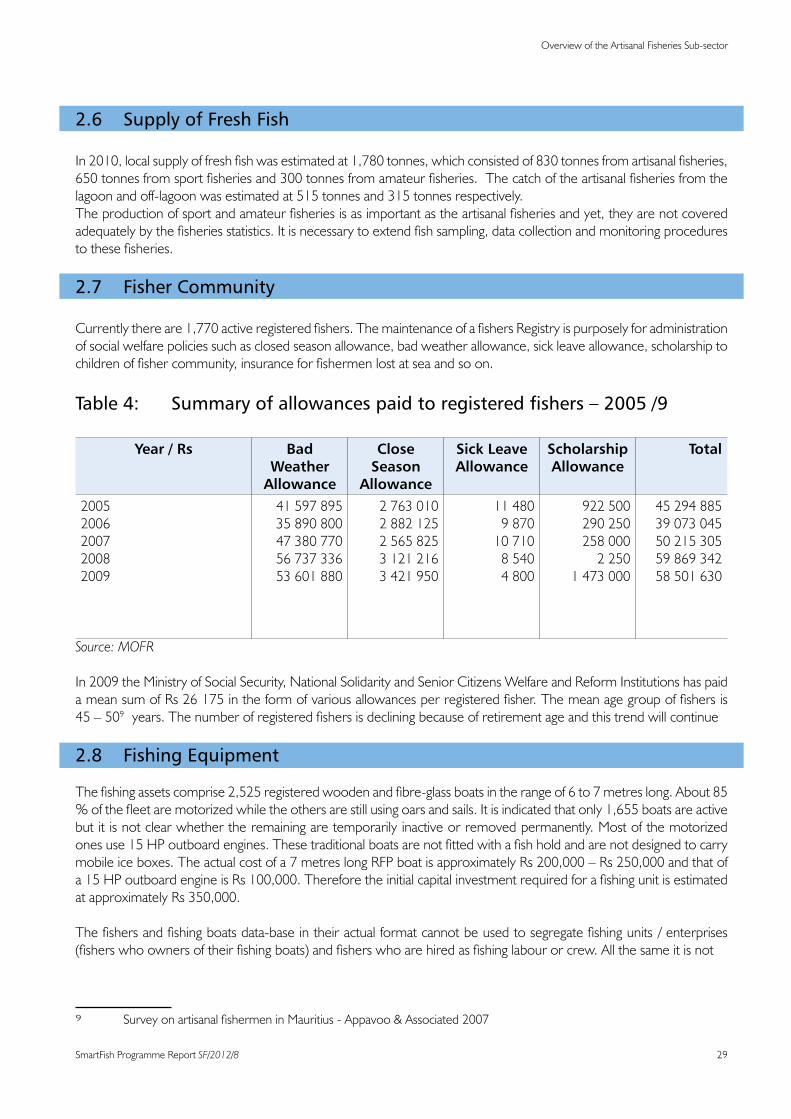
2.6 Supply of Fresh Fish
In2010,localsupplyoffreshfishwasestimatedat1,780tonnes,whichconsistedof830tonnesfromartisanalfisheries,650tonnesfromsportfisheriesand300tonnesfromamateurfisheries.Thecatchoftheartisanalfisheriesfromthelagoonandoff-lagoonwasestimatedat515tonnesand315tonnesrespectively.Theproductionofsportandamateurfisheriesisasimportantastheartisanalfisheriesandyet,theyarenotcoveredadequatelybythefisheriesstatistics.Itisnecessarytoextendfishsampling,datacollectionandmonitoringprocedurestothesefisheries.
2.7 Fisher Community
Currentlythereare1,770activeregisteredfishers.ThemaintenanceofafishersRegistryispurposelyforadministrationof social welfare policies such as closed season allowance, bad weather allowance, sick leave allowance, scholarship to childrenoffishercommunity,insuranceforfishermenlostatseaandsoon.
Table4: Summaryofallowancespaidtoregisteredfishers–2005/9
Year / Rs Bad Weather
Allowance
Close Season
Allowance
Sick Leave Allowance
Scholarship Allowance
Total
20052006200720082009
4159789535890800473807705673733653601880
27630102882125256582531212163421950
11 4809 870
10 71085404 800
9225002902502580002250
1473000
4529488539073045502153055986934258501630
Source: MOFR
In 2009 the Ministry of Social Security, National Solidarity and Senior Citizens Welfare and Reform Institutions has paid ameansumofRs26175intheformofvariousallowancesperregisteredfisher.Themeanagegroupoffishersis45–5093years.Thenumberofregisteredfishersisdecliningbecauseofretirementageandthistrendwillcontinue
2.8 Fishing Equipment
Thefishingassetscomprise2,525registeredwoodenandfibre-glassboatsintherangeof6to7metreslong.About85%ofthefleetaremotorizedwhiletheothersarestillusingoarsandsails.Itisindicatedthatonly1,655boatsareactivebut it is not clear whether the remaining are temporarily inactive or removed permanently. Most of the motorized onesuse15HPoutboardengines.Thesetraditionalboatsarenotfittedwithafishholdandarenotdesignedtocarrymobileiceboxes.Theactualcostofa7metreslongRFPboatisapproximatelyRs200,000–Rs250,000andthatofa15HPoutboardengineisRs100,000.ThereforetheinitialcapitalinvestmentrequiredforafishingunitisestimatedatapproximatelyRs350,000.
Thefishersandfishingboatsdata-baseintheiractualformatcannotbeusedtosegregatefishingunits/enterprises(fisherswhoownersoftheirfishingboats)andfisherswhoarehiredasfishinglabourorcrew.Allthesameitisnot
9 SurveyonartisanalfishermeninMauritius-Appavoo&Associated2007

30 SmartFish Programme Report SF/2012/8
possibletoidentifyfishmongerswhoarealsoownersoffishingboats.TheaboveinformationarekeptandmaintainedinhardcopyatregionalFisheriesPosts.Itisnecessarytocreateaninteractivedata-basetodealwithfishers,boatsandfishmongerinputsatthenationallevelformanagementandmonitoringpurposes.
2.9 Fishing Gears
Themaintypesofgearusedintheartisanalfisheriesaredescribedbrieflybelow:
Hand linefishing isfishingwithasinglefishing lineheld in thehandswithoneormorebaitedhooksor lures thatcontributesto20%ofthetotalcatch.Itisaselectivegearandtargetshighvaluebottomfishesinthelagoonandoff-lagoon.ThetargetedfishspeciesareVieilleRouge(RedSnapper)andCapitaine(Emperor).
Basket Trapsaremadeofgalvanizedsteelsmeshandarepassiveandclose-endgearused to trapreeffishes. It isthemostcommonfishinggearoftheartisanalfisheriesandissometimesusedalternatelywithhandlining.Themainharvested species is Licorne (82%).
Large Net Fishery consistsofusinganetof500mlongtoencirclereeffishinthelagoon.OneNetfishingoperationcomprisesaminimumof3fishingboatsand15fishers(about5fishersperboat).Thenetfisheryharvests22%ofthetotalcatch,whichcomprisesCordonnier(30%),Licorne(37%)andCapitaine(22%).Thenetfisheryisregulatedintermsofprescribedsizeofmeshandlengthofnet,renewalofwornoutnetsandacloseseasonof5monthsfromOctobertoFebruaryannually.DuringcloseseasonregisterednetfishersareentitledtoanallowanceofRs210perdayinspiteofthefactoftheexistenceofabuybackschemetoencouragenetfisherstogiveupthisfishery.
Since 1996 the Government has introduced a buy-back scheme for nets for the reduction of nets operating in the lagoon.Presentlythereare15largenetsinactivity.
On-foot, Line and Harpoon Fishery is practiced on foot during low tides and in shallow waters in the lagoon. It targets mainlyoctopusandsmallreeffish.31%offishersinthisfisherycontributetoonly15%oftheproduction.MOFRhasintroducedabanonimportsofsmallhookstoavoidthefishingofjuvenilefishinthelagoon.
Table5: Totalcatchbyfishers,byfishinggearsandfishingboats(2010)
Items HL BT BT/HL LN O/F-HL/H TOTAL
Registered Fishers (N)PercentageActive Fishers
F/Boats (N)PercentageActive fishing boats
Catch (t)Percentage
28312%212
112444%728
22727%
27911%195
114946%761
26732%
86236%638
2259%149
283%
1466%106
271%17
22228%
73335%620
---
8710%
2303100%1770
2525100%1655
831100%
Source: Annual Report 2010 - MOFR

Overview of the Artisanal Fisheries Sub-sector
31SmartFish Programme Report SF/2012/8
Withtheexceptionofthenetfishery,whichispseudoregulated,thereisnorestrictionwhatsoeverontheuseofHLor BT. HL is a more selective and more environmentally friendly gear as compared to BT and LN. During the close season,netfishersmayoptforHLand/orBTfishing.
2.10 Preservation of Fish on Board
Thereisaseriousconcernaboutsafetyandqualityoffishlandedbytheartisanalfisheries.Postcapturehandlingandpreservationproceduresarenon-existent.Consumerssuspectthefreshnessandqualityoffishpreservedonice.Themainreasonsadvancedbythefishersfornotusingiceare:
• Catch is kept only for a few hours on board and is sold immediately at FLS;
• Fishing boats are not equipped with an ice box or ice;
• IceincubesorflakesisnotavailableattheFLS;
• Consumershaveanaversionforfishpreservedinice;
• Additional operating cost.
Safetyandqualityoffreshfishismandatorytoavoidhealthhazardsandpoorqualityofrawfishonthelocalmarkets.An intensive awareness campaign through audio-visual means to sensitize producers, consumers and logistics services providersaboutfoodsafetyandqualityoffreshfishisrequired.AllstakeholderswillhavetoworktogethertoimplementtheCOP–HandlingandPreservationoffreshfishalongthesupplychain.

32 SmartFish Programme Report SF/2012/8
3.0 VCA of Fishing Enterprises
Asstatedinsection1.2above,thisstudyrepresentsanattempttoassesstheeconomicefficienciesanddistributionofthevalue-added,ofthevarioustypesoffishingunitswithintheartisanalfisheriessub-sector.Theanalysisnormallyis carried using accounting records. In the absence of the relevant accounting records and procedures, the consultant had to gather cost and revenue data so as to prepare Income and Expenditure Statements in the form of case studies foreachtypeoffishingunit.
Keyfactors/assumptionsapplicabletoallthefishingunitsareasfollows:
• Capital Investment-Actualcostofa6-7mfishingboatwhetherwoodenorfibreglassisatRs200,000andisdepreciatedattherate5%perannum(anaveragelifetimeof20years).ActualCostofa15HPoutboardengineia
atRs100,000andisdepreciatedattherate20%perannum(anaveragelifetimeof5years).
• Informal sector-Noformalaccountingproceduresarefollowedbyartisanalfishers.
• Seasonal variation - Fishing activities are more intensive and productive in the summer (6 months), than in the winter(6months)duetobadweather.Itisassumedthatafishingboatmakes2fishingtrips/weekduringwinterand5fishingtripsperweekduringsummer.Onthebasisof52weeksperyear,thetotalnumberoffishingtripsperyearisat182e.g.52fishing/daysinwinterand130fishing/daysinsummer.
• Classification of Commercial grade of fish-asestablishedbytheMOFRwasusedasitregroupsallfishspeciesinto6groupsaccordingtotheirrespectivecommercialimportance.Thesecommercialgradesreflectthemarket realities in Mauritius and were used in this study.
• Latest PSP and CSP time series data of the MOFR - used and actualized by primary surveys; e.g. catch compositionbygearandPSPatFLS.Table6onthefollowingpageshowsPSPDataforthefishingunitsforspeciesgroups.
• Cash business -Paymentreceivedfromfishmongersandprovidedtofishingcrewiscustomarilyonaweeklybasis. The transactions are mostly on a cash basis.
• A conservative approach is adopted so as to avoid under estimates of cost and/or over-estimates of revenue.
• License-Afisherdoesnotrequireafishmongerlicensetosellhiscatchdirectlytoendconsumers.
• Auto-consumption-Fishtakenhomebyfisherscommonlycalled“curry”isnotincludedinthesimulations.
• There is no Value Added Tax (VAT)onfreshfish.
• Environmental / ecological cost-(damagescausedbyaspecificgeartothemarineecosystem)isincludedin the VCA.
• The revenue estimates are before any interest paid on loans and income tax.
VCA of Fishing Enterprises
33SmartFish Programme Report SF/2012/8
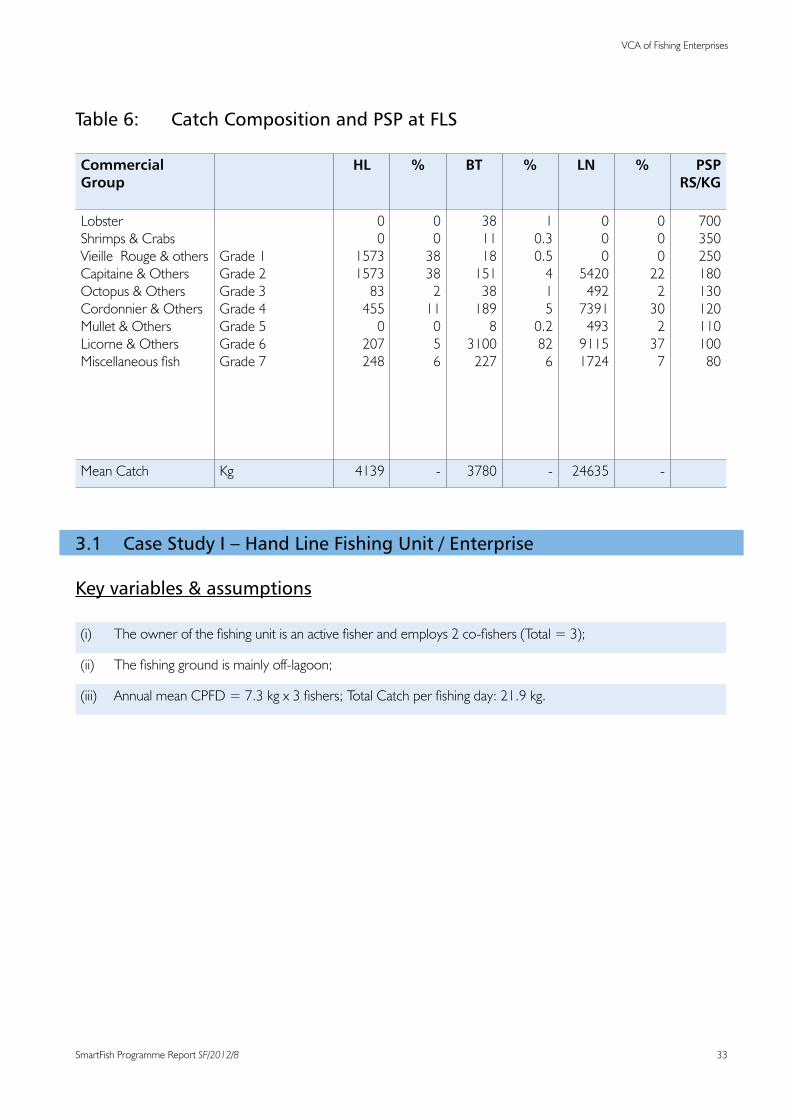
Table 6: Catch Composition and PSP at FLS
Commercial Group
HL % BT % LN % PSPRS/KG
Lobster Shrimps & Crabs Vieille Rouge & othersCapitaine & OthersOctopus & OthersCordonnier & OthersMullet & OthersLicorne & OthersMiscellaneousfish
Grade 1Grade 2Grade3Grade 4Grade5Grade 6Grade 7
00
1573157383455
0207248
003838
211
056
38111815138
1898
3100227
10.30.5
415
0.282
6
000
5420492739149391151724
000
22230
237
7
700350250180130120110100
80
Mean Catch Kg 4139 - 3780 - 24635 -
3.1 Case Study I – Hand Line Fishing Unit / Enterprise
Keyvariables&assumptions
(i) Theownerofthefishingunitisanactivefisherandemploys2co-fishers(Total=3);
(ii) Thefishinggroundismainlyoff-lagoon;
(iii) AnnualmeanCPFD=7.3kgx3fishers;TotalCatchperfishingday:21.9kg.

34 SmartFish Programme Report SF/2012/8
3.1.1 Income and Expenditure Statement
Thefollowingtableshowsanormalyearofactivityforahandlinefishingunit.
Table 7: Income and Expense for Hand Line Fishing Unit
Items (a normal year of activity) Rs Rs Rs
Sales – 4139 kg @ Rs 190.70
Less Fixed CostsDepreciation:F/Boat5%p.a;O/boardEngine20%p.aRepairandMaintenance:F/Boat&Engine–10%p.aSundryfixedcosts(Rs1000/month)Less Variable Costs (excluding Labour costs)FuelandLubes(Rs800@fishingday)Repair&Replacement–fishinggears(Rs1000p.m.)Baits(Rs200@fishingday)Sundries(Rs100@fishingday)
30 00030 00012 000
151 20012 000 37 80018 900
72 000
219900
789 307
291 900497 407
Less Labour Cost3fishersincl.boatowner-fisher([email protected])Surplus income after provision for depreciation
352 850Rs 144 557
3.1.2 Economic Analysis • Thefishingenterprise’smeanincomepermonthisRs21,848whichincludesRs9,801tofishersandRs 12,047toprofitorsurplusincomeforfishingenterprise);• Fisher(crew)meanincome:Rs9,801/month;• CostofProduction:Rs155.77perkg;• ProfitMargin:Rs34.93perkilo;• ProfitMarginonsales:18%;• Break-evenquantity(TR=TC)=3379kge.g.CPFD=6.0kg.

VCA of Fishing Enterprises
35SmartFish Programme Report SF/2012/8
3.2 Case Study II – Basket Trap Fishing Unit
3.2.1Keyvariablesandassumptions(i) Theboatownerisanactivefisherandhasnoco-fisher.Thefishingunitoperates10baskettrapsperfishing day.(ii) CPFD=20kg;Totalannualcatch:3780kg;(iii) Fishingground:Lagoon&OffLagoon.
3.2.2 Income and Expenditure StatementThefollowingtabledemonstratesanormalyearofactivityfortheBasketTrapfishingunit.
Table 8: Income and Expenses for Basket Trap Fishing Unit
Items (a normal year of activity) Rs Rs Rs
Sales – 3780 kg @ Rs120.21
Less Fixed CostsDepreciation:F/Boat5%p.a;O/boardEngine20%p.aRepairandMaintenance:F/Boat&Engine–10%p.aSundryfixedcosts(Rs1000p.m)
Less Variable Costs (excluding Labour costs)FuelandLubes(Rs800@fishingday)Repair&Replacement–fishinggears(30BT@Rs1500)Baits(Rs100@fishingday)Sundries(Rs100@fishingday)
30 00030 00012 000
151 20045 00018 90018 900
72 0000
234 000
454 394
306 000
Surplus of income after provision for depreciation 148 394
3.2.3 Economic Analysis
• Fishermeanincomepermonth:Rs12366• COP:Rs80.95perkg• ProfitMargin:Rs39.31perkilo• ProfitMargintoSales:32.7%• Break-EvenQuantity=2546kg(67.35%fishingcapacity)

36 SmartFish Programme Report SF/2012/8
3.3 Case Study III – Large Net Fishing Cooperative / Enterprise
3.3.1 Keyvariables&assumptions(i) Onefishingenterprisecomprises3fishingboatsand15fishers(e.g.eachfishingboathas5fishers).The fishingunitoperatesaseinenetof500mlong;(ii) Thefisheryisregulatedintermsofsizeofmeshandlengthofnet,asixmonthcloseseasonfromOctober to March every year;(iii) Fishingground:Lagoon;(iv) Catchperfishingdaysis259.3kg,(84.44Kg/boat)No.fishingdays:95;(v) Fishingcrewremuneration:Oneadditionalshareforboatownerafterdeductionoftripcosts.
3.3.2 Income and Expenditure Statement
ThefollowingtableshowsanormalyearofactivityforalargeNetfishingenterprise
Table 9: Income and Expense for Large Net Fishing Enterprise
Items (a normal year of activity) Rs Rs Rs
Sales – 24 635 kg @ Rs 128.30
Less Fixed CostsDepreciation: 3x (F/Boat 5 % p.a; O/board Engine 20% p.a)Repair and Maintenance: 3x(F/Boat & Engine –10 % p.a) Sundryfixedcosts3x(Rs1000p.m)
Less Variable Costs (excluding Labour costs)FuelandLubes(Rs1000@fishingday)Repair&Replacement–fishinggears(10Nets@Rs4500)Sundries(Rs500@fishingday)
90 00090 00036 000
285 00045 00047 500
216 000
377 500
3 160 690
593 5002 567 190
Less Labour Cost15 Fishers: (5/6 of net revenue after deduction of trip costs) Surplus of Income after provision for depreciation
2 139 325
427 865
3.3.3 Economic Analysis • BoatOwnerIncome=Rs47540/month(forsixmonths)• FishermeanIncome=Rs23770/month(forsixmonths)• COP:Rs110.92perkg• ProfitMargin:Rs17.38perkilo• ProfitMargintoSale:13.6%• Break-EvenQuantity(TR=TC)=21300kg(at86%ofactualcapacity)

VCA of Fishing Enterprises
37SmartFish Programme Report SF/2012/8
3.4 Case Study IV – Non-Motorized Boat Hand Line Unit
3.4.1 Keyvariablesandassumptions(i) OwnerofthefishingUnitisanactivefisherandemploys1co-fisher;
(ii) Thefishinggroundismainlylagoon;
(iii) AnnualmeanCPFD=5.4kgx2fishers;TotalCatchperfishingday:10.8kg.
3.4.2 Income and Expenditure Statement
Table 10 shows a normal year of activity for a non-motorised boat hand line unit
Table 10: Income and Expense for Non-motorised Boat Hand Line unit
Items (a normal year of activity) Rs Rs Rs
Sales – 2041 @ Rs 126.92
Less Fixed Costs
Depreciation:F/Boat5%perannunRepairandMaintenance:F/Boat–10%Sundryfixedcosts(Rs500/month)
Less Variable Costs (excluding Labour costs)
Repair&Replacement–fishinggears(Rs600/month)Baits(Rs100@fishingday)Sundries(Rs100@fishingday)
Cost of Labour – Rs 1021 Kg @ 60.21
10 00020 0006 000
7 200 18 90018 900
36 000
45 000
259 065
81 000178 06561 474
Surplus of income after provision for depreciation 116 291
3.4.3 Economic Analysis
• Meanannualincomeoffishingenterprise:Rs116292orRs9691permonth• Fishermeanincomepermonth:Rs5123
38 SmartFish Programme Report SF/2012/8
• COP:Rs69.81/Kg• ProfitmargintoSale:Rs57.11/kg• ProfitMargintosale:45%• Break-EvenQty:2070kg(almostasacurrentproductionlevel)
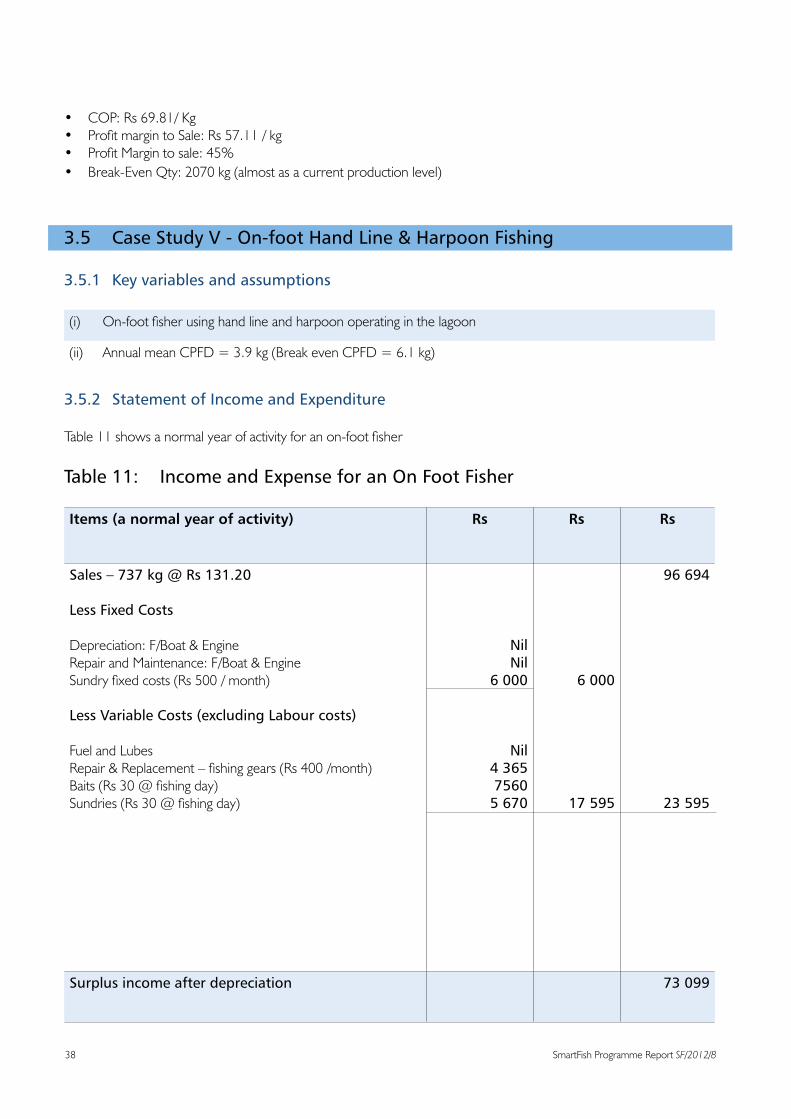
3.5 Case Study V - On-foot Hand Line & Harpoon Fishing
3.5.1 Keyvariablesandassumptions
(i) On-footfisherusinghandlineandharpoonoperatinginthelagoon
(ii) AnnualmeanCPFD=3.9kg(BreakevenCPFD=6.1kg)
3.5.2 Statement of Income and Expenditure
Table11showsanormalyearofactivityforanon-footfisher
Table 11: Income and Expense for an On Foot Fisher
Items (a normal year of activity) Rs Rs Rs
Sales – 737 kg @ Rs 131.20
Less Fixed Costs
Depreciation:F/Boat&EngineRepairandMaintenance:F/Boat&EngineSundryfixedcosts(Rs500/month)
Less Variable Costs (excluding Labour costs)
Fuel and Lubes Repair&Replacement–fishinggears(Rs400/month)Baits(Rs30@fishingday)Sundries(Rs30@fishingday)
NilNil
6 000
Nil4 365 7560
5 670
6 000
17 595
96 694
23 595
Surplus income after depreciation 73 099

VCA of Fishing Enterprises
39SmartFish Programme Report SF/2012/8
3.5.3 Economic Analysis
• MeanannualincomeoffisherisatRs73099orRs6092permonth• COP:Rs32.01/Kg• ProfitmargintoSale:Rs99.19/kg• ProfitMargintosale:75.60%• Break-EvenQuantity:557kg• Break-evenQuantityonthebasisofRs12000/monthbasicsalary:1095kg
3.6 Summary of Economic Indicators of Artisanal Fisheries
HerebelowinTable12isasummaryoftheeconomicindicatorsfromthepreviousanalsysofthedifferentfishingunits.
Table 12: Summary of Economic indicators by Fishery
Items
Case Studies
Unit HL
I
BT
II
HL/BT
(50/50)
LN
III
N/M
IV
On/FT
V
MeanfishingdaysperyearNo. of Fishers incl. ownerCatch per Fisherman dayCatch per Boat LandingMean annual Catch @ f/ boatBreak-even– Quantity (TR-TC)DifferenceAs a percentage of B/E QuantityMean (PSP)Annual Sales EstimatesSales / Fishing Boat (LN)
NUnit
KgKgKgKg
+/-
RsRsRs
1893-47.3
21.94139
3 379+ 760
22%190.70
789307-
1891-22020
37802 546+1234
48%120.21
454394-
1892-3
10.421
39602 963+ 99734%
155.46615622
-
95*(3x5)15259.386.4424635
21 300+3335
16%128.30
3 160 6901053563
18915.4
10.82 041
2 070- 29-1%
126.92259 065
-
189-
3.96.1737
1 095-358-31%131.20
96 694-
Annual Income - Fishing EnterpriseAnnual Mean Income - Fisher
Rs
Rs
262176
117612
148 596
148596
205 386
133 104
285 240
142 620
116 291
61 474
73099
-
N/M: Non-Motorized canoe: On/FT : On foot Fishers

40 SmartFish Programme Report SF/2012/8
3.7 ProfitabilityofFishingEnterprise–Rs/Kg
Thefollowingtablesummarisetheprofitabilityofthefishingenterprisesbyfishingunit:
Table13: SummaryofProfitabilitybytypeofFishery
Items Unit HL BT HL/BT LN N/M HL On/FT
Sales at PSPCost of Production ProfitProfitMargintoSalesCost of FuelCostoffishinglabour
Rs/kgRs/kgRs/kg
%Rs /kgRs/kg
190.70155.7734.9318 %36.5085.25
120.2180.9039.3133%40.0039.25
155.46117.8937.5724 %38.2562.25
128.30110.9217.3214%11.5686.84
126.9268.8156.9845%
-87.09
131.2032.0197.8075.%
-97.80
3.8 Cash Flow Management
Incomederivedfromfishingactivitiesfluctuatessignificantlyduringthepeaksummerandtheleanwinterseasonsduetoclimaticconditions(preventingaccess)andavailabilityoffishstocks.Also,fishbusinessiscarriedoutmainlyonacashbasisandonadaytodaybasisusuallyoutsidethebankingsector.Therefore,itisimperativeforafishingenterprisetomanageitscashflowonanannualbasistocopeefficientlywithintra-annualfluctuationofincome.Theabilitytodothisunusualinartisanalfisheries.Itrequiresanefficientcashflowmanagementabilitythatcanbeacquiredthroughbasicbusiness skills and a positive attitude towards saving.

VCA of Fishing Enterprises
41SmartFish Programme Report SF/2012/8
3.9 Bio-Economic Approach of the Artisanal Fisheries
Thebreak-evenquantitycalculatedofeachtypeoffishingunitswasextrapolatedtoestimatetheexistingproductioncapacitiesofthefishingassets.Thefollowingtabledemonstratesthis.
Table14: Estimatesofexistingfishingcapacities
Items NOTE HL BT HL/BT LN
ON-FOOT TOTAL
Estimates of fish harvested(i) Motorized CraftsMean annual catch (Kg)Total (tonnes)(iii) Non-Motorized craftsMean annual catch (kg)Total (tonnes)(iii) On-footfishersMean annual catch (kg) Total (tonnes)
Total Estimates (metric tonnes)
(a)(d)
(a x d)(b)(e)
(b x e)(c)(f)
(c x f)
(t)
56941392355 1092041222
--
2577
647378024461141890215
--
2661
114396045125196649
--
500
278212222--
--
222
-
--
13473799
99
13574034547424817684861341153(¹)155
6115
Note* The FAD fishery comprising 50 fishing boats and about 150 fishers has been excluded from the above simulation since it is not relevant to lagoon and off-lagoon fish stocks. (¹) Break Even Quantity for On-foot fishers
Accordingtotheaboveestimates,theexistingfleetof1605boatswillhavetoharvest6115tonnesoffishannuallytobeeconomicallyviable.Itimpliesthatthereisanexcessivefishingcapacity,whichcanpotentiallyoverexploitfishstocks in the lagoon and off-lagoon areas.
Basedonthemanningcapacityofeachtypeoffishingunitsandonthestatisticsofactiveon-footfishers,Table15providesestimatesofactivemanpowerintheartisanalfisheries.

42 SmartFish Programme Report SF/2012/8
Table15: Estimatesofactivefishingcrewandon-footfishers
Items NOTE HL BT HL/BT LN
ON-FOOT TOTAL
Estimates of active fishers(i) Motorized CraftsNo.offishersperfishingboatTotal
(ii) Non- Motorized CraftsNo.offishersperfishingboatTotal
(iii) No.ofOn-footfishersGrandTotalofActivefishers
(a)(e)
(a x e)
(b)(f)
(b x f)
(c)(N)
5693
1707
1092
218
-1925
6471
647
1142
228
-875
1142
228
252
50
-278
275
135
---
-135
---
---
134134
13572
2717
2482
496
1343347
Thenumberofactivefishersemployedbythefleetofactiveboatsisestimatedat3347,whichnearlydoublethenumberofregisteredactivefishersof1620.Thisestimateexcludesamateurandsportfishers.Table16showstheoptimalnumberoffishingboatsandfishersneededtooperateatthecurrentMSYlevel.
Table16: EstimatesofsurplusfishingcapacitiesatcurrentMSYlevel
Items HL BT BT/HL LN ON-FOOT TOTAL
Annual Catch / Current MSYPercentageMean Catch @ f/boat (kg)Optimal No. f/boats (N)Optimal On-foot fishers (N)ActualActivefishingboatsActualactiveon-footfishersSurplus fishing boats (N)Surplus On-foot fishers (N)
22712%
413954
-678
624-
26711%
3780150
-761
611-
2836%
39607-
139
132-
2226%
2463527
-27
0-
8735%737
-118
-134
-16
831100%
-2381181605
1367

VCA of Fishing Enterprises
43SmartFish Programme Report SF/2012/8
AtcurrentMSYlevel,theartisanalfisheriescanaffordtosustain238fishingboatsand832activefishersincluding118on-footfishers.Thereforeexistingsurpluscapacitiesareestimatedat1367activefishingboatsand938registeredactivefishers.Theallowancesandsubsidiesgiventothefishershavebecomearealobstacleforreductionoffishingeffortsandvoluntaryexitandthuscontributingtocontinueddepletionofthefishstocksinthelagoonandoff-lagoon.InkeepingwiththefindingsoftheVCAontheproductionfunctions,itisnecessarytoundertakethefollowingmeasures:
• Tocarryoutariskassessmentonfishstocksharvestedinthelagoonandoff-lagoonbytheartisanal fisheries,
• Toundertakeanenvironmentalimpactassessmentofartisanalfishinggearsusedonthemarine ecosystemssoastoencourageselectiveandenvironmentfriendlyfishingmethods.
• Toimplementasurveyontheexistingfleetoffishingeffortsintermsofboatsandallactivefishers includingnon-registeredprofessional,amateurandsportfishersinviewtoreplacethecurrentfisheries statistical system and sampling methods.
• Toperformanauditoftheexistingfishingboats,FLSandlogisticstoevaluatetheiradequacyinthe perspective of the implementation of COP – Handling and Preservation of Fresh Fish in the fishingoperations.
• TocreateanEconomicObservatoryheadedbyafisherieseconomistwithintheorganisational framework of the AFRC.
• To develop an appropriate bio-economic model that can be used as an effective management tool.
• Tocreateaninteractivedata-baseforactivefisher,fishingboats,fishmongersandeventuallyamateur andsportfishers.
• Toaneconomicanalysisontheartisanalfisheriesonanannualbasisandtopublishtheresultstheannual report of the Fisheries Division.

44 SmartFish Programme Report SF/2012/8
4.0 Fresh Fish Trade in Mauritius Thedomesticmarketsoffreshfisharesupply-drivenandthesuppliersarepricemakers.Themarketishighlyflexibleandadaptsitselfconstantlytosupply.Themainplayersinthemarketingchannelsarethefishmongerscommonlycalled“Banyan”.TheprimarysaletakesplaceattheFLS.Inbrief,thereareabout400fishmongerschasing830tonnesoffreshfishannuallyfortheconsumptionofthelocalpopulationandforeignvisitors.Thepercapita-consumptionoffishandfishproductsinMauritiusisat20kgwhilethecontributionoftheartisanalfisheriesislessthan1kg.ThereisnoVAToffishandfishproducts.
Theprimaryconcernoffishmongersistosecureregularandadequatesupplyoffishtosatisfytheirclientele.Whileanincreasinglargenumberoffishingentrepreneursarealsoinvolvedinmarketingfunctions,fishmongershaverespondedbyinvestingsignificantlyinfishingassets.Othersactasindigenousbankerstofishingenterprisesasameansofprocuringfishatcompetitiveprices.
Themarketingstrategyofafishingenterpriseiscorrelatedtotargetedcommercialspeciesandthelevelofcatchthatfluctuatesintra-annuallyandfromyeartoyear.GenerallyaLNfishingunitharvestsrelativelylargequantityoffishinasinglefishingtripandrequiresamoresignificantdistributionandmarketingnetwork.HLfishingenterprisestargethighvaluedemersalfishsuchasVieilleRouge,SacrechienandCapitaine,whicharesolddirectlytoendconsumersandrestaurantsatapremiumprice.TheuseofmobilephonesisbecomingamarketingstrategyforHLfishingunitsastheystart marketing their catch at sea, before returning to shore.
LNandBTfishingenterprisesprefertodealwithwholesalers,soastoselltheirfish–fastandslowmovingcommer-cial species - in one deal. There are specialized “niche” markets for certain commercial species such as Lobster, Vieille Rouge, and Squids as well as for traditional delicacies such as Licorne and Cateau.
Marketing and distribution networks connect FLS to the consumption centres. The main production centres are at Cap Malheureux,Troud’EauDouce,MahebourgandTamarin,whilefishmarketoutlets(institutionalfishmarkets,roadsideandambulantfishvendorsanddedicatedfishstallsinsuper/hypermarkets)arespreadovertheurbanandruralareasofthecountry.Thedistributionnetworkisgenerallyshortbecausethefishisnotpreservedonice. Inkeepingwiththeabove,itcanbesummarizedthatmarketstructuresandmarketingchannelsintheartisanalfisheriesaredynamicandadaptive.Themainstrategyistoselltheunloadedfishassoonaspossibletoavoidspoilage.Asinglefishmongermayactaswholesalerandretailersoastoadjustwiththesupplyandhissalecapacity.TheVCAwillalsoexamine vertically and horizontally integrated enterprises.

45SmartFish Programme Report SF/2012/8
Fresh fish trade in Mauritius
Theflowchartgivenbelowhighlightstheexistingmarketingchannelsintheartisanalfisheries.
Figure3:FlowchartofthemarketchannelsoffreshfishinMauritius
4.1 Fishmongers
Out of 961 licensed fishmongers inMauritius; only about 400 are active in the artisanal fisheries, either on parttimeorfulltimebasis.Alllicensedfishmongershavetoattendacompulsoryoneweekcourseon“COP-HandlingandPreservationoffreshfish”impartedbyFITECasaprerequisiteforrenewaloftheirlicense.Generallypart-timefishmongersareseasonalandworkasconstructionworkers,drivers,gardenersoragriculturallabourers.
4.1.1 Fishmongers – WholesalersWholesalerequiresarelativelylargequantityofsupplythatcanbesuppliedbyaLNfishingenterpriseorseveralBTand/orHLfishingenterprises.Thefollowingsfeaturesarecommontowholesalefishmongers:
• Totieupwithanetfishingunit(aNetfishermenCo-opSociety);• Toinvestdirectlyinfishingequipmentandcontractfishingcrewstooperatethem;• Toactasanindigenousbankertofishingunits;• Tooperateinanextendedfisherfamilysystem.
LNandBTfishingunitsaremoreinclinedtotie-upwithwholesalers.Afewwholesalershaveestablishedastronggoodwill over time and hold a dominant position at their acquainted FLS. Wholesale market margin is approximately Rs 10 to 20 per kilo depending on the commercial species and quantities supplied at a given time.
Afewdistributorsinthefisheriessectorhavediversifiedintofreshfishmarketingtotargetahigherincomegroupofconsumersthroughdedicatedfishstallsinsuper/hypermarkets,restaurantsandthehotelindustry.Theyhaveinvestedinmodernfishingboatsfittedwithinsulatedfishholds,logisticalcomponents,suchicemachines,refrigeratedtrucksandcoolroomstocomplywithinternationalhealthandsanitarynormsforfreshfishandtoalignwiththeHACCPsystem.OneofsuchintegratedenterpriseisexportingselectivehighvaluechilledfishtoRéunionIsland.
End Consumers Exports
Super / hyper MarketsFish Shops
Hotel & Restaurants
Retailer / Wholesalers F/boat owner (N= 150)
Wholesaler/ Distributors(N= 10)
Fishers (N=1655) – F/Boats (N=1700) – Production (830 t) – Fishmongers : 400
Retailers FLS(N=100)
N:3
Fish
ers
(N=
1655
) – F
/Boa
ts (N
=17
00) –
Pro
duct
ion
(830
t) –
Fis
hmon
gers
: 40
0
Inland Retail Outlets:Town & Large Village Markets, 340Roadside & Ambulant vendors
46 SmartFish Programme Report SF/2012/8
4.1.2 Fishmonger – RetailersFreshfishretailoutletscompriseinstitutionalfishmarketsinurbanandruralareas,traditionalfishpeddlersandhawkers,modernfishstallsinsuper/hypermarketsanddedicatedfishshops.Roadsideandambulantfishvendorshavebuiltupa strong clientele in their locality. Withincreasingoperatingcostsforfishing(higherfuelprices,labourcostsanddecliningcatches),somefishingenter-prises are now involved in the direct sale of their catch in order to improve margins for themselves.
4.2 Marketing and Distribution Logistics
Motorcyclesandpick-upvansarethemostcommonmeansoftransportusedbyfishmongers.Fishisusuallystackedinjutebaskets,plasticcratesandfibreglassboxes.Thetimefactoriscrucialinthemarketingoffreshfishthatisnotpre-servedwithice.Itmaytakebetween4and24hoursbeforethefishreachtheendconsumersfromthetimeofharvest.Roadsideandambulantfishvendorstradeinsmallquantitiesvaryingfrom25kgto50kgperdaytoavoidspoilage.Itisacommonpracticetokeepunsoldfishindomesticfreezersovernightorlongerandsoldin“freshform”thefollowingday!Thisisarealhealthhazardtobeprevented.QualityconsciousconsumersprefertobuyfishattheFLSordirectlyfromfishers.
4.2.1 PreservationoffreshfishAsstatedearlier,themeansforpreservationoffreshfishesinthemarketingnetworkareeitherrudimentaryorinex-istent.Institutionalfishmarketsintownsandvillagesareindeplorablehygienicconditions.Thisisarealhealthhazardtoconsumersandaneyesoreforlocalandforeignvisitors.Argumentsadvancedbyfishmongersfornotusingiceare:
• Freshfishissoldquicklyafterreception;• Vehiclesarenotappropriateforcarryinginsulatedcontainersandiceflakes;• Iceflakesarenotavailableonthemarket;• Iceflakeisexpensiveandwillincreaseoperatingcost;• Consumersdonotbuyfreshfishkeptonice.
Thesameargumentsweremadebythefishersconcerningpost-harvesthandlingandpreservationoffish.CommercialsupplyoficeflakesislimitedontheislandandnotavailableattheFLS.Duetoalackofadequateinfrastructureandequipment the implementation of COP – “Handling and Preservation of Fresh Fish” relies mainly on voluntary compli-ance. Aculturalchangeinpreservationoffreshfishhasstartedbysomefishvendorswhoareusingsimplemeanstoim-provesafetyandqualitystandards.Theyareusingsimple/practicalmeanssuchasiceboxes,home-madeice,fly-nets,aluminium, sheet-embedded working tables, and so on. In some cases broken-down freezers are used as insulated containers.Howevertheconsumers’perceptionthaticedfishisnotfreshhastobedissipatedthroughanationwideawareness campaign.
Food safety and quality is mandatory for a health population. There is an urgent need for a comprehensive and con-certedactionplanwithaspecifiedtimeframetoenforcetheCOP–“HandlingandPreservationofFreshFish”asaminimalfoodsafetyandqualitystandardalongthesupplychainoftheartisanalfisheries.
4.2.2 Processing and value-addition activitiesFreshnessisamarkofhighqualityandvalue-addedthatisrewardedbyapricepremium.Indedicatedfishshopsandfishstalls insupermarketsconsumerspayahigherprice for freshfish for itshygienicdisplay,qualityandassociatedvalue-addedservices,suchasgutting,cleaning,filleting,slicingandpackaging.WiththeemergenceofmodernlifestylesinMauritius,demandforhighqualityready-to-cookrawfishandfishproductswillincreasesignificantly.Microandsmallscale processing and value-added activities do not exist mainly because of a scarcity and irregularity of the supply of freshfish.WiththedevelopmentoftheFADfisheryandextendeddemersalfishery,deficientsupplyofrawfishmay

47SmartFish Programme Report SF/2012/8
Fresh fish trade in Mauritius
be overcome in the short and medium terms. Eventually minor processing and value-added activities can potentially improvejobcreationandincomeearningcapacitiesintheartisanalfisheries.
4.3 Pricing Mechanism
ThereisnopricecontrolonfreshfishinMauritiusandpricesaredeterminedbymarketforcesandarenotsubjecttoVAT.Themarketispredominantlysupplydrivenandpricesarevolatileasaresult.Pricevariesaccordingto:
• Consumerspreferenceandtaste;• Seasonalfluctuationsindemandandsupply;• Effectivedemandofcorporatebuyers–restaurants,caterersandhotels;• Marketingchannels.

48 SmartFish Programme Report SF/2012/8
Tabl
e 17
on
the
follo
win
g pa
ge sh
ows t
he m
ean
Prod
ucer
Sale
Pric
e (P
SP) a
nd C
onsu
mer
Sale
Pric
e (C
SP) a
t FLS
by
com
mer
cial g
roup
s for
the
year
201
0. T
his t
able
isextractedfromapreviousreportandislabelledtable5.ItisTable17inthisreport.
REG
ION
Lob
ster
Cra
bs
& S
hri
mp
sG
rad
e 1
Gra
de
2 G
rad
e 3
Gra
de
4 G
rad
e 5
Gra
de
6 M
isc.
Oth
ers
NO
RTH
EAST
1EA
ST 2
WES
T 1
WES
T 2
MEA
N
PSP
CSP
M
M9001300
400
600
700
100
550
700
150
700
800
100
700
800
100
690
860
170
PSP
CSP
M
M450
550
100
300
400
100
275
325
50300
400
100
275
350
75320
405
85
PSP
CSP
M
M241
375
134
205
253
48238
293
55235
280
4520
9 28
1 72
226
296
71
PSP
CSP
M
M179
259
80187
230
4318
0 22
0 40
167
209
4220
7 27
9 72
184
239
55
PSP
CSP
M
M145
180
35135
170
35125
155
30145
180
35150
180
30140
173
33
PSP
CSP
M
M122
156
34125
155
30106
135
29145
174
2914
8 16
7 19
129
157
28
PSP
CSP
M
M110
150
40125
155
30120
150
30115
140
25160
185
25126
156
30
PSP
CSP
M
M123
167
4411
4 14
2 28
115
137
2212
0 14
7 27
137
167
30122
152
30.
PSP
CSP
M
M77
112
3560
81
21
77
87
1062
75
1361
78
17
67
87
19
%25
26.6
3130
2422
2425
28
Notes:PSP:
ProducerSellingPrice/PrimarySalePrice
CSP:
ConsumerSellingPrice
WSP:
WholesalePrice
MM:
MarketingMargin
a)
MarketMarginvariesbetween20to30%dependingonthecommercialspecies.Theoverallaverage
is25%
b)
Pr
imar
y su
rvey
s re
veal
that
Who
lesa
ler o
pera
te a
t Mar
ket m
argi
n of
app
roxi
mat
ely
10 %
c)
MarketingCostforthefishmongersatFLSisminimalornegligible
Thisexplainsthemotivationoffisherstodiversifytofishretailing
The
abov
e da
ta d
o di
ffere
ntiat
e be
twee
n W
SP a
nd R
SP a
t the
FLS

49SmartFish Programme Report SF/2012/8
VCA of Marketing Channels
5.0 VCA of Marketing ChannelsToaddress theVCA, theMarketingMargin (MM),MarketingCost (MC) andMarketingProfit (MP)of thevariousmarket channels were determined. A simple marketing business model was designed to calculate the above economic indicatorswithparticularemphasisontheverticallyintegratedactivities(fishingandmarketing).
5.1 Case Study VI – Integrated Coastal Retailer of Hand Line Harvested Fish
Anincreasingnumberofroadsidefishstallsoperateincoastalareasaroundresidentialandcommercialcentres.Theyareoftenconnectedtofishingenterpriseswithinthehouseholdorextendedfamily.Fishretailingbusinessrequiresaminimalcapitalinvestmentandadministrativeformalitiesthatmakesitaccessibletothefishercommunities.
5.1.1 Keydeterminants&assumptions
(i) Capitalinvestmentconsistsof2x150litrefreezers,2x60litreiceboxes,afishstall/workingtableandsundrytools such as weighing scale, chop board and knives;
(ii) Annualfishsupply:4139kg;
(iii) Purchaseprice:PSPatFLSistakenasTransferpricefromfishingUnittoRetailunit;
(iv) Customers:mainlyrestaurantsandregularclients;
(v) Value-addedservices:Personalizedserviceslikegutting,cleaning,slicing,filletingandhomedeliverywithinthelocality are inclusive in CSP.
5.1.2 Statement of Income and Expenditure The following table summarize the results of this analysis.
Table 18: Income /Expense Summary for Integrated Retailer for Hand-line Harvested FishItems Vieille Capitaine Octopus Cordo Licorne Misc. TOTAL MEAN
Grade 1 Grade 2 Grade3 Grade 4 Grade 6 Grade Rs/kg
% of total catch 38% 38% 2% 11% 5% 6% 100%
Quantity supplied 1572,82 1572,82 82,78 455,29 206,95 248,34 4139
Retailer CSP 350 200 160 160 130 120
Total Sales 550487 314564 13244 72846 26904 29801 1 007 846 243.50
PSP 250 180 130 120 110 100
Total Purchases (A) 393205 283108 10761 54635 22765 24834 789307 190.70
MARKET.COST
Transport 14364 14364 756 4158 1890 2268 37800 9.13
Electricity 5472 5472 288 1584 720 864 14400 3.48
Rent 0 0 0 0 0 0 0 0.00
Water 1140 1140 60 330 150 180 3000 0.72
Telecoms. 2280 2280 120 660 300 360 6000 1.45
Sundries 4560 4560 240 1320 600 720 12000 2.90
Overheads* 3800 3800 200 1100 500 600 10000 2.42
Total MC (B) 31616 31616 1664 9152 4160 4992 83200 20.10
COST OF SALES 424 821 314724 12425 63787 26925 29826 872507 211.00

50 SmartFish Programme Report SF/2012/8
Profit Margin 125666 -160 819 9 060 -21 -25 135339 32.70
Margin / Sales (%) 22.83% -0.05% 6.19% 12.44% -0.08% -0.08% 13.43%
5.1.3 Economic Analysis
• TheNetIncomeofthefishretailerafterdepreciationisRs135339peryear,whichisequaltoanaverageofRs11278 per month
• MMisatRs53.10/kg• MC is at Rs 20.10/kg • MPisatRs33.00/Kg• ProfitMargintoSales(allgroupsoffishincludedasabove)isequalto13.43%
5.2 Case Study VII – Integrated Coastal Retailer of Basket Trap Harvested Fish
ThiscasestudyisconnectedtoaBTfishingenterprisewithinafisherhousehold.
5.2.1 Statement of Income and Expenditure
The following table summarises the results of the analysis.
Table 19: Income / Expense Summary for Coastal Retailer of Basket Trap harvestfishItems Lobster Vieille Capitaine Octopus Cordonn Licorne Misc. TOTAL MEAN
Crabs… Grade 1 Grade 2 Grade3 Grade 4 Grade 6 Grade Kg% 0.013 0.005 0.040 0.010 0.050 0.822 0.060 1.000
Qty supplied 49 18 151 38 189 3108 227 3780
Retailer CSP 884 400 200 180 170 150 100 161.00
Total Sales 43316 7200 30200 6840 32130 466200 22700 608586
PSP 621 300 250 130 130 100 80
Purchases (A) 30429 5400 37750 4940 24570 310800 18160 432049 114.30
MARKETING COST
Transport 491 189 1512 378 1890 31072 2268 37800
Electricity 187 72 576 144 720 11837 864 14400
Rent 0 0 0 0 0 0 0 0.00
Water 39 15 120 300 150 2466 180 3000
Telecoms. 78 30 240 600 300 4992 360 6000
Sundries 156 60 480 1200 600 9864 720 12000
Overheads* 130 50 400 1000 500 8220 600 10000
Total MC (B) 1082 416 3328 3622 4160 68451 4992 86051 22.76
COST OF SALES 31510.60 5816.00 4107800 8562.00 28730.00 379251.00 23152.00 518100 137.06
Profit Margin 11805.40 1384.00 -10878. -1722 3400 86949 -4520 90486 23.94
Margin/Sales 27% 19% -36% -25% 11% 19% -1.99% 15%

51SmartFish Programme Report SF/2012/8
VCA of Marketing Channels
5.2.2 Economic Analysis
• TheNetincomeofthefishretailerafterdepreciationisatRs90486peryearwhichisequaltoandaverageofRs7541permonth.
• MMisatRs45.70/kg• MC is at Rs 22.76 /kg • MPisatRs23.94/Kg• TheProfitMargintoSalesisat15%
5.3. Case Study VIII – Wholesaler of Large Net & Basket Trap Harvested Fish
Thewholesalepriceisabout10%belowthePSPatFLS.AwholesalertakespossessionofthefishattheFLSandeither sells it on the spot to retailers and/or distributes it to inland institutional markets.
5.3.1 Keydeterminants&assumptions
(i) Capital Employed-One3tonner-refrigeratedtruckthatserveastransportandstorageconvenienceatanactualcostofRs400,000.And20plasticcrates@Rs250each.
(ii) Mean annual qty traded–62435kgonthebasisofaregularsupplyfrom1LNfishingenterpriseand10BTfishingUnits.IthasadominantpositionataspecificFLS.
(iii) No. of retail outlets - 6 at the tune of 1000 kg / month.
(iv) Production Centres – East and Retailing outlets – mainly inner towns and villages.
5.3.2 Statement of Income & ExpenditureThe following table summarises the results of the analysis.
Table 20: Income /Expense for Wholesaler of Large Net and Basket Trap Harvested FishItems Lobster Vieille Capitaine Octopus Cordonn Licorne Misc. TOTAL MEAN
Crabs… Grade 1 Grade 2 Grade3 Grade 4 Grade 6 Grade Kg% 0,007 0,002 0,111 0,014 0,155 0,644 0,063 1
Qty supplied 490 180 6950 872 9734 40215 3994 62435
RSP 600 300 180 130 120 120 70
Total Sales 294000 54000 1251000 113360 1168080 4825800 279580 7985820 127.91
WSP at FLS 500 200 160 120 110 100 60
Tot/Purchases 245000 36000 1112000 104640 1070740 4021500 239640 6829520 109.39
MARKETING COSTFuel & Lubes 1228 451 17420 2185 24399 100803 1001 156500 -
Electricity 94 34 1335 167 1871 7729 768 12000 -
Rent 0 0 0 0 0 0 0 0 -
Water 23 9 333 42 468 1932 192 3000 -
Telecoms. 70 25 1001 126 1403 5796 576 9000 -
Labour Cost 765 281 10853 1362 15201 62800 6237 97500 -
R&M 510 187 7235 908 10134 41867 4158 65000 -
Depreciation 376 138 5343 670 7483 30917 3071 48000 -
Contingencies 304 112 4319 542 6049 24991 2482 38800 -

52 SmartFish Programme Report SF/2012/8
Total MC (B) 3 370 1 237 47 839 6 002 67 008 276 835 18 485 429 800 6.88
COS 248370 37237 1159839 110642 1137748 4298335 258125 7259320 116.27
Profit Margin 45630 16763 91161 2718 30332 527465 21455 726500 11.64
Profit /Sales % 15.52 31.04 7.29 2.40 2.60 10.93 7.67 9.10 -
COS: Cost of sales
5.3.3 Economic Analysis• AnnualNetincomeofthewholesaler=Rs726,500beforeinterestandtax• MM=Rs18.52/kg• MC=Rs6.88/kg• MP=Rs12.81/Kg• TheProfitMargintoSales=9.105%
5.4. Case Study IX – Municipal Fish Retail Outlet
ThiscasestudyisrelatedtoaMunicipalfishmarketsuppliedbythewholesalerpresentedinCasestudyVIII.Themeanmonthlyprocurementoffishis1000kg.
5.4.1 Statement of Income and Expenditure
The following table summarises the results of the analysis.
Table 21: Income /Expense for Municipal Fish Market supplied by WholesalerItems Vieille Capitaine Octopus Cordo Licorne Misc. TOTAL MEAN
Grade 1 Grade 2 Grade3 Grade 4 Grade 6 Grade Rs/kg
% 0,03 0,11 0,01 0,16 0,64 0,06 1,00 -
Quantity supplied 129 1336 168 1871 7729 768 12 000 -CSP 400 200 160 160 160 100 -
Total Sales 51600 267200 26880 299360 1236640 76800 1958480 163.21
RSP 300 180 130 120 120 70 Total Purchases 38700 240480 21840 224520 927480 53760 1506780 125.57
Marketing Cost
Rent, Rate & levies 37 1447 182 2027 8373 832 13000 -
Electricity 17 668 84 935 3865 384 6000 -
Water 9 334 42 468 1932 192 3000 -
Labour ¹ 281 10853 1362 15201 62801 6237 97500 -
Telecoms 35 1336 168 1871 7729 768 12000 -
Overheads² 23 891 112 1247 5153 512 8000 -
Contingencies 40 1553 195 2175 8985 892 13950 -Total M/ Cost 442 17081 2143 23924 98839 9816 153450 12,79
Cost of sales 39142 257561 23983 248444 1026319 63576 1660230 138.36
Marketing Profit 12458 9639 2897 50916 210321 13224 298250 24.85
Margin to Sale 11,64 3,61 15,12 21,89 10,13 15,65 15.23

53SmartFish Programme Report SF/2012/8
VCA of Marketing Channels
Notes:(¹) 1 helper is employed at the rate of Rs 7500 /month on basis of 13 months/year.(²) Overheads include depreciation of a freezer and sundry tools.
5.4.2 Economic Analysis
• AnnualNetincomeofthefishstall=Rs298250• MM=Rs37.64/kg• MC=Rs12.79/kg• MP=Rs24.85/Kg• ProfitMargintoSales=15.23%
5.5. Case Study X – Fish Stall in a Hypermarket
Anincreasingnumberofcustomersbuyfreshfishfromdedicatedfishstallsinsupermarketsforitsfreshness,qualityandready-to-cookservicessuchasgutting,cleaning,slicingandfilleting.Thiscasestudyexaminesitsmarketingmarginandprofit.Themeansalecapacityisestimatedat1500kg/month.
5.5.1 Statement of Income and Expenditure
The following table summarises the results of the analysis.
Table 22: Income /Expense for Fish Stall in HypermarketItems Vieille Capitaine Octopus Carang Cordon TOTAL MEAN
Grade 1 Grade 2 Grade3 Grade 4 Grade 6 Rs/kg
% 0.250 0.500 0.100 0.100 0.050 1
Quantity supplied 3750 7500 1500 1500 750 15,000
Retail Sale Price 500 300 250 280 250
Total Sales 1,875,000 2,250,000 375,000 420,000 187,500 5,107,500 341
WSP 350 180 140 120 140
Total Purchases 1,312,500 1,350,000 210,000 180,000 105,000 3,157,500 211
Marketing Cost
Rent, Rate & levies 90,000 18,0000 36,000 36,000 18,000 360,000 -
Salesman (1) 32,500 65,000 13,000 13,000 6,500 130,000 -
Driver / Helper 39,000 78,000 15,600 15,600 7,800 156,000 -
Telecoms 3,000 6,000 1,200 1,200 600 12,000 -
Rpr & Maintenance 60,000 120,000 24,000 24,000 12,000 240,000 -
Refri truck 56,250 112,500 22,500 22,500 11,250 225,000 -
IceflakesRs3@Kg 9,000 18,000 5,000 5,000 2,500 36,000 -
Depreciation (2) 10,000 20,000 18,500 18,500 2,000 40,000 -
Contingencies(3) 14,471.25 28,942.5 11,470 11,470 573.5 57,885 -
Total M Cost 314,221 628,443 126,170 126,170 62,844 1,256,885 83.79
Total Cost 1,626,721 1,978,443 336,170 306,170 167,844 4,414,385 294
MarketingProfit 248,279 271,558 38,830 113,830 19,656 693,115 46.21
Margin to Sale % 11.64 3.61 15.12 21.89 10.13 13.57 -

54 SmartFish Programme Report SF/2012/8
Notes to accounts:(1) Salary of a salesman at Rs 10,000 / month for 13 months(2) Depreciation of refrigerated truck at 10% per annum(3) 5% of total marketing cost
5.5.2 Economic Analysis
• AnnualNetincomeofthefishstallinHypermarket=Rs693,115beforetax• MM=Rs130.00/kg• MC=Rs83.79/kg• MP=Rs46.21/Kg• TheProfitMargintoSales=13.57%
6.0 Distribution of Value Added Between Fishing and Marketing FunctionsDistributionofvalue-addedandprofitbetweenfishingandmarketingenterprisesisexaminedthroughthefollowingsimulations. The main criterion used is the Net Income derived by the stakeholder in the different types and /or segments the production and marketing functions.
6.1 HL Integrated (Fishing and Marketing) Activities
TheeconomicperformanceintermsofNetIncomeorprofitahouseholddiversifiedfishbusinessisestimatedinthetablebelow:
Table23:AnalysisofNetincomeforaHouseholddiversifiedfishBusinessItems Rs / Kg % to CSP
CSP(roadsidefishstall) 243.50 -
Fishing - Less Cost Production (155.77) 64%
Retailing – Less Marketing Cost (20.10) 8%Total profit ( Fishing and Marketing) 67.63 28%
Profitfromfishingoperations 34.93 14.3%
Profitfrommarketingoperation 32.70 13.7%
MarketingMargin(MM=MC+MP) 21.7%
6.1.1 Economic analysis
• TotalProfit=Rs67.63/kg(Fishing-Rs34.93/Kg+Marketing-Rs32.70/Kg)• AnnualIncomebeforetax=Rs279921orRs23327/month• TotalProfit/NetIncometoCSP=28%

55SmartFish Programme Report SF/2012/8
Distribution of value added between Fishing and Marketing functions
6.2 BT Integrated (Fishing and Marketing) Activities
Thiscase-studyisalsorelatedtoahouseholdintegratedfishbusiness.Thefollowingtablesummarisestheanalysis
Table 24: BT Integrated Business
Items Rs / Kg % to CSP
CSP(roadsidefishstall) 161.00 -
Fishing - Less Cost Production (86.52) 54%
Retailing – Less Marketing Cost (22.75) 14%Total profit ( Fishing and Marketing) 51.73 32%
Profitfromfishingoperations 39.31 24%
Profitfrommarketingoperation 12.42 8%
MarketingMargin(MM=MC+MP) 22%
6.2.1 Economic Analysis
• TotalProfit=Rs51.73/Kg(Fishing=Rs39.31/kg&Marketing=Rs12.42/kg)• AnnualNetIncomebeforetax=Rs195539orRs16295/month• NetIncome/ProfittoCSP=32%(Fishing=24%andMarketing=8%)
6.3 HL and Supermarket Fish Stall Integrated Activities
This case-study is related to aHL and Supermarket integrated fish business. The following table summarises theanalysis.
Table 25: HL & Supermarket Fish Stall integrated businessItems Rs / Kg % to CSP
CSP(roadsidefishstall) 341.00 -
Fishing - Less Cost Production (155.77) 46%
Retailing – Less Marketing Cost (83.79) 25%Total profit ( Fishing and Marketing) 101.44 29%
Profitfromfishingoperations 34.93 10%
Profitfrommarketingoperation 66.51 19%
MarketingMargin(MM=MC+MP) 44%
6.3.1 Economic Analysis
• Totalprofit=Rs101.44/Kg(Fishing=Rs34.93/Kg&Marketing=Rs66.51/Kg)• AnnualIncome/Profitbeforeinterest&tax=Rs1521600• TotalProfittoCSP=29%(Fishing10%andMarketing19%)
6.4 LN Fishing and Institutional Fish Market Integrated Activities
This case-study is related to an integrated LN Fishing and Institutional Fish Market. The following table summarises the analysis.

56 SmartFish Programme Report SF/2012/8
Table26:LNfishingandinstitutionalfishmarketintegratedactivitiesItems Rs / Kg % to CSP
CSP(Institutionalfishmarket) 163.21 -
Fishing - Less Cost Production (86.52) 53%
Retailing – Less Marketing Cost (12.79) 8%
Total profit (Fishing and Marketing) 63.90 39%
Profitfromfishingoperations 41.68 26%
Profitfrommarketingoperation 22.22 13%
MarketingMargin(MM=MC+MP) 21%
6.4.1 Economic analysis
• TotalProfit=Rs63.90/Kg(Fishing=Rs41.68/Kg&Marketing=Rs22.22/Kg)• TotalannualIncomebeforetax=Rs766800• TotalProfittoCSP=39%(Fishing=26%andMarketing=13%)
6.5 Integrated Fishing and Marketing Activities – Non-Motorized HL Boats
This case-study is related to an integrated Non-motorized HL boats and marketing business. The following table summarises the analysis.
Table27:Non-MotorizedHLboatsandfishmarketingbusinessItems Rs / Kg % to CSP
CSP(Institutionalfishmarket) 243.50 -
Fishing - Less Cost Production (129.76) 53%
Retailing – Less Marketing Cost (20.10) 8%
Total profit (Fishing and Marketing) 93.64 39%
Profitfromfishingoperations 60.93 25%
Profitfrommarketingoperation 32.71 14%
MarketingMargin(MM=MC+MP) 22%
6.5.1 Economic analysis
• Totalprofit=Rs93.64/Kg(FishingRs60.93/K&MarketingRs32.71/Kg)• AnnualNetIncome=Rs191119or.Rs15927permonth• TotalProfittoCSP=39%(Fishing=25%&Marketing14%)
6.6 On-foot Fishers - Integrated Fishing and Marketing Activities
Thiscase-studyisrelatedtoOn-footintegratedfishingandmarketingbusiness.Thefollowingtablesummarisestheanalysis.

57SmartFish Programme Report SF/2012/8
Distribution of value added between Fishing and Marketing functions
Table28:On-footfishers-IntegratedfishingandmarketingbusinessItems Rs / Kg % to CSP
CSP(Institutionalfishmarket) 151.70 -
Fishing - Less Cost Production (32.01) 21%
Retailing – Less Marketing Cost (10.00) 7%
Total profit ( Fishing and Marketing) 109.69 72%
Profitfromfishingoperations 99.06 65%
Profitfrommarketingoperation 10.63 7%
MarketingMargin(MM=MC+MP) 14%
6.6.1 Economic Analysis
• NetIncome=Rs109.69/Kg(Fishing=Rs99.69/kg&Marketing=Rs10.63/Kg)• TotalannualIncomebeforetax=Rs80842e.g.Rs6737/month• TotalProfittoCSP=72%(65%fromfishingand7%frommarketing)• Criticalsizeofoperation=Break-EvenQuantityat1153kgtoyieldanannualincomeofRs126403e.g.Rs10534permonth
6.7 Summary of Case Study Results
Thefollowingtablesummarisesthefindingsoftheabovecasestudies
Table29:SummaryofProfitMarginofintegrated(fishing&marketing)activitiesITEMS (Rs / kg) CSP COP MC COS T P F P M P
HL / Road side Retailer
243.50 155.77 20.10 175.87 67.63 34.93 32.70
BT /Road side Retailer
161.00 86.52 22.75 109.27 51.73 39.31 12.42
HL / Supermarket Retailer
341.00 155.77 83.77 239.54 101.46 34.93 66.53
LN / Inst. Market Retailer
163.21 86.52 12.79 99.31 63.90 41.68 22.22
O&S Boat – HL / Direct Sales
243.50 129.76 20.10 149.86 93.64 60.93 32.71
On-Foot / Direct sales
151.70 32.01 10.00 42.01 109.69 99.06 10.63
Mean (Rs / kg) 217.32 107.73 28.25 135.98 81.34 51.81 29.54
Mean (%) - 50 % 13 % 63 % 37 % 24% 13%
CSP : Consumer Sale Price; COP : Cost of Production; MC: Marketing Cost; TP: Total profit;COS : Cost of Sales ; FP : Fishing Profit and MP : Marketing ProfitTP = MP + FPCSP – COS = MP; COS = COP + MCPSP = COP + FP
It can be concluded that the distribution of value added between Fishing functions and marketing channels is equitable and realistic. The current mean PSP and CSP are at Rs 191 and Rs 217 per Kg respectively. The pie chart below illustratesthemeandistributionofvalueaddedperkgoffishharvestedbytheartisanalfisheries.

58 SmartFish Programme Report SF/2012/8
Asstatedabove,theconsumersalepriceoffreshfishhasincreasedatanaverage15%peryearoverthepast3years.The shortage of supply is compensated by higher prices through consistently strong demand.
7.0 Results and Discussions The artisanal fisheries sub-sector has to be economically viable to sustain its own socio-economic and ecologicaldevelopment. It cannot afford to be an economic liability or a negative saving to the national economy. Therefore it isessential for theartisanalfisheries tobeshapedupsoas tomeet theopportunitiesandchallenges inahighlycompetitiveglobalenvironment.Undertheprevailingenvironment,theartisanalfisheriessub-sectoriseconomicallydeficient,whichwillimpoverishthefishercommunitiesgivingrisetosocialtension.Thefollowingsectionsreviewtheshort comings and weaknesses that have to be addressed in a concerted manner.
7.1 Management and Monitoring Measures
7.1.1 Openaccessfisheries/Noentry-barriers
Theartisanalfisheriesoperateinarelativeopenaccessenvironment.VariousallowancesprovidedbytheGovernmenttoregisteredfishershavebecomeabarriertovoluntaryexit.Itisimportanttoundertakeacost-benefitanalysisonthevariousallowancesandtofindalternativemeasurestorelievethesub-sectorfromthesurplusfishingefforts/over-capacity.
This open access situation is also relevant for an increasing large number of (non-registered) active, amateur and sportfishersexploitingthesamefishstocksinthelagoonandoff-lagoon.Itisadmittedbythepopulationatlargethatfishstocksaredecliningduetoover-fishingandthatdegradationofthecoastalmarineecosystemisapparent.Thismomentum can be seized positively to introduce an effective regulatory framework to manage and monitor the coastal fisheriesinaholisticmanner.
7.1.2 Over-investmentintheartisanalfisheries
Thereisseriousproblemofovercapitalizationinthefisheriesintermsoffishingassetsandactivemanpower.AtthecurrentMSYof830tonnesperannum,thesub-sectorcansustainafleetof238fishingboatsand832registeredfishersto achieve its bio-economic equilibrium. Alistofregisteredfishers,fishingboatsandlicensedfishmongersaremaintainedseparatelyatregionalFisheriesPosts
Figure4:MeanvalueaddedperKg

59SmartFish Programme Report SF/2012/8
Results and Discussions
andarenotcompiledintoaninteractivedatabasethatcanprovideusefulmanagementinformation,suchas:• Registeredfishers/Ownersoffishingboats• Registeredfishers/Fishmongers• Fishmongers/OwnersoffishingboatsItwas indicated that in2010 thenumberof registeredfishingboatsandfishershasdeclinedbynearly30%. It isobviousthatsomeregisteredfishersquitbecausetheyhavereachedtheretirementagewhileothersaretakinganalternatejobfortheirlivelihood.TheyareheldvirtuallyonthefisheriesrolljustforthesakeoftheallowancesprovidedbyGovernment.Apparentlythenumberofregisteredfishingboatshasdeclinedbutthereisnoindicationwhetherthey have been laid up temporarily or removed permanently.Acomprehensivesurveyhastobeconductedontheactualfishingeffortsnamelyfishingboats,registeredandnon-registeredprofessionalfishers;amateurandsportfisherstoupdatetheexistingdata-base.
7.1.3 Underestimatedfisheriesstatistics
Deficient data collection, samplingmethods, a laxity in the enforcement of relevant regulations and a systematicavoidanceonthepartofthefishingunits,allcontributetounderestimatedfisheriesstatisticsinMauritius.According to existing fisheries regulations, FLS are theonly authorized place for unloadingof fish by the artisanalfisheries.Howeveralargenumberoffishingboatsandon-footfishersavoidssystematicallytheFLSforunloadingtheircatch.Themaincausesareattributedto:• Close down or inactivity of a large number of the FLS• Aversionofthefishingunitstodisclosetheirrealcatch• Tenserelationshipsbetweenfisheriesofficersandfishercommunities• Impossible to moor at the FLS during low tides – poor design and facilitiesReliablestatisticsaremandatoryfortheefficientmanagementandmonitoringprocessaswellascosteffectivepolicingfor enforcement. Voluntary compliance is the only sustainable solution that can be achieved through a participatory management framework. TheCPFD,whichisat6.4kgforthepast3years,isnotareliableindicatorforbiologicalsustainabilityofthetargetedfishstocks.Itismosturgentandhighlyrecommendedthatariskassessmentbeundertakenonthetargetedfishstocksinthelagoonandoff-lagoon.Thefisheriesstatisticalsystems,samplingmethodsanddatacollectionstrategieswillhavetobereviewedinlightofthenewconfigurationofthecoastalfisheries.
7.2 FLS and LFC as the Focal Point
FLSistheoperationalbaseofthecoastalfisheriesandthedevelopmentofthefisherieshassufferedgreatlyfromtheirmarginalization. Actually FLS are managed by the FD and maintained by the local authorities while the main users - fishersandfishmongers-arenotdirectlyinvolvedintheirmanagement.Direct involvement of the LFC in up-grading or delocalisation, as well as in co-management of FLS is crucial to deliver value for money. LFC has to be empowered through capacity building programmes in local governance, leadership and participatory management. A pilot project can be initiated at a selected site(s) to experiment the advantages of this new approach in collaboration with of NGOs and the MFFC. The concept can be improved by lessons learned and replicated progressively across the island. The LFC’s commitment will be a milestone in the implementation of voluntary compliance to fisheries regulations andother cross-sectional issues such as safety andquality standards,renewal of manpower, technological innovations and so on.

60 SmartFish Programme Report SF/2012/8
7.3 Handling and Preservation of Fresh Fish
Therecannotbeanycompromiseonhealthsafetyandqualityoffishplacedonthelocalmarkets.Amyriadofregulationsexistatthenationalandlocal levelstocontrolthesafetyandqualityoffreshfish.However,thearrayofinstitutionsinvolved, concerns about overlapping jurisdictions and officialmandates at different levels, have all contributed tomakingenforcementdifficult.
The COP for Handling and Preservation of Fresh Fish provides a basic safety and quality standard for the local markets that can be upgraded progressively to achieve world class standards over time. The existing misconception regarding theuseofice-flakesforpreservationoffreshfishhastoberemovedbyanintensiveawarenesscampaign.
Consumershavetobesensitizedonthefundamentalsoffoodsafetyandqualityapplicabletofreshfishwhilesuppliershave to be convinced that safety and quality standards are not cost constraints but marketing opportunities. Inpractice,fishqualityimprovementimpliesupgradingalongthesupplychain,fromfishersthroughtoendconsumers.It requires additional capital investment and working capital all along the supply chains, i.e. insulated containers (ice boxes) have to be present on the boats, at the FLS, during transportation to markets and in the retail markets a suitable presentationoficedfishhastobemade.A commonly used strategy to dealwith the upgrading of safety and quality standard in the artisanal fisheries in asustainablewayiselaboratedasfollows:• Workwith localcontainermanufacturerstodesignnewtypes(rigid/flexible)ofplasticcoolersadaptedtothefishingboatsandfishmongers;
• IntroduceappropriatesizesofcoolerstoboatownersandfishmongersatFLSalongwithtrainingonfishsafetyandquality preservation ;
• Bring in financial institutions like theDBM,Empowerment Fund and commercial banks toprovide assets andworkingcapitalfinancing;
• Providefinancialliteracyandentrepreneurialskilltrainingasanembeddedbusinessdevelopmentservicetonewborrowers along the supply chain;
• Promote private investment in logistics such as ice plants and refrigerated vehicles to establish cost-effective and reliabledeliveriesoficeflakestotheFLS.
This approach has to be characterized by sustainability and innovation. Sustainability, in the sense of how will goods and servicesbepaidforcommercially;and,innovationcomesintoplayintermsoftechnology,finance,roleoffishmongers,and governance/partnerships.TheMdP atTamarin has an ice plant of 500kgof ice / flakeper day and2 refrigerated truckswhich are actuallyunderutilized. These facilities can be incorporated in a pilot project for the implementation of the safety and quality offreshfishonthewestcoastthroughcollaborationbetweenMFFCandFD.Likewiseatechno-economicaudit isproposed to assess the cost of rehabilitation of the MdP at Cap Malheureux.
7.4 Processing and Value Added Activities
Theslowdevelopmentofprocessingandvalue-additionactivitiesintheartisanalfisheriesisattributableto:
• Scarcity and irregularity of supply• Poorsafetyandqualitystandardoffreshfish
The new Fisheries Master Plan lays emphasis on the development of extended artisanal FAD and deep-sea demersal fisheriessoastoboostdomesticsupplyoffreshfish.Also,afoodsafetyandqualitystandardforfishisimminent.
Assuming that the above constraints are removed, a large number of micro and smallscale processing and value-added enterprisescanbepromotedinthefollowingareas:

61SmartFish Programme Report SF/2012/8
Results and Discussions
• Value addition with vacuum packed options- Filet / loin - Cubeflesh- Slices- Wholefishscaled,guttedandpacked
• Semi-processed- Fishballs,fishburgers,samosasandsoon- Fish sausages- Fish paste
• Ready-to-cook
- Marinatedfish- Fish pickles- Smokedfish- Cookedfish(traditionalrecipes)
FITEChasamajorroletoplayinpromotingmicroandsmall-scaleprocessingactivitiesintheartisanalfisheriesinthefollowingways:
• EstablishmentofaCOPforprocessingandpreservingoffreshfishandfishproducts;• Capacitybuildinginproductdevelopment/marketing;• BusinessDevelopmentServices&facilitation(onestop-shop)services;• Mentoringandfollowupstartups;• Trainingandaccesstofinance.
7.5 New Concept of Fish Terminal
Theartisanalfisheriessub-sectorformspartoftheculturalheritageofthecountry.Likeinotherdevelopedcountries,this can be showcased as a theme to local and foreign visitors. A modern concept of a Fish Terminal / Market is proposedtopromoteexcellenceinseafoodsafetyandqualitythatwillbeintegratedtofishlanding,processing,retailoutlets and seafood courts in the same complex. This project has tremendous potentials of creating positive synergies between the artisanal fisheries and the tourism industry.This proposal aims at transforming anexisting andpartlyutilized MdP into a world class tourist attraction.
TheSIChas3integratedFLScommonlyknownas“MaisonsdesPêcheurs”locatedatstrategicpointsoftheartisanalfisheriesandmajortouristhubsofthecountry.TheirmanagementisvettedtoMFFCthoughtheMOFRandMOC.Presently the MdP at Cap Malheureux is inactive while the ones at Tamarin and Mahebourg waterfront are partly utilized.Theyareequippedwithbasicfacilitiesforfishhandling,preservation,distributionandmarketing.Itisproposedto promote this new concept of a Fish Terminal at the MdP of Mahebourg Waterfront.
MFFCisanexampleoffishercommunity-basedincomegeneratingNGOintheartisanalfisheries.Ithasbeenattheserviceofthefishercommunitiessincethe1970sandhas625activeregisteredfishersatitsmembers.Itisalreadyinthefreshfishdistributionandmarketingbusiness.IthasshowninterestintheproposednewFishTerminalconceptat Mahebourg Fishermen Village (waterfront) and is prepared to commission a pre-feasibility study and business plan through an STE. Eventually capital investment could be raised from the Decentralized Cooperation Development Fund of the EU and the SME Partnership Fund.

62 SmartFish Programme Report SF/2012/8
Recommendations
8.0 RecommendationsTime frame
Short/Medium/Long Term S/T M/T L/T
Months 1-6 7-18 19-36
IMPROVEMENT IN FISH STOCKS MANAGEMENT 10
1. Riskassessmentoffishstocksharvestedinthelagoonandoff-lagoon.
X
2. Impactassessmentofthefishinggearsusedbytheartisanalfisheriesonthemarineecosystem.
X
3. Regulatoryframeworktomanageactive(non-registered,amateurandsportfishersinthelagoonandoff-lagoon.
X
4. To carry out a survey on the (non-registered) active, amateur andsportfishersoperatinginthelagoonandoff-lagoon.
X
5. Assessmentofexistingsamplingmethodsandstatisticalsystemintheartisanalfisheries.
X
IMPROVEMENT OF SAFETY AND QUALITY OF FRESH FISH11
6. An audit of all FLS to evaluate their effectiveness to serve as operational bases to LFC in the prospective of enhancement of local participatory management and the implementation of safetyandqualitystandardforfreshfish.
X
7. To prepare a detailed action plan, with budgetary and regula-tory provisions and time frame to serve as a blue print for the implementation of the COP – “Handling and Preserva-tion of fresh Fish” as a food safety and quality standard.
X
8. To launch a pilot project on the voluntarily Compliance to the COP – Handling and Preservation of Fresh Fish in a selected FLS or MdP to serve as a model in the crusade for theimprovementofsafetyandqualityoffreshfishontheisland.
X
FISH MARKET INTEGRATED TO TOURISM INDUSTRY
9. Preparation of a Pre-feasibility study and business plan for the development of a new concept of integrated Fish Terminal at “Maison des Pêcheurs” of MFFC at Mahebourg Waterfront as pilot project that can be replicated to other strategic sites.
X
10 It is indicated by the FD that there is a commitment on the IFAD to fund the STE for the implementation a comprehensive coastal fisheries management programme. These actions will be undertaken planning process would start within the framework of the new Fisher Master Plan.
11 The COP – Handling and preservation of fresh fish was implemented the IFAD and the continued supports of this international organisation for the enhancement of the value chain of the coastal fisheries are assured.

63SmartFish Programme Report SF/2012/8
BIO-ECONOMIC APPROACH TO MANAGEMENT12
10. Development and use of an appropriate bio-economic model / software as a management tool.
X
11. CreationofanEconomicObservatoryheadedbyafisher-ies economist at FD to deal with all socio-economic issues relatedtofisheriessectorincludingartisanalfisheries.
X
LOCAL GOVERNANCE IN FISHERIES MANAGEMENT
12. A pilot-project for empower LFC in local governance and participatory management of decision making at local level and shared responsibility in management of FLS.
X
IMPROVED COMMUNICATION
13. Publicationofareader-friendlynewslettertodisseminatefisheries,socio-economic,technological,safetyandquality,entrepreneurship, innovations and marketing information to fishercommunitiesandthecitizensatlarge.
X
12 An audit has been carried on the organisational and functional structure of the AFRC the IFRS-ESA (IOC/EU) recently and the mission has recommended appointment of an Economist at the MOFR which can be a first step towards the creation of an Economic Unit / Observatory

64 SmartFish Programme Report SF/2012/8

65SmartFish Programme Report SF/2012/8
Appendix 1
APPENDIX

66 SmartFish Programme Report SF/2012/8

67SmartFish Programme Report SF/2012/8
Appendix 1
Appendix 1: Terms of Reference
Objectives of TOR Works done and incorporated in the study report
1. Convene stakeholders meetings in selected areas to identify the current problems with marketing within this fishery and fully understand the main constraints/ opportunities for fishers in handling, processing andmarketingoffishnationallyandforexport.
Aprimarysurveywascarriedonthefishers,fishmongersandserviceprovidersintheartisanalfisherieswiththecollaborationoftheFisheriesOfficers.Theconstraints&opportunitiesintheproductionfunctionsandmarketingchannelsareidentified.
FGD were organised with Fishers and Fishmongers at Grand Gaube, Trou d’Eau Douce, Mahebourg and Case Noyale to have a deeper understanding of issues related to handling, processing and marketing structures.
3. Investigate /define the structureof thedistributionchainfor the sub-sector from catch tomarkets, using 2 or 3examples in the country.
An in-depth study was done on the supply chain from catch to market and 10 case studies were been prepared.
4. Investigate prices for fish products throughout thedistribution channels and review costs / margins associated with the process to reach markets.
Prices were studied at different levels of the marketing channels namely, primary sale price and whole sale price at FLS as well asretailsalepricesatdifferentfishmarkets.
5. ollect information on domestic / export markets, andcompile information on individuals / groups involved in fishtrade,productsprocessed,andsuccesses,failures.
Informationonmajorstakeholdersintheartisanalfisherieshasbeen compiled.
6. Collect information on processed fish products andassess possibilities for improved processing techniques in securing / sustaining current and future markets nationally / and for export.
A survey has been done and recommendations made to this effect.
7. Assess value-addition opportunities for the artisanal fisheries in Mauritius, with a view to improving thesustainability of the sector for the future.
Processing and value addition opportunities in the artisanal fisheries were assessed and recommendations madeaccordingly.
8. Outline a simple business model(s) (capital costs / revenue/ operating costs / margins) that represent(s) the keyprocessingactivitiesinthefisheryrequiredtosustainand improve trade.
Business models and case studies have been prepared for major, fishing and marketing components in the artisanalfisheries.
9. Review required personal investment in the fishery formarket entry, as well as to secure current / future markets national / and for export and assess the requirements for investment in this fishery including access to fundsand financing opportunities (e.g. micro-credit) for suchpersonal investment.
Capital investment required in the personal fishing andmarketing enterprises aswell as the local sourcesof financewere investigated Extension services provided in the sub-sector were scrutinized.
10. Take the view that existing infrastructure should be used as muchaspossibletodefineshorttermrecommendationsfrom the assessment, however identify other infrastructure requirements to support the industry and provide an estimate of capital costs – such as landing sites and other logistical infrastructure (ice, drying facilities, storage, transportation, wholesale markets, etc.) that would improve the performance of the sub-sector.
Major coastal fisheries infrastructure were assessed in viewto optimize their use. A new concept of Fish Terminal was proposed to create positive synergies between the artisanal and tourismsectorbyuseofanunder-utilizedfisheriescomplex.
11. Assess and analyse situation with regards to community structure in relation to sustainable marketing of quality fisheriesproductsperformance.
Ways and means were discussed to empower the local fisher communities in participatory management and localgovernance.
68 SmartFish Programme Report SF/2012/8
12. Investigate underlying reasons for non performance of the artisanalfisherytoperforminsuchanunbalancedmarket.
Aneconomicassessmentoftheartisanalfisherieswascarriedoutandrecommendationsmadetoenhancetheirefficienciesat all levels.
13. Towardstheendofthestudyperiod,prepareandpresentthe key findings of the study to stakeholders (fishers,processors, exporters, transporters, investors, public section at a feedback workshop (2 + days envisaged). Where necessary invite participants form regional countries to share their experiences in the artisanal sector.
Adraftstudyreportcontainingthefindingsandrecommendationshas been submitted. A workshop at the national level will be organizedshortlytopresentthefindingsandrecommendationsto the main private and institutional stakeholders.
14. Produceafinalreportfromtheworkshopuponreceivingstakeholders’ comments.
To be done accordingly.

69SmartFish Programme Report SF/2012/8
Appendix 2
Appendix 2: Commercial Category of Fish Harvested by the Artisanal Fisheries
Category Mauritian Name Scientific Name English Name
Homard Panulirus sp. Lobster
Crabe Scylla sp. Crab
Crevette Penaeus monodon ShrimpCategory I Vieille Rouge Epinephelus fasciatus Blacktip grouper
Geule Pavee Rhabdosargus sarba Seabream
Croissant queue jaune Variola louti Yellow-edged lyretail
Croissant queue blanc Variola albimarginata White-edged lyretail
Vacoas Aprion virescens Greenjobfish
Sacrechien blanc Pristipomoides filamentosus Bluespotttedjobfish
Sacrechien rouge Etelis cabunculus Ruby snapperCategory 2 Capitaine Lethrinus nebolus Apangled emperor
Vivaneau Pristipomoides zonatus Obique blanded grouper
Mourgate Loligos sp. Squid
Vieille la boue Epinephelus morrhua Obique blanded grouper
Vieille maman rouge Cephalopholis sonerati Hind
Dame berri Lethrinus mahesena Sky emperor
Battardet Lethrinus harak Thumprint emperor
Barrois Lethrinus elongatus
Vieille voleuse Epinephelus merra Snubnose grouperCategory 3 Caya Lethrinus rubrioperculatus Spotcheck emperor
Ourite Octopus vulgaris Octopus
Carangue Carans sp. Coastal trevallyCategory 4 Cordonnier Sigamus sutor Shoenaker spinefoot
Becure Acanthocybium solandri Wahoo
Thon blanc Thunnus alalunga Dogtooth tuna
Thon jaune Thunnus albacore Yellowfintuna
Breton Gerres oyena Longtail silver biddy
Dorade Coryphaena hippurus Dolphinfish
Bardet Polynemus plebejus Treadfin
Rouget Parupeneus sp. Goatfish
Empereur Istiphorus gladius Sailfish
Marlin Mokaira mazara Blue marlinCategory 5 Mulet voile Mugil cephalus Flathead mullet
Boordemar Lutjanus sanguinus Blacktail snapperCategory 6 Licorne Naso unicornis Unicornfish
Cateau bleu Scarruc ghoban Parrotfish

70SmartFish Programme Report SF/2012/8
Cateau vert Scarrus sordichus Parrotfish
Vieille grise Ephinephelus merra Honey comb grouper
Mulet sec Valanugil seheli Blue spot mullet
Madame tombee Cheilinus trilobatus Wrasse
Thazar Sphyaena obtusata Barracuda
Bonite Euthynnus affinis Skipjack tuna
Lion Myripristis chryseres SoldierfishMisc.fish Aiguille Ablennus hians Needlefish
Sap-sap Leiognathus fasciatus Ponyfish
Lubine Elops sp. Tenpounder
Carandine Gnathodentex oureolineatus Stripped large eye bream
Chirrurgien Acanthurus sp. Bluelinesurgeonfish
Pavillon Chaetodon sp. Butterflyfish
Bourse Triggerfish
Requin Shark

71SmartFish Programme Report SF/2012/8
Appendix 3
Appendix 3: Fishing Business Model
Items Variable Notes / Data sources
SALES
Meancatchperfishingday A Intra-annual mean incl. lean & peak seasons
Mean Price B WeightedaveragemeanPSP&fishspecies
Number of Fishing days per year C (Interviews & Secondary Surveys)
TOTAL ANNUAL REVENUE D (a x b x c)
FIXED COSTS
Depreciation(fishingboat+Engine) E ActualCost:F/boat,Engines&otherAssets
Interest payable on loans / advances F If any
Boat & Engine repairs & maintenance G (Interviews and Secondary surveys)
Otherfixedcost H Contingent costs such as Insurance
TOTAL FIXED COSTS I (e + f + g + h)
VARIABLE COSTS (excl. labour)
Fishing gear repair / replacement J (Interviews & Secondary Surveys)
Fuel and Lubricants K -same as above -
Ice L -same as above -
Baits M -same as above -
Food & Provisions N Not applicable
Marketing Costs & others O Contingent costs / transport, communications...
TOTAL FISHING TRIPS COST P (j + k + l + m + n + o )
LABOUR COSTS
Shared Costs OR Q (D–Q)/Nooffishers
Crew Salary Q¹ (Agreed price x qty (Kg)
ANNUAL PROFIT R D – (I + P + Q or Q¹)
Explanatory Notesi) Total annual revenue(D)ispresentedintermsofCPFD(a),meanPSP(b)andnumberfishingdays(c).ThesevariablesweredeterminedbythefisheriesstatisticsoftheMOFRandcomplemented/crosscheckedbyprimarysurvey.Regionalas wells as seasonal variations of landings and prices were taken into account.
ii) Fixed costs(I)arethosecoststhatareincurredregularly,regardlessofthefishingactivities,i.e.:• Depreciationoffishingboatandenginesandotherassets(e)• Interest on loans & advances (f)• Fishing boat & Engine repairs and maintenance (g) • Other such costs incl. Insurance (h)
iii) Variable costs(Q)arecoststhatarerelated,directlyorindirectly,tofishingactivities,i.e.:• Fishing gear repair and replacement (j)• Fishtripscostsincl.alldirectcostsofproductionandsale:
- Fuel and lubricant (k) - Iceflake(l) - Bait ( m) - Food and provisions (n) - Marketing costs and others when appropriate (o)

72 SmartFish Programme Report SF/2012/8
Unit prices of inputs such as fuel, ice and so on are fairly standard in the country. Fuel consumption was learnt through the survey and was cross-checked by one-to-one interviews
iv) Labour cost(QorQ¹)wasstructuredindifferentwaysaccordingtothesysteminusebythefishingunit.ThemostcommonarrangementsinMauritiusare:
• Share system in which the boat owner and the crew take equal shares of the catch value after deduction trip costs (Q)
• Paymentofcontractedpriceperkgfordifferentgradesoffish(Q¹) v) Annualprofitofthefishingunit(R)isthegrossrevenue(d),lessallfixedcosts,exceptdepreciation(I),allvariablecosts(P) and labour costs (Q or Q¹ )Afishingdayusuallystartsatabout6amtoendat1pmandthusmostlagoonandoff-lagoonfishersspend6to8hoursatsea.
vi) Fishing Trips:Onanannualbasis,afishingboatundertakes4to5tripsperweekduringthesummerand2to3tripsperweekduringwinterthatmake189fishingdaysperyear.Themaincauseofinterruptionoffishingactivitiesissevereclimatic conditions during winter and tropical depressions in summer.
Thenumberofcrews/fishersonafishingboatdependsonthefisheryi.e.abasketandtrapfishingboatwillnormallycarry2fisherswhileitvariesfrom3to5fishersforthehandlinefishery.Forthelargenetfishery,onefishingunitcomprises3to5boatswithacrewof3oneachofthem.ForthepurposeofthebusinessmodeloffishingunitoftheLargeNetfisheryconsistsof3boatsand10fishers.
Themostimportantvaluederivedfromthebusinessmodelisthenetdailyincomeperfishingdayandpercalendardaythathelptoappraisetheeconomicviabilityofthefishingactivity.

73SmartFish Programme Report SF/2012/8
Appendix 4, 5
Appendix 4: Consolidated Data – Reg. Fishers / Fishing Boats / Fishmongers
2009 Reg F’men / gears Registered RegisteredS/No. Fish Post LN BT H L BT/
HL/HTotal Fishmongers Fishing Boats
1 Port Louis 0 1 49 65 115 221 214
2 Tombeau Bay 0 12 59 79 150 72 169
3 Trou aux Biches 4 1 86 101 192 68 217
4 Grand Gaube 28 16 61 190 295 82 287
5 Poudre d'Or 0 12 1 133 146 50 171
6 Poste La Fayette 16 5 0 73 94 34 110
7 Trou d'Eau Douce 18 10 31 63 122 26 131
8 GRSE 0 1 4 91 96 26 153
9 Bambou Virieux 0 15 18 178 211 30 202
10 Mahébourg 30 16 42 249 337 144 376
11 Riambel 6 3 4 77 90 33 31
12 Baie du cap 3 7 20 59 89 30 83
13 Case Noyale 10 2 5 114 131 43 152
14 La Preneuse 18 2 49 77 146 60 140
15 Point aux Sables 16 3 37 33 89 42 89
Total 149 106 466 1582 2303 961* 2525
NOTE: Only about 400 are active in the artisanal fisheries.
Appendix 5: Catch Composition of the Artisanal Fisheries - Year 2010
Commercial Species % kg
Lobsters 0.52 4326
Shrimps & Crabs 0.40 3334
Vieille Rouge & Others Grade 1 7.87 65450
Capitaine & Others Grade 2 16.65 138420
Ourites&OthersGrade3 13.15 109320
Cordonnier & others - Grade 4 16.53 137447
Mullet&others-Grade5 0.63 5211
Licorne & Others Grade 6 33.27 276584
Othermiscfishes 10.98 91283
Total 100.00 831375

74 SmartFish Programme Report SF/2012/8
Appendix 6
Figure 5: Catch Composition / Commercial species - 2010
Appendix 6: Questionnaire 2 - Distribution and Marketing Channels
Value Chain Assessment
ArtisanalfisheriesinMauritius July/August2010
Fish Post Fish Landing Station
1.Howdoyougetyourfishsupply? Nodays/week: Summer
Nodays/week: Winter
2.Howmanyfishsuppliers(fishers)doyouworkwith?
HL / BT
3.Whatqty(lb)issuppliesbyeachfisher(average)? Summer
Winter
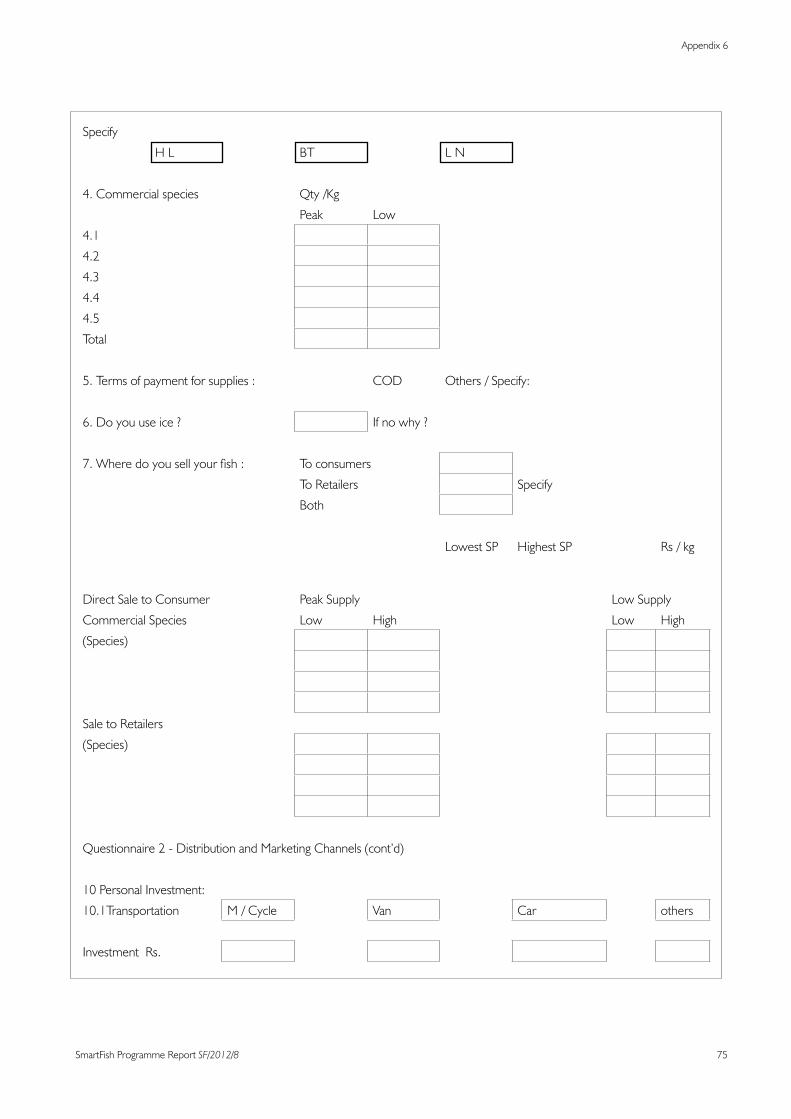
75SmartFish Programme Report SF/2012/8
Appendix 6
Specify
H L BT L N
4. Commercial species Qty /Kg
Peak Low
4.1
4.2
4.3
4.4
4.5
Total
5.Termsofpaymentforsupplies: COD Others/Specify:
6.Doyouuseice? Ifnowhy?
7.Wheredoyousellyourfish: To consumers
To Retailers Specify
Both
Lowest SP Highest SP Rs / kg
Direct Sale to Consumer Peak Supply Low Supply
Commercial Species Low High Low High
(Species)
Sale to Retailers
(Species)
Questionnaire 2 - Distribution and Marketing Channels (cont’d)
10PersonalInvestment:
10.1Transportation M / Cycle Van Car others
Investment Rs.

76 SmartFish Programme Report SF/2012/8
10.2 Other eqts Ice box Baskets others
Freezers C/ room
10.3TotalInvestments:
11Howlonghavebeenfishmonger:………………………………
12Isityouronlyemployment?………...Ifnot,otheractivities:………………
13.Whatarethechallenges/contraintsinmarketing……………………………………………………
Generalremarksandcomments:

77SmartFish Programme Report SF/2012/8
Appendix 7
Appendix 7: Questionnaire 2 – Fishing Enterprise
ArtisanalfisheriesinMauritiusPart 1 : Fishing Equipment Information
FishPost:…………………….. Date:.......................…
Type of F/ Boat Wooden Fibreglass
Length (metre) …………….
Cost of Boat Rs …………….
Date & Place of Construction …………….
Outboard Engine HP: …………
Date&PlaceofPurchase:………………………/……………... ……………
Cost of Outboard Engine Rs. …………….
TotalCostandSourceoffunds:…………….…………/………………………
Typesoffishinggearsused:...…………………………………………………………..
Date&Placeofpurchase:……………………………………/………………………………..
Costoffishinggears: Rs………………….
TotalCostandSourceoffunds……………………………………………………….
No.ofcrewsonboard: ……………
Remunerationsystem:Share:BoatOwner……../MasterFisher……./Crew…...
Alternatesystem:
Other/Generalinfo:

78 SmartFish Programme Report SF/2012/8
Value Chain Assessment
ArtisanalfisheriesinMauritius
Questionnaire 2 : Fishing Unit Owner
Part 2 : Daily Catch information
FishingTechniques/strategies: HL BT LN HL/HPN
FishingZone:LAG:……..OFF-LAG……
TimeOut……………….TimeIn:................... FishingTime:……….
Expenses : Rs.
Fuel (incl. Oil) …… Litres Cost …………..
Food ….. Cost ………….
Ice ….. kg Cost ………….
Water …. Litres Cost …………
Repair & Maintenance
Spare-parts / Repairs Cost …………
Ropes Cost ………..
Otherconsumables: Cost ……….
Income (targeted species) Wt/ Kg Value/ RsFish / Common species ... .......
... .......
... .......
... .......
... .......
... .......
Daily Average Income / (Winter) .......
Catch kept for autoconsumption .......
Other source of revenue Amount .......................
79SmartFish Programme Report SF/2012/8
Appendix 7
Value Chain Assessment
Artisanal Fisheries in MauritiusQuestionnaire 2: Fishing Unit Owner (Cont..)
Part3:Sales&MarketingStrategies
Areyouinvolvedinfishprocessing/distribution/marketing?
Howdoyoudeterminethesalepriceofyourcatch?
Doyouhaveanycommitmentorcontractwithafishtraderorfishmonger?
Whatarethemainproblemsyouencounterinmarketingofyourcatch?
AreyouamemberofaFishermenAssociation/CooperativeSociety…?
Howcanyouimproveyourincomeinfishingactivities?

80 SmartFish Programme Report SF/2012/8
Appendix 8
Appendix 8: Fish Landing Stations (FLS) Around Mauritius
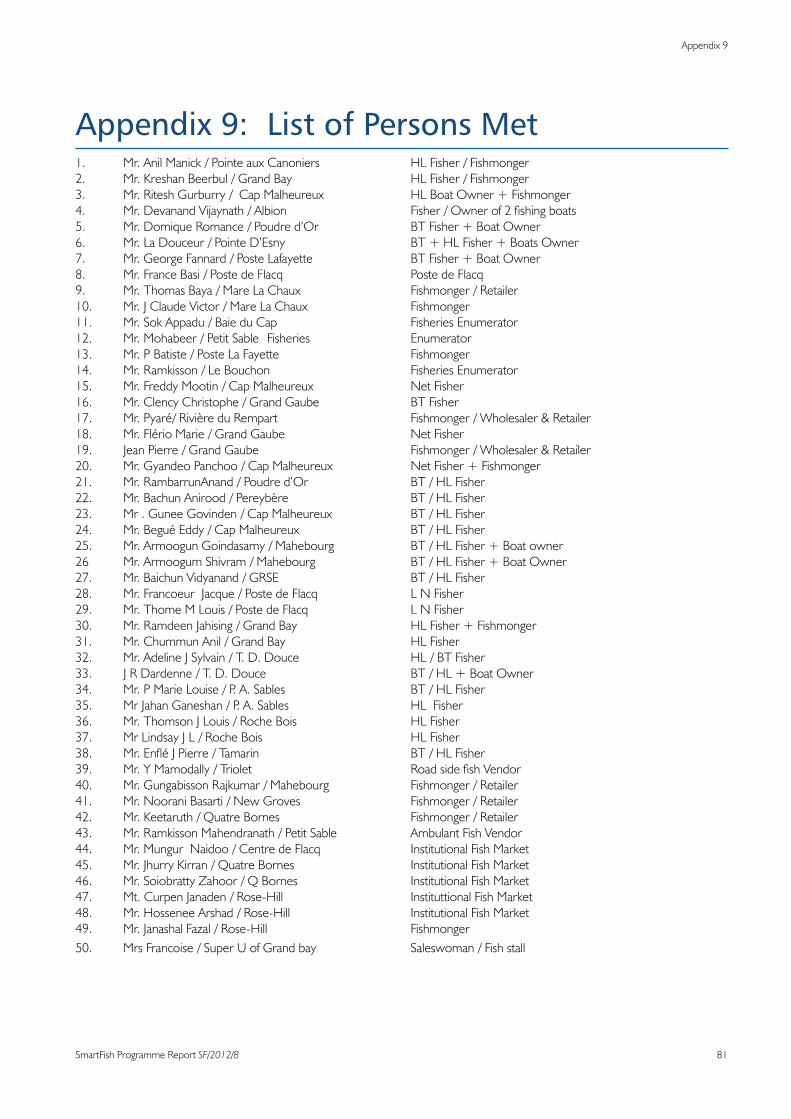
81SmartFish Programme Report SF/2012/8
Appendix 9
Appendix 9: List of Persons Met1. Mr. Anil Manick / Pointe aux Canoniers HL Fisher / Fishmonger2. Mr. Kreshan Beerbul / Grand Bay HL Fisher / Fishmonger3. Mr.RiteshGurburry/CapMalheureux HLBoatOwner+Fishmonger4. Mr.DevanandVijaynath/Albion Fisher/Ownerof2fishingboats5. Mr.DomiqueRomance/Poudred’Or BTFisher+BoatOwner6. Mr. La Douceur / Pointe D’Esny BT + HL Fisher + Boats Owner7. Mr. George Fannard / Poste Lafayette BT Fisher + Boat Owner8. Mr. France Basi / Poste de Flacq Poste de Flacq9. Mr. Thomas Baya / Mare La Chaux Fishmonger / Retailer10. Mr.JClaudeVictor/MareLaChaux Fishmonger11. Mr. Sok Appadu / Baie du Cap Fisheries Enumerator12. Mr. Mohabeer / Petit Sable Fisheries Enumerator13. Mr.PBatiste/PosteLaFayette Fishmonger14. Mr. Ramkisson / Le Bouchon Fisheries Enumerator15. Mr.FreddyMootin/CapMalheureux NetFisher16. Mr. Clency Christophe / Grand Gaube BT Fisher17. Mr.Pyaré/RivièreduRempart Fishmonger/Wholesaler&Retailer18. Mr. Flério Marie / Grand Gaube Net Fisher 19. JeanPierre/GrandGaube Fishmonger/Wholesaler&Retailer20. Mr. Gyandeo Panchoo / Cap Malheureux Net Fisher + Fishmonger21. Mr. RambarrunAnand / Poudre d’Or BT / HL Fisher22. Mr.BachunAnirood/Pereybère BT/HLFisher23. Mr.GuneeGovinden/CapMalheureux BT/HLFisher24. Mr. Begué Eddy / Cap Malheureux BT / HL Fisher25. Mr.ArmoogunGoindasamy/Mahebourg BT/HLFisher+Boatowner26 Mr. Armoogum Shivram / Mahebourg BT / HL Fisher + Boat Owner27. Mr. Baichun Vidyanand / GRSE BT / HL Fisher28. Mr.FrancoeurJacque/PostedeFlacq LNFisher29. Mr. Thome M Louis / Poste de Flacq L N Fisher30. Mr.RamdeenJahising/GrandBay HLFisher+Fishmonger31. Mr.ChummunAnil/GrandBay HLFisher32. Mr.AdelineJSylvain/T.D.Douce HL/BTFisher33. JRDardenne/T.D.Douce BT/HL+BoatOwner34. Mr.PMarieLouise/P.A.Sables BT/HLFisher35. MrJahanGaneshan/P.A.Sables HLFisher36. Mr.ThomsonJLouis/RocheBois HLFisher37. MrLindsayJL/RocheBois HLFisher38. Mr.EnfléJPierre/Tamarin BT/HLFisher39. Mr.YMamodally/Triolet RoadsidefishVendor40. Mr. Gungabisson Rajkumar / Mahebourg Fishmonger / Retailer41. Mr. Noorani Basarti / New Groves Fishmonger / Retailer42. Mr. Keetaruth / Quatre Bornes Fishmonger / Retailer43. Mr.RamkissonMahendranath/PetitSable AmbulantFishVendor44. Mr. Mungur Naidoo / Centre de Flacq Institutional Fish Market45. Mr.JhurryKirran/QuatreBornes InstitutionalFishMarket46. Mr. Soiobratty Zahoor / Q Bornes Institutional Fish Market47. Mt.CurpenJanaden/Rose-Hill InstituttionalFishMarket48. Mr. Hossenee Arshad / Rose-Hill Institutional Fish Market49. Mr.JanashalFazal/Rose-Hill Fishmonger50. MrsFrancoise/SuperUofGrandbay Saleswoman/Fishstall

82 SmartFish Programme Report SF/2012/8
Appendix 10
Appendix 10: References• Annual Report 2008, 2009, 2010, Fisheries Division, Mauritius.• Study on Fish Handling, Preservation and Marketing in Mauritius & Rodrigues, Appavoo & Associates, 2007.• FishHandling,ProcessingandMarketinginMauritius,FAOProject,2005.• A handbook for Value Chain Research prepared for IDRC by Raphael Kapkinsky et al., 2000.• Enquêtesocio-économiquesurlapêcheartisanaledeMaurice,ProjectThonierRégionalII,COI/UE,1995.• Value Chain Analysis, M E Porter, Oxford Press Ltd. London, UK, 1980.
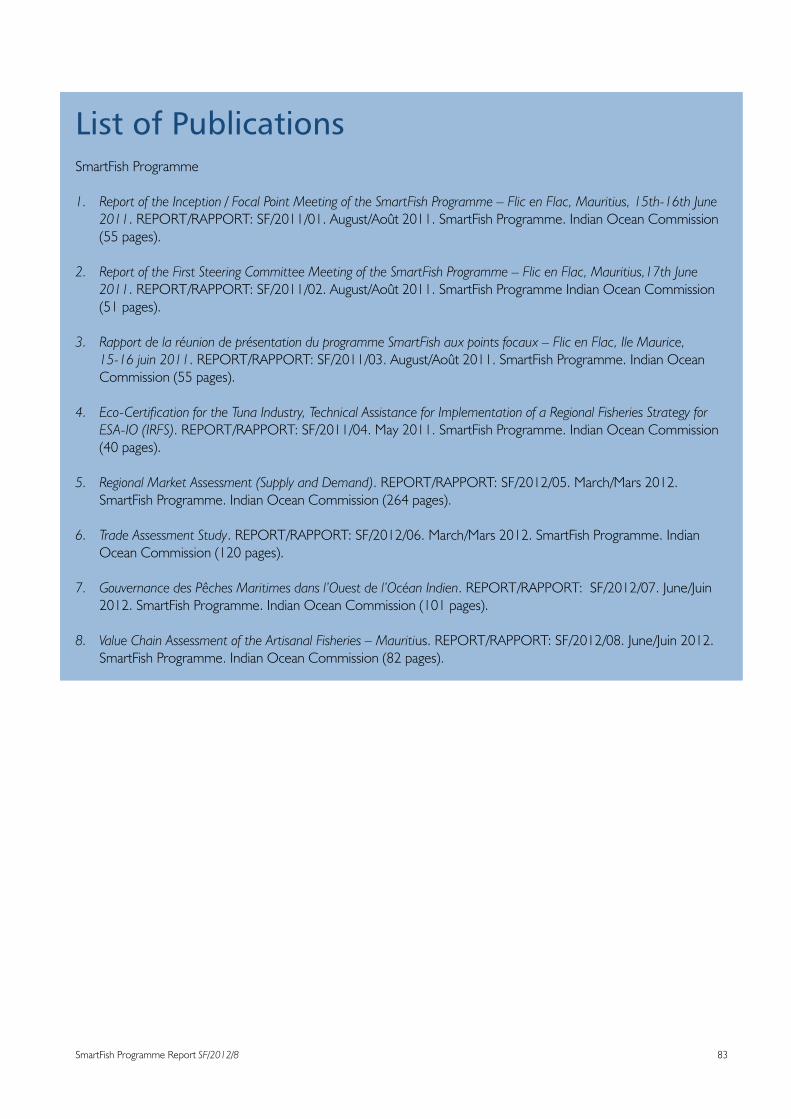
SmartFish Programme Report SF/2012/8 83
List of Publications SmartFish Programme
1. Report of the Inception / Focal Point Meeting of the SmartFish Programme – Flic en Flac, Mauritius, 15th-16th June 2011.REPORT/RAPPORT:SF/2011/01.August/Août2011.SmartFishProgramme.IndianOceanCommission(55pages).
2. Report of the First Steering Committee Meeting of the SmartFish Programme – Flic en Flac, Mauritius,17th June 2011.REPORT/RAPPORT:SF/2011/02.August/Août2011.SmartFishProgrammeIndianOceanCommission(51pages).
3. Rapport de la réunion de présentation du programme SmartFish aux points focaux – Flic en Flac, Ile Maurice, 15-16 juin 2011.REPORT/RAPPORT:SF/2011/03.August/Août2011.SmartFishProgramme.IndianOceanCommission(55pages).
4. Eco-Certification for the Tuna Industry, Technical Assistance for Implementation of a Regional Fisheries Strategy for ESA-IO (IRFS).REPORT/RAPPORT:SF/2011/04.May2011.SmartFishProgramme.IndianOceanCommission(40 pages).
5. Regional Market Assessment (Supply and Demand).REPORT/RAPPORT:SF/2012/05.March/Mars2012.SmartFish Programme. Indian Ocean Commission (264 pages).
6. Trade Assessment Study.REPORT/RAPPORT:SF/2012/06.March/Mars2012.SmartFishProgramme.IndianOcean Commission (120 pages).
7. Gouvernance des Pêches Maritimes dans l’Ouest de l’Océan Indien.REPORT/RAPPORT:SF/2012/07.June/Juin2012. SmartFish Programme. Indian Ocean Commission (101 pages).
8. Value Chain Assessment of the Artisanal Fisheries – Mauritius.REPORT/RAPPORT:SF/2012/08.June/Juin2012.SmartFish Programme. Indian Ocean Commission (82 pages).

Indian Ocean Commission – SmartFish ProgramBlue Tower, 5th �oor, Institute Road - Ebène, MauritiusTél: (+230) 402 6100 Fax: (+230) 465 7933


