
Varactor Loaded Transmission Linesfor Linear Applications
Amit S. NagraECE Dept.
University of California Santa Barbara

Acknowledgements
Ph.D. Committee
Professor Robert York
Professor Nadir Dagli
Professor Umesh Mishra
ECE Dept. UCSB
Dr. Michael VanBlaricum
Toyon Research Corporation
Goleta, CA
Varactor loaded lines
Professor Rodwell
ECE Dept. UCSB
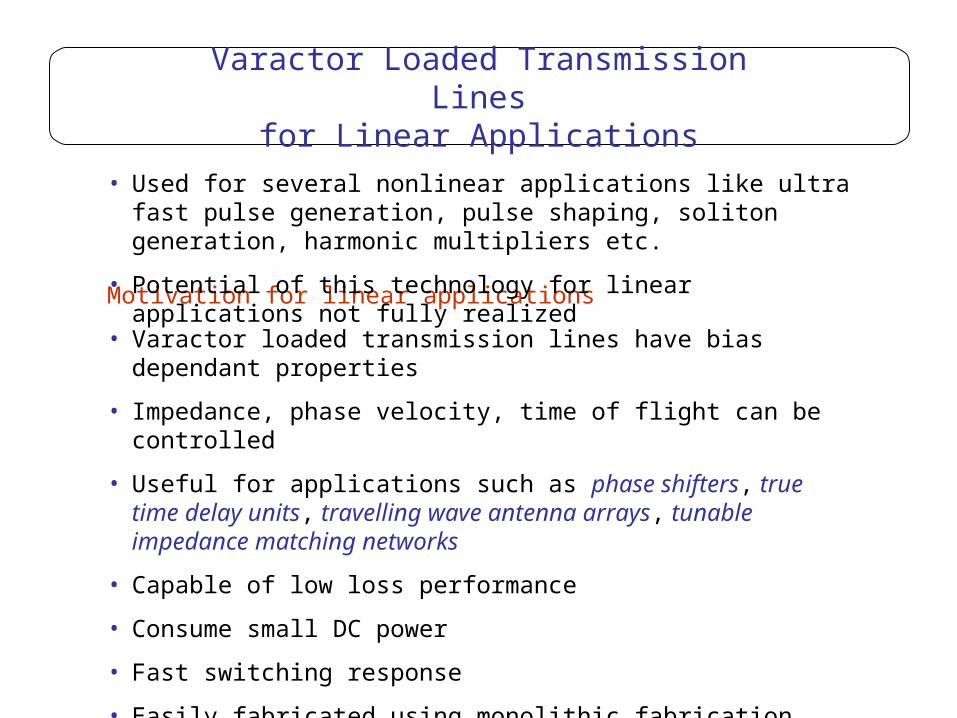
Varactor Loaded Transmission Linesfor Linear Applications
Motivation for linear applications
• Varactor loaded transmission lines have bias dependant properties
• Impedance, phase velocity, time of flight can be controlled
• Useful for applications such as phase shifters, true time delay units, travelling wave antenna arrays, tunable impedance matching networks
• Capable of low loss performance
• Consume small DC power
• Fast switching response
• Easily fabricated using monolithic fabrication techniques
• Compatible with existing GaAs MMIC technology
• Used for several nonlinear applications like ultra fast pulse generation, pulse shaping, soliton generation, harmonic multipliers etc.
• Potential of this technology for linear applications not fully realized

Equivalent Circuit for Varactor Loaded Transmission Lines
Schematic for varactor loaded transmission line
Equivalent circuit for varactor loaded transmission line
C t C v a r ( V )L t C t C v a r ( V )L t C t C v a r ( V )L t
Z i , v i
C v a r
2 n. . . . .1
C v a r C v a r
Z i , v i Z i , v i
L s e c t
Ll
vZ C
l
Z vtsect
ii t
sect
i i
Transmission line represented by equivalent inductance and capacitance per section

Basic Principle of Synthetic Transmission lines
Z L ( V ) , v p h a s e ( V )
L to t = n L s e c t
Behaves like synthetic transmission line for frequencies << Bragg Frequency
Properties of the synthetic transmission line
Periodic structure-exhibits Bragg reflection phenomenon
fL C C
Bragg
t t var
1
b g
ZL
C C V lLl
l var sect
( )b g
vL C C V l
phase
l l var sect
1
( ) /b g
Bias dependant impedance
Bias dependant phase velocity

Varactor Loaded Transmission Lines as Low Loss Analog Phase Shifters
Focus of our effort
• Optimize design of analog phase shifters for lowest possible insertion loss
• Increase frequency of operation by adopting monolithic fabrication techniques
• Demonstrate optimized phase shifters operating at K-band
Current state of the art
• Demonstration of hybrid prototypes of analog phase shifters
• Relatively low frequency of operation (< 5 GHz)
• No efforts to optimize the insertion loss performance

Design Equations for Varactor Loaded Transmission Line Phase Shifters
xC l
Cvarmax
sect
l
/
Z xi 50 1
fL C C
v
l xBraggmin
t t varmax
i
sect
1
1 c h
lv
f xsecti
Braggmin
1
• Key design variable- loading factor
• Impose constraint that impedance of the synthetic line be 50
• Pick a minimum Bragg frequency
• Determine spacing between loading capacitors from the minimum Bragg frequency
Cf
x
xvarmax
Braggmin
1
50 1a f• Determine value of the variable capacitors

Design Equations for Varactor Loaded Transmission Line Phase Shifters
2 1 1fl
vx xysect
i
c h
nsect 2
y C Cvarmin
varmax /
• Express phase shift per section at frequency (f) of interest in terms of the loading factor (x) and capacitance ratio (y)
• Determine number of sections required for 360º of phase shift
• All the design parameters - Zi, Lsect, Cvar, nsect - have been specified in terms of the loading factor, minimum Bragg frequency and tuning ratio
• Minimum Bragg frequency must be higher than frequency of interest
• Tuning ratio determined by the variable capacitor technology
• Loading factor only degree freedom available for optimizing loss
• Optimum loading factor for lowest loss depends on varactor and transmission line technology

Choice of Transmission Line and Variable Capacitor technology
CPWGround
CPWGround
CPW CenterConductor
Shunt VaractorDiodes
RF
inp
ut
RF
out
put
• CPW lines best for low parasitic connections of shunt components
• Two variable capacitors connected in parallel to preserve symmetry
• Ground to ground spacing limited to half of length of the section
• Lines fabricated on semi-insulating GaAs (s=13)
Varactor technology
• Schottky diodes on GaAs
• 2 m design rules for Schottky contact width and spacing from N-ohmics
• fc= 700 GHz, capacitance ratio (y) = 2.4

Components of Insertion Loss
L f C r Zf
fC Zvar var s L
svar L
1
22
22
b g
L l ZZ
Zcpw sect ii
L
bg
Varactor loss per section
• Due to series resistance of the diode
• Inversely proportional to cutoff frequency
• Increases as square of frequency
CPW loss per section
• Due to resistance of conductors
• Loss of loaded line is higher than corresponding line loss without loading
• Strong function of line impedance (Zi)
• Depends on substrate dielectric constant, aspect ratio of lines, total line width, metal thickness and resistivity
• Increases as square root of frequency
Zibg Attenuation per unit length for unloaded line of impedance Zi

Optimization of Insertion Loss
Effect of loading factor on loss per section
• Diode loss per section increases slowly with increase in loading factor beyond x=1
• CPW loss per section increases rapidly with increase in loading factor because higher loading factors require higher line impedance Zi
0
20
40
60
80
100
0
0.05
0.1
0.15
0.2
0.25
0 0.5 1 1.5 2 2.5 3 3.5 4
Nu
mb
er o
f S
ecti
on
s
Lo
ss p
er s
ecti
on
(d
B)
Loading Factor (x)
Number of sections
CPW loss
Diode loss
61 71 79 87 94 100 10650 112
Unloaded Line Impedance (Ohms)

Optimization of Insertion Loss
Total circuit loss
L n L L nf
fC Z n l Z
Z
Ztot sect var cpw sects
var L sect sect ii
L
c h bg 2
Effect of loading factor on total circuit loss
1
2
3
4
5
6
7
0 0.5 1 1.5 2 2.5 3 3.5 4
Tota
l In
sert
ion
Lo
ss (
dB
)
Loading Factor (x)
Total Circuit Loss
Total Diode Loss
Total CPW Loss
61 71 79 87 94 100 10650 112
Unloaded Line Impedance (Ohms)

Optimum Loading for Minimum Circuit Loss
Effect of loading factor on total circuit loss
• Total circuit loss is the product of the loss per section and the number of sections
• Number of sections decreases with an increase in the loading factor (x)
• Total contribution of the diode loss decreases with increasing loading factor
• Total CPW loss goes through a minimum at x=1.2
• For x<1.2 number of sections increases very rapidly while for x>1.2 CPW loss per section increases strongly
• Total circuit loss also shows minimum at x=1.2
• Thus there is an optimal value of loading factor for minimum loss
• Optimal loading factor depends on technology

Monolithic Fabrication Process
N- N+
Semi-insulating GaAs
0.5 m0.9 m
Ohmic contact Ohmic contact
Process flow originally developed by Professor Rodwell’s research group for NLTL work
Starting epitaxial layer structure
Self aligned ohmic contacts

Monolithic Fabrication Process
H+ Isolation ImplantH+ IsolationImplant
H+ IsolationImplant
Proton implants for isolation
Schottky Contacts
Deposition of Schottky contacts

Monolithic Fabrication Process
CPW Signal CPW GroundCPW Ground
CPW and Interconnect metal OhmicOhmic
Schottky
Signal
Ground
Interconnect
SEM pictures showing details of fabricated circuit

Verification of Optimal Loading
4
4.5
5
5.5
6
6.5
7
0 0.5 1 1.5 2 2.5 3 3.5 4
Inse
rtio
n L
oss
(d
B)
Loading Factor (x)
Theory
Measured
• Phase shifters with different loading factors fabricated on same wafer
• All circuits produced 360º of differential phase shift at 20 GHz
• Insertion loss data measured at 20 GHz agrees well with predicted curve
• Optimum loading factor of 1.2 for lowest insertion loss

Measured Performance of Optimally Loaded Phase Shifter Circuit
• Maximum differential phase shift at 20 GHz ----- 360°
• Differential phase shift linear with frequency till ~ 15 GHz
• Phase shift becomes non linear in the vicinity of the Bragg frequency
0
100
200
300
400
500
0 5 10 15 20 25
Dif
fere
nti
al P
has
e (D
egre
es)
Frequency (GHz)
Bias= 0 V
Bias= -0.5 V
Bias= -1.6 V
Bias= -10 V

Measured Performance of Optimally Loaded Phase Shifter Circuit
• Maximum insertion loss at 20 GHz ----- 4.2 dB
• Lowest insertion loss reported for an analog phase shifter in the K-band
• Return loss lower than -12 dB over all bias states
-8
-7
-6
-5
-4
-3
-2
-1
0
0 5 10 15 20 25
Inse
rtio
n L
oss
(d
B)
Frequency (GHz)
Bias = 0 V
Bias = -10 V
-40
-35
-30
-25
-20
-15
-10
-5
0
0 5 10 15 20 25
Ret
urn
Lo
ss (
dB
)
Frequency (GHz)
Bias = 0 V
Bias = -10 V

Accurate Model for the Varactor Loaded Transmission Lines
Ct Cvar
Lt
Gvar
In
Vn Vn+1
In+1
Lumped element unit cell depicting node voltages and currents
• Synthetic transmission line model valid for frequencies well below Bragg frequency- does not predict nonlinear phase shift versus frequency
• More accurate model obtained by solving the propagation constant for the lumped element unit cell
• Takes into account the discrete nature of the loading

Lumped Element Model
I e In n1
V e Vn n1
V V j fL In n t n 1 2
I I G j f C C Vn n var t var n 1 12 b g
Cosh( )Cos( ) ( )( )
1 22
2fL C Ct t var
Sinh( )Sin( ) ( ) 22
fL Gt var
Cos( ) ( )( )
1 22
2fL C Ct t var
( )Cos( )
22 1 2
fL Gt var
Express node voltages and currents in terms of the complex propagation constant =+j for a unit cell
Express node voltages and currents in terms of the lumped elements
Equate the real and imaginary parts of the previous equations
Simplified propagation constant /unit cell for small attenuation

Comparison of Modeled and Measured Results
• At low frequencies, both the lumped element model and the synthetic line model are accurate
• Synthetic line model does not predict deviation from linear phase shift in the vicinity of the Bragg frequency
• Lumped element model successfully predicts rapid increase in phase shift and loss at frequencies approaching the Bragg frequency
0
100
200
300
400
500
0 5 10 15 20 25
Dif
fere
nti
al P
has
e S
hif
t (D
egre
es)
Frequency (GHz)
++++ Measured ____ Lumped element model....... Transmission line model
0
1
2
3
4
5
6
7
8
0 5 10 15 20 25
Inse
rtio
n L
oss
(d
B)
Frequency (GHz)
++++ Measured ____ Lumped element model....... Transmission line model

Analysis of Loss Components
• Measured data provides no insight into origin of circuit loss
• Lumped element model used to predict relative contributions of CPW conductor loss and diode diode loss to total circuit loss
• Model indicates that at 20 GHz about 3dB loss is due to the varactor diodes
• Further improvements must concentrate on reducing diode losses
0
1
2
3
4
5
6
7
0 5 10 15 20 25
Inse
rtio
n L
oss
(dB
)
Frequency (GHz)
Total Circuit Loss
CPW Skin Loss
Diode Loss

Modified Phase Shifter with Multiple Frequency Operation Capability
Motivation
• Phase shift and insertion loss scale with number of sections
• Phase shifter with appropriate number of sections is capable of 360º phase shift with less than 5 dB loss at any frequency in the 7-22 GHz range
• Existing design can be easily modified to take advantage of this property
2
4
6
8
10
12
14
16
0 5 10 15 20 25
Lo
ss (
dB
) p
er 3
60 d
egre
ees
of
Ph
ase
Sh
ift
Frequency (GHz)
____ Extrapolated from Measured Data....... Predicted by lumped element Model

Modified Phase Shifter with Multiple Frequency Operation Capability
• Length of section calculated at highest frequency of interest (22 GHz here)
• Number of sections calculated at lowest frequency of interest (16 GHz here)
• Bias state with lowest loss used as reference for differential phase shift
• 0-360º phase shift possible at any frequency in the 16-22 GHz range
• Full bias range used at 16 GHz while smaller bias range used at 22 GHz
-700
-600
-500
-400
-300
-200
-100
0
100
16 17 18 19 20 21 22
Dif
fere
nti
al P
has
e S
hif
t (D
egre
es)
Frequency (GHz)
Bias= -10 V
Bias= 0 V
Bias= -0.5 V
Bias= -2 V

Modified Phase Shifter with Multiple Frequency Operation Capability
• Maximum loss at 16 GHz is 4.2 dB at a bias of 0 V
• Maximum loss at 22 GHz is 5 dB at a bias of -0.5 V*** Note that 0 V bias state is not used at 22 GHz
• Return loss lower than -15 dB over entire frequency range over all bias states of interest
-50
-40
-30
-20
-10
0
16 17 18 19 20 21 22
Ret
urn
Lo
ss (
dB
)
Frequency (GHz)
Bias= -10 V
Bias= 0 V
-8
-7
-6
-5
-4
-3
-2
16 17 18 19 20 21 22
Inse
rtio
n L
oss
(d
B)
Frequency (GHz)
Bias= -10 V
Bias= 0 V
Bias= -0.5 V
Bias= -2 V

Conclusions
Varactor loaded transmission line phase shifter
• Developed design for varactor loaded line for phase shifting applications
• Optimized design for obtaining lowest possible insertion loss for given device and transmission line technology
• Demonstrated K-band analog phase shifter with lowest reported insertion loss


