African Journal of Biotechnology Vol. 9 (27), pp. 4452-4464, 5 July, 2010 Available online at http://www.academicjournals.org/AJB ISSN 1684–5315 © 2010 Academic Journals Full Length Research Paper
Variety identification and genetic relationships of mungbean and blackgram in Thailand based on
morphological characters and ISSR analysis
Piyada Tantasawat*, Juthamas Trongchuen, Thongchai Prajongjai, Thanawit Thongpae, Chutamas Petkhum, Worapa Seehalak and Thitiporn Machikowa
School of Crop Production Technology, Institute of Agricultural Technology, Suranaree University of Technology, 111
University Avenue, Muang District, Nakhon Ratchasima, 30000, Thailand.
Accepted 15 June, 2010
Genetic diversity and relatedness were measured in 17 mungbean (Vigna radiata (L.) Wilczek) and 5 blackgram (Vigna mungo (L.) Hepper) genotypes by means of inter-simple sequence repeat (ISSR) analysis and morphological characters. Unweighted pair-group method arithmetic average (UPGMA) analysis of 19 morpho-agronomic characters showed clear separation of the genotypes into 3 major groups; cluster I containing 15 Thai cultivated mungbean varieties and breeding lines, cluster III containing 4 Thai cultivated blackgram varieties, and cluster II containing a mungbean wild relative (subspecies sublobata), a blackgram wild relative (subspecies silvestris) together with an Indian mungbean landrace. Pair wise coefficients of genetic similarity between all genotypes ranged from 0.17 to 0.84 with an average of 0.52. In total, 341 ISSR fragments were amplified for the two Vigna species by ISSR analysis using 18 ISSR primers. The polymorphism revealed with the ISSR primers was 90.6%. The number of amplified fragments varied from 9 to 32, with a size range of 200 - 1500 bp. The average numbers of fragments per primer and polymorphic fragments per primer were 18.94 and 17.17, respectively. Polymorphism information content (PIC) values ranged from 0.23 to 0.37 with an average of 0.31 across all the genotypes. Pair wise coefficients of ISSR-based genetic similarity between all genotypes ranged from 0.70 to 0.99 with an average of 0.86, suggesting quite narrow genetic base of mungbean and blackgram in Thailand that might limit continued breeding success. UPGMA analysis based on ISSR exhibited 2 major clusters; cluster I containing all mungbean genotypes and cluster II containing all blackgram genotypes. It appeared that ISSR was more effective for classification at the species level although no clear separation at the subspecies level was found. All 22 mungbean and blackgram genotypes can be effectively distinguished by only 6 ISSR primers with the highest PIC values, suggesting the applicability of ISSR analysis for variety identification. Key words: Genetic diversity, inter-simple sequence repeat, marker, Vigna mungo, Vigna radiata.
INTRODUCTION Mungbean (Vigna radiata (L.) Wilczek) and blackgram (Vigna mungo (L.) Hepper) are important legume crops, widely cultivated in the tropics and subtropics for human consumption, animal feed as well as cover crop, particularly *Corresponding author. E-mail: [email protected]. Tel: 6644223378. Fax: 6644224281.
as supplemented crops in the cereal-based cropping system. However, in Thailand, there has been reduction in mungbean and blackgram production largely due to high cost of production and low yield. The major constraints for achieving higher yield are inherently low yielding potential of the varieties from lack of genetic variability, absence of suitable ideotypes for different cropping systems, poor harvest index and susceptibility to abiotic stresses (that is, drought, calcareous or saline soil)

or biotic stresses (diseases and insects) (Sarobol, 1997; Souframanien and Gopalakrishna, 2004; Srinives, 2006). In addition, current blackgram production is also faced with limited photo-insensitive varieties and low seed quality. Therefore, new varieties with higher yield, more adaptive to environmental constraints, more resistant to disease and insect pests, higher seed quality, larger seed size, and require lower production cost (that is, synchronous maturity) are urgently needed. An assessment of the genetic diversity is an important first step to achieve this goal.
In Thailand, certified mungbean varieties included Kampaeng Saen 1 (KPS 1), KPS 2, Uthong 1 (UT 1), Chainat 36 (CN 36), CN 60, CN 72, Prince of Songkhla University 1 (PSU 1) and Suranaree University of Technology 1 (SUT 1). And certified blackgram varieties included UT 2 and Phitsanulok 2 (PL 2). Generally, the production of mungbean is thrice that of blackgram. KPS 1 and KPS 2 are the most popular mungbean varieties accounting for 70% of total cultivated areas, while PL 2 is the most popular blackgram variety (Srinives et al., 2003). Several strategies have been used for mungbean breeding in Thailand such as survey, collection and conservation of wild relatives and landraces, plant introduction, variety selection and eva-luation, hybridization and mutation breeding. Recently, molecular tools have also been applied for mungbean and blackgram breeding programs, for instance, the use of isozymes and DNA markers for variety identification, assessment of genetic diversity and relatedness among Vigna species subgenus Ceratotropis and mapping of disease resistance genes (Boonpradub and Chatasiri, 1997; Ngampongsai et al., 2000; Prammanee et al., 2000; Chaitieng et al., 2002; Seehalak et al., 2006).
Knowledge of genetic diversity of the genetic resources is crucial for breeders to better understand the evolutionary and genetic relationships among accessions, to select germplasm in a more systemic and effective fashion, and to develop strategies to incorporate useful diversity in their breeding programs (Paterson et al., 1991; Li and Nelson, 2001). These genetic diversity measures can be used to maximize the level of variation present in segregating populations by crossing genotypes with greater genetic distance. Evaluation of morphological traits, pedigrees, geographic origins, isozymes and DNA markers have been used for the assessments of Vigna spp. genetic diversity (Fatokun et al., 1993; Kaga et al., 1996; Ehlers and Hall, 1997; Tosti and Negri, 2002; Bisht et al., 2005). Morphological characters are limited in number and are often subjected to constraints from environmental interactions, epistatic interactions and the largely unknown genetic control of the traits (Smith and Smith, 1989). However, the knowledge of these characters particularly the agronomic traits are essential for parental selection. Seed color is the primary morpho-logical characteristic used to discriminate between mung-
Tantasawat et al. 4153 bean and blackgram. However, differences between the two species have also been observed for leaf, stem and pod pubescence, seed shape, pod shape and length, stipule morphology, keel color, number of seeds per pod and number of flowers per raceme (Plant germplasm database, 2004). Isozymes are also faced with similar constraints of limited number of available markers as well as the specificity of tissues and developmental stages expressing the phenotypes. The documentation of pedigrees and origins of accession collections may also be incomplete or contain errors (Keim et al., 1992; Chawla, 2002; Wang et al., 2006).
Genetic markers such as restriction fragment length polymorphisms (RFLPs), random amplified polymorphic DNAs (RAPDs), amplified fragment length polymer-phisms (AFLPs), microsatellites or simple sequence repeats (SSRs) and inter-SSR (ISSR) portray genetic variation at the DNA level thereby overcoming the influence of environments, independent of tissue effects, and providing more precise characterization of genotypes and measurement of genetic relationships than other markers (Autrique et al., 1996; Ajibade et al., 2000; Souframanien and Gopalakrishna, 2004). In addition, they also allow variety identification in the early stages of development (Chawla, 2002; Tar’an et al., 2005). In Vigna spp. including mungbean and cowpea, RAPD, AFLP, SSR and ISSR have been applied to assess molecular polymorphism (Kaga et al., 1996; Mignouna et al., 1998; Santalla et al., 1998; Ajibade et al., 2000; Lakhanpaul et al., 2000). SSRs consist of randomly repeated units of short nucleotide motifs with 1 - 6 bp long. Although SSRs are highly polymorphic, the labor intensive and high cost associated with SSR cloning and their single-locus nature still limit their uses for genetic diversity study in several plant species. In Vigna spp. SSRs have been cloned from Vigna unguiculata and Vigna angularis (Li et al., 2001; Wang et al., 2004). No report has been found for SSR cloning in blackgram and only a few SSRs have been cloned in mungbean, therefore, the development and usage of SSR markers in these species are rather limited (Li et al., 2001; Miyagi et al., 2004; Chaitieng et al, 2006). Due to the limitation of SSRs, a new method called inter-simple sequence repeat (ISSR) analysis was developed based on DNA amplification with a single 15 to 20-bp primer homologous to a microsatellite repeat and has a short (1 - 4 bp) random degenerated sequence (an anchor) at the 3’ or 5’ end. These ISSR primers allow DNA amplification of regions located between two closely spaced, oppositely oriented SSRs, yielding a reproducible pattern of genomic fragments, which is similar to a RAPD pattern but usually includes more bands and is more reproducible. Therefore, ISSRs have a high capacity to reveal polymorphism and offer great potential to determine genetic diversity at inter and intra-specific levels as compared to other arbitrary primers including

4154 Afr. J. Biotechnol. RAPDs, particularly in many cultivated species exhibiting relatively low genetic diversity (Zietjiewicz et al., 1994; Ajibade et al., 2000; Pradeep Reddy et al., 2002; Souframanien and Gopalakrishna, 2004).
Previous reports showed that ISSRs were useful for the intra-specific or inter-specific classification of genetic diversity and identification of varieties in various crops including tomato, potato, rice, grapevine and soybean (Moreno et al., 1998; Wang et al., 1998; Blair et al., 1999; Prevost and Wilkinson, 1999; Kochieva et al., 2002). In blackgram, Souframanien and Gopalakrishna (2004) identified a set of ISSR primers with high polymorphism information content (PIC) scores which would be useful in surveying genetic diversity among accessions of blackgram and perhaps other Vigna spp. The knowledge of genetic diversity among genotypes of mungbean and blackgram in Thailand could be useful for parental selection in crosses to generate populations with maxi-mum variation of desirable traits for the breeding purpose.
The objectives of this study were (i) to measure genetic diversity of Thai mungbean varieties and breeding lines, mungbean wild relative and landrace, blackgram varieties under cultivation in Thailand and blackgram wild relative using ISSR analysis and morphological characters, (ii) to study the genetic relationships among these genotypes and (iii) to generate molecular fingerprints of varieties used commercially in Thailand for variety identification. MATERIALS AND METHODS Plant materials A total of 17 mungbean (V. radiata) genotypes (12 varieties, 3 breeding lines, 1 landrace from India and 1 wild relative [V. radiata var. sublobata]) and 5 blackgram genotypes (4 varieties and 1 wild relative [V. mungo var. silvestris]) were evaluated in this present study (Table 1). V. radiata var. sublobata and V. mungo var. silvestris were considered to be the progenitor of cultivated mungbean and blackgram, respectively (Chandel et al., 1984). Mungbean varieties included CN 36, CN 60, CN 72, KPS 1, KPS 2, PSU 1, SUT 1, SUT 2, SUT 3, SUT 4, SUT 5 and UT 1, eight of which are certified varieties that are commercially used in Thailand currently. The three elite breeding lines from mutation breeding, M 4-2, M 5-1 and M 5-5, have high yield potential and are moderately resistant to cercospora leaf spot (Ngampongsai et al., 2004). Moreover, M 4-2 and M 5-1 were shown to be tolerant to calcareous soil (Phoomthaisong et al., 2004). The mungbean landrace from India (V 2709), mungbean wild relative from Madagascar (TC 1966), and blackgram wild relative from India (TC 2211) are good genetic sources for bruchid resistance (Kaga et al., 1996). Resistance/tolerance to yellow mosaic virus and drought were also observed in the two wild relatives (Bisht et al., 2005). Moreover, TC 1966 is also resistant to other insect pests including beanfly and common cutworm (Na Pattalung and Poonsavasde, 1995). Representatives of commercial blackgram varieties were KAB 4, PL 2, Prajeen and UT 2. Morphological characterization Twenty-two mungbean and blackgram genotypes were planted in a
randomized complete block design with four replications during January to May, 2006 at Suranaree University of Technology Farm, Nakhon Ratchasima, Thailand. Each plot consisted of two 2 m-long rows with 0.5 m between rows and 0.2 m between plants within rows. Nineteen morphological and agronomic characters (Table 2) were recorded from 10 plants in the middle of each plot. Of these characters twelve were numerical; plant height, yield per plant, number of flowers per raceme, number of pods per peduncle, number of seeds per pod, 100-seed weight, days to first flowering, flowering period, terminal leaflet length, terminal leaflet width, petiole length and pod length. The remaining seven characters were categorical; leaf pubescence, petiole pubescence, stem pubescence, seed color, seed luster, calyx color and hypocotyl color. Analysis of variance (ANOVA) was performed on numerical characters by SAS (SAS Institute, 1996). DNA isolation Young leaves were freshly harvested from ten individual plants of each genotype and rapidly frozen in liquid N2. The leaves were all combined into one sample to provide a uniform source of bulked genomic DNA representing its genotype. DNA extraction was performed by the cetyl trimethyl ammonium bromide (CTAB) method as described by Saghai Maroof et al. (1984). DNA was quantified by spectrophotometry and comparing the intensity of ethidium bromide-stained DNA bands on 0.8% agarose gel with those of known concentration of uncut �DNA to adjust final concentration to 50 ng µL-1 for use in PCR analysis. Inter-simple sequence repeat (ISSR) analysis Eighteen (18) ISSR primers homologous to microsatellite repeats and containing additional selective anchor nucleotides that were developed from the University of British Columbia were chosen for the analysis (Table 3). These primers are homologous to microsatellite repeats (AC, AG, GA, TC or TG) anchored at either 3’ or 5’ end by 1 - 3 nucleotides, most of which have been used successfully to reveal polymorphism in blackgram, and to determine genetic relationships in the genus Vigna (Ajibade et al., 2000; Souframanien and Gopalakrishna, 2004). Six of these contained AG repeat motif, five contained AC repeat motif, five contained GA repeat motif, and one each contained TG or TC repeat motif. Sixteen of these possessed a one to two nucleotide anchor sequence at 3’ end and two were anchored at the 5’ end with 3 nucleotides. Each 20 �l PCR reaction contained 50 ng of genomic DNA template, 1X buffer (75 mM Tris.HCl (pH 9.0), 50 mM KCl, 20 mM (NH4)2SO4), 3.5 mM MgCl2, 250 �M of each dNTPs, 1 unit of biotools DNA polymerase (Biotools B and M Labs, SA), and 0.4 �M of each ISSR primer. The PCR reactions were subjected to amplification with initial denaturation at 94°C for 1 min; 35 cycles of denaturing at 94°C for 1 min, annealing at 50°C for 1 min, extension at 72°C for 4 min; and final extension at 72°C for 10 min in a ThermoHybaid Px2 thermocycler (Thermo Fisher Scientific, Inc., MA). The amplified products were revealed on 6% denaturing polyacrylamide gel and detected by silver nitrate according to Sambrook and Russell (2001). Molecular weights of the bands were estimated by using 1 kb plus DNA ladder (Gibco-BRL, Gaithersburg, MD) as standards. Data scoring, cluster and principal coordinate analysis Numerical characters were classified into five different classes. Different combinations of 0 and 1 were coded for each class of all
Tantasawat et al. 4155
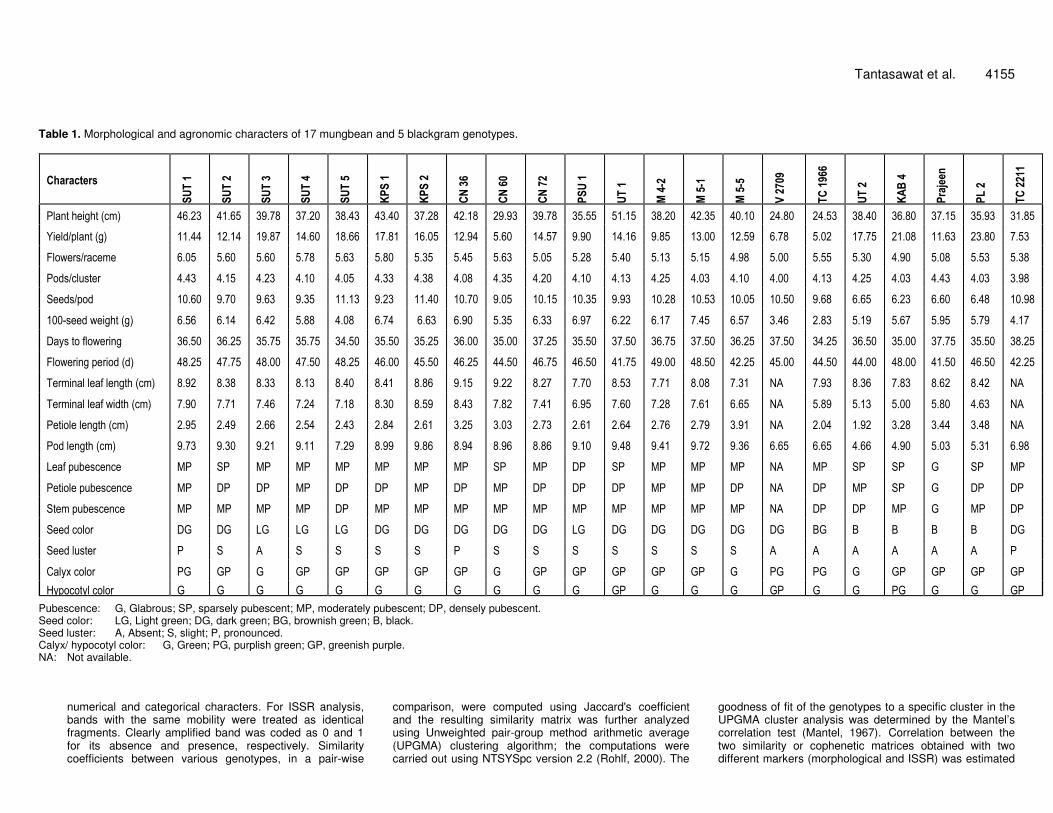
Table 1. Morphological and agronomic characters of 17 mungbean and 5 blackgram genotypes.
����������
��
�
��
�
��
�
��
�
��
��
��
�
��
��
��
��
��
��
�
�
��
��
��
��
�
��
��
��
���
��
��
�
��
�
��
��
���
����
�
�
��
��
������������� �� � � �� � � � � �� � � � ��� � � � � �� � � � � �� � � � � �� � � � � �� � � � � �� � � � ���� � � ��� � � � � �� � � � � �� � � � � �� � � � � �� � � � � �� � � � � �� � � � � �� � � � � �� � � � � �� � � � � �� � � � � ��� � � � �� � �
� ��� �� �������� � � �� � � � � �� � � � ��� � � � � �� � � � � �� � � � � �� � � � � �� � � � � ��� � � �� � � � � �� � � ���� � � � �� � � ��� � � � � �� � � � � �� �� � �� � � � �� � � � � �� � � � � �� � � � � �� � � � � �� � � � �� � �
� �� �!" �!��� �� � �� � � � �� � � � �� � � � �� � � � �� � � � �� � � � �� � � � �� � � � �� � � � �� � � � �� � � � �� � � � �� � � � �� � � � ��� � � �� � � � �� � � � �� � � � ��� � � �� � � � �� � � � �� � �
�� � " ���# " ��!� � �� � � � �� � � � �� � � � �� � � � �� � � � �� � � � �� � � � �� � � � �� � � � �� � � � �� � � � �� � � � �� � � � �� � � � �� � � � �� � � � �� � � � �� � � � �� � � � �� � � � �� � � � ��� �
$��� " �� � � � � � �� � � ��� � � ��� � � ��� � � � � �� � � ��� � � � � �� � � � � �� � � ��� � � � � �� � � � � �� � � ���� � � � �� � � � � �� � � � � �� � � � � �� � � ��� � � � �� � � � �� � � � �� � � � �� � � � � ��� �
� � � %" ��� � ������� � �� � � � �� � � � �� � � � �� � � � �� � � � �� � � � �� � � � ��� � � �� � � � �� � � � ��� � � �� � � � �� � � � �� � � � �� � � � �� � � � �� � � � �� �� � �� � � � ��� � � �� �� � �� � �
& �' " ��� �(�� �!�� � � �� � � � � �� � � � � �� � � � � �� � � � � �� � � � � �� � � � � �� � � � � �� � � � � �� � � � � �� � � � � �� � � � � �� � � � � �� � � � � �� � � � � �� � � � � �� � � � � �� � � � � �� � � � � �� � � � � �� � � � � �� � � � � �� � �
� �� �!��� �!� � ��� �� � � �� � � � � �� � � � � �� � � � � �� � � � � �� � � � � �� � � � � �� � � � � �� � � � � �� � � � � �� � � � � �� � � � � �� � � � ��� � � � � �� � � � � �� � � � � �� � � � � �� � � � � �� � � � � �� � � � � �� � � � � �� � � � � �� � �
) �! �������(��������� �� � ��� � � �� � � � �� � � � �� � � � �� � � � �� � � � �� � � ��� � � ��� � � � �� � � � �� � � � �� � � � �� � � � �� � � � �� � � * +� � ��� � � �� � � � �� � � � �� � � � �� � � * +�
) �! �������(� � ����� �� � ��� � � �� � � � �� � � � �� � � � �� � � � �� � � � �� �� � �� � � � �� � � � �� � � � ��� � � �� � � � �� � � � �� � � � �� � � * +� � �� �� � �� � � � �� � � � �� � � � �� � � * +�
���� ����������� �� � ��� � � �� �� � �� � � � �� � � � �� � � � �� � � � �� � � � �� � � � �� � � � �� � � � �� � � � �� � � � �� � � � �� �� � ��� � * +� � �� � � � ��� � � �� � � � �� � � � �� � � * +�
�� � ��������� �� ��� � � ��� � � ��� � � ��� � � � �� �� � ���� ��� � � � ��� � � ��� � � �� � � ��� � � ��� � � ��� � � ��� � � ��� � � � �� � � � �� � � � �� � � � ��� � � �� � � � �� � � � ��� �
, ��(�� # - �" ������ . �� $�� . �� . �� . �� . �� . �� . �� $�� . �� & �� $�� . �� . �� . �� * +� . �� $�� $�� /� $�� . ��
���� ���� # - �" ������ . �� & �� & �� . �� & �� & �� . �� & �� . �� & �� & �� & �� . �� . �� & �� * +� & �� . �� $�� /� & �� & ��
$�� �� # - �" ������ . �� . �� . �� . �� & �� . �� . �� . �� . �� . �� . �� . �� . �� . �� . �� * +� & �� & �� . �� /� . �� & ��
$��� ��� �� !� & /� & /� , /� , /� , /� & /� & /� & /� & /� & /� , /� & /� & /� & /� & /� & /� 0/� 0� 0� 0� 0� & /�
$��� ��# " ��!� �� $� +� $� $� $� $� �� $� $� $� $� $� $� $� +� +� +� +� +� +� ��
1 ��' 2 ��� �� !� �/� /�� /� /�� /�� /�� /�� /�� /� /�� /�� /�� /�� /�� /� �/� �/� /� /�� /�� /�� /��
3 ' � � �� �' ���� �� !� /� /� /� /� /� /� /� /� /� /� /� /�� /� /� /� /�� /� /� �/� /� /� /��
Pubescence: G, Glabrous; SP, sparsely pubescent; MP, moderately pubescent; DP, densely pubescent. Seed color: LG, Light green; DG, dark green; BG, brownish green; B, black. Seed luster: A, Absent; S, slight; P, pronounced. Calyx/ hypocotyl color: G, Green; PG, purplish green; GP, greenish purple. NA: Not available.
numerical and categorical characters. For ISSR analysis, bands with the same mobility were treated as identical fragments. Clearly amplified band was coded as 0 and 1 for its absence and presence, respectively. Similarity coefficients between various genotypes, in a pair-wise
comparison, were computed using Jaccard's coefficient and the resulting similarity matrix was further analyzed using Unweighted pair-group method arithmetic average (UPGMA) clustering algorithm; the computations were carried out using NTSYSpc version 2.2 (Rohlf, 2000). The
goodness of fit of the genotypes to a specific cluster in the UPGMA cluster analysis was determined by the Mantel’s correlation test (Mantel, 1967). Correlation between the two similarity or cophenetic matrices obtained with two different markers (morphological and ISSR) was estimated

4156 Afr. J. Biotechnol.
Table 2. Morphological and agronomic characters and their description used for morphological characterization.
Character Description Plant height (cm). From soil level to the highest point. Average of ten plants measured immediately after the first harvest. Yield per plant (g/plant). Total seed yield from two harvests, average from ten plants. Number of flowers per raceme. Average of ten plants. Number of pods per cluster. Average of ten plants. Number of seeds per pod. Average of ten plants. 100-seed weight (g). Average of ten plants. Days to flowering (d). Number of days from sowing to the first open flower. Flowering period (d). Number of days from the first open flower to the last open flower. Terminal leaf length (cm). Average of ten fully developed terminal leaves from ten plants. Terminal leaf width (cm). Average of ten fully developed terminal leaves from ten plants measured at point of maximum width. Petiole length (cm). Average of ten fully developed trifoliate leaves from ten plants. Pod length (cm). Average of ten fully developed pods from ten plants. Leaf pubescence. Glabrous (G), sparsely pubescent (SP), moderately pubescent (MP), densely pubescent (DP). Petiole pubescence. Glabrous (G), sparsely pubescent (SP), moderately pubescent (MP), densely pubescent (DP). Stem pubescence. Glabrous (G), sparsely pubescent (SP), moderately pubescent (MP), densely pubescent (DP). Seed color. Light green (LG), dark green (DG), brownish green (BG), black (B). Seed luster. Absent (A), slight (S), pronounced (P). Calyx color. Green (G), purplish green (PG), greenish purple (GP). Hypocotyl color. Green (G), purplish green (PG), greenish purple (GP).
Table 3. List of ISSR primers used and their nucleotide sequences, number of total DNA fragments, percentage of polymorphic fragments and polymorphism information content (PIC). ISSR primer Primer sequence 5’- 3’ Total fragments Polymorphic fragments (%) PIC
ISSR 808 AGA GAG AGA GAG AGA GC 28 89.25 0.3284 ISSR 809 AGA GAG AGA GAG AGA GG 20 85.00 0.2997 ISSR 810 GAG AGA GAG AGA GAG AT 28 92.86 0.2438 ISSR 811 GAG AGA GAG AGA GAG AC 21 100.00 0.2426 ISSR 825 ACA CAC ACA CAC ACA CT 16 93.75 0.2308 ISSR 826 ACA CAC ACA CAC ACA CC 10 90.00 0.3650 ISSR 834 AGA GAG AGA GAG AGA GYT 18 94.44 0.2812 ISSR 835 AGA GAG AGA GAG AGA GYC 16 68.75 0.2919 ISSR 836 AGA GAG AGA GAG AGA GYA 9 100.00 0.3668 ISSR 841 GAG AGA GAG AGA GAG AYC 25 96.00 0.3438 ISSR 842 GAG AGA GAG AGA GAG AYG 15 93.33 0.3707 ISSR 855 ACA CAC ACA CAC ACA CYT 19 94.74 0.3075 ISSR 856 ACA CAC ACA CAC ACA CYA 9 66.67 0.3557 ISSR 857 ACA CAC ACA CAC ACA CYG 19 94.74 0.3574 ISSR 858 TGT GTG TGT GTG TGT GRT 14 85.71 0.3044 ISSR 885 BHB GAG AGA GAG AGA GA 32 100.00 0.2828 ISSR 887 DVD TCT CTC TCT CTC TC 23 86.96 0.3389 Total 341 1611.15 5.6319 Average 18.94 89.51 0.3129
PIC, Polymorphic information content; Y, pyrimidines (C,T); R, purines (A,G); B, (C,G,T) (that is, not A); H, (A,C,T) (that is, not G); D, (A,G,T) (that is, not C); V, (A,C,G) (that is, not T).

Tantasawat et al. 4157
Table 4. Analysis of variance for quantitative characters of 17 mungbean and 5 blackgram genotypes.
Source
df Pla
nt h
eigh
t (c
m)
Yie
ld /
plan
t (g)
Flow
ers
/ ra
cem
e
Pod
s /
Clu
ster
See
ds /
pod
100-
seed
w
eigh
t (g)
Day
s to
flo
wer
ing
Flow
erin
g pe
riod
(d)
Term
inal
leaf
le
ngth
(cm
)
Term
inal
leaf
w
idth
(cm
)
Pet
iole
le
ngth
(cm
)
Pod
leng
th
(cm
)
Genotype 21 4.38** 7.79** 1.04 ns 0.75 ns 12.85** 4.67** 2.67** 4.33** 0.56 ns 4.35** 0.56 ns 107.64** Block 3 8.56** 35.29** 1.83 ns 5.63* 10.45** 6.51** 0.76 ns 1.95 ns 3.55* 6.05** 6.59** 4.81** Error 61 26.08 11.85 0.34 0.10 0.77 1.07 22.28 5.13 1.48 1.16 1.63 0.12 Means 37.85 13.49 5.39 4.17 9.51 5.79 36.18 45.84 8.33 7.03 2.82 8.07
*Significant at p < 0.05; ** significant at p < 0.01; ns, not significant (p > 0.05). by means of the Mantel matrix correspondence test (Mantel, 1967) The matrix correlation corresponds to two independently derived dendrograms and is a measure of the relatedness between the two matrices. A correlation value (r) greater than 0.5 is considered as statistically significant at 0.01 probability level if the number of observed taxonomic units exceeds 15 (Lapointe and Legendre, 1992).
The polymorphism information content, a measure of the allelic diversity at a locus, was determined. PIC = 1 - ΣPi2 where Pi is the frequency of the ith allele in the examined test lines. NTSYSpc version 2.2 (Rohlf, 2000) was also used to perform principal coordinate analysis (PCA) to show multiple dimensions of the distribution of the genotypes in a scatter-plot (Keim et al., 1992). This multivariate approach was used to complement the information obtained from cluster analysis because it is more informative regarding distances among major groups (Tar’an et al., 2005). RESULTS AND DISCUSSION Morphological characterization The mungbean and blackgram genotypes dis-played polymorphisms for many of the 19 morpho-agronomic traits (Table 1). The analysis of variances for 12 numerical characters are presented in Table
4. The genotypes showed statistically significant differences (p < 0.01) for eight of the twelve characters including plant height, yield per plant, number of seeds per pod, 100-seed weight, days to flowering, flowering period, terminal leaf width and pod length.
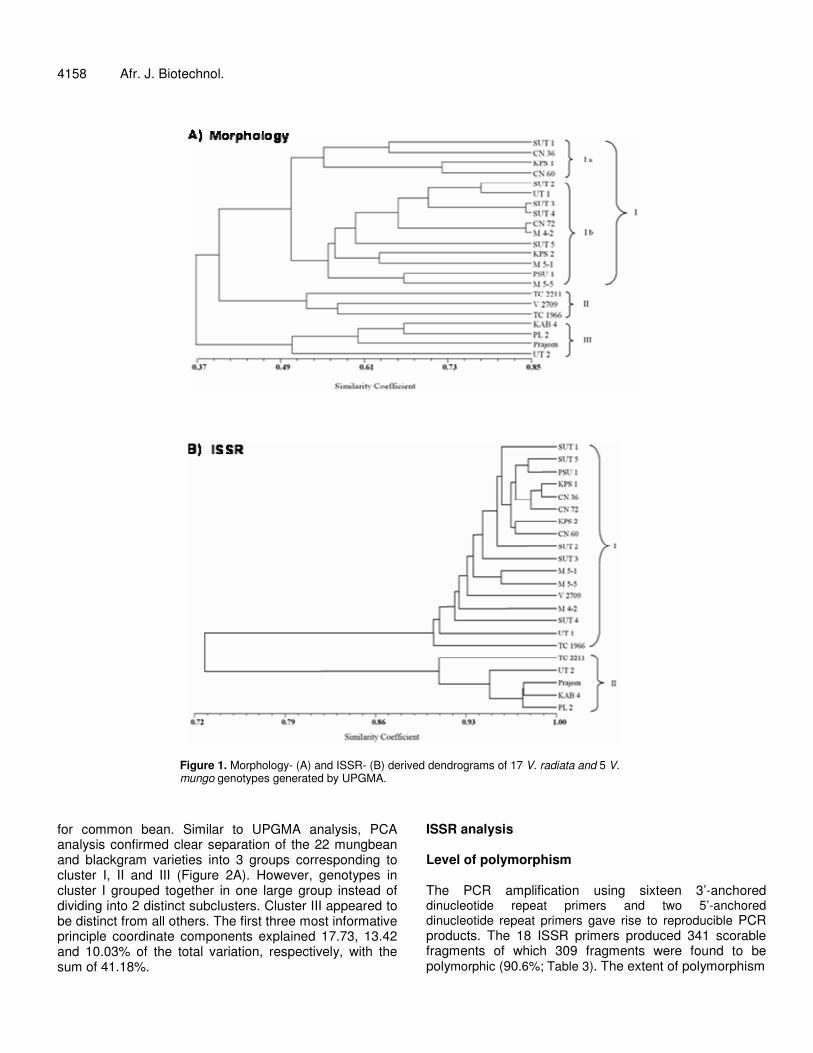
Estimates of genetic similarities based on morpho-agronomic characters for all pair wise combinations of the twenty two mungbean and blackgram genotypes ranged from 0.17 (KPS 1 vs. KAB 4 and CN 60 vs. Prajeen) to 0.84 (SUT 3 vs. SUT 4 and CN 72 vs. M 4-2) with an average of 0.52. Clustering of genotypes by morpho-agronomic traits largely reflected the differences in plant height, yield per plant, terminal leaf width, pod length, number of seeds per pod, 100-seed weight and seed color. The Mantel’s test with cophenetic correlation coefficient value of 0.33 (p > 0.05) indicated weak association for the genotypes to a specific cluster in the dendrogram. Three distinctive clusters were identified (Figure 1A). Cluster I contained all fifteen Thai cultivated mungbean varieties and breeding lines. This cluster was divided into 2 subclusters; subcluster Ia consisting of 4 varieties (SUT 1, CN 36, CN 60, and KPS 1) and subcluster Ib consisting of 8
varieties (CN 72, KPS 2, PSU 1, UT 1, SUT 2, SUT 3, SUT 4, and SUT 5) and 3 breeding lines (M 4-2, M 5-1, and M 5-5). One mungbean wild relative (var. sublobata; TC 1966), one Indian mungbean landrace (V 2709) and one blackgram wild relative (var. silvestris; TC 2211) were grouped together in cluster II, primarily from short plant height, low yield per plant and small seed size. Cluster III included four Thai blackgram varieties (KAB 4, PL 2, Prajeen, UT 2) which had distinctive black seeds, shorter pod length, lower number of seeds per pod and narrower terminal leaf width, compared to those of other clusters. These are unique characters of blackgram as has been reported previously (Plant germplasm database, 2004). Note that cluster II included both Vigna spp; the two V.radiata in this cluster had shorter pod length, shorter plant height, lower yield per plant and smaller seed size than most of the cultivated mungbean varieties in cluster I. Therefore, morphological characters were not effective in genetic differentiation at the species level in Vigna.
Similar findings that morphological characters were less effective than molecular markers at classification were reported by Johns et al.,(1997)
4158 Afr. J. Biotechnol.
Figure 1. Morphology- (A) and ISSR- (B) derived dendrograms of 17 V. radiata and 5 V. mungo genotypes generated by UPGMA.
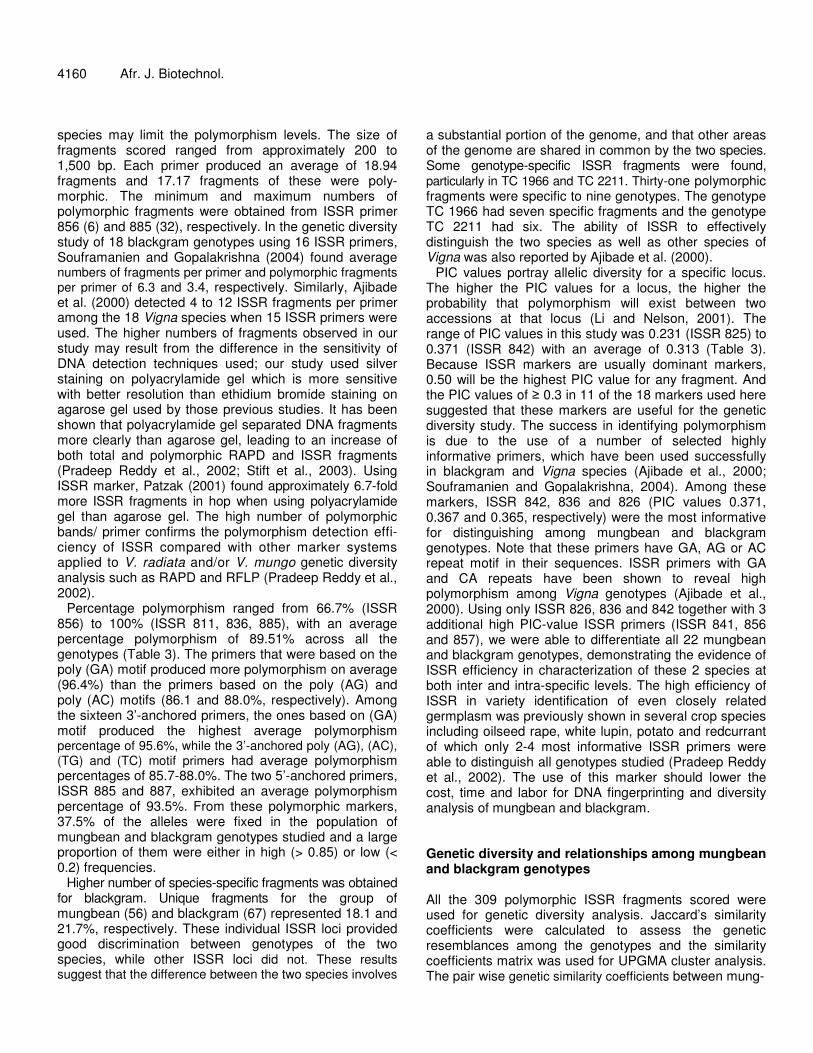
for common bean. Similar to UPGMA analysis, PCA analysis confirmed clear separation of the 22 mungbean and blackgram varieties into 3 groups corresponding to cluster I, II and III (Figure 2A). However, genotypes in cluster I grouped together in one large group instead of dividing into 2 distinct subclusters.�Cluster III appeared to be distinct from all others. The first three most informative principle coordinate components explained 17.73, 13.42 and 10.03% of the total variation, respectively, with the sum of 41.18%.
ISSR analysis Level of polymorphism The PCR amplification using sixteen 3’-anchored dinucleotide repeat primers and two 5’-anchored dinucleotide repeat primers gave rise to reproducible PCR products. The 18 ISSR primers produced 341 scorable fragments of which 309 fragments were found to be polymorphic (90.6%; Table 3). The extent of polymorphism

Tantasawat et al. 4159
Figure 2. Morphology- (A) and ISSR- (B) derived three-dimensional plot based on the first three principal coordinates from a principal coordinate analysis of 17 V. radiata and 5 V. mungo genotypes.
found was very high and was comparable to that found in 18 species of the genus Vigna (96.8%), but higher than that previously found in blackgram varieties from India (54.5%; Ajibade et al., 2000; Souframanien and Gopalakrishna, 2004). It was found that the polymorphism percentage is mainly affected by the sequences of
primers or probes of markers, and types and number of lines being evaluated (Keim et al., 1992). In this study, genotypes were selected to represent two Vigna species, V. radiata and V. mungo, and included not only cultivated varieties but also wild relatives (var. sublobata and silvestris). However, the self-pollinated nature of these two
4160 Afr. J. Biotechnol. species may limit the polymorphism levels. The size of fragments scored ranged from approximately 200 to 1,500 bp. Each primer produced an average of 18.94 fragments and 17.17 fragments of these were poly-morphic. The minimum and maximum numbers of polymorphic fragments were obtained from ISSR primer 856 (6) and 885 (32), respectively. In the genetic diversity study of 18 blackgram genotypes using 16 ISSR primers, Souframanien and Gopalakrishna (2004) found average numbers of fragments per primer and polymorphic fragments per primer of 6.3 and 3.4, respectively. Similarly, Ajibade et al. (2000) detected 4 to 12 ISSR fragments per primer among the 18 Vigna species when 15 ISSR primers were used. The higher numbers of fragments observed in our study may result from the difference in the sensitivity of DNA detection techniques used; our study used silver staining on polyacrylamide gel which is more sensitive with better resolution than ethidium bromide staining on agarose gel used by those previous studies. It has been shown that polyacrylamide gel separated DNA fragments more clearly than agarose gel, leading to an increase of both total and polymorphic RAPD and ISSR fragments (Pradeep Reddy et al., 2002; Stift et al., 2003). Using ISSR marker, Patzak (2001) found approximately 6.7-fold more ISSR fragments in hop when using polyacrylamide gel than agarose gel. The high number of polymorphic bands/ primer confirms the polymorphism detection effi-ciency of ISSR compared with other marker systems applied to V. radiata and/or V. mungo genetic diversity analysis such as RAPD and RFLP (Pradeep Reddy et al., 2002).
Percentage polymorphism ranged from 66.7% (ISSR 856) to 100% (ISSR 811, 836, 885), with an average percentage polymorphism of 89.51% across all the genotypes (Table 3). The primers that were based on the poly (GA) motif produced more polymorphism on average (96.4%) than the primers based on the poly (AG) and poly (AC) motifs (86.1 and 88.0%, respectively). Among the sixteen 3’-anchored primers, the ones based on (GA) motif produced the highest average polymorphism percentage of 95.6%, while the 3’-anchored poly (AG), (AC), (TG) and (TC) motif primers had average polymorphism percentages of 85.7-88.0%. The two 5’-anchored primers, ISSR 885 and 887, exhibited an average polymorphism percentage of 93.5%. From these polymorphic markers, 37.5% of the alleles were fixed in the population of mungbean and blackgram genotypes studied and a large proportion of them were either in high (> 0.85) or low (< 0.2) frequencies.
Higher number of species-specific fragments was obtained for blackgram. Unique fragments for the group of mungbean (56) and blackgram (67) represented 18.1 and 21.7%, respectively. These individual ISSR loci provided good discrimination between genotypes of the two species, while other ISSR loci did not. These results suggest that the difference between the two species involves
a substantial portion of the genome, and that other areas of the genome are shared in common by the two species. Some genotype-specific ISSR fragments were found, particularly in TC 1966 and TC 2211. Thirty-one polymorphic fragments were specific to nine genotypes. The genotype TC 1966 had seven specific fragments and the genotype TC 2211 had six. The ability of ISSR to effectively distinguish the two species as well as other species of Vigna was also reported by Ajibade et al. (2000).
PIC values portray allelic diversity for a specific locus. The higher the PIC values for a locus, the higher the probability that polymorphism will exist between two accessions at that locus (Li and Nelson, 2001). The range of PIC values in this study was 0.231 (ISSR 825) to 0.371 (ISSR 842) with an average of 0.313 (Table 3). Because ISSR markers are usually dominant markers, 0.50 will be the highest PIC value for any fragment. And the PIC values of � 0.3 in 11 of the 18 markers used here suggested that these markers are useful for the genetic diversity study. The success in identifying polymorphism is due to the use of a number of selected highly informative primers, which have been used successfully in blackgram and Vigna species (Ajibade et al., 2000; Souframanien and Gopalakrishna, 2004). Among these markers, ISSR 842, 836 and 826 (PIC values 0.371, 0.367 and 0.365, respectively) were the most informative for distinguishing among mungbean and blackgram genotypes. Note that these primers have GA, AG or AC repeat motif in their sequences. ISSR primers with GA and CA repeats have been shown to reveal high polymorphism among Vigna genotypes (Ajibade et al., 2000). Using only ISSR 826, 836 and 842 together with 3 additional high PIC-value ISSR primers (ISSR 841, 856 and 857), we were able to differentiate all 22 mungbean and blackgram genotypes, demonstrating the evidence of ISSR efficiency in characterization of these 2 species at both inter and intra-specific levels. The high efficiency of ISSR in variety identification of even closely related germplasm was previously shown in several crop species including oilseed rape, white lupin, potato and redcurrant of which only 2-4 most informative ISSR primers were able to distinguish all genotypes studied (Pradeep Reddy et al., 2002). The use of this marker should lower the cost, time and labor for DNA fingerprinting and diversity analysis of mungbean and blackgram. Genetic diversity and relationships among mungbean and blackgram genotypes All the 309 polymorphic ISSR fragments scored were used for genetic diversity analysis. Jaccard’s similarity coefficients were calculated to assess the genetic resemblances among the genotypes and the similarity coefficients matrix was used for UPGMA cluster analysis. The pair wise genetic similarity coefficients between mung-
bean and blackgram genotypes varied from 0.70 (SUT 4 versus UT 2) to 0.99 (CN 36 versus KPS 1) with an average of 0.86. Within the mungbean group, the range of genetic similarity coefficients between genotypes was lower (0.88 to 0.99) but the average was higher (0.93). CN 36 and KPS 1 had the largest genetic similarity (98.87%), while M 4-2 had the minimum genetic similarity (87.75%) with TC 1966. Both M 4-2 and TC 1966 also differed in several morpho-agronomic traits including plant height, yield per plant, number of flowers per raceme, 100-seed weight, days to first flowering, flowering period, terminal leaf width, petiole length, pod length, petiole pubescence, stem pubescence, seed color, seed luster and calyx color. When considering only between the 12 mungbean varieties, the average genetic similarity coefficient was even higher (0.95). The genetic similarity coefficients between five blackgram genotypes varied from 0.90 to 0.97 with an average of 0.94. Prajeen and KAB 4 had the highest genetic similarity (97.46%), while the lowest genetic similarity (90.29%) was found between Prajeen and TC 2211. Excluding the wild relative, TC 2211, the average genetic similarity between the four blackgram varieties reached 96.13%. The genetic distance between the mungbean and blackgram groups was 0.27. The molecular differentiation of these two species by ISSR analysis supported the taxonomic morphological classification (Plant germplasm database, 2004) and agreed with previous reports using isozyme and RAPD (Kaga et al., 1996; Ngampongsai et al., 2000; Prammanee et al., 2000).
The cluster analysis totally separated the two Vigna spp, V. radiata (cluster I) and V. mungo (cluster II) (Figure 1B) although these two self-pollinating species share the same chromosome number (2n = 20) and are partially cross-compatible (Seehalak et al., 2006). The Mantel’s test with cophenetic correlation coefficient value of 0.995 (p < 0.01) indicated that data in the similarity matrix was well represented by the dendrogram. In the V. radiata cluster, genotypes were clustered quite closely together in a large group of 12 varieties, 3 breeding lines, 1 wild relative and 1 landrace. With the exception of 1 variety and 1 wild relative, these genotypes have relatively low genetic polymorphism with > 92% genetic similarity among genotypes. As evident from the dendrogram (Figure 1B), TC 1966, which is the only mungbean wild relative, was the most distantly related to other mungbean genotypes (7.6 to 12.3% differences), however, it was not well separated from others. Among the cultivated mungbean, UT 1, SUT 4, M 4-2 and V 2709 were more distinct from the others. CN 36 and KPS 1 were the most closely related (98.87% genetic similarity) in this cluster. These 2 certified varieties together with five other certified varieties (CN 60, CN 72, KPS 2, PSU 1, and SUT 1) and SUT 5 formed close relationships with more than 95% similarity. In the V. mungo cluster, Prajeen, PL 2, KAB 4 and UT 2 varieties formed a tight group (> 94% similarity),
Tantasawat et al. 4161 while the wild relative TC 2211 were more distantly related (8.7 to 9.7% differences from other genotypes). Similarly, Kaga et al. (1996) found that wild forms of mungbean and blackgram always grouped with their most closely related cultivated forms using RAPD, however, in their study, V. radiata var. sublobata genotypes were highly different from the cultivated ones (27.5 to 35.4% differences), whereas the V. mungo var. silvestris and cultivated genotypes were more closely related (6.0 to 15.7% differences). Between the two blackgram genotypes, UT 2 and TC 2211, the percentages of difference were comparable in our (9.1%) and their (9.5%) studies. Two mungbean and one blackgram genotypes with high resistance to bruchid, TC 1966, V 2709 and TC 2211, appeared to be the most distantly related to M 4-2, SUT 4 and Prajeen, respectively; all these genotypes were susceptible to the insect. Hybridization between these genotypes may achieve not only the transfer of insect resistance gene(s) but also the increase in genetic variability of other desirable traits.
PCA was used to identify multidimensional relationships that describe portions of the genetic variance in a data set. The three coordinates explained 57.1, 5.8 and 4.9% of the total variance, respectively. These first three principal coordinates of the ISSR data explained 67.7% of the total variance. PCA separated the genotypes into two distinctive groups, cluster I and II, according to species, in general consistent with the UPGMA cluster analysis (Figure 1B, 2B). The mungbean genotypes were completely separated from the blackgram genotypes, however, six mungbean genotypes, TC1966, UT 1, V 2709, M 4-2, M 5-1 and M 5-5 appeared to be more distinct from other mungbean genotypes in the PCA. The remaining 11 mungbean genotypes appeared to have minimal genetic diversity and all appeared in one close group. The PCA also generated a good separation of TC 2211 from the rest of the blackgram genotypes.
The close genetic similarity between the mungbean genotypes as shown by high values of Jaccard’s similarity coefficient and PCA may be explained by the high degree of parental commonness in their pedigrees. SUT 2 and SUT 3 derived from BC4 progenies of KPS 1 and KPS 2, respectively, and consistently had > 95% similarity with their respective recurrent parents. However, SUT 4, a BC4 progeny of PSU 1, which inherited powdery mildew resistance from the donor parent, VC 3689A, was less similar to PSU 1 (92.4%). CN 72, the � irradiated mutant of KPS 2 that was selected for resistance to beanfly (Watanasit et al., 2000) had 95.9% similarity with KPS 2. These two varieties were also clustered together in the same subcluster Ib based on morpho-agronomic characters. The genetic relationships among mungbean and blackgram genotypes may help breeders make better choices of parents when selecting among various genotypes in the breeding program with the hypothesis that the more genetically diverse parents, the more likely

4162 Afr. J. Biotechnol. they are to possess unique alleles for traits of interest, and the probability of producing unique genotypes increases in proportion to the number of genes by which parents differ (Narvel et al., 2000; Tar’an et al., 2005). In this respect, genotypes with the most distinct DNA profiles are likely to contain the greatest number of novel alleles. However, it must be noted that the ISSR variation observed may not necessarily reflect the phenotypic variation in the traits of interest. The narrow genetic base of elite genotypes of mungbean and blackgram observed in this study was similarly observed in other reports (Lakhanpaul et al., 2000; Gaffor et al., 2001; Souframanien and Gopalakrishna, 2004), emphasizing the need to broaden genetic variation by utilization of diverse germplasm collections. Wild relatives, landraces from other countries and mutant lines appeared to be good sources for genetic variation. Comparison of morphological-based and ISSR-based clusters The similarity and cophenetic matrices for ISSR and morphological markers were also compared using Mantel’s test (Mantel, 1967) for matrix correspondence. The correlation between the morphological and the ISSR similarity matrices was 0.54 (p < 0.01), suggesting significant correlation between these two markers for the determination of genetic diversity and relationships among mungbean and blackgram genotypes. Note that the goodness of fit for cophenetic correlation (0.995) of ISSR values was much higher than that of morphological values (0.33), suggesting the suitability of ISSR for determination of genetic diversity and relationships among the materials studied. Although the correlation between the matrices of cophenetic correlation values for the dendrogram based on ISSR and morphological characters data was significant (r = 0.6934; p < 0.01) and both markers grouped all Thai mungbean varieties into the same large cluster and grouped all Thai blackgram varieties into a separate cluster, it is apparent that the dendrograms generated by morphological and ISSR markers showed some variation in the clustering of genotypes (Figures 1A, B). Twenty-two genotypes were grouped in two clusters in ISSR, whereas a dendrogram based on morphological characters showed three clusters. In addition, ISSR was more effective in genetic differen-tiation at the species level, and the genetic similarities among genotypes estimated by ISSR (mean genetic similarity 0.86) were much higher than those of morphological characters (mean genetic similarity 0.52). Similarly, Ghafoor et al. (2002) also observed no clear differentiation between V. radiata and V. mungo by agronomic characteristics but SDS-PAGE analysis of seed storage protein proved to be an efficient tool for the purpose. Several factors might be responsible for the
difference between ISSR and morphological markers. Morphological differences may not be proportional to the underlying genetic differences. Another contributing factor might be differential rates of evolutionary change for morphological traits compared to sequences associated with ISSR marker variation. ISSR marker loci may be located in non-coding genomic regions where sequence changes are not restricted by the requirement to maintain gene function, leading to more rapid evolutionary change (Johns et al., 1997; Chawla, 2002). Last but not least, the multi-locus nature of ISSR markers made it vulnerable for misidentification of co migrating ISSR fragments with no sequence homology amplified from different loci as the same allele, thereby distorting the estimates of genetic similarity. This bias has been pointed out by Simioniuc et al. (2002) with RAPD and Sanchez et al. (1996) with ISSR.
In conclusion, ISSRs proved to be applicable for multi-locus analysis of mungbean and blackgram DNA which is not only useful for genotyping and genetic diversity and relatedness evaluation but could also be used for mapping, gene tagging and marker-assisted selection in future breeding programs. ABBREVIATIONS PIC, Polymorphism information content; ISSR, inter-simple sequence repeat; UPGMA, unweighted pair-group method arithmetic average; RFLPs, restriction fragment length polymorphisms; RAPDs, random amplified polymorphic DNAs; AFLPs, amplified fragment length polymorphisms; SSRs, microsatellites or simple sequence repeats. REFERENCES Ajibade SR, Weeden NF, Chite SM (2000). Inter simple sequence
repeat analysis of genetic relationships in the genus Vigna. Euphytica 111: 47-55.
Autrique E, Nachit MM, Monneveux P, Tanksley SD, Sorrells ME (1996). Genetic diversity in durum wheat based on RFLPs, morphological traits, and coefficient of parentage. Crop Sci. 36: 735-742.
Bisht IS, Bhat KV, Lakhanpaul S, Latha M, Jayan PK, Biswas BK, Singh AK (2005). Diversity and genetic resources of wild Vigna species in India. Genet. Res. Crop Evol. 52: 53-68.
Blair MW, Panaud O, McCough SR (1999). Inter-simple sequence repeat (ISSR) amplification for analysis of microsatellite motif frequency and fingerprinting in rice (Oryza sativa L.). Theor. Appl. Genet. 98: 780-792.
Boonpradub S, Chatasiri M (1997). Quality improvement and yield of Vigna mungo for exportation, Department of Agriculture, Thailand (in Thai, with English abstract).
Chaitieng B, Kaga A, Han OK, Wang, XW, Wongkaew S, Laosuwan P, Tomooka N, Vaughan DA (2002). Mapping a new source of resistance to powdery mildew in mungbean. Plant Breed. 121: 521-525.
Chaitieng B, Kaga A, Tomooka N, Isemura T, Kuroda Y, Vaughan DA (2006). Development of a black gram [Vigna mungo (L.) Hepper]

linkage map and its comparison with an azuki bean [Vigna angularis (Willd.) Ohwi and Ohashi] linkage map. Theor. Appl. Genet. 113: 1261-1269.
Chandel KPS, Lester RN, Starling RJ (1984). The wild ancestors of urd and mungbeans (Vigna mungo (L.) Hepper and V. radiata (L.) Wilczek). Bot. J. Linnean Soc. 89: 85-86.
Chawla HS (2002). Introduction to plant biotechnology, 2nd edn, Science Publishers, Inc., Enfield.
Ehlers JD, Hall AE (1997). Cowpea (Vigna unguiculata L. Walp.). Field Crops Res. 53: 187-204.
Fatokun CA, Danesh D, Young ND, Stewart EL (1993). Molecular taxonomic relationships in the genus Vigna based on RFLP analysis. Theor. Appl. Genet. 86: 97-104.
Gaffor A, Sharif A, Ahmad Z, Zahid MA, Rabbani MA (2001). Genetic diversity in blackgram (Vigna mungo L. Hepper). Field Crop Res. 69: 183-190.
Ghafoor A, Ahmad Z, Qureshi AS, and Bashir M (2002). Genetic relationship in Vigna mungo (L.) Hepper and V. radiata (L.) R. Wilczek based on morphological traits and SDS-PAGE. Euphytica 123: 367-378.
Johns MA, Skroch PW, Nienhuis J, Hinrichsen P, Bascur G, Munoz-Schick C (1997). Gene pool classification of common bean landraces from Chile based on RAPD and morphological data. Crop Sci. 37: 605-613.
Kaga A, Tamooka N, Egawa Y, Hosaka K, Kamijima O (1996). Species relationships in subgenus Ceratotropis (genus Vigna) as revealed by RAPD analysis. Euphytica 88: 17-24.
Keim P, Beavis W, Schupp J, Freestone R (1992). Evaluation of soybean RFLP marker diversity in adapted germplasm. Theor. Appl. Genet. 85: 205-212.
Kochieva EZ, Ryzhova NN, Khrapalova IA, Pukhalskyi VA (2002). Genetic diversity and phylogenetic relationships in the genus Lycopersicon (Tourn.) Mill. as revealed by inter-simple sequence repeat (ISSR) analysis. Russ. J. Genet. 38: 958-966.
Lakhanpaul S, Chadha S, Bhat KV (2000). Random amplified polymorphic DNA (RAPD) analysis in Indian mungbean (Vigna radiata (L.) Wilczek) cultivars. Genetica 109: 227-234.
Lapointe FJ, Legendre P (1992). Statistical significance of the matrix correlation coefficient for comparing independent phylogenetic trees. Syst. Biol. 41: 378-384.
Li CD, Fatokun CA, Ubi B, Singh BB, Scoles GJ (2001). Determining genetic similarities and relationships among cowpea breeding lines and cultivars by microsatellite markers. Crop Sci. 41: 189-197.
Li Z, Nelson RL (2001). Genetic diversity among soybean accessions from three countries measured by RAPDs. Crop Sci. 41: 1337-1347.
Mantel N (1967). The detection of disease clustering and a generalized regression approach. Cancer Res. 27: 209-220.
Mignouna HD, Ng NQ, Ikea J, Thottapilly G (1998). Genetic diversity in cowpea as revealed by random amplified polymorphic DNA. J. Genet. Breed. 53: 151-159.
Miyagi M, Humphry M, Ma ZY, Lambrides CJ, Bateson M, Liu CJ (2004). Construction of bacterial artificial chromosome libraries and their application in developing PCR-based markers closely linked to a major locus conditioning bruchid resistance in mungbean (Vigna radiata L. Wilczek). Theor. Appl. Genet. 110: 151-156.
Moreno S, Martin JP, Ortiz JM (1998). Inter-simple sequence repeats PCR for characterization of closely related grapevine germplasm. Euphytica 101: 117-125.
Na Pattalung SS, Poonsavasde P (1995). Laboratory evaluation of some wild Vigna spp. for resistance to common cutworm leaf feeding. In: Proceedings of the Sixth Mungbean Workshop held at Suranaree University of Technology, Thailand, 14-16 June 1995, pp 183-191 (in Thai, with English abstract).
Narvel JM, Fehr WR, Chu W-C, Grant D, Shoemaker RC (2000). Simple sequence repeat diversity among soybean plant introductions and elite genotypes. Crop Sci. 40: 1452-1458.
Ngampongsai S, Chotechuen S, Promkum W, Wongpiyasatid A (2004). Induced mutations in mungbean breeding program. In: Proceedings of the National Mungbean Research Conference IX held at Lampang Wiengthong Hotel, Thailand, 5-6 March 2004, pp 111-118 (in Thai,
Tantasawat et al. 4163
with English abstract). Ngampongsai S, Watanasit A, Tanomsub W, Tanomsub S (2000).
Exploration, collection and evaluation of wild Vigna species. In: Proceedings of the National Mungbean Research Conference VIII held at Kasetsart University, Thailand, 18-20 January 2000, pp 21-30 (in Thai, with English abstract).
Paterson AH, Tanksley SD, Sorrells ME (1991). DNA markers in plant improvement. Adv. Agron. 46: 39-90.
Patzak J (2001). Comparison of RAPD, STS, ISSR and AFLP molecular methods used for assessment of genetic diversity in hop (Humulus lupulus L.). Euphytica 121: 9-18.
Phoomthaisong J, Kraokaw S, Thanomsub W, Areeruk S (2004). Responses of mungbean to iron spraying in calcareous soil. In: Proceedings of the National Mungbean Research Conference IX held at Lampang Wiengthong Hotel, Thailand, 5-6 March 2004, pp 51-57 (in Thai, with English abstract).
Plant germplasm database (2004). Mungbean/blackgram. pp: 1-7. Department of Agriculture, Ministry of Agriculture and Cooperatives. [Online]. Available from: http://www.doae.go.th/ plant/mungbn.html [Accessed 14 March 2008].
Pradeep Reddy M, Sarla N, Siddiq EA (2002). Inter simple sequence repeat (ISSR) polymorphism and its application in plant breeding. Euphytica 128: 9-17.
Prammanee S, Noknoy K, Burns P, Burns T, Ngampongsai S, Iamsupasit N (2000). DNA fingerprinting of the certified mungbean and blackgram cultivars. In: Proceedings of the National Mungbean Research Conference VIII held at Kasetsart University, Thailand, 18-20 January 2000, pp 6-12 (in Thai, with English abstract).
Prevost A, Wilkinson MJ (1999). A new system of comparing PCR primers applied to ISSR fingerprinting of potato cultivars. Theor. Appl. Genet. 98: 107-112.
Rohlf FJ (2000). NTSYS numerical taxonomy and multivariate analysis system version 2.2 user guide, Applied Biostatistics, Inc., New York.
Saghai Maroof K, Soliman M, Jorgensen RA, Allard RW (1984). Ribosomal DNA spacer-length polymorphisms in barley: Mendelian inheritance, chromosomal location, and population dynamics. PNAS 81: 8014-8018.
Sambrook J, Russell DW (2001). Molecular cloning: A laboratory manual, Cold Spring Harbor Laboratory Press, New York.
Sanchez de la Hoz MP, Davila JA, Loarce Y, Ferrer E (1996). Simple sequence repeat primers used in polymerase chain reaction amplifications to study genetic diversity in barley. Genome, 39: 112-117.
Santalla M, Power JB, Davey MR (1998). Genetic diversity in mungbean germplasm revealed by RAPD markers. Plant Breed. 117: 473-478.
Sarobol N (1997). Mungbean: Past, present and future. In: Proceedings of the National Mungbean Research Conference VII held at Golden Grand Hotel, Thailand, 2-4 December 1997, pp: 1-20 (in Thai, with English abstract).
SAS Institute. 1996. SAS/STAT user’s guide: version 6, 4th edn., volume 1 and 2, SAS Institute Inc., Cary, N.C.
Seehalak W, Tomooka N, Waranyuwat A, Thipyapong P, Laosuwan P, Kaga A, Vaughan DA (2006). Genetic diversity of the Vigna germplasm from Thailand and neighboring regions revealed by AFLP analysis. Genet. Res. Crop Evol. 63: 1043-1059.
Simioniuc D, Uptmoor R, Friedt W, Ordon F (2002). Genetic diversity and relationships among pea cultivars revealed by RAPDs and AFLPs. Plant Breed. 121: 429-435.
Smith JSC, Smith OS (1989). The description and assessment of distances between inbred lines of maize. II. The utility of morphological, biochemical and genetic descriptors and a scheme for testing of distinctiveness between inbred lines. Maydica 34: 151-161.
Souframanien J, Gopalakrishna T (2004). A comparative analysis of genetic diversity in blackgram genotypes using RAPD and ISSR markers. Theor. Appl. Genet. 109: 1687-1693.
Srinives P (2006). Research direction and legume crop development. In: Proceedings of the National Legume Crop Research Conference I held at Rimkok Resort Hotel, Chiang Rai, Thailand, August 2006, pp 389 (in Thai, with English abstract).
Srinives P, Kaveeta R, Jene-Kritiya A, Indonprai T (2003). Kasetsart
4164 Afr. J. Biotechnol.
University. [Online]. Available from: http://www.ku.ac.th/kas et60/ku60/mungbean.html [Accessed 1 March 2008].
Stift G, Pachner M, Lelley T (2003). Comparison of RAPD fragment separation in agarose and polyacrylamide gel by studying Cucurbita species. Cucurbit Genet. Coop. Rep. 26: 62-65.
Tar’an B, Zhang C, Warkentin T, Tullu A, Vandenberg A (2005). Genetic diversity among varieties and wild species accessions of pea (Pisum sativum L.) based on molecular markers, and morphological and physiological characters. Genome 48: 257-272.
Tosti N, Negri V (2002). Efficiency of three PCR-based markers in assessing genetic variation among cowpea (Vigna unguiculata subsp. unguiculata) landraces. Genome 45: 268-275.
Wang G, Mahalingam R, Knap HT (1998). (C-A) and (G-A) anchored simple sequence repeats (ASSRs) generated polymorphism in soybean, Glycine max (L.) Merr. Theor. Appl. Genet. 96: 1086-1096.
Wang L, Guan R, Zhangxiong L, Chang R, Qiu L (2006). Genetic diversity of Chinese cultivated soybean revealed by SSR markers. Crop Sci. 46: 1032-1038.
Wang XW, Kaga A, Tomooka N, Vaughan DA (2004). The development
of SSR markers by a new method in plants and their application to gene flow studies in azuki bean [Vigna angularis (Willd.) Ohwi and Ohashi]. Theor. Appl. Genet. 109: 352-360.
Watanasit A, Ngampongsai S, Thanomsub W, Thanomsub S (2000). CN 72 A new mungbean cultivar. In: Proceedings of the National Mungbean Research Conference VIII held at Kasetsart University, Thailand, 18-20 January 2000, pp: 21-30 (in Thai, with English abstract).
Zietjiewicz E, Rafalski A, Labuda A (1994). Genome fingerprinting by simple sequence repeat (SSR)-anchored polymerase chain reaction amplification. Genomics 20: 176-183.


