Download - VCE Graded Assessment 2017
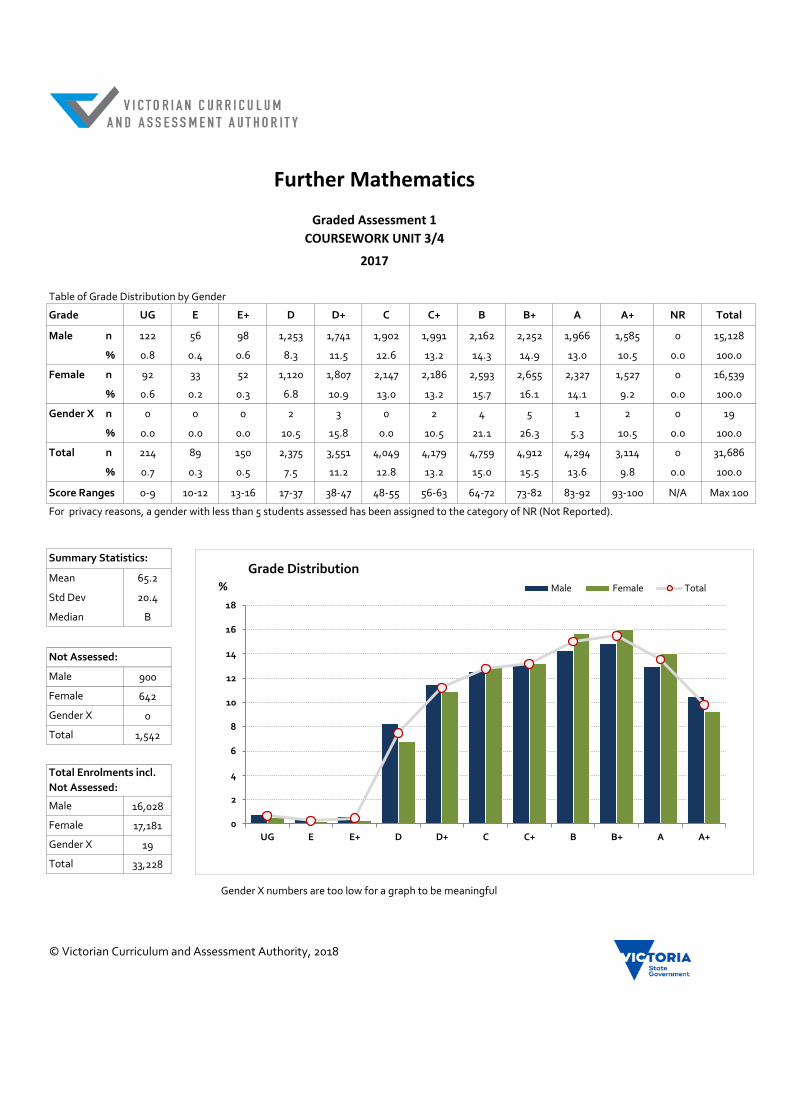
Table of Grade Distribution by Gender
Grade UG E E+ D D+ C C+ B B+ A A+ NR Total
Male n 122 56 98 1,253 1,741 1,902 1,991 2,162 2,252 1,966 1,585 0 15,128
% 0.8 0.4 0.6 8.3 11.5 12.6 13.2 14.3 14.9 13.0 10.5 0.0 100.0
Female n 92 33 52 1,120 1,807 2,147 2,186 2,593 2,655 2,327 1,527 0 16,539
% 0.6 0.2 0.3 6.8 10.9 13.0 13.2 15.7 16.1 14.1 9.2 0.0 100.0
Gender X n 0 0 0 2 3 0 2 4 5 1 2 0 19
% 0.0 0.0 0.0 10.5 15.8 0.0 10.5 21.1 26.3 5.3 10.5 0.0 100.0
Total n 214 89 150 2,375 3,551 4,049 4,179 4,759 4,912 4,294 3,114 0 31,686
% 0.7 0.3 0.5 7.5 11.2 12.8 13.2 15.0 15.5 13.6 9.8 0.0 100.0
Score Ranges 0-9 10-12 13-16 17-37 38-47 48-55 56-63 64-72 73-82 83-92 93-100 N/A Max 100
Mean 65.2
Std Dev 20.4
Median B
900
642
0
1,542
16,028
17,181
19
33,228
Further Mathematics
Graded Assessment 1
COURSEWORK UNIT 3/4
2017
Not Assessed:
Summary Statistics:
For privacy reasons, a gender with less than 5 students assessed has been assigned to the category of NR (Not Reported).
Gender X
Total
Gender X numbers are too low for a graph to be meaningful
© Victorian Curriculum and Assessment Authority, 2018
Male
Female
Gender X
Total
Total Enrolments incl.
Not Assessed:
Male
Female
No graph is supplied for this GA as student numbers are too small for a graph to be meaningfull.
0
2
4
6
8
10
12
14
16
18
UG E E+ D D+ C C+ B B+ A A+
%
Grade Distribution
Male Female Total

Table of Grade Distribution by Gender
Grade UG E E+ D D+ C C+ B B+ A A+ NR Total
Male n 5 54 205 795 1,173 1,649 2,396 2,321 2,005 1,756 1,517 0 13,876
% 0.0 0.4 1.5 5.7 8.5 11.9 17.3 16.7 14.4 12.7 10.9 0.0 100.0
Female n 1 75 318 1,174 1,620 1,944 2,840 2,612 2,266 1,707 1,160 0 15,717
% 0.0 0.5 2.0 7.5 10.3 12.4 18.1 16.6 14.4 10.9 7.4 0.0 100.0
Gender X n 0 0 0 3 1 3 2 3 2 4 0 0 18
% 0.0 0.0 0.0 16.7 5.6 16.7 11.1 16.7 11.1 22.2 0.0 0.0 100.0
Total n 6 129 523 1,972 2,794 3,596 5,238 4,936 4,273 3,467 2,677 0 29,611
% 0.0 0.4 1.8 6.7 9.4 12.1 17.7 16.7 14.4 11.7 9.0 0.0 100.0
Score Ranges 0-7 8-14 15-21 22-29 30-35 36-40 41-49 50-56 57-65 66-73 74-80 N/A Max 80
Mean 50.3
Std Dev 15.6
Median B
2,152
1,464
1
3,617
16,028
17,181
19
33,228
Further Mathematics
Graded Assessment 2
WRITTEN EXAMINATION 1
2017
Not Assessed:
Summary Statistics:
For privacy reasons, a gender with less than 5 students assessed has been assigned to the category of NR (Not Reported).
Gender X
Total
Gender X numbers are too low for a graph to be meaningful
© Victorian Curriculum and Assessment Authority, 2018
Male
Female
Gender X
Total
Total Enrolments incl.
Not Assessed:
Male
Female
No graph is supplied for this GA as student numbers are too small for a graph to be meaningfull.
0
2
4
6
8
10
12
14
16
18
20
UG E E+ D D+ C C+ B B+ A A+
%
Grade Distribution
Male Female Total

Table of Grade Distribution by Gender
Grade UG E E+ D D+ C C+ B B+ A A+ NR Total
Male n 48 95 447 967 1,607 1,838 2,212 1,911 1,786 1,641 1,287 0 13,839
% 0.3 0.7 3.2 7.0 11.6 13.3 16.0 13.8 12.9 11.9 9.3 0.0 100.0
Female n 43 139 558 1,157 2,000 2,216 2,644 2,158 2,041 1,671 1,066 0 15,693
% 0.3 0.9 3.6 7.4 12.7 14.1 16.8 13.8 13.0 10.6 6.8 0.0 100.0
Gender X n 0 0 1 4 0 0 5 3 3 2 0 0 18
% 0.0 0.0 5.6 22.2 0.0 0.0 27.8 16.7 16.7 11.1 0.0 0.0 100.0
Total n 91 234 1,006 2,128 3,607 4,054 4,861 4,072 3,830 3,314 2,353 0 29,550
% 0.3 0.8 3.4 7.2 12.2 13.7 16.5 13.8 13.0 11.2 8.0 0.0 100.0
Score Ranges 0-9 10-15 16-25 26-35 36-46 47-58 59-72 73-84 85-96 97-108 109-120 N/A Max 120
Mean 69.4
Std Dev 27.1
Median C+
2,189
1,488
1
3,678
16,028
17,181
19
33,228
Further Mathematics
Graded Assessment 3
WRITTEN EXAMINATION 2
2017
Not Assessed:
Summary Statistics:
For privacy reasons, a gender with less than 5 students assessed has been assigned to the category of NR (Not Reported).
Gender X
Total
Gender X numbers are too low for a graph to be meaningful
© Victorian Curriculum and Assessment Authority, 2018
Male
Female
Gender X
Total
Total Enrolments incl.
Not Assessed:
Male
Female
No graph is supplied for this GA as student numbers are too small for a graph to be meaningfull.
0
2
4
6
8
10
12
14
16
18
UG E E+ D D+ C C+ B B+ A A+
%
Grade Distribution
Male Female Total


