Download - Viet Nam MICS4 part 1

VIET NAM
Multiple Indicator Cluster Survey2010–2011
Monitoring the situation of children and women
MICSGeneral Statistics
PDF compression, OCR, web optimization using a watermarked evaluation copy of CVISION PDFCompressor

Viet Nam Multiple Indicator Cluster Survey 2010–2011
Final Report
December, 2011
PDF compression, OCR, web optimization using a watermarked evaluation copy of CVISION PDFCompressor

The Viet Nam Multiple Indicator Cluster Survey (MICS) was carried out in 2010–2011 by the General Statistics Office of Viet Nam. Financial and technical support was provided by the United Nations Children’s Fund (UNICEF) and financial support was provided by the United Nations Population Fund (UNFPA).
MICS is an international household survey programme developed by UNICEF. The Viet Nam MICS was conducted as part of the fourth global round of MICS surveys (MICS4). MICS provides up-to-date information on the situation of children and women and measures key indicators that allow countries to monitor progress towards the Millennium Development Goals (MDGs) and other internationally agreed upon commitments. Additional information on the global MICS project may be obtained from www.childinfo.org. Suggested citation:General Statistical Office (GSO), Viet Nam Multiple Indicator Cluster Survey 2010–2011, Final Report, 2011, Ha Noi, Viet Nam.
PDF compression, OCR, web optimization using a watermarked evaluation copy of CVISION PDFCompressor

11
Viet NamMultiple Indicator Cluster Survey
2010–2011
GSO
General Statistics Office
UNICEF
United Nations Children’s Fund
UNFPA
United Nations Population Fund
December, 2011
PDF compression, OCR, web optimization using a watermarked evaluation copy of CVISION PDFCompressor

2
PDF compression, OCR, web optimization using a watermarked evaluation copy of CVISION PDFCompressor
3VIET NAM MULTIPLE INDICATOR CLUSTER SURVEY 2010–2011
MONITORING THE SITUATION OF CHILDREN AND WOMEN
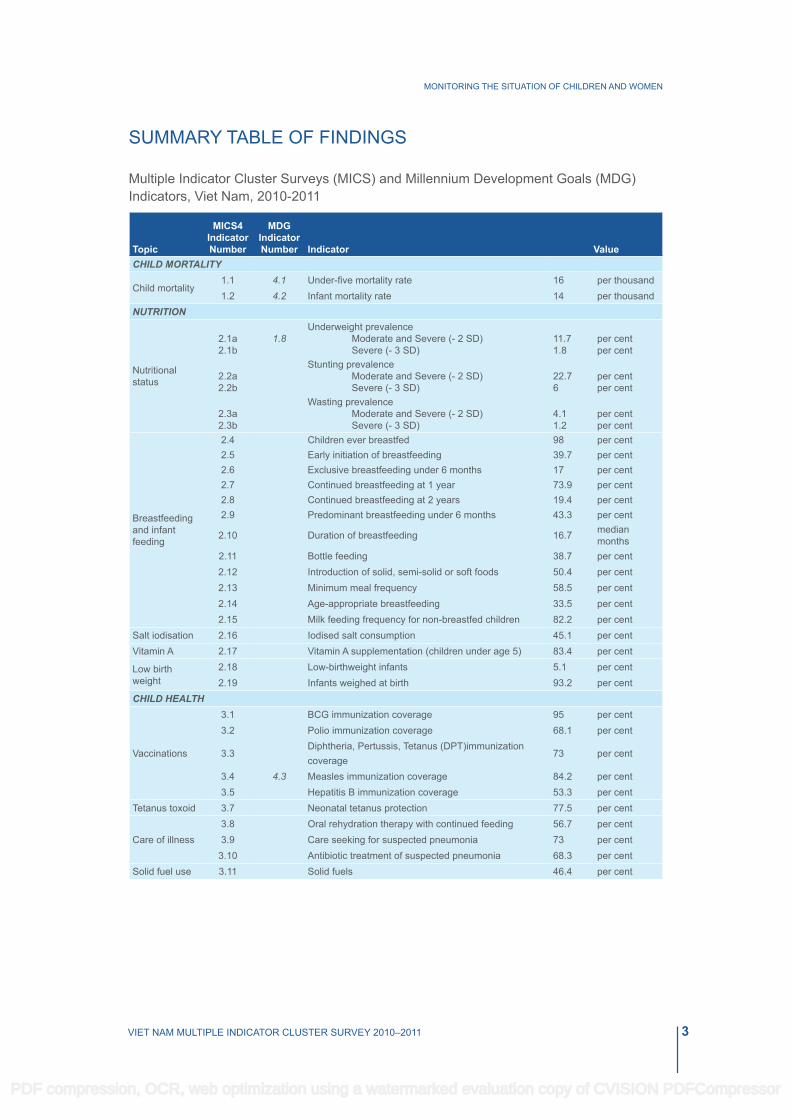
SUMMARY TAbLE OF FINDINGS
Multiple Indicator Cluster Surveys (MICS) and Millennium Development Goals (MDG) Indicators, Viet Nam, 2010-2011
Topic
MICS4 Indicator Number
MDG Indicator Number Indicator Value
CHILD MORTALITY
Child mortality1.1 4.1 Under-five mortality rate 16 per thousand1.2 4.2 Infant mortality rate 14 per thousand
NUTRITION
Nutritional status
2.1a2.1b
1.8Underweight prevalence Moderate and Severe (- 2 SD) Severe (- 3 SD)
11.71.8
per centper cent
2.2a2.2b
Stunting prevalence Moderate and Severe (- 2 SD) Severe (- 3 SD)
22.76
per centper cent
2.3a2.3b
Wasting prevalence Moderate and Severe (- 2 SD) Severe (- 3 SD)
4.11.2
per centper cent
breastfeeding and infant feeding
2.4 Children ever breastfed 98 per cent2.5 Early initiation of breastfeeding 39.7 per cent2.6 Exclusive breastfeeding under 6 months 17 per cent2.7 Continued breastfeeding at 1 year 73.9 per cent2.8 Continued breastfeeding at 2 years 19.4 per cent2.9 Predominant breastfeeding under 6 months 43.3 per cent
2.10 Duration of breastfeeding 16.7 median months
2.11 bottle feeding 38.7 per cent2.12 Introduction of solid, semi-solid or soft foods 50.4 per cent2.13 Minimum meal frequency 58.5 per cent2.14 Age-appropriate breastfeeding 33.5 per cent2.15 Milk feeding frequency for non-breastfed children 82.2 per cent
Salt iodisation 2.16 Iodised salt consumption 45.1 per centVitamin A 2.17 Vitamin A supplementation (children under age 5) 83.4 per cent
Low birth weight
2.18 Low-birthweight infants 5.1 per cent2.19 Infants weighed at birth 93.2 per cent
CHILD HEALTH
Vaccinations
3.1 bCG immunization coverage 95 per cent3.2 Polio immunization coverage 68.1 per cent
3.3Diphtheria, Pertussis, Tetanus (DPT)immunizationcoverage
73 per cent
3.4 4.3 Measles immunization coverage 84.2 per cent3.5 Hepatitis b immunization coverage 53.3 per cent
Tetanus toxoid 3.7 Neonatal tetanus protection 77.5 per cent
Care of illness3.8 Oral rehydration therapy with continued feeding 56.7 per cent3.9 Care seeking for suspected pneumonia 73 per cent
3.10 Antibiotic treatment of suspected pneumonia 68.3 per centSolid fuel use 3.11 Solid fuels 46.4 per cent
PDF compression, OCR, web optimization using a watermarked evaluation copy of CVISION PDFCompressor

4 VIET NAM MULTIPLE INDICATOR CLUSTER SURVEY 2010–2011
MONITORING THE SITUATION OF CHILDREN AND WOMEN
Topic
MICS4 Indicator Number
MDG Indicator Number Indicator Value
Malaria
3.12 Household availability of insecticide-treated nets (ITNs) 9.5 per cent3.13 Households protected by a vector control method 25 per cent3.14 Children under age 5 sleeping under any mosquito net 94.4 per cent
3.15 6.7 Children under age 5 sleeping under insecticide-treated nets (ITNs) 9.4 per cent
3.16 Malaria diagnostics usage 10.7 per cent
3.17 Antimalarial treatment of children under age 5 the same or next day 0.9 per cent
3.18 6.8 Antimalarial treatment of children under age 5 1.2 per cent
3.19 Pregnant women sleeping under insecticide-treated nets (ITNs) 11.3 per cent
WATER, SANITATION AND HYGIENE
Water and sanitation
4.1 7.8 Use of improved drinking water sources 92 per cent4.2 Water treatment 89.6 per cent4.3 7.9 Use of improved sanitation facilities 73.8 per cent4.4 Safe disposal of child's faeces 61.1 per cent
Hygiene4.5 Place for handwashing with water and soap 86.6 per cent4.6 Availability of soap 95.1 per cent
REPRODUCTIVE HEALTH
Contraception and unmet need
5.1 5.4 Adolescent birth rate 46 per thousand5.2 Early childbearing 3.0 per cent5.3 5.3 Contraceptive prevalence rate 77.8 per cent5.4 5.6 Unmet need for contraception 4.3 per cent
Maternal and newborn health
5.5a5.5b
5.5Antenatal care coverage At least once by skilled personnel At least four times by any provider
93.759.6
per centper cent
5.6 Content of antenatal care 42.5 per cent5.7 5.2 Skilled attendant at delivery 92.9 per cent5.8 Institutional deliveries 92.4 per cent5.9 Caesarean section 20 per cent
CHILD DEVELOPMENT
Child development
6.1 Support for learning 76.8 per cent6.2 Father's support for learning 61.3 per cent6.3 Learning materials: children’s books 19.6 per cent6.4 Learning materials: playthings 49.3 per cent6.5 Inadequate care 9.4 per cent6.6 Early child development index 82.8 per cent6.7 Attendance in early childhood education 71.9 per cent
EDUCATION
Literacy and education
7.1 2.3 Literacy rate among young women 96.4 per cent7.2 School readiness 92.6 per cent7.3 Net intake rate in primary education 94.9 per cent7.4 Primary school net attendance ratio (adjusted) 97.9 per cent7.5 Secondary school net attendance ratio (adjusted) 81.0 per cent7.6 2.2 Children reaching last grade of primary 99.4 per cent7.7 Primary completion rate 99.6 per cent7.8 Transition rate to secondary school 98.8 per cent7.9 3.1 Gender parity index (primary school) 1.00 ratio
7.10 3.1 Gender parity index (secondary school) 1.07 ratioCHILD PROTECTIONbirth registration 8.1 birth registration 95 per cent
Child labour8.2 Child labour 9.5 per cent8.3 School attendance among child labourers 83.4 per cent8.4 Child labour among students 8.3 per cent
Child discipline 8.5 Violent discipline 73.9 per cent
PDF compression, OCR, web optimization using a watermarked evaluation copy of CVISION PDFCompressor

5VIET NAM MULTIPLE INDICATOR CLUSTER SURVEY 2010–2011
MONITORING THE SITUATION OF CHILDREN AND WOMEN
Topic
MICS4 Indicator Number
MDG Indicator Number Indicator Value
Early marriage and polygyny
8.6 Marriage before age 15 0.7 per cent8.7 Marriage before age 18 12.3 per cent8.8 Young women age 15-19 currently married or in union 8.4 per cent8.9 Polygyny 2.5 per cent
8.10a8.10b
Spousal age difference (10 or more years) Women age 15-19 Women age 20-24
7.44.8
per centper cent
Domestic violence 8.14 Attitudes towards domestic violence 35.8 per cent
Orphaned children
8.15 Children’s living arrangements 5.3 per cent8.16 Prevalence of children with at least one parent dead 3.9 per cent
HIV/AIDS AND SEXUAL BEHAVIOUR
HIV/AIDS knowledge and attitudes
9.1 Comprehensive knowledge about HIV prevention 45.1 per cent
9.2 6.3 Comprehensive knowledge about HIV prevention among young people 51.1 per cent
9.3 Knowledge of mother-to-child transmission of HIV 49.6 per cent9.4 Accepting attitude towards people living with HIV 28.9 per cent9.5 Women who know where to be tested for HIV 61.1 per cent
9.6 Women who have been tested for HIV and know the results 6.6 per cent
9.7 Sexually active young women who have been tested for HIV and know the results 7.9 per cent
9.8 HIV counselling during antenatal care 20.9 per cent9.9 HIV testing during antenatal care 28.6 per cent
Sexual behaviour
9.10 Young women who have never had sex 98.5 per cent9.11 Sex before age 15 among young women 0.5 per cent9.12 Age-mixing among sexual partners 6.3 per cent9.13 Sex with multiple partners 0.1 per cent9.15 Sex with non-regular partners 0.8 per cent
PDF compression, OCR, web optimization using a watermarked evaluation copy of CVISION PDFCompressor

6
PDF compression, OCR, web optimization using a watermarked evaluation copy of CVISION PDFCompressor
7VIET NAM MULTIPLE INDICATOR CLUSTER SURVEY 2010–2011
MONITORING THE SITUATION OF CHILDREN AND WOMEN
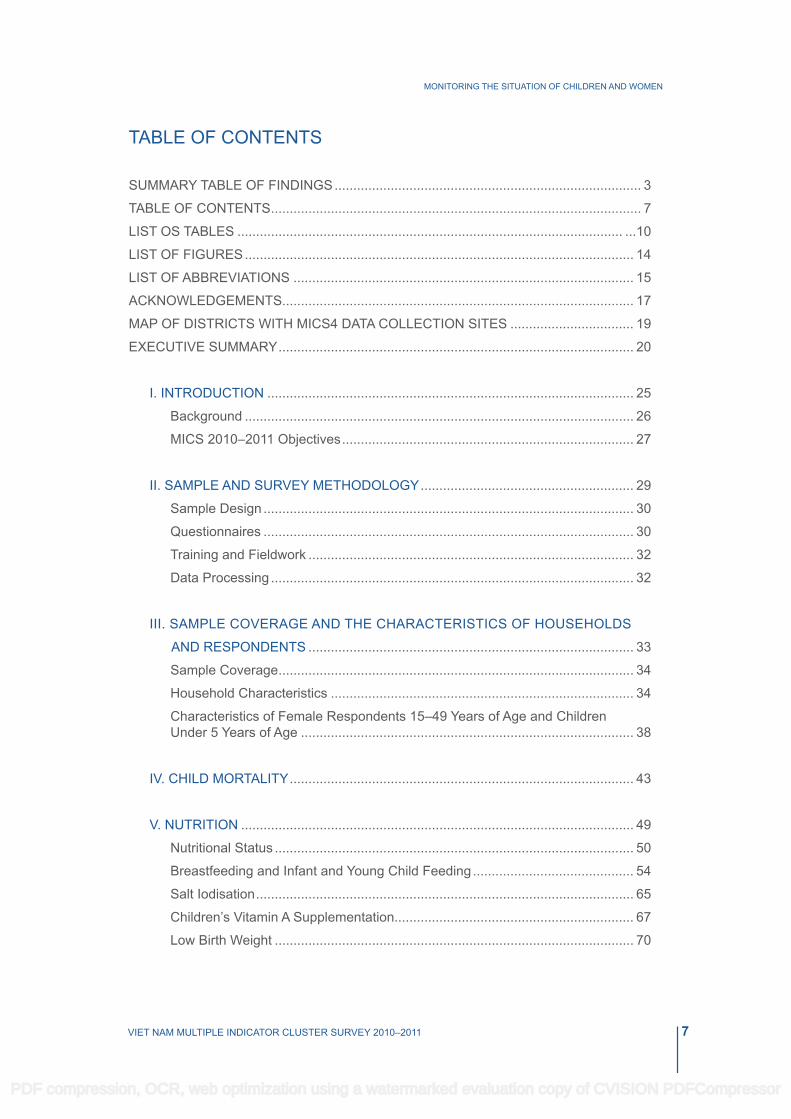
TAbLE OF CONTENTS
SUMMARY TAbLE OF FINDINGS .................................................................................. 3
TAbLE OF CONTENTS ................................................................................................... 7
LIST OS TAbLES ....................................................................................................... ...10
LIST OF FIGURES ........................................................................................................ 14
LIST OF AbbREVIATIONS ........................................................................................... 15
ACkNOWLEDGEMENTS .............................................................................................. 17
MAP OF DISTRICTS WITH MICS4 DATA COLLECTION SITES ................................. 19
ExECUTIVE SUMMARY ............................................................................................... 20
I. INTRODUCTION .................................................................................................. 25
background ........................................................................................................ 26
MICS 2010–2011 Objectives .............................................................................. 27
II. SAMPLE AND SURVEY METHODOLOGY ......................................................... 29
Sample Design ................................................................................................... 30
Questionnaires ................................................................................................... 30
Training and Fieldwork ....................................................................................... 32
Data Processing ................................................................................................. 32
III. SAMPLE COVERAGE AND THE CHARACTERISTICS OF HOUSEHOLDS
AND RESPONDENTS ....................................................................................... 33
Sample Coverage ............................................................................................... 34
Household Characteristics ................................................................................. 34
Characteristics of Female Respondents 15–49 Years of Age and Children Under 5 Years of Age ......................................................................................... 38
IV. CHILD MORTALITY ............................................................................................ 43
V. NUTRITION ......................................................................................................... 49
Nutritional Status ................................................................................................ 50
breastfeeding and Infant and Young Child Feeding ........................................... 54
Salt Iodisation ..................................................................................................... 65
Children’s Vitamin A Supplementation................................................................ 67
Low birth Weight ................................................................................................ 70
PDF compression, OCR, web optimization using a watermarked evaluation copy of CVISION PDFCompressor

8 VIET NAM MULTIPLE INDICATOR CLUSTER SURVEY 2010–2011
MONITORING THE SITUATION OF CHILDREN AND WOMEN
VI. CHILD HEALTH .................................................................................................. 73
Immunization ...................................................................................................... 74
Neonatal Tetanus Protection .............................................................................. 78
Oral Rehydration Treatment ............................................................................... 80
Care Seeking and Antibiotic Treatment of Pneumonia ....................................... 90
Solid Fuel Use .................................................................................................... 95
Malaria ............................................................................................................... 98
VII. WATER, SANITATION AND HYGIENE ........................................................... 107
Use of Improved Water Sources ...................................................................... 108
Use of Improved Sanitation Facilities ................................................................114
Handwashing .................................................................................................... 121
VIII. REPRODUCTIVE HEALTH ............................................................................ 123
Fertility ............................................................................................................. 124
Contraception ................................................................................................... 128
Unmet Need ..................................................................................................... 131
Antenatal Care ................................................................................................. 133
Assistance at Delivery ...................................................................................... 137
Place of Delivery .............................................................................................. 140
IX. CHILD DEVELOPMENT ................................................................................... 143
Early Childhood Education and Learning ......................................................... 144
Early Childhood Development .......................................................................... 150
X. LITERACY AND EDUCATION ........................................................................... 155
Literacy among Young Women ........................................................................ 156
School Readiness ............................................................................................ 156
Primary and Secondary School Participation ................................................... 158
XI. CHILD PROTECTION ...................................................................................... 169
birth Registration .............................................................................................. 170
Child Labour ..................................................................................................... 172
Child Discipline ................................................................................................. 176
Early Marriage and Polygyny ........................................................................... 178
Domestic Violence ............................................................................................ 185
Orphanhood ..................................................................................................... 187
PDF compression, OCR, web optimization using a watermarked evaluation copy of CVISION PDFCompressor

9VIET NAM MULTIPLE INDICATOR CLUSTER SURVEY 2010–2011
MONITORING THE SITUATION OF CHILDREN AND WOMEN
XII. HIV/AIDS AND SEXUAL BEHAVIOUR ............................................................ 189
knowledge about HIV Transmission and Misconceptions about HIV/AIDS ..... 190
Accepting Attitudes toward People Living with HIV/AIDS ................................. 200
knowledge of a Place for HIV Testing, Counselling and Testing during Antenatal Care ................................................................................................ 203
Sexual behaviour Related to HIV Transmission ............................................... 208
APPENDIx A. Sample Design ............................................................................... 215
APPENDIX B. List of Personnel Involved in the Survey ........................................ 219
APPENDIX C. Estimates of Sampling Errors ......................................................... 223
APPENDIX D. Data Quality Tables ........................................................................ 253
APPENDIX E. MICS4 Indicators: Numerators and Denominators ......................... 269
APPENDIX F. Questionnaires ..................................................................................A1
PDF compression, OCR, web optimization using a watermarked evaluation copy of CVISION PDFCompressor
10 VIET NAM MULTIPLE INDICATOR CLUSTER SURVEY 2010–2011
MONITORING THE SITUATION OF CHILDREN AND WOMEN
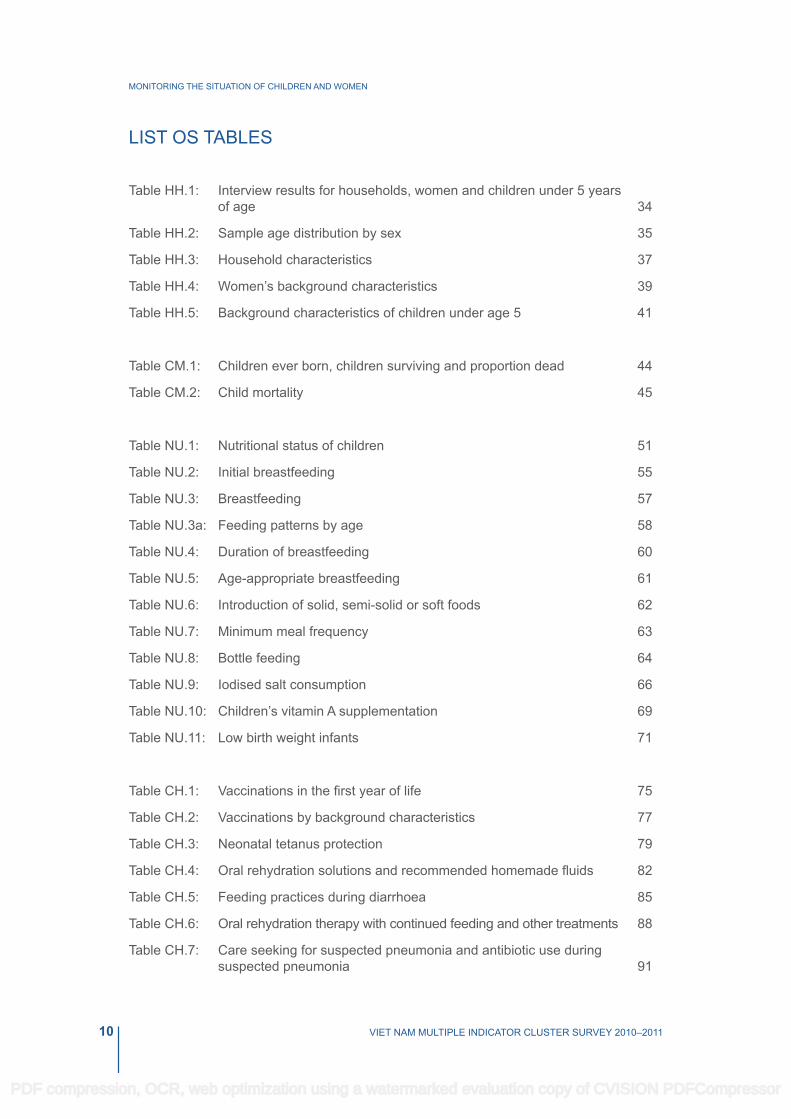
LIST OS TAbLES
Table HH.1: Interview results for households, women and children under 5 years of age 34
Table HH.2: Sample age distribution by sex 35
Table HH.3: Household characteristics 37
Table HH.4: Women’s background characteristics 39
Table HH.5: Background characteristics of children under age 5 41
Table CM.1: Children ever born, children surviving and proportion dead 44
Table CM.2: Child mortality 45
Table NU.1: Nutritional status of children 51
Table NU.2: Initial breastfeeding 55
Table NU.3: Breastfeeding 57
Table NU.3a: Feeding patterns by age 58
Table NU.4: Duration of breastfeeding 60
Table NU.5: Age-appropriate breastfeeding 61
Table NU.6: Introduction of solid, semi-solid or soft foods 62
Table NU.7: Minimum meal frequency 63
Table NU.8: Bottle feeding 64
Table NU.9: Iodised salt consumption 66
Table NU.10: Children’s vitamin A supplementation 69
Table NU.11: Low birth weight infants 71
Table CH.1: Vaccinations in the first year of life 75
Table CH.2: Vaccinations by background characteristics 77
Table CH.3: Neonatal tetanus protection 79
Table CH.4: Oral rehydration solutions and recommended homemade fluids 82
Table CH.5: Feeding practices during diarrhoea 85
Table CH.6: Oral rehydration therapy with continued feeding and other treatments 88
Table CH.7: Care seeking for suspected pneumonia and antibiotic use during suspected pneumonia 91
PDF compression, OCR, web optimization using a watermarked evaluation copy of CVISION PDFCompressor

11VIET NAM MULTIPLE INDICATOR CLUSTER SURVEY 2010–2011
MONITORING THE SITUATION OF CHILDREN AND WOMEN
Table CH.8: Knowledge of the two danger signs of pneumonia 94
Table CH.9: Solid fuel use 96
Table CH.10: Solid fuel use by place of cooking 98
Table CH.11: Household availability of insecticide treated nets and protection by a vector control method 99
Table CH.12: Children sleeping under mosquito nets 100
Table CH.13: Pregnant women sleeping under mosquito nets 101
Table CH.14: Anti-malarial treatment of children with anti-malarial drugs 103
Table CH.15: Malaria diagnostics usage 105
Table WS.1: Use of improved water sources 109
Table WS.2: Household water treatment 112
Table WS.3: Time to source of drinking water 113
Table WS.4: Person collecting water 114
Table WS.5: Use of improved sanitation facilities 116
Table WS.6: Shared use of sanitation facilities 118
Table WS.7: Disposal of child’s faeces 119
Table WS.8: Use of improved water sources and improved sanitation facilities 120
Table WS.9: Water and soap at place for handwashing 121
Table WS.10: Availability of soap 122
Table RH.1: Adolescent birth rate and total fertility rate 125
Table RH.2: Early childbearing 126
Table RH.3: Trends in early childbearing 127
Table RH.4: Use of contraception 129
Table RH.5: Unmet need for contraception 132
Table RH.6: Antenatal care coverage 134
Table RH.7: Number of antenatal care visits 135
Table RH.8: Content of antenatal care 136
Table RH.9: Assistance during delivery 138
Table RH.10: Place of delivery 141
PDF compression, OCR, web optimization using a watermarked evaluation copy of CVISION PDFCompressor
12 VIET NAM MULTIPLE INDICATOR CLUSTER SURVEY 2010–2011
MONITORING THE SITUATION OF CHILDREN AND WOMEN
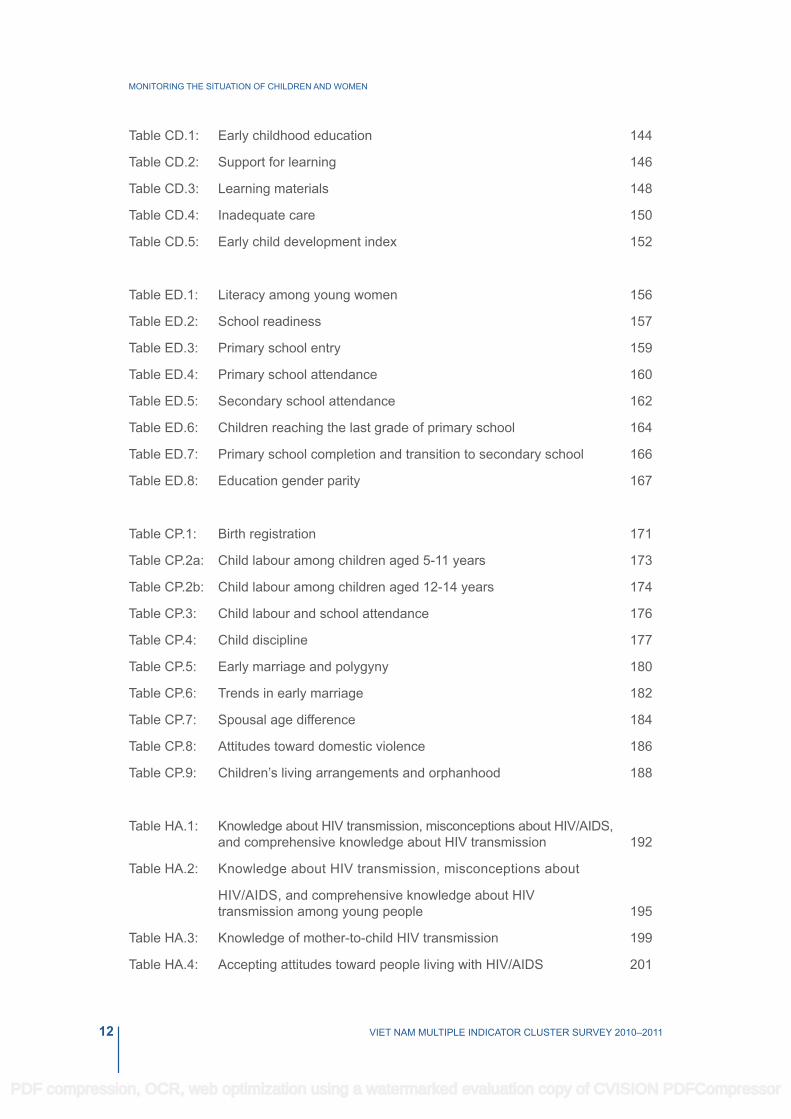
Table CD.1: Early childhood education 144
Table CD.2: Support for learning 146
Table CD.3: Learning materials 148
Table CD.4: Inadequate care 150
Table CD.5: Early child development index 152
Table ED.1: Literacy among young women 156
Table ED.2: School readiness 157
Table ED.3: Primary school entry 159
Table ED.4: Primary school attendance 160
Table ED.5: Secondary school attendance 162
Table ED.6: Children reaching the last grade of primary school 164
Table ED.7: Primary school completion and transition to secondary school 166
Table ED.8: Education gender parity 167
Table CP.1: Birth registration 171
Table CP.2a: Child labour among children aged 5-11 years 173
Table CP.2b: Child labour among children aged 12-14 years 174
Table CP.3: Child labour and school attendance 176
Table CP.4: Child discipline 177
Table CP.5: Early marriage and polygyny 180
Table CP.6: Trends in early marriage 182
Table CP.7: Spousal age difference 184
Table CP.8: Attitudes toward domestic violence 186
Table CP.9: Children’s living arrangements and orphanhood 188
Table HA.1: Knowledge about HIV transmission, misconceptions about HIV/AIDS, and comprehensive knowledge about HIV transmission 192
Table HA.2: Knowledge about HIV transmission, misconceptions about
HIV/AIDS, and comprehensive knowledge about HIV transmission among young people 195
Table HA.3: Knowledge of mother-to-child HIV transmission 199
Table HA.4: Accepting attitudes toward people living with HIV/AIDS 201
PDF compression, OCR, web optimization using a watermarked evaluation copy of CVISION PDFCompressor

13VIET NAM MULTIPLE INDICATOR CLUSTER SURVEY 2010–2011
MONITORING THE SITUATION OF CHILDREN AND WOMEN
Table HA.5: Knowledge of a place for HIV testing 204
Table HA.6: Knowledge of a place for HIV testing among sexually active young women 205
Table HA.7: HIV counselling and testing during antenatal care 207
Table HA.8: Sexual behaviour that increases the risk of HIV infection 209
Table HA.9: Sex with multiple partners 212
Table HA.10: Sex with multiple partners (young women) 213
Table HA.11: Sex with non-regular partners 214
PDF compression, OCR, web optimization using a watermarked evaluation copy of CVISION PDFCompressor
14 VIET NAM MULTIPLE INDICATOR CLUSTER SURVEY 2010–2011
MONITORING THE SITUATION OF CHILDREN AND WOMEN
LIST OF FIGURES
Figure HH.1: Age and sex distribution of household population 36
Figure HH.2: Household composition 38
Figure CM.1: Under five mortality rate by background characteristics 46
Figure CM.2: Trend in under five mortality rates 47
Figure NU.1: Percentage of children under 5 years of age who are undernourished by age in months 53
Figure NU.2: Percentage distribution of children under age 2 across feeding patterns by age group 59
Figure NU.3: Percentage of households consuming adequately iodised salt by region 67
Figure NU.4: Percentage of infants weighing less than 2500 grams at birth by region 72
Figure CH.1: Percentage of children aged 12-23 months who received basic vaccina tions by 12 months 76
Figure CH.2: Percentage of women with a live birth in the last 2 years protected against neonatal tetanus 80
Figure WS.1: Percentage distribution of population by source of drinking water 111
Figure HA.1: Percentage of women aged 15–24 years with comprehensive knowledge about HIV/AIDS by background characteristics 197
Figure HA.2: Percentage of women aged 15–24 years who had sex in the last 12 months with a man 10 or more years older by background characteristics 211
PDF compression, OCR, web optimization using a watermarked evaluation copy of CVISION PDFCompressor

15VIET NAM MULTIPLE INDICATOR CLUSTER SURVEY 2010–2011
MONITORING THE SITUATION OF CHILDREN AND WOMEN
LIST OF AbbREVIATIONS
AIDS Acquired Immune Deficiency Syndrome
BCG Bacillus-Calmette-Guerin (Tuberculosis)
CSPro Census and Survey Processing System
DPT Diphtheria Pertussis Tetanus
EA Enumeration Area
ECDI Early Child Development Index
EPI Expanded Programme on Immunization
GPI Gender Parity Index
GSO General Statistics Office
HIV Human Immunodeficiency Virus
IDD Iodine Deficiency Disorders
ILO International Labour Organization
IRS Indoor Residual Spraying
ITN Insecticide Treated Net
IUD Intrauterine Device
LAM Lactational Amenorrhea Method
MDG Millennium Development Goals
MICS Multiple Indicator Cluster Survey
MOH Ministry of Health
NAR Net Attendance Rate
ORT Oral Rehydration Treatment
ppm Parts Per Million
SESD Social and Environmental Statistics Department
SPSS Statistical Package for Social Sciences
UNAIDS United Nations Programme on HIV/AIDS
UNDP United Nations Development Programme
UNFPA United Nations Population Fund
UNGASS United Nations General Assembly Special Session on HIV/AIDS
UNICEF United Nations Children’s Fund
WFFC World Fit For Children
WHO World Health Organization
PDF compression, OCR, web optimization using a watermarked evaluation copy of CVISION PDFCompressor

16
PDF compression, OCR, web optimization using a watermarked evaluation copy of CVISION PDFCompressor

17VIET NAM MULTIPLE INDICATOR CLUSTER SURVEY 2010–2011
MONITORING THE SITUATION OF CHILDREN AND WOMEN
ACkNOWLEDGEMENTS
The Viet Nam Multiple Indicator Cluster Survey 2010–2011 was conducted by the General Statistics Office (GSO) in collaboration with the Ministry of Health (MOH) and the Ministry of Labour, Invalids and Social Affairs (MOLISA), with financial and technical support from UNICEF and financial support from UNFPA. The Viet Nam Multiple Indicator Cluster Survey 2010–2011 is the fourth round of Multiple Indicator Cluster Surveys (MICS4) in Viet Nam. The three previous MICS surveys were conducted in 1996 (MICS1), 2000 (MICS2), and 2006 (MICS3).
The current survey was designed to collect information on a large number of indicators that cover a broad range of issues affecting the health, development and living conditions of Vietnamese women and children. This information is essential to monitor the goals and targets of the Millennium Declaration, the World Fit for Children Declaration and Action Plan, as well as the National Programme of Action for Children 2011–2020. The survey will serve as an up-to-date source of information on the situation of children and women and will be of substantial use for reporting on Viet Nam’s international commitments on children, such as the A World Fit for Children End-decade Assessment and the 5th National Report on the implementation of the Convention on the Rights of the Child.
Under the leadership of the MICS4 Steering Committee, including GSO, UNICEF and UNFPA, the organisation of the survey, data collection, processing and report writing was carried out by GSO staff, in close collaboration with professionals and staff from relevant government ministries/agencies and UNICEF. We would like to acknowledge the technical and financial support provided by UNICEF Viet Nam, Headquarters and the Asia Pacific Shared Service Centre, in particular the provision of training, guidance and template data collection and analysis tools.
We would like to express our sincere gratitude to specialists and experts from relevant government ministries and agencies, including GSO, Ministry of Education and Training, Ministry of Health, Ministry of Labour, Invalids and Social Affairs; UNICEF, UNFPA, UNDP, UNESCO, ILO and WHO; and some non-governmental organisations (NGOs) for their valuable advice and comments during the organisation of the survey, questionnaire development and report writing. We would also like to thank all the local authorities involved, particularly the People’s Committees of the selected communes.
A special note of thanks goes to all the interviewers, supervisors and other participants in the survey for their hard work and long working hours committed to completing all the steps of the survey from its initial design to the dissemination of its findings. This includes the 30 fieldwork teams traveling nation-wide for almost two months to complete the data collection in a timely and professional manner.
We would like to express our genuine thankfulness to all households who participated in the survey and their willingness to give their time to provide valuable information about their private lives. Without their collaboration this survey would not have been possible.
We are grateful for the continuous active cooperation from all national as well as international agencies, organisations and individuals for the benefit of Viet Nam’s children.
LottaSylwanderRepresentative, UNICEF Viet Nam
Do ThucDirector General, General Statistics Office
PDF compression, OCR, web optimization using a watermarked evaluation copy of CVISION PDFCompressor

18
PDF compression, OCR, web optimization using a watermarked evaluation copy of CVISION PDFCompressor

19VIET NAM MULTIPLE INDICATOR CLUSTER SURVEY 2010–2011
MONITORING THE SITUATION OF CHILDREN AND WOMEN
MAP OF DISTRICTS WITH MICS4 DATA COLLECTION SITES
Red River Delta
Northern Midlands and Mountain areas
North Central area and Central Coastal area
Central Highlands
South East
Mekong River Delta
Districts with MICS4 Enumeration Areas, by region
Districts with no Enumeration Areas
Note: The boundaries and the names shown the designations used on these maps do not imply official endorsement or acceptance by the United Nations.
PDF compression, OCR, web optimization using a watermarked evaluation copy of CVISION PDFCompressor

20 VIET NAM MULTIPLE INDICATOR CLUSTER SURVEY 2010–2011
MONITORING THE SITUATION OF CHILDREN AND WOMEN
ExECUTIVE SUMMARY
The Viet Nam Multiple Indicator Cluster Survey (MICS4) was conducted from December 2010 to January 2011 by the General Statistics Office of Viet Nam, in collaboration with the Ministry of Health (MOH) and the Ministry of Labour, Invalids and Social Affairs (MOLISA). Financial and technical support for the survey was provided by the United Nations Children’s Fund (UNICEF) and financial support was provided by the United Nations Population Fund (UNFPA) in Viet Nam.
MICS4 provides valuable information and the latest evidence on the situation of children and women in Viet Nam, updating information from the previous 2006 Viet Nam MICS survey as well as earlier data collected in the first two MICS rounds carried out in 1996 and 2000.
The survey presents data from an equity perspective by indicating disparities by sex, region, area, ethnicity, living standards and other characteristics. MICS4 is based on a sample of 11,614 households interviewed and provides a comprehensive picture of children and women in Viet Nam’s six regions.
Child MortalityIn the Viet Nam MICS4 survey, child mortality rates are calculated based on an indirect estimation technique known as the Brass method. According to the survey results, the under-five mortality rate in Viet Nam is 16 per 1,000 live births and the infant mortality rate is 14 per 1,000 live births. Substantial disparities exist along the dimensions of ethnicity and living standards: ethnic minority children are three times as likely as kinh/Hoa1 children to die before their first and fifth birthdays; and children in the poorest households are twice as likely to die before reaching 1 and 5 years of age compared to children living in better off families.
Nutritional Status and breastfeedingDuring MICS4 data collection, the weights and heights of all children under 5 years of age in the sample households were measured using anthropometric equipment recommended by UNICEF (see www.childinfo.org). These measurements show that 11.7 per cent of Vietnamese children are underweight (weight-for-age malnourished), 22.7 per cent are stunted (height-for-age malnourished), and 4.1 per cent are wasted (weight-for-height malnourished). There are large disparities between urban and rural areas, between Kinh/Hoa and ethnic minority children, between different wealth quintiles and by mother’s education level. At the same time, 4.4 per cent of children in Viet Nam are overweight.
Only two in five children in Viet Nam (39.7 per cent) start breastfeeding at the correct time (i.e. within one hour of birth) and less than one in five children (17 per cent) are exclusively breastfed until 6 months of age. Exclusive breastfeeding is highest in the Northern Midlands and Mountain areas at 37.6 per cent.
More than four in five children (83.4 per cent) aged 6 to 59 months received a high dose of vitamin A supplementation within the six months prior to the MICS4 survey.
1 In MICS4, the Chinese (Hoa) ethnic minority is grouped together with the Kinh majority under the label Kinh/Hoa, for reason that Kinh and Hoa have similar living standards. All other ethnicities are grouped together under the label Ethnic Minorities.
PDF compression, OCR, web optimization using a watermarked evaluation copy of CVISION PDFCompressor

21VIET NAM MULTIPLE INDICATOR CLUSTER SURVEY 2010–2011
MONITORING THE SITUATION OF CHILDREN AND WOMEN
Roughly 93 per cent of children below two years of age were weighed at birth and only 5.1 per cent were born with low weight.
Adequately iodised salt, defined as containing 15 or more particles per million (15+ ppm), is used in less than half of all households (45.1 per cent) with the consumption pattern showing considerable regional differences. This is far below global standards: The World Health Organization (WHO) and UNICEF recommend Universal Salt Iodisation as a safe, cost-effective and sustainable strategy to ensure sufficient intake of iodine, meaning that at least 90 per cent of households must consume adequately iodised salt.
ImmunizationTwo out of five children (40.1 per cent) between 1 and 2 years of age have received all recommended vaccinations – notably bCG, three doses of polio, measles, three doses of DPT (or Pentavalent), and three doses of hepatitis b (or Pentavalent). However, an immunization card could be presented for only half of these children. The immunization coverage for DPT and polio drops considerably between the first and the third doses: by 20 percentage points for DPT, and by 23 percentage points for polio. The lowest coverage was observed for the hepatitis B birth dose (it is not included in the full immunization indicator). In particular, only 18.2 per cent of ethnic minority children have received the hepatitis B birth dose, and only 18.5 per cent of children of mothers with no education have received it.
Almost four of five mothers who gave birth within two years prior to the survey were adequately protected against neonatal tetanus (77.5 per cent). Yet among ethnic minority women, only three in five mothers had received this protection (59.2 per cent).
Care of IllnessReported prevalence of diarrhoea among children under 5 during the two weeks preceding the survey stood at 7.4 per cent during the two weeks preceding the survey. Among these children, 46.5 per cent had received oral rehydration salt (ORS) solution, 42.8 per cent had reported home management of diarrhoea with recommended fluids, and 65.6 per cent had received either ORS or another recommended homemade fluid.
Approximately 3.3 per cent of children under 5 years of age showed symptoms of pneumonia in the two weeks preceding the survey. Of these, 73 per cent were taken to an appropriate provider and 68.3 per cent were treated with antibiotics. Only one in twenty mothers and caregivers (5 per cent) are aware of the danger signs of pneumonia.
The use of solid fuels as a main source of energy for domestic cooking stands at 46.4 per cent. Ethnic minority households are twice as likely as Kinh/Hoa households to use these health-damaging fuels for cooking purposes (89.5 versus 40.5 per cent).
Malaria PreventionViet Nam is considered a low malaria prevalence country. Almost all households in Viet Nam (95.5 per cent) have at least one mosquito net, yet almost none have long-lasting insecticide-treated nets (0.4 per cent). The percentage of children under age 5 and the percentage of pregnant women who slept under a mosquito net during the night prior to the survey was 94.4 and 94.1 per cent, respectively.
Water and SanitationAccording to the survey, 92 per cent of the population in Viet Nam use improved drinking water sources, though only 68.4 per cent of the ethnic minority population use such sources. Some 12.4 per cent of the population that do not use improved drinking water sources do
PDF compression, OCR, web optimization using a watermarked evaluation copy of CVISION PDFCompressor

22 VIET NAM MULTIPLE INDICATOR CLUSTER SURVEY 2010–2011
MONITORING THE SITUATION OF CHILDREN AND WOMEN
not use any form of water treatment. Among those who use water trealment, boiling the water is the most common treatment method used in 84 per cent of the population with unimproved drinking water sources. Some 89.5 per cent of the population using improved drinking water sources and 5.1 per cent of the population using unimproved drinking water sources have a water source directly on their premises.
Overall, less than three in four Vietnamese use improved sanitation facilities (73.8 per cent), though among ethnic minorities only half use such facilities (44.2 per cent). Open defecation is not widespread in Viet Nam: only 6.4 per cent of the population practice it. However, this percentage increases to 27.7 per cent among ethnic minorities, meaning that one in every four Vietnamese living in ethnic minority households defecate in the open. In addition, the faeces of two in five children under the age of 2 are disposed of in an unsafe manner (39.9 per cent);among ethnic minorities this is common practice for four in five children (78.5 per cent).
The survey results indicate that 86.6 per cent of Vietnamese households have a place for hand washing that includes water and soap. This percentage is higher in urban (93.4 per cent) than in rural (83.7 per cent) areas, and higher among Kinh/Hoa (88.7per cent) than ethnic minority (67.1 per cent) households.
Reproductive HealthThe Total Fertility Rate (TFR) in Viet Nam is 2, meaning that a Vietnamese woman, by the end of her reproductive years, will have given birth to an average of two children. Early childbearing is relatively rare, with 7.5 per cent of women aged 15-19 having begun childbearing. About three in four women aged 15-49 who are currently married or in a union use any form of contraception (77.8 per cent). Of these, 59.8 per cent use modern methods and 17.9 per cent use traditional methods. The use of contraceptives – modern or traditional – among young women aged 15–19 that are married or in union is low, at 21 per cent. The unmet need for contraception is low among women aged 15-49 (4.3 per cent), but increases to 15.6 per cent among young women aged 15-19.
The survey results show that 93.7 per cent of women aged 15–49 who gave birth in the two years preceding the survey received antenatal care from skilled personnel at least once, and 59.6 per cent had the recommended four antenatal care visits. A total of 92.4 per cent of all deliveries took place in health facilities. Considerable disparities emerge by ethnicity: virtually all women in Kinh/Hoa households delivered in a health facility (98.3 per cent) compared to three in five women (61.7 per cent) from ethnic minority households.
Early Childhood DevelopmentAlmost three in four children aged 3-5 years receive early childhood education (71.9 per cent), and an even higher proportion (76.8 per cent) of children aged 3-5 years had adults engage with them in four or more activities that promote learning and school readiness during the three days prior to the survey. However, only one in five children under 5 have three or more children’s books at home (19.6 per cent).
One in ten children under 5 were left under inadequate care sometime during the week preceding the survey (9.4 per cent), meaning that they were either left alone or in the care of another child under the age of 10.
The child development index score is 82.8 in Viet Nam. The score is calculated based on the percentage of children aged 3-5 years who are developmentally on track in at least three of the following four domains: literacy/numeracy, physical, social/emotional and learning.
PDF compression, OCR, web optimization using a watermarked evaluation copy of CVISION PDFCompressor
23VIET NAM MULTIPLE INDICATOR CLUSTER SURVEY 2010–2011
MONITORING THE SITUATION OF CHILDREN AND WOMEN
EducationOverall literacy among Vietnamese women aged 15–24 years is high, at 96.4 per cent. However, the literacy rate drops to 82.3 per cent among ethnic minority women, meaning that almost one in every five women living in an ethnic minority household do not know how to read and write.
Primary school attendance is high, and there is virtually no difference between boys and girls or between Kinh/Hoa and ethnic minority children. Secondary school attendance, meanwhile, reveals both gender and ethnic disparities: the attendance rate is 78.3 per cent for boys and 83.9 per cent for girls, and 66.3 per cent for ethnic minority boys and 65 per cent for ethnic minority girls. Overall, one in every three ethnic minority children do not receive secondary education, compared with one in every five Kinh/Hoa children (34.4 versus 16.3 per cent).
Child ProtectionBirth registration in Viet Nam is almost universal, with 95 per cent of children under the age of 5 reported to have had their births registered. Yet only 66.1 per cent of birth certificates were seen by survey workers.
The survey indicates that 9.5 per cent of children aged 5-14 years are engaged in child labour2 activities. The majority of child labourers also attend school (83.4 per cent).
More than half of all children aged 2-14 years in Viet Nam have experienced some form of physical discipline (55 per cent). This contrasts with the relatively limited belief, held by 17.2 per cent of mothers and caregivers, that children need to be physically punished. Approximately 5.3 per cent of children aged 0-17 years are not living with either biological parent, and for 3.9 per cent of children one or both parents have died.
Approximately one in three Vietnamese women (35.8 per cent) agree that it is acceptable for husbands to physically punish their wife for various reasons. Large disparities emerge by living standards and ethnicity: women living in the poorest households are twice as likely as those in the richest households to accept wife beating (48.8 versus 20.1 per cent), and almost every second ethnic minority woman shows an accepting attitude, compared to one in three Kinh/Hoa women (47.2 versus 34.3 per cent). More than one in every ten women (12.3 per cent) aged 20–49 got married before the age of 18.
HIV and AIDSNearly all young women aged 15-24 have heard of HIV (96.5 per cent), yet only one in two women of the same age group (51.1 per cent) have a comprehensive knowledge of HIV, meaning they can correctly identify two ways of preventing HIV infection; know that a healthy looking person can have HIV; and reject the two most common misconceptions about HIV transmission. Almost all women aged 15-49 know that HIV can be transmitted from mother to child (92.4 per cent).
More than three in five young women aged 15-24 know a place where they can be tested for HIV (60.7 per cent), and around one in three women have been tested (32.1 per cent).
2 Please refer to the Child Protection Chapter (Chapter XI.) for the definition of child labour used in this report.
PDF compression, OCR, web optimization using a watermarked evaluation copy of CVISION PDFCompressor

24 VIET NAM MULTIPLE INDICATOR CLUSTER SURVEY 2010–2011
MONITORING THE SITUATION OF CHILDREN AND WOMEN
The percentage of young women aged 15-24 who have been tested for HIV in the last 12 months is 16.2 per cent and the percentage of women who have been told the result is 7.9 per cent.
About one third of women aged 15-49 who received antenatal care during their last pregnancy were tested for HIV (36.1 per cent). Important disparities emerge by area of residence: women living in urban areas are twice as likely to have been tested compared to women living in rural areas (56.4 versus 27.7 per cent).
Sexual behaviour that increases risk of HIV transmission (such as sex with multiple partners, sex with non-regular partners, sex before marriage, and sex before age 15) is very limited among women in Viet Nam.
PDF compression, OCR, web optimization using a watermarked evaluation copy of CVISION PDFCompressor

25VIET NAM MULTIPLE INDICATOR CLUSTER SURVEY 2010–2011
MONITORING THE SITUATION OF CHILDREN AND WOMEN
I. INTRODUCTION
PDF compression, OCR, web optimization using a watermarked evaluation copy of CVISION PDFCompressor
26 VIET NAM MULTIPLE INDICATOR CLUSTER SURVEY 2010–2011
MONITORING THE SITUATION OF CHILDREN AND WOMEN
background This report is based on the Viet Nam Multiple Indicator Cluster Survey, conducted from December 2010 to January 2011 by the General Statistics Office of Viet Nam in collaboration with the Ministry of Health (MOH) and the Ministry of Labour, Invalids and Social Affairs (MOLISA). Financial and technical support was provided by the United Nations Children’s Fund (UNICEF) and financial support was provided by the United Nations Population Fund (UNFPA). The survey provides valuable information on the situation of children and women in Viet Nam, and was based, in large part, on the needs to monitor progress towards goals and targets emanating from international agreements: the Millennium Declaration, adopted by all 191 United Nations Member States in September 2000, and the Declaration and Plan of Action of A World Fit For Children, adopted by 189 Member States at the United Nations Special Session on Children in May 2002. These commitments build upon promises made by the international community at the 1990 World Summit for Children.
In signing these international agreements, governments committed themselves to improving conditions for their children and to monitoring progress towards that end. UNICEF was assigned a supporting role in this task (see table below).
A Commitment to Action: National and International Reporting Responsibilities
The governments that signed the Millennium Declaration and the World Fit for Children Declaration and Plan of Action also committed themselves to monitoring progress towards the goals and objectives they contained:
“We will monitor regularly at the national level and, where appropriate, at the regional level and assess progress towards the goals and targets of the present Plan of Action at the national, regional and global levels. Accordingly, we will strengthen our national statistical capacity to collect, analyse and disaggregate data, including by sex, age and other relevant factors that may lead to disparities, and support a wide range of child-focused research. We will enhance international cooperation to support statistical capacity-building efforts and build community capacity for monitoring, assessment and planning.” (A World Fit for Children, paragraph 60)
“…We will conduct periodic reviews at the national and subnational levels of progress in order to address obstacles more effectively and accelerate actions.…” (A World Fit for Children, paragraph 61)
The Plan of Action (paragraph 61) also calls for the specific involvement of UNICEF in the preparation of periodic progress reports:
“… As the world’s lead agency for children, the United Nations Children’s Fund is requested to continue to prepare and disseminate, in close collaboration with Governments, relevant funds, programmes and the specialized agencies of the United Nations system, and all other relevant actors, as appropriate, information on the progress made in the implementation of the Declaration and the Plan of Action.”
Similarly, the Millennium Declaration (paragraph 31) calls for periodic reporting on progress:
“…We request the General Assembly to review on a regular basis the progress made in implementing the provisions of this Declaration, and ask the Secretary-General to issue periodic reports for consideration by the General Assembly and as a basis for further action.”
PDF compression, OCR, web optimization using a watermarked evaluation copy of CVISION PDFCompressor

27VIET NAM MULTIPLE INDICATOR CLUSTER SURVEY 2010–2011
MONITORING THE SITUATION OF CHILDREN AND WOMEN
MICS 2010–2011 updates the Viet Nam MICS 2006 data and comes at an important time for evaluating the National Programme of Action for Children 2001–2010 and for preparing and monitoring the next Programme for 2011–2020. Based on an actual sample of 11,614 households, the survey provides a comprehensive picture of children and women in Viet Nam across the six regions, and from an equity approach, it indicates disparities by sex, area, ethnicity, education, living standards and other characteristics.
The results of the Viet Nam MICS 2010–2011 are presented in this final report.
MICS 2010–2011 ObjectivesThe primary objectives of the Viet Nam Multiple Indicator Cluster Survey 2010–2011 are:
● To provide up-to-date information for assessing the situation of children and women in Viet Nam;
● To furnish data needed for monitoring progress towards goals established in the Viet Nam National Programme of Action (NPA) for Children for the period 2001–2010, the Millennium Declaration (MD), the Convention on the Rights of the Child (CRC), and other national and international commitments as well as to provide information for developing the National Programme of Action for Children for the period 2011–2020
● To generate data for the identification of vulnerable groups, inequities and disparities, as a basis for informing policies and interventions;
● To contribute to the improvement of data and monitoring systems in Viet Nam and to strengthen technical expertise in survey design, implementation and analysis;
PDF compression, OCR, web optimization using a watermarked evaluation copy of CVISION PDFCompressor

28
PDF compression, OCR, web optimization using a watermarked evaluation copy of CVISION PDFCompressor

29VIET NAM MULTIPLE INDICATOR CLUSTER SURVEY 2010–2011
MONITORING THE SITUATION OF CHILDREN AND WOMEN
II. SAMPLE AND SURVEY METHODOLOGY
PDF compression, OCR, web optimization using a watermarked evaluation copy of CVISION PDFCompressor

30 VIET NAM MULTIPLE INDICATOR CLUSTER SURVEY 2010–2011
MONITORING THE SITUATION OF CHILDREN AND WOMEN
Sample DesignThe sample for the Viet Nam Multiple Indicator Cluster Survey (MICS) was designed to provide estimates for a large number of indicators on the situation of children and women at the national level, for urban and rural areas, and for Viet Nam’s six regions: Red River Delta, Northern Midland and Mountain areas, North Central area and Central Coastal area, Central Highlands, South East and Mekong River Delta. The urban and rural areas within each region were identified as the main sampling strata and the sample was selected in two stages. Within each stratum, a specified number of census enumeration areas were selected systematically with probability proportional to size. After the updating of household lists was carried out within the selected enumeration areas, a systematic sample of 20 households was drawn in each sample enumeration area. Two of the selected enumeration areas were not included in the survey as they no longer existed at the time of the survey fieldwork. The sample was stratified by region, urban and rural areas, and is not self-weighting. For reporting national level results, sample weights are used. A more detailed description of the sample design can be found in Appendix A.
QuestionnairesThree sets of questionnaires were used in the survey: 1) a household questionnaire which was used to collect information on all de jure household members (usual residents), the household, and the dwelling; 2) a woman questionnaire administered in each household to all women aged 15–49 years; and 3) a children underfive questionnaire, administered to mothers or caregivers of all children under 5 years of age living in the household. The questionnaires included the following contents:
The household questionnaire, administered to a knowledgeable adult living in the household, included the following modules:
● Household Listing Form
● Education
● Water and Sanitation
● Household Characteristics
● Insecticide Treated bednets
● Indoor Residual Spraying
● Child Labour
● Child Discipline
● Handwashing
● Salt Iodisation
The questionnaire for women was administered to all women aged 15–49 years living in the households, and included the following modules:
● Woman’s background
● Child Mortality
● Desire for Last birth
PDF compression, OCR, web optimization using a watermarked evaluation copy of CVISION PDFCompressor

31VIET NAM MULTIPLE INDICATOR CLUSTER SURVEY 2010–2011
MONITORING THE SITUATION OF CHILDREN AND WOMEN
● Maternal and Newborn Health
● Illness Symptoms
● Contraception
● Unmet Need
● Attitudes Towards Domestic Violence
● Marriage/Union
● Sexual behaviour
● HIV/AIDS
The questionnaire for children under 5 years of age was administered to mothers or caregivers of all children under 5 years of age3 living in the households. Normally, the questionnaire was administered to mothers of these children. In cases when the mother was not listed in the household roster, a primary caregiver for the child was identified and interviewed. The questionnaire included the following modules:
● Age
● birth Registration
● Early Childhood Development
● breastfeeding
● Care of Illness
● Malaria
● Immunization
● Anthropometry
The questionnaires are based on the MICS4 model questionnaire.4 From the English version of the MICS4 model, the questionnaires were translated into Vietnamese and were pre-tested in Hoa Binh province (in the Northern Midland and Mountain areas) and Binh Dinh province (in the North Central area and Central Coastal area) from 26 September to 6 October 2010. Based on the results of the pre-test, modifications were made to the wording and translation of the questionnaires. The questionnaires were revised and printed after the first training for the southern provinces in Can Tho city. A copy of the Viet Nam MICS4 questionnaires is provided in Appendix F.
In addition to the administration of questionnaires, the fieldwork teams tested the iodine content of salt used for cooking in the households, observed the place for hand washing and measured the weights and heights of children age under 5 years of age. Details and findings of these measurements are provided in the respective sections of the report.
3 The terms “children under age 5”, “children aged 0–4 years”, and “children aged 0–59 months” are used interchangeably in this report.4 The model MICS4 questionnaires can be found at www.childinfo.org
PDF compression, OCR, web optimization using a watermarked evaluation copy of CVISION PDFCompressor
32 VIET NAM MULTIPLE INDICATOR CLUSTER SURVEY 2010–2011
MONITORING THE SITUATION OF CHILDREN AND WOMEN
Training and FieldworkGSO conducted two training courses for interviewers, measurers, field data editors, team leaders and supervisors. About 250 field workers participated. One training was conducted in Can Tho city for the participants from the Southern provinces, and another in Ha Noi for those from the Northern provinces. Each training course lasted 14 days: the Can Tho training was conducted from 25 October to 7 November 2010 and the Ha Noi training from 8 November to 21 November 2010. The training included sessions on interviewing techniques and the contents of the questionnaires, and mock interviews between trainees to gain practice in asking questions. Towards the end of the training period, trainees spent two days in practice, interviewing, taking anthropometric measurements, editing and supervising. Before the field practice (pilot-test) the trainees spent one day practicing anthropometric measurements in a kindergarten.
Some 180 persons were selected for the fieldwork. They were grouped into 30 survey teams, each comprised of three interviewers, one measurer, one field data editor and one team leader acting as a supervisor. Fieldwork began on 29 November 2010 and was concluded on 26 January 2011. Fieldwork monitoring was conducted at three levels to ensure quality and allow timely corrective action as necessary, notably: supervision by GSO, UNICEF and UNFPA, technical supervision from the National Steering Committee, and supervision by the team leaders. Supervisors are experts with technical knowledge who are able to take corrective action and resolve emerging issues that arise during the fieldwork.
Data ProcessingData were entered using CSPro software on eight small computers. Ten operators working in shifts performed data entry under supervision of two data entry supervisors. In order to ensure quality control, all questionnaires were double entered and internal consistency checks were performed. Procedures and standard programs developed under the global MICS4 programme and adapted to the Viet Nam questionnaire were used throughout. Data processing began on 27 December 2010 and was completed on 21 March 2011. Data were analysed using the Statistical Package for Social Sciences (SPSS) software program, Version 19. The model syntax and tabulation plans developed by UNICEF were used for this purpose.
PDF compression, OCR, web optimization using a watermarked evaluation copy of CVISION PDFCompressor

33VIET NAM MULTIPLE INDICATOR CLUSTER SURVEY 2010–2011
MONITORING THE SITUATION OF CHILDREN AND WOMEN
III. SAMPLE COVERAGE AND THE CHARACTERISTICS
OF HOUSEHOLDS AND RESPONDENTS
PDF compression, OCR, web optimization using a watermarked evaluation copy of CVISION PDFCompressor

34 VIET NAM MULTIPLE INDICATOR CLUSTER SURVEY 2010–2011
MONITORING THE SITUATION OF CHILDREN AND WOMEN
Sample CoverageOf the 12,000 households selected for the sample, 11,642 were present at the time of the survey. Of these, 11,614 successfully completed the interview, resulting in a household response rate of 99.8 per cent. In the interviewed households, 12,115 women (aged 15–49 years) were identified. Of these, 11,663 completed the interview, yielding a response rate of 96.3 per cent compared to eligible respondents in interviewed households. In addition, 3,729 children under 5 years were listed in the household questionnaire. Questionnaires were completed for 3,678 of these children, which corresponds to a response rate of 98.6 per cent within interviewed households. The overall response rates (household response rate times the woman and child response rates within households) were 96 and 98.4 per cent for the survey of women and of children under 5 years of age, respectively (Table HH.1).
Table HH.1: Interview results for households, women and children under 5 years of age
Interview outcomes and response rates for households, women, and children under 5 years of age by area and region, Viet Nam, 2010–2011
Area Region
Urban Rural
Red River Delta
Northern Midlands
and Mountain
areas
North Central
area and Central Coastal
areaCentral
HighlandsSouth East
Mekong River Delta Total
Households Sampled 5200 6800 2000 2000 2000 2000 2000 2000 12000Present 5016 6626 1912 1961 1947 1960 1930 1932 11642
Interviewed 5001 6613 1907 1955 1943 1956 1928 1925 11614Response rate 99.7 99.8 99.7 99.7 99.8 99.8 99.9 99.6 99.8
Women
Eligible 5364 6751 1739 2053 1942 2176 2168 2037 12115Interviewed 5183 6480 1682 1970 1868 2078 2116 1949 11663Response rate 96.6 96 96.7 96 96.2 95.5 97.6 95.7 96.3Overall response rate 96.3 95.8 96.5 95.7 96 95.3 97.5 95.3 96
Children under five Eligible 1438 2291 555 722 552 734 585 581 3729Mothers/caregivers interviewed 1409 2269 543 712 548 727 581 567 3678
Response rate 98 99 97.8 98.6 99.3 99 99.3 97.6 98.6Overall response rate 97.7 98.8 97.6 98.3 99.1 98.8 99.2 97.2 98.4
Table HH.1 shows that there were no large differences in response rates across regions and urban/rural areas. This is the result of the collective effort of all survey teams, who overcame difficulties in the field and used every opportunity to visit household members at all times, whether day or night.
Household CharacteristicsThe weighted age and sex distribution of the survey sample is provided in Table HH.2. The distribution is also used to produce the population pyramid in Figure HH.1. The 11,614 households that completed interviews in the survey yielded a list of 43,998 household members. Of these, 21,559 were male (49 per cent) and 22,439 were female (51 per cent). According to the 2009 Viet Nam Population and Housing Census the sex distribution of the overall population was 49.5 per cent male and 50.5 per cent female.
PDF compression, OCR, web optimization using a watermarked evaluation copy of CVISION PDFCompressor

35VIET NAM MULTIPLE INDICATOR CLUSTER SURVEY 2010–2011
MONITORING THE SITUATION OF CHILDREN AND WOMEN
Table HH.2: Sample age distribution by sex
Frequency and percentage of the population by sex and five-year age group, dependent age groups, and by child (aged 0–17 years) and adult populations (aged 18 or older), Viet Nam, 2010–2011
Males Females Total
Number Percentage Number Percentage Number Percentage
Age (years)
0-4 1867 8.7 1802 8 3668 8.3
5-9 1928 8.9 1778 7.9 3706 8.4
10-14 1984 9.2 1821 8.1 3805 8.615-19 1881 8.7 1776 7.9 3657 8.320-24 1582 7.3 1663 7.4 3245 7.425-29 1746 8.1 1814 8.1 3560 8.130-34 1648 7.6 1786 8 3435 7.835-39 1753 8.1 1646 7.3 3398 7.740-44 1545 7.2 1603 7.1 3148 7.245-49 1518 7 1447 6.4 2965 6.750-54 1244 5.8 1522 6.8 2767 6.355-59 877 4.1 1030 4.6 1907 4.360-64 663 3.1 794 3.5 1457 3.365-69 406 1.9 488 2.2 893 270-74 376 1.7 530 2.4 906 2.175-79 222 1 362 1.6 584 1.380-84 184 0.9 317 1.4 501 1.185+ 136 0.6 259 1.2 395 0.9
Dependency age groups 0-14 5778 26.8 5401 24.1 11180 25.415-64 14457 67.1 15081 67.2 29539 67.165+ 1324 6.1 1956 8.7 3280 7.5
Child and adult population Children aged 0-17
years 7002 32.5 6593 29.4 13594 30.9
Adults aged 18+ years 14558 67.5 15846 70.6 30404 69.1Total 21559 100 22439 100 43998 100
Table HH.2 shows the age-sex structure of the household population. The proportions in child, working and old-age age groups (0–14, 15–64 and 65 years and over) in the household population of the MICS 2010–2011 sample are 25.4, 67.1 and 7.5 per cent, respectively. The corresponding proportions in the Census are 25.0, 68.4 and 6.6 per cent, respectively.5 Census data indicate that the proportion of the male population in the five-year age groups from 0–4 to 15–19 years is higher than in the female population, but a reverse pattern is observed from the age groups 50–54 years and above, where the share of the male population is lower than female. MICS4 2010–2011 data indicate a similar age-sex pattern, with males accounting for a higher proportion of the population in the younger age groups (0–17 years) while males account for a smaller share among adults (18 years old and above). A slight reversal is observed in the downward trend of population share by age groupamong women at the age group 45–49 years old, with a corresponding increase in the next age group of 50–54 years old. This slight drop and increase might be explained by some interviewers’ tendency of transferring women from one age group (reproductive age) to the next age group (non-reproductive), in order to make women ineligible for the interview. This possibility is confirmed by the data quality
5 Central Population and Housing Census Steering Committee, The 2009 Viet Nam Population and Housing Census, Major Findings, Hanoi, June 2010
PDF compression, OCR, web optimization using a watermarked evaluation copy of CVISION PDFCompressor

36 VIET NAM MULTIPLE INDICATOR CLUSTER SURVEY 2010–2011
MONITORING THE SITUATION OF CHILDREN AND WOMEN
Table 1 (see Appendix D), which more precisely indicates the transfer of women from age 49-50. A similar drop is observed in age group 20–24, both for men and for women.
Figure HH.1: Age and sex distribution of household population, Viet Nam, 2010-2011
Tables HH.3 to HH.5 provide basic information on households, female respondents aged 15–49, and children under 5 years of age by presenting the unweighted, as well as the weighted results. Information on the basic characteristics of households, women and children under 5 years of age interviewed in the survey is essential for the interpretation of findings presented later in the report and also provide an indication of the representativeness of the survey. Besides these three tables, all other tables in this report are presented only with weighted numbers. See Appendix A for more details about weighting.
Table HH.3 provides basic background information on interviewed households, including sex of the household head, region, urban/rural area of residence, number of household members, educational attainment and ethnicity6 of the household head. In MICS4, the Chinese (Hoa) ethnic minority is grouped together with the Kinh majority under the label Kinh/Hoa, for reason that Kinh and Hoa have similar living standards. All other ethnicities are grouped together under the label Ethnic Minorities. These background characteristics are used in subsequent tables in this report. The figures in the table also include the numbers of observations by major categories of analysis in the report.
6 This was determined by asking the question: “To what ethnic group does the head of this household belong?” Households were divided into two groups: 1) Kinh/Hoa (including the Kinh [Vietnamese] majority and the Hoa[ethnic Chinese]minority); and 2) Ethnic Minorities (including all ethnicities other than Kinh and Hoa). Please refer to the questionnaire in Appendix F for detailed questions.
PDF compression, OCR, web optimization using a watermarked evaluation copy of CVISION PDFCompressor

37VIET NAM MULTIPLE INDICATOR CLUSTER SURVEY 2010–2011
MONITORING THE SITUATION OF CHILDREN AND WOMEN
Table HH.3: Household characteristics
Percentage and frequency distribution of households by selected characteristics, Viet Nam, 2010–2011
Weighted percentage
Number of households Weighted UnweightedSex of household head
Male 73.8 8569 8421Female 26.2 3045 3193
RegionRed River Delta 22.4 2601 1907Northern Midland and Mountain areas 15.8 1836 1955North Central area and Central Coastal area 21.7 2522 1943Central Highlands 5.2 604 1956South East 16.1 1873 1928Mekong River Delta 18.8 2178 1925
AreaUrban 29.7 3454 5001Rural 70.3 8160 6613
Number of household members1 6.3 733 6802 15.9 1850 17323 20.7 2407 24364 29.2 3396 33815 15 1739 17936 7.4 864 8827 3.2 368 3978 1.2 138 1619 0.5 59 7410+ 0.5 60 78
Education of household headNone 5.9 691 775Primary 25.1 2919 2839Lower Secondary 39.3 4568 4322Upper Secondary 16.4 1904 1980Tertiary 12.9 1504 1670Missing/Dk (0.3) 30 28
Ethnicity of household headkinh/Hoa 89.9 10436 10068Ethnic Minorities 10.1 1178 1546
Households with at leastOne child aged 0-4 years 27.1 11614 11614One child aged 0-17 years 67.1 11614 11614One woman aged 15-49 years 77.1 11614 11614
Mean household size 3.8 11614 11614
Note:Figures shown in parenthesis are based on denominators of 25-49 un-weighted cases
The weighted and unweighted numbers for total households are equal, since sample weights were normalized (See Appendix A). The table also shows the proportions of households with at least one child under the age of 18, at least one child under the age of 5, and at least one eligible woman aged 15–49 years. The weighted average household size estimated by the survey is also presented.
PDF compression, OCR, web optimization using a watermarked evaluation copy of CVISION PDFCompressor

38 VIET NAM MULTIPLE INDICATOR CLUSTER SURVEY 2010–2011
MONITORING THE SITUATION OF CHILDREN AND WOMEN
According to Table HH.3, most households are headed by a male (73.8 per cent), more than 70 per cent of the population is living in rural areas and about 10.1 per cent of the population belongs to ethnic groups other than kinh (Vietnamese) and ethnic Chinese (Hoa). The weighted number of households in some regions such as the Central Highlands is considerably lower than the unweighted number due to over-sampling in this region. Some 6.3 per cent of the household population is living in single households and about 80.8 per cent were living in households containing from 2–5 persons. The average household size is 3.8 members, which corresponds to the results of the 2009 Population Census.
Figure HH.2 shows that for every 100 households interviewed, there are 27 households with at least one child aged 0–4 years, 67 households with at least one child aged 0–17 years and 77 households with at least one woman aged 15–49 years.
Figure HH.2 Household composition, Viet Nam, 2010–2011
Characteristics of Female Respondents 15–49 Years of Age and Children Under 5 Years of AgeInformation on the background characteristics of female respondents 15–49 years of age and of children under5 years of age is provided in Tables HH.4 and HH.5. In both tables, the totals of weighted and unweighted observations are equal, since sample weights have been normalized (See Appendix A). In addition to providing useful information on the background characteristics of women and children, the tables also show the numbers of observations in each background category. These categories are used in the subsequent tabulations of the report.
PDF compression, OCR, web optimization using a watermarked evaluation copy of CVISION PDFCompressor

39VIET NAM MULTIPLE INDICATOR CLUSTER SURVEY 2010–2011
MONITORING THE SITUATION OF CHILDREN AND WOMEN
Table HH.4: Women's background characteristics
Percentage and frequency distribution of women aged 15–49 years by selected background characteristics, Viet Nam, 2010–11
Weighted percent
Number of women Weighted UnweightedRegion
Red River Delta 20.3 2368 1682Northern Midland and Mountain areas 16.3 1896 1970North Central area and Central Coastal area 20.8 2429 1868Central Highlands 5.8 671 2078South East 17.8 2080 2116Mekong River Delta 19 2220 1949
AreaUrban 31.5 3676 5183Rural 68.5 7987 6480
Age (years) 15-19 14.6 1707 1769 20-24 13.8 1608 1629 25-29 15.5 1806 1789 30-34 15.6 1817 1741 35-39 14.2 1657 1638 40-44 13.9 1621 1654 45-49 12.4 1448 1443Marital/Union status
Currently married/in union 71.5 8341 8194Widowed 1.9 223 231Divorced 1.3 148 174Separated 0.9 101 105Never married/in union 24.4 2849 2959
Motherhood statusEver gave birth 71.2 8304 8179Never gave birth 28.8 3359 3484
Births in last two yearsHad a birth in last two years 11.9 1383 1363Had no birth in last two years 88.1 10280 10300
EducationNone 4.1 479 612Primary 16.3 1900 1883Lower Secondary 38.7 4517 4244Upper Secondary 24.3 2836 2830Tertiary 16.6 1931 2094
Wealth index quintilePoorest 17.7 2062 2152Second 18.9 2200 1924Middle 20.8 2429 2222Fourth 21.3 2479 2529Richest 21.4 2493 2836
Ethnicity of household headkinh/Hoa 87.9 10247 9836Ethnic Minorities 12.1 1416 1827
Total 100 11663 11663
Table HH.4 provides the background characteristics of the female respondents aged 15–49 years. More specifically, the table includes information on the distribution of women
PDF compression, OCR, web optimization using a watermarked evaluation copy of CVISION PDFCompressor

40 VIET NAM MULTIPLE INDICATOR CLUSTER SURVEY 2010–2011
MONITORING THE SITUATION OF CHILDREN AND WOMEN
according to region, area of residence, age, marital status, motherhood status, births given in last two years, highest educational attendance7, wealth index quintiles8, and ethnicity of household head.
The regions accounting for the largest share of population, and largest share of females were the Red River Delta (20.3 per cent) and the North Central area and Central Coast area (20.8 per cent); compared to the smallest region, the Central Highlands, accounting for only 5.8 per cent of all females in the population 68.5 per cent of women live in rural areas and 87.9 per cent of women live in Kinh/Hoaheaded households. At the time of the interviews, 71.5 per cent of women were married or in union, 4 per cent were divorced, widowed or separated, and 24.4 per cent had never previously been married or lived in a union. Out of every five women interviewed, four had attained secondary education level or higher and only one had primary school education (16.3 per cent) or had never been to school (4.1 per cent).
The background characteristics of children under 5 years of age covered in the survey are presented in Table HH.5. This table covers the distribution of children across several attributes, notably sex, region and area of residence, age, mother’s or caregiver’s highest education level, wealth index quintiles, and ethnicity.
Table HH.5 shows that the proportion of boys exceeded the proportion of girls by 1.6 per cent. This is consistent with the Census 2009 results and other surveys implemented by GSO, and reflects the increasing trend towards unbalanced sex ratio at birth in Viet Nam. The Northern Midland and Mountain areas comprise only 15.8 per cent of the population, but up to 19.2 per cent of the children under 5 years of age. The same pattern is observed for the Central Highlands, accounting for 5.2 per cent of the population but 6.3 per cent of all children under 5 years of age. Most of the children under 5 years in the survey had mothers or caregivers with secondary or higher education (76.5 per cent), with just 17.9 per cent having mothers or caregivers with primary education and 5.6 per cent with no education. Some 14.5 per cent of children under 5 years of age live in ethnic minority households, exceeding both the proportion of women aged 15–49 living in ethnic minority households (12.1 per cent) and the proportion of households with an ethnic minority head (10.1 per cent).
7 Throughout this report, unless otherwise stated, “education” refers to the highest educational level attended by the respondent when it is used as a background variable.8 Principal components analysis was performed by using information on the ownership of consumer goods, dwelling characteristics, water and sanitation, and other characteristics that are related to the household’s wealth to assign weights (factor scores) to each of the household assets. Each household was then assigned a wealth score based on these weights and the assets owned by that household. The survey household population was then ranked according to the wealth score of the household they are living in, and was finally divided into 5 equal parts (quintiles) from lowest (poorest) to highest (richest). The assets and other characteristics related to wealth used in these calculations were as follows: water sources, toilet facility, housing, fuel types for cooking, electricity, bank account, durable goods (such as radio, TV, refrigerator, fixed telephone, watch, mobile phone, bicycle, motorcycle, boat with motor, car), animals (such as buffalo, cattle, horse, donkey, goat, sheep, chicken, pig). The wealth index is assumed to capture the underlying long-term wealth through information on the household assets, and is intended to produce a ranking of households by wealth, from poorest to richest. The wealth index does not provide information on absolute poverty, current income or expenditure levels. The wealth scores calculated are applicable for only the particular data set they are based on. Further information on the construction of the wealth index can be found in Rutstein and Johnson, 2004, Filmer and Pritchett, 2001, and Gwatkinet. al., 2000.
PDF compression, OCR, web optimization using a watermarked evaluation copy of CVISION PDFCompressor

41VIET NAM MULTIPLE INDICATOR CLUSTER SURVEY 2010–2011
MONITORING THE SITUATION OF CHILDREN AND WOMEN
Table HH.5: Background characteristics of children under 5 years of age
Percentage and frequency distribution of children under 5 years of age by selected characteristics, Viet Nam, 2010–2011
Weighted
percentage
Number of children under 5 years
Weighted Unweighted
Sex
Male 50.8 1869 1871
Female 49.2 1809 1807
Region
Red River Delta 21.7 798 543
Northern Midland and Mountain areas 19.2 707 712
North Central area and Central Coastal area 19.5 719 548
Central Highlands 6.3 233 727
South East 15.5 572 581
Mekong River Delta 17.7 650 567
Area
Urban 27.5 1013 1409
Rural 72.5 2665 2269
Age (months)
0-5 8.9 327 319
6-11 9.3 341 350
12-23 20.6 759 760
24-35 21.5 792 786
36-47 20.8 764 770
48-59 18.9 695 693
Mother’s education
None 5.6 207 291
Primary 17.9 658 672
Lower Secondary 40.2 1479 1380
Upper Secondary 18.2 670 661
Tertiary 18.1 664 674
Wealth index quintile
Poorest 22.6 831 922
Second 18.3 673 595
Middle 19 700 649
Fourth 20.4 749 737
Richest 19.7 725 775
Ethnicity of household head
kinh/Hoa 85.5 3143 2964
Ethnic Minorities 14.5 535 714
Total 100 3678 3678
PDF compression, OCR, web optimization using a watermarked evaluation copy of CVISION PDFCompressor

42
PDF compression, OCR, web optimization using a watermarked evaluation copy of CVISION PDFCompressor

43VIET NAM MULTIPLE INDICATOR CLUSTER SURVEY 2010–2011
MONITORING THE SITUATION OF CHILDREN AND WOMEN
IV. CHILD MORTALITY
PDF compression, OCR, web optimization using a watermarked evaluation copy of CVISION PDFCompressor

44 VIET NAM MULTIPLE INDICATOR CLUSTER SURVEY 2010–2011
MONITORING THE SITUATION OF CHILDREN AND WOMEN
One of the overarching goals of the Millennium Development Goals (MDGs) is the reduction of infant and under-five mortality. Specifically, MDG 4 calls for the reduction in under-five mortality by two-thirds between 1990 and 2015. Monitoring progress towards this goal is an important but difficult objective. Measuring childhood mortality may seem easy, but attempts using direct questions, such as “Has anyone in this household died in the last year?” give inaccurate results. Using direct measures of child mortality from birth histories is time consuming, more expensive, and requires greater attention to training and supervision. Alternatively, indirect methods developed to measure child mortality produce robust estimates that are comparable with the ones obtained from other sources. Indirect methods minimise the pitfalls of memory lapses, inexact or misinterpreted definitions, and poor interviewing techniques.
The Infant Mortality Rate (IMR) is the probability of dying before the first birthday. The Under-five Mortality Rate (U5MR) is the probability of dying before the fifth birthday. In the Viet Nam MICS4 survey, infant and under five mortality rates are calculated based on an indirect estimation technique known as the brass method9. The data used in the estimation are: the mean number of children ever born for the five-year age groups of women aged 15-49 years, and the proportion of these children who are dead also for the five-year age groups of women (Table CM.1). The technique converts the proportions dead among children of women in each age group into probabilities of dying by taking into account the approximate length of exposure of children to the risk of dying, assuming a particular model age pattern of mortality. Based on previous information on mortality in Viet Nam, the North model life table was selected as most appropriate10. The North model has been used in this and in all the previous Viet Nam MICS rounds, based on a comparison of the population structure with the model life tables.
Table CM.1: Children ever born, children surviving and proportion dead
Mean and total numbers of children ever born, children surviving and proportion dead by mother’s age, Viet Nam, 2010 - 2011
Children ever born Children surviving Proportion dead
Number of women Mean Total Mean Total
Mother’s age 15-19 0.048 82 0.047 81 0.018 1707 20-24 0.511 823 0.504 810 0.015 1608 25-29 1.229 2220 1.208 2182 0.017 1806 30-34 1.833 3330 1.805 3280 0.015 1817 35-39 2.195 3636 2.118 3509 0.035 1657 40-44 2.44 3954 2.329 3774 0.046 1621 45-49 2.783 4029 2.619 3792 0.059 1448Total 1.55 18075 1.494 17427 0.036 11663
Table CM.2 provides the estimates of child mortality. The IMR is estimated at 14 per thousand live births, while the probability of dying under age 5 (U5MR) is around 16 per thousand live births. These estimates have been calculated by averaging mortality estimates obtained from women aged 25–29 and 30–34, and refer to mid-2009. Child mortality does not indicate large differences by gender. Regional estimates cannot be shown due to the low number of observations of deceased children.
9 United Nations (1983). Indirect Techniques for Demographic Estimation. Population Studies No. 81; United Nations (1990) Step-by-step guide to the estimation of Child Mortality; United Nations (1990) United Nations programme for child mortality estimation: a microcomputer programme to accompany the step-by-step guide to the estimation of child mortality. Population Studies No. 107. 10 Ministry of Planning and Investment and General Statistics Office, Population projection for Viet Nam 2009-2049, February 2011.
PDF compression, OCR, web optimization using a watermarked evaluation copy of CVISION PDFCompressor

45VIET NAM MULTIPLE INDICATOR CLUSTER SURVEY 2010–2011
MONITORING THE SITUATION OF CHILDREN AND WOMEN
The largest differentials in mortality exist in relationship to mother’s education level, household living standards (based on a wealth index), and ethnicity of the household head. As expected, the higher the mother’s education level, the lower the child mortality. It is interesting to observe that the U5MR for the mothers with no education was 29 per thousand live births, which declined to 21 per thousand live births for mothers with primary school, and further decreased to 14 per thousand live births for mothers with secondary or higher education levels. Similar differences by mother’s education level are observed for IMR. The U5MR of the 20 per cent poorest households was 28 per thousand live births, more than twice the U5MR of the rest of the population. Child mortality in ethnic minority households was quite high (39 per thousand live births for U5MR and 30 per thousand live births for IMR). This is equivalent to the mortality rates of the country ten years ago and more than three times higher than the mortality rate of children in Kinh/Hoa households (12 per thousand live births for U5MR and 10 per thousand live births for IMR).
Differentials in under-five mortality rates by selected background characteristics are shown in Figure CM.1.
Table CM.2: Child mortality
Infant and Under-five Mortality rates (per thousand live births), North Model, Viet Nam, 2010-2011 Infant mortality rate1 Under-five mortality rate2
Sex Male 14 17Female 14 16
Area Urban 13 15Rural 14 17
Mother's education None 23 29Primary 17 21Secondary and higher 12 14
Wealth index quintile 20% Poorest 23 2880% Better off 11 12
Ethnicity of household head kinh/Hoa 10 12Ethnic Minorities 30 39
Total 14 161 MICS indicator 1.2; MDG indicator 4.22 MICS indicator 1.1; MDG indicator 4.1
PDF compression, OCR, web optimization using a watermarked evaluation copy of CVISION PDFCompressor

46 VIET NAM MULTIPLE INDICATOR CLUSTER SURVEY 2010–2011
MONITORING THE SITUATION OF CHILDREN AND WOMEN
Per thousand live births
Figure CM1. Under five mortality rate by background characteristics, Viet Nam, 2010–2011
Figure CM.2 shows various series of U5MR estimates from different surveys, based on responses of women in different age groups, and referring to various points in time, thus showing the estimated trend in U5MR. The MICS estimates indicate a decline in mortality over the last 10 years. The most recent U5MR estimate from the Population Census 200911 is 24.4 per thousand live births, which is higher than the 16 per thousand live births estimate from MICS4 for the year 2009 (an underestimate of 8.4 per thousand live births in the MICS).
While the trend indicated by the MICS 2010-2011 results are in broad agreement with the results of MICS 2006, the Population Change Survey 2010, and the Population Census 2009, Figure CM.2 does show that the MICS 2010-2011 estimates of mortality levels are higher than the MICS 2006 estimates, and lower than the estimates from the Population Change Survey and Census. It should be mentioned here that the Census and the Population Change Survey had larger sample sizes than the MICS4 survey12. Further explanation of these apparent declines and differences, as well as analysis of determinants, should be taken up in more detail in a separate analysis.11 The Population Census contains a sub-sample survey with a sampling rate of 15 per cent of all Enumeration Areas (EAs) selected from the total EAs of the Census 2009. Two questionnaires were used for simultaneous interviews in the Census, one was the short form covering all households in Viet Nam and the other (long form) covering 15 per cent of selected EAs. 12 The Population Change Survey is conducted annually. The sample rate for this survey is 1.5 per cent of all households in the country. The sample contained about 400,000 households in the 2010 round of the Population Change Survey, which is 33 times greater than the MICS 2010-2011 survey.
PDF compression, OCR, web optimization using a watermarked evaluation copy of CVISION PDFCompressor

47VIET NAM MULTIPLE INDICATOR CLUSTER SURVEY 2010–2011
MONITORING THE SITUATION OF CHILDREN AND WOMEN
Figure CM.2: Trend in under five mortality rates, Viet Nam, 2010–2011
PDF compression, OCR, web optimization using a watermarked evaluation copy of CVISION PDFCompressor

48
PDF compression, OCR, web optimization using a watermarked evaluation copy of CVISION PDFCompressor

49VIET NAM MULTIPLE INDICATOR CLUSTER SURVEY 2010–2011
MONITORING THE SITUATION OF CHILDREN AND WOMEN
V. NUTRITION
PDF compression, OCR, web optimization using a watermarked evaluation copy of CVISION PDFCompressor

50 VIET NAM MULTIPLE INDICATOR CLUSTER SURVEY 2010–2011
MONITORING THE SITUATION OF CHILDREN AND WOMEN
Nutritional StatusChildren’s nutritional status is a reflection of their overall health. When children have access to an adequate food supply, are not exposed to repeated illness, and are well cared for, they reach their growth potential and are considered well nourished.
Malnutrition is associated with more than half of all child deaths worldwide. Undernourished children are more likely to die from common childhood ailments, and for those who survive, to have recurring sicknesses and faltering growth. Three-quarters of the children who die from causes related to malnutrition were only mildly or moderately malnourished – showing no outward sign of their vulnerability. The Millennium Development Goal is to reduce by half the proportion of people who suffer from hunger between 1990 and 2015. A reduction in the prevalence of malnutrition will also assist in the goal to reduce child mortality.
There is a reference distribution of height and weight for children under age 5 based on a well-nourished population. Undernourishment in a population can be gauged by comparing children to this reference population. The reference population used in this report is based on new WHO growth standards.13 Each of the three nutritional status indicators can be expressed in standard deviation units (z-scores) from the median of the reference population.
Weight-for-age is a measure of both acute and chronic malnutrition. Children whose weight-for-age is more than two standard deviations below the median of the reference population are considered moderately or severely underweight while those whose weight-for-age is more than three standard deviations below the median are classified as severely underweight.
Height-for-age is a measure of linear growth. Children whose height-for-age is more than two standard deviations below the median of the reference population are considered short for their age and are classified as moderately or severely stunted. Those whose height-for-age is more than three standard deviations below the median are classified as severely stunted. Stunting is a reflection of chronic malnutrition as a result of failure to receive adequate nutrition over a long period and recurrent or chronic illness.
Finally, children whose weight-for-height is more than two standard deviations below the median of the reference population are classified as moderately or severely wasted, while those who fall more than three standard deviations below the median are classified as severely wasted. Wasting is usually the result of a recent nutritional deficiency. The indicator may exhibit significant seasonal shifts associated with changes in the availability of food or disease prevalence.
In MICS, weights and heights of all children under 5 years of age were measured using anthropometric equipment recommended by UNICEF (www.childinfo.org). Findings in this section are based on the results of these measurements.
Table NU.1 shows percentages of children classified into each of these categories, based on the anthropometric measurements that were taken during fieldwork. Additionally, the table includes the percentage of children who are overweight, which takes into account those children whose weight for height is above 2 standard deviations from the median of the reference population, and mean z-scores for all three anthropometric indicators.
13 WHO, 2007. WHO Child Growth Standards – Methods and Development, Geneva: WHO accessed at http://www.who. int/childgrowth/standards/second_set/technical_report_2.pdf
PDF compression, OCR, web optimization using a watermarked evaluation copy of CVISION PDFCompressor
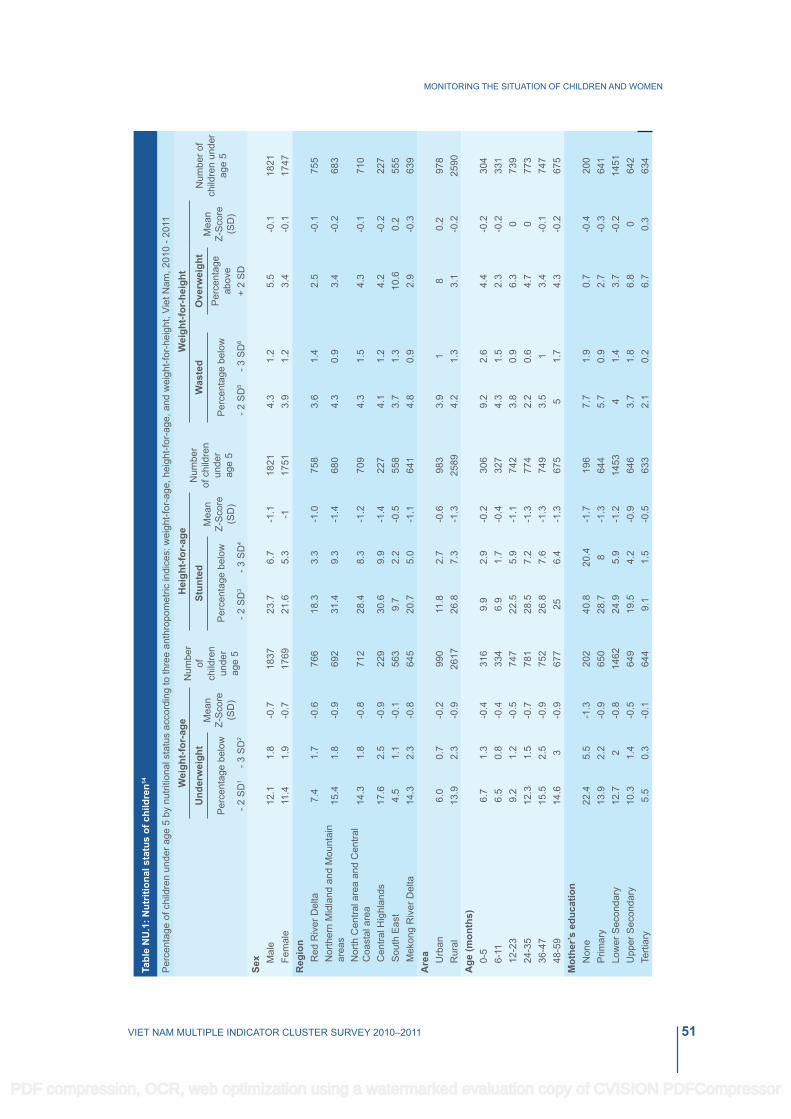
51VIET NAM MULTIPLE INDICATOR CLUSTER SURVEY 2010–2011
MONITORING THE SITUATION OF CHILDREN AND WOMEN
Tabl
e N
U.1
: Nut
ritio
nal s
tatu
s of
chi
ldre
n14
Per
cent
age
of c
hild
ren
unde
r age
5 b
y nu
tritio
nal s
tatu
s ac
cord
ing
to th
ree
anth
ropo
met
ric in
dice
s: w
eigh
t-for
-age
, hei
ght-f
or-a
ge, a
nd w
eigh
t-for
-hei
ght,
Viet
Nam
, 201
0 - 2
011
Wei
ght-f
or-a
geN
umbe
r of
ch
ildre
n un
der
age
5
H
eigh
t-for
-age
Num
ber
of c
hild
ren
unde
r ag
e 5
W
eigh
t-for
-hei
ght
Num
ber o
f ch
ildre
n un
der
age
5
Und
erw
eigh
tM
ean
Z-S
core
(S
D)
Stun
ted
Mea
n Z-
Sco
re
(SD
)
Was
ted
Ove
rwei
ght
Mea
n Z-
Sco
re
(SD
)P
erce
ntag
e be
low
Per
cent
age
belo
wP
erce
ntag
e be
low
Per
cent
age
abov
e- 2
SD
1- 3
SD
2
- 2 S
D3
- 3 S
D4
-
2 S
D5
- 3 S
D6
+
2 S
DSe
x
Mal
e12
.11.
8-0
.718
3723
.76.
7-1
.118
214.
31.
25.
5-0
.118
21Fe
mal
e11
.41.
9-0
.717
6921
.65.
3-1
1751
3.9
1.2
3.4
-0.1
1747
Reg
ion
R
ed R
iver
Del
ta7.
41.
7-0
.676
618
.33.
3-1
.075
83.
61.
42.
5-0
.175
5N
orth
ern
Mid
land
and
Mou
ntai
n ar
eas
15.4
1.8
-0.9
692
31.4
9.3
-1.4
680
4.3
0.9
3.4
-0.2
683
Nor
th C
entra
l are
a an
d C
entra
l C
oast
al a
rea
14.3
1.8
-0.8
712
28.4
8.3
-1.2
709
4.3
1.5
4.3
-0.1
710
Cen
tral H
ighl
ands
17.6
2.5
-0.9
229
30.6
9.9
-1.4
227
4.1
1.2
4.2
-0.2
227
Sou
th E
ast
4.5
1.1
-0.1
563
9.7
2.2
-0.5
558
3.7
1.3
10.6
0.2
555
Mek
ong
Riv
er D
elta
14.3
2.3
-0.8
645
20.7
5.0
-1.1
641
4.8
0.9
2.9
-0.3
639
Are
aU
rban
6.0
0.7
-0.2
990
11.8
2.7
-0.6
983
3.9
18
0.2
978
Rur
al13
.92.
3-0
.926
1726
.87.
3-1
.325
894.
21.
33.
1-0
.225
90A
ge (m
onth
s)
0-5
6.7
1.3
-0.4
316
9.9
2.9
-0.2
306
9.2
2.6
4.4
-0.2
304
6-11
6.
50.
8-0
.433
46.
91.
7-0
.432
74.
31.
52.
3-0
.233
112
-23
9.2
1.2
-0.5
747
22.5
5.9
-1.1
742
3.8
0.9
6.3
073
924
-35
12.3
1.5
-0.7
781
28.5
7.2
-1.3
774
2.2
0.6
4.7
077
336
-47
15.5
2.5
-0.9
752
26.8
7.6
-1.3
749
3.5
13.
4-0
.174
748
-59
14.6
3-0
.967
725
6.4
-1.3
675
51.
74.
3-0
.267
5M
othe
r’s e
duca
tion
N
one
22.4
5.5
-1.3
202
40.8
20.4
-1.7
196
7.7
1.9
0.7
-0.4
200
Prim
ary
13.9
2.2
-0.9
650
28.7
8-1
.364
45.
70.
92.
7-0
.364
1Lo
wer
Sec
onda
ry12
.72
-0.8
1462
24.9
5.9
-1.2
1453
41.
43.
7-0
.214
51U
pper
Sec
onda
ry10
.31.
4-0
.564
919
.54.
2-0
.964
63.
71.
86.
80
642
Terti
ary
5.5
0.3
-0.1
644
9.1
1.5
-0.5
633
2.1
0.2
6.7
0.3
634
PDF compression, OCR, web optimization using a watermarked evaluation copy of CVISION PDFCompressor

52 VIET NAM MULTIPLE INDICATOR CLUSTER SURVEY 2010–2011
MONITORING THE SITUATION OF CHILDREN AND WOMEN
Tabl
e N
U.1
: Nut
ritio
nal s
tatu
s of
chi
ldre
n14
Per
cent
age
of c
hild
ren
unde
r age
5 b
y nu
tritio
nal s
tatu
s ac
cord
ing
to th
ree
anth
ropo
met
ric in
dice
s: w
eigh
t-for
-age
, hei
ght-f
or-a
ge, a
nd w
eigh
t-for
-hei
ght,
Viet
Nam
, 201
0 - 2
011
Wei
ght-f
or-a
geN
umbe
r of
ch
ildre
n un
der
age
5
H
eigh
t-for
-age
Num
ber
of c
hild
ren
unde
r ag
e 5
W
eigh
t-for
-hei
ght
Num
ber o
f ch
ildre
n un
der
age
5
Und
erw
eigh
tM
ean
Z-S
core
(S
D)
Stun
ted
Mea
n Z-
Sco
re
(SD
)
Was
ted
Ove
rwei
ght
Mea
n Z-
Sco
re
(SD
)P
erce
ntag
e be
low
Per
cent
age
belo
wP
erce
ntag
e be
low
Per
cent
age
abov
e- 2
SD
1- 3
SD
2
- 2 S
D3
- 3 S
D4
-
2 S
D5
- 3 S
D6
+
2 S
DW
ealth
inde
x qu
intil
e
Poo
rest
20.6
3.7
-1.2
818
40.9
14.3
-1.7
803
5.4
1.2
1.6
-0.3
806
Sec
ond
11.3
1.5
-0.9
670
24.2
4.3
-1.2
666
4.1
12.
8-0
.366
6
Mid
dle
13.9
2-0
.868
324
.24.
8-1
.268
14.
51.
52.
9-0
.267
9
Four
th8.
51.
1-0
.572
615
.63.
6-0
.872
14.
42
6.3
071
9R
iche
st3.
10.
60.
171
06.
11.
7-0
.470
22.
10.
28.
90.
469
8Et
hnic
ity o
f hou
seho
ld h
ead
k
inh/
Hoa
101.
6-0
.630
8119
.64.
7-1
3054
3.8
1.1
4.9
3047
Eth
nic
Min
oriti
es22
3.5
-1.2
526
40.9
13.8
-1.6
518
5.7
1.6
1.7
-0.4
521
Tota
l11
.71.
8-0
.736
0722
.76
-1.1
3572
4.
11.
2
4.4
-0.1
3568
1 MIC
S in
dica
tor 2
.1a
and
MD
G in
dica
tor 1
.82 M
ICS
indi
cato
r 2.1
b3 M
ICS
indi
cato
r 2.2
a, 4 M
ICS
indi
cato
r 2.2
b5 M
ICS
indi
cato
r 2.3
a, 6 M
ICS
indi
cato
r 2.3
b
.14 14 A
ccor
ding
to th
e N
atio
nal I
nstit
ute
of N
utrit
ion,
the
perc
enta
ge o
f chi
ld u
nder
wei
ght i
s 17
.5 p
er c
ent,
stu
nted
is 2
9.3
per
cent
and
was
ted
is 7
.1 p
er c
ent.
Nat
iona
l Ins
titut
e of
Nut
ritio
n an
d
UN
ICE
F (2
011)
. A R
evie
w o
f the
Nut
ritio
n S
ituat
ion
in V
iet N
am 2
009–
2010
. Han
oi: S
tatis
tical
Pub
lishi
ng H
ouse
.
PDF compression, OCR, web optimization using a watermarked evaluation copy of CVISION PDFCompressor

53VIET NAM MULTIPLE INDICATOR CLUSTER SURVEY 2010–2011
MONITORING THE SITUATION OF CHILDREN AND WOMEN
Children whose full birth date (month and year) were not obtained, and children whose measurements are outside a plausible range are excluded from Table NU.1. Children are excluded from one or more of the anthropometric indicators when their weights or heights have not been measured, whichever applicable. For example if a child has been weighed but his/her height has not been measured, the child is included in the underweight calculations, but not in the calculations for stunting and wasting. Percentages of children by age and reasons for exclusion are shown in the data quality tables DQ.5(a,b,c) and DQ.6. Overall 98.2 per cent of children had both their weights and heights measured (Table DQ.5), 1.9 per cent of children are missing information on weight and 2.5 per cent are missing information on height. Table DQ.6 shows that due to incomplete dates of birth, implausible measurements, and missing weight and/or height, 2.1 per cent of children have been excluded from calculations of the weight-for-age indicator, while the figures are 3.1 for the height-for-age indicator, and 2.4 per cent for the weight-for-height indicator.
Almost one in nine children under age 5 in Viet Nam are underweight (11.7 per cent) and 1.8 per cent are classified as severely underweight (Table NU.1). What is striking is that twice as many children living in ethnic minority households are underweight compared to their peers in Kinh/Hoa households. Almost a quarter of children (22.7 per cent) are stunted or short for their age, with again twice as many children from ethnic minority households are suffering from stunting compared to children in Kinh/Hoa households. Some 4.1 per cent of children are wasted or thin for their height and 1.2 per cent are severely wasted.
Figure NU.1: Percentage of children under 5 years of age who are undernourished by age in months, Viet Nam, 2010–2011
Children in the Northern Midland and Mountain areas and the Central Highlands are more likely to be underweight and stunted than other children. The prevalence rate for wasting among children does not differ much among regions, ranging from around 3.6 to 4.8 per cent. Children whose mothers have secondary or higher education are the least likely to be underweight and stunted compared to children of mothers with no education. Boys appear to be slightly more likely to be underweight, stunted, and wasted than girls. The age pattern shows that a lower percentage of children aged 0–11 months are undernourished according to all three indices in comparison to older children (Figure NU.1). This pattern is
PDF compression, OCR, web optimization using a watermarked evaluation copy of CVISION PDFCompressor

54 VIET NAM MULTIPLE INDICATOR CLUSTER SURVEY 2010–2011
MONITORING THE SITUATION OF CHILDREN AND WOMEN
expected and is related to the age at which many children are weaned from breastfeeding and are exposed to contamination in water, food, and environment.
Overweight is one of the concerns of Viet Nam’s Strategy against Malnutrition. Overweight is rapidly increasing in developing countries due to inappropriate diet for children. In MICS4, the overweight prevalence is 4.4 per cent. The overweight prevalence is highest among children living in the South East (10.6 per cent) and lowest among children living in the Red River Delta (2.5 per cent). The prevalence rate in urban areas is almost three times greater than in rural areas (8 per cent versus 3.1 per cent); and progressively increases with household living standards, with 1.6 per cent of children in the poorest households being overweight, compared to 8.9 per cent in the richest households. The overweight prevalence is highest among children 12–23 months of age (6.3 per cent) in comparison with other age groups.
breastfeeding and Infant and Young Child FeedingBreastfeeding for the first few years of life protects children from infection, provides an ideal source of nutrients, and is economical and safe. However, many mothers stop breastfeeding too soon and there are often pressures to switch to infant formula, which can contribute to growth faltering and micronutrient malnutrition and is unsafe if clean water is not readily available.
WHO and UNICEF have the following feeding recommendations:
● Exclusive breastfeeding for the first six months;
● Continued breastfeeding for two years or more;
● Safe, appropriate and adequate complementary foods beginning at 6 months;
● Frequency of complementary feeding: two times per day for 6–8 month olds; three times per day for 9–11 month olds.
It is also recommended that breastfeeding be initiated within one hour of birth.
Indicators related to recommended child feeding practices are as follows:
● Early initiation of breastfeeding (within one hour of birth);
● Exclusive breastfeeding rate (< 6 months);
● Predominant breastfeeding rate (< 6 months);
● Continued breastfeeding rate (at 1 year and at 2 years);
● Duration of breastfeeding;
● Age-appropriate breastfeeding (0–23 months);
● Introduction of solid, semi-solid and soft foods (6–8 months);
● Minimum meal frequency (6–23 months);
● Milk feeding frequency for non-breastfeeding children (6–23 months);
● Bottle feeding (0–23 months).
PDF compression, OCR, web optimization using a watermarked evaluation copy of CVISION PDFCompressor

55VIET NAM MULTIPLE INDICATOR CLUSTER SURVEY 2010–2011
MONITORING THE SITUATION OF CHILDREN AND WOMEN
Table NU.2: Initial breastfeedingPercentage of last-born children in the 2 years preceding the survey who were ever breastfed, percentage who were breastfed within one hour of birth and within one day of birth, and percentage who received a prelacteal feed, Viet Nam, 2010 - 2011
Percentage ever
breastfed1
Percentage who were first breastfed:
Percentage who
received a prelacteal
feed
Number of last-born children in the
two years preceding the survey
Within one hour
of birth2
Within one day of birth
Region Red River Delta 97.3 33.1 80.6 76 294Northern Midland and Mountain areas 99.4 57 88.7 44 285North Central area and Central Coastal area 99 42.7 81.6 49.8 287Central Highlands 98.5 37 81.2 51.5 92South East 95.9 28.9 67.5 72 214Mekong River Delta 97.7 33.3 77.3 74.5 210
Area Urban 97.9 30.3 72.2 73.7 402Rural 98.1 43.5 83.2 56.4 980
Months since birth 0-11 98.2 35.4 78.0 64.0 63612-23 97.9 43.3 81.7 59.3 747
Assistance at delivery§ Skilled attendant 98.2 37.9 79.6 64.4 1284Traditional birth attendant (100) (67.7) (92.5) (25.7) 28Others (100) (70.6) (92.5) (23.0) 42
Place of delivery§§ Public sector health facility 98.4 37.8 79.7 65 1220Private sector health facility 92.7 37.8 75.7 56.5 57Home 100 64.2 88.6 23.8 102
Mother’s education None 97.7 55.9 89.8 33.9 64Primary 98 38.5 77.8 58 203Lower Secondary 98.8 41.4 82.7 56.1 523Upper Secondary 97.1 36.6 79.7 63.2 296Tertiary 97.7 36.8 74.7 77.7 295
Wealth index quintile Poorest 98.8 51.9 86.5 39.8 300Second 99 46 86.3 49.8 263Middle 98.8 35.8 79.5 63.7 251Fourth 97.4 31.4 76.6 75.4 270Richest 96.3 32.5 71.3 79.1 299
Ethnicity of household head kinh/Hoa 97.8 36.7 78.7 65.7 1158Ethnic Minorities 99.2 54.7 86.9 39.6 225
Total 98 39.7 80 61.5 13831 MICS indicator 2.42 MICS indicator 2.5
§ This excludes 28 missing cases of assistance at delivery§§ This excludes 4 missing cases of place of delivery
Note: Figures shown in parenthesis are based on denominators of 25-49 un-weighted cases
Table NU.2 presents the proportion of children born in the last two years who were ever breastfed, those who were first breastfed within one hour and one day of birth, and those
PDF compression, OCR, web optimization using a watermarked evaluation copy of CVISION PDFCompressor
56 VIET NAM MULTIPLE INDICATOR CLUSTER SURVEY 2010–2011
MONITORING THE SITUATION OF CHILDREN AND WOMEN
who received a prelacteal feed. Although a very important step in management of lactation and establishment of a physical and emotional relationship between the baby and the mother, only 39.7 per cent of babies are breastfed for the first time within one hour of birth, although 80 per cent of newborns in Viet Nam start breastfeeding within one day of birth. The percentage of children ever breastfed is quite high, at 98 per cent. Some 61.5 per cent of children received a prelacteal feed in the first 3 days of life. With an overall high percentage of children ever breastfed, virtually no disparities are noticed across any background variable. Meanwhile, place of delivery, attendance at delivery, mother’s education and wealth quintile are the strongest determinants for whether the child receives prelacteal feeding or not. It is interesting to observe that approximately 24 per cent of children born at home received a prelacteal feeding compared to 65 per cent of children born in a government health facility.
Surprising results by background characteristics are observed for early initiation of breastfeeding (within one hour of birth). Children born at home are almost twice as likely to be breastfed within one hour of birth compared to those delivered in a public or private health facility (64.2 versus 37.8 per cent). Also, the higher the mother’s education and the wealthier the household the less likely the child will be breastfed within one hour of birth. Regional differences are also observed, with the Northern Midland and Mountain area indicating the highest percentage of breastfeeding within one hour of birth (57 per cent) and the South East indicating the lowest, at 28.9 per cent. The percentage is also higher in rural areas compared to urban, at 43.5 and 30.3 per cent respectively.
In Table NU.3, the breastfeeding status is based on the mother’s/caregiver’s report of children’s consumption of food and fluids in the 24 hours prior to the interview. Exclusively breastfed refers to infants who received only breast milk (and possibly vitamins, mineral supplements, or medicine). The table shows exclusive breastfeeding of infants during the first six months of life, as well as continued breastfeeding of children at 12–15 and 20–23 months of age.
PDF compression, OCR, web optimization using a watermarked evaluation copy of CVISION PDFCompressor

57VIET NAM MULTIPLE INDICATOR CLUSTER SURVEY 2010–2011
MONITORING THE SITUATION OF CHILDREN AND WOMEN
Table NU.3: BreastfeedingPercentage of living children according to breastfeeding status at selected age groups, Viet Nam, 2010 - 2011
Children age 0-5 months Children age 12-15 months
Children age 20-23 months
Percentage exclusively breastfed1
Percentage predominantly
breastfed2
Number of
children
Percentage breastfed
(Continued breastfeeding
at 1 year)3
Number of
children
Percentage breastfed
(Continued breastfeeding at 2 years)4
Number of
childrenSex
Male 15.1 43.3 160 74.5 145 20.9 117Female 18.8 43.3 167 73.3 128 18 122
Region Red River Delta 15.3 35.8 83 72.2 51 (10.5) 48Northern Midland and Mountain areas 37.6 54.9 74 84.5 66 (34.6) 43
North Central area and Central Coastal area 14 49.5 66 78.9 59 (21.5) 47
Central Highlands * * 18 * 18 * 18South East (7.3) (33.3) 41 (59.8) 40 (7.4) 47Mekong River Delta (1.7) (35.5) 45 (57.1) 39 (19.9) 35
Area Urban 12.8 33.1 83 62.6 95 16.8 81Rural 18.4 46.8 244 79.9 178 20.8 158
Mother’s education None * * 14 * 12 * 13Primary 15.3 48 57 (76.1) 38 (15.5) 28Lower Secondary 16.2 42.2 101 71 101 22 96Upper Secondary 18.1 49.2 81 77.8 62 (26.4) 40Tertiary 14.3 31.5 75 72.4 60 10.9 61
Wealth index quintile Poorest 28 59.8 79 72 60 (38.6) 44Second 17.3 54.6 61 82.7 46 (21.7) 39Middle 18.4 37.4 65 82.8 56 (16.9) 40Fourth 6.8 40.4 60 (72.4) 48 21.7 52Richest 11.2 20.5 63 62.4 62 4.3 63
Ethnicity of household head
kinh/Hoa 14 39.1 273 71.5 233 13.4 203Ethnic Minorities 31.9 64.6 54 (87.8) 40 (54) 35
Total 17 43.3 327 73.9 273 19.4 2381 MICS indicator 2.6; 2 MICS indicator 2.93 MICS indicator 2.7; 4 MICS indicator 2.8
Note:Figures denoted by an asterisk are based on denominators of 24 un-weighted cases and lessFigures shown in parenthesis are based on denominators of 25-49 un-weighted cases
Only 17 per cent of children in Viet Nam aged less than six months are exclusively breastfed. This represents a low percentage. By the age of 12–15 months, 73.9 per cent of children are breastfed and by the age of 20–23 months, 19.4 per cent. Almost one in every two children aged 0–5 months (43.3 per cent) is predominantly breastfed.15 Differences in exclusive breastfeeding between girls and boys are minimal, however, considerable variations are observed by living standards, ethnicity of the household
15 Received breast milk and certain fluids (water and water-based drinks like sugar water, fruit juice, gripe water, oral rehydration solution, tea or herbal infusions), but do not receive anything else (in particular, non-human milk and food- based fluids)
PDF compression, OCR, web optimization using a watermarked evaluation copy of CVISION PDFCompressor
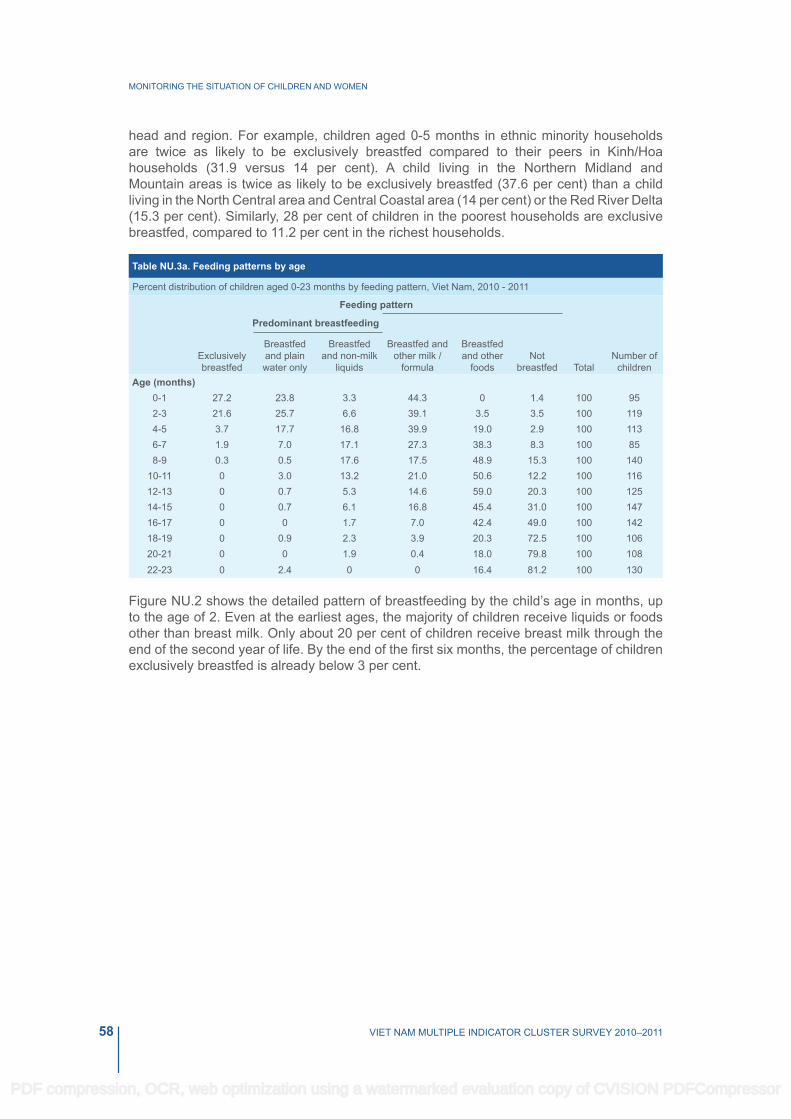
58 VIET NAM MULTIPLE INDICATOR CLUSTER SURVEY 2010–2011
MONITORING THE SITUATION OF CHILDREN AND WOMEN
head and region. For example, children aged 0-5 months in ethnic minority households are twice as likely to be exclusively breastfed compared to their peers in kinh/Hoa households (31.9 versus 14 per cent). A child living in the Northern Midland and Mountain areas is twice as likely to be exclusively breastfed (37.6 per cent) than a child living in the North Central area and Central Coastal area (14 per cent) or the Red River Delta (15.3 per cent). Similarly, 28 per cent of children in the poorest households are exclusive breastfed, compared to 11.2 per cent in the richest households.
Table NU.3a. Feeding patterns by age
Percent distribution of children aged 0-23 months by feeding pattern, Viet Nam, 2010 - 2011
Feeding pattern
TotalNumber of
children
Predominant breastfeeding
breastfed and other milk /
formula
breastfed and other
foodsNot
breastfed Exclusively
breastfed
breastfed and plain water only
breastfed and non-milk
liquidsAge (months)
0-1 27.2 23.8 3.3 44.3 0 1.4 100 952-3 21.6 25.7 6.6 39.1 3.5 3.5 100 1194-5 3.7 17.7 16.8 39.9 19.0 2.9 100 1136-7 1.9 7.0 17.1 27.3 38.3 8.3 100 858-9 0.3 0.5 17.6 17.5 48.9 15.3 100 140
10-11 0 3.0 13.2 21.0 50.6 12.2 100 11612-13 0 0.7 5.3 14.6 59.0 20.3 100 12514-15 0 0.7 6.1 16.8 45.4 31.0 100 14716-17 0 0 1.7 7.0 42.4 49.0 100 14218-19 0 0.9 2.3 3.9 20.3 72.5 100 10620-21 0 0 1.9 0.4 18.0 79.8 100 10822-23 0 2.4 0 0 16.4 81.2 100 130
Figure NU.2 shows the detailed pattern of breastfeeding by the child’s age in months, up to the age of 2. Even at the earliest ages, the majority of children receive liquids or foods other than breast milk. Only about 20 per cent of children receive breast milk through the end of the second year of life. By the end of the first six months, the percentage of children exclusively breastfed is already below 3 per cent.
PDF compression, OCR, web optimization using a watermarked evaluation copy of CVISION PDFCompressor

59VIET NAM MULTIPLE INDICATOR CLUSTER SURVEY 2010–2011
MONITORING THE SITUATION OF CHILDREN AND WOMEN
Figure NU. 2. Percentage distribution of children under age 2 across feeding patterns by age group, Viet Nam, 2010–2011
Table NU.4 shows the median duration of breastfeeding by selected background characteristics. Among children under age 3, the median duration is 16.7 months for any breastfeeding, 0.5 months for exclusive breastfeeding, and 1.4 months for predominant breastfeeding.
The differences in median duration of any breastfeeding and exclusive breastfeeding are not large across gender or area. More notable differences are observed according to the ethnicity of the household heads, especially for the median duration of exclusive breastfeeding. The children in ethnic minority households are likely to be breastfed three times longer, on average about 1.8 months, compared to 0.5 months median duration of exclusive breastfeeding of children who live in households headed by a Kinh/Hoa. The median duration of predominantly breastfed children indicates some, yet not substantial, differences by all background variables.
PDF compression, OCR, web optimization using a watermarked evaluation copy of CVISION PDFCompressor
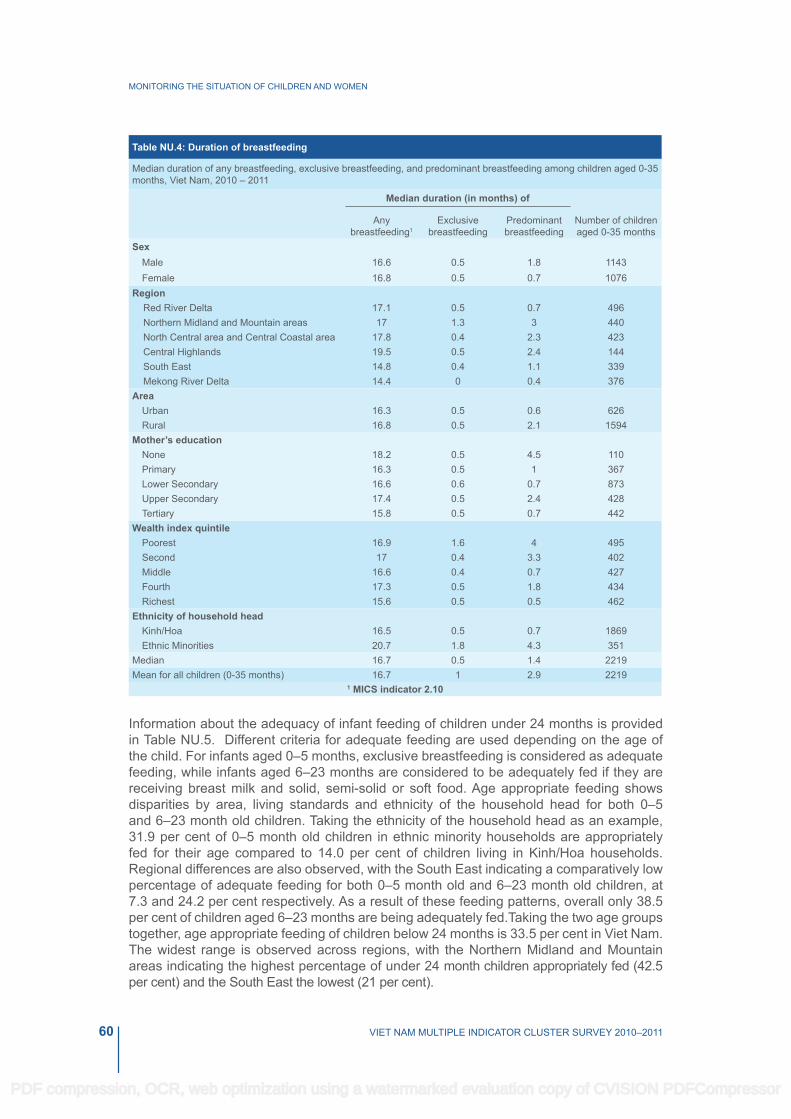
60 VIET NAM MULTIPLE INDICATOR CLUSTER SURVEY 2010–2011
MONITORING THE SITUATION OF CHILDREN AND WOMEN
Table NU.4: Duration of breastfeeding
Median duration of any breastfeeding, exclusive breastfeeding, and predominant breastfeeding among children aged 0-35 months, Viet Nam, 2010 – 2011
Median duration (in months) of
Number of children aged 0-35 months
Any breastfeeding1
Exclusive breastfeeding
Predominant breastfeeding
Sex Male 16.6 0.5 1.8 1143Female 16.8 0.5 0.7 1076
RegionRed River Delta 17.1 0.5 0.7 496Northern Midland and Mountain areas 17 1.3 3 440North Central area and Central Coastal area 17.8 0.4 2.3 423Central Highlands 19.5 0.5 2.4 144South East 14.8 0.4 1.1 339Mekong River Delta 14.4 0 0.4 376
AreaUrban 16.3 0.5 0.6 626Rural 16.8 0.5 2.1 1594
Mother’s educationNone 18.2 0.5 4.5 110Primary 16.3 0.5 1 367Lower Secondary 16.6 0.6 0.7 873Upper Secondary 17.4 0.5 2.4 428Tertiary 15.8 0.5 0.7 442
Wealth index quintilePoorest 16.9 1.6 4 495Second 17 0.4 3.3 402Middle 16.6 0.4 0.7 427Fourth 17.3 0.5 1.8 434Richest 15.6 0.5 0.5 462
Ethnicity of household headkinh/Hoa 16.5 0.5 0.7 1869Ethnic Minorities 20.7 1.8 4.3 351
Median 16.7 0.5 1.4 2219Mean for all children (0-35 months) 16.7 1 2.9 2219
1 MICS indicator 2.10
Information about the adequacy of infant feeding of children under 24 months is provided in Table NU.5. Different criteria for adequate feeding are used depending on the age of the child. For infants aged 0–5 months, exclusive breastfeeding is considered as adequate feeding, while infants aged 6–23 months are considered to be adequately fed if they are receiving breast milk and solid, semi-solid or soft food. Age appropriate feeding shows disparities by area, living standards and ethnicity of the household head for both 0–5 and 6–23 month old children. Taking the ethnicity of the household head as an example, 31.9 per cent of 0–5 month old children in ethnic minority households are appropriately fed for their age compared to 14.0 per cent of children living in Kinh/Hoa households. Regional differences are also observed, with the South East indicating a comparatively low percentage of adequate feeding for both 0–5 month old and 6–23 month old children, at 7.3 and 24.2 per cent respectively. As a result of these feeding patterns, overall only 38.5 per cent of children aged 6–23 months are being adequately fed.Taking the two age groups together, age appropriate feeding of children below 24 months is 33.5 per cent in Viet Nam. The widest range is observed across regions, with the Northern Midland and Mountain areas indicating the highest percentage of under 24 month children appropriately fed (42.5 per cent) and the South East the lowest (21 per cent).
PDF compression, OCR, web optimization using a watermarked evaluation copy of CVISION PDFCompressor
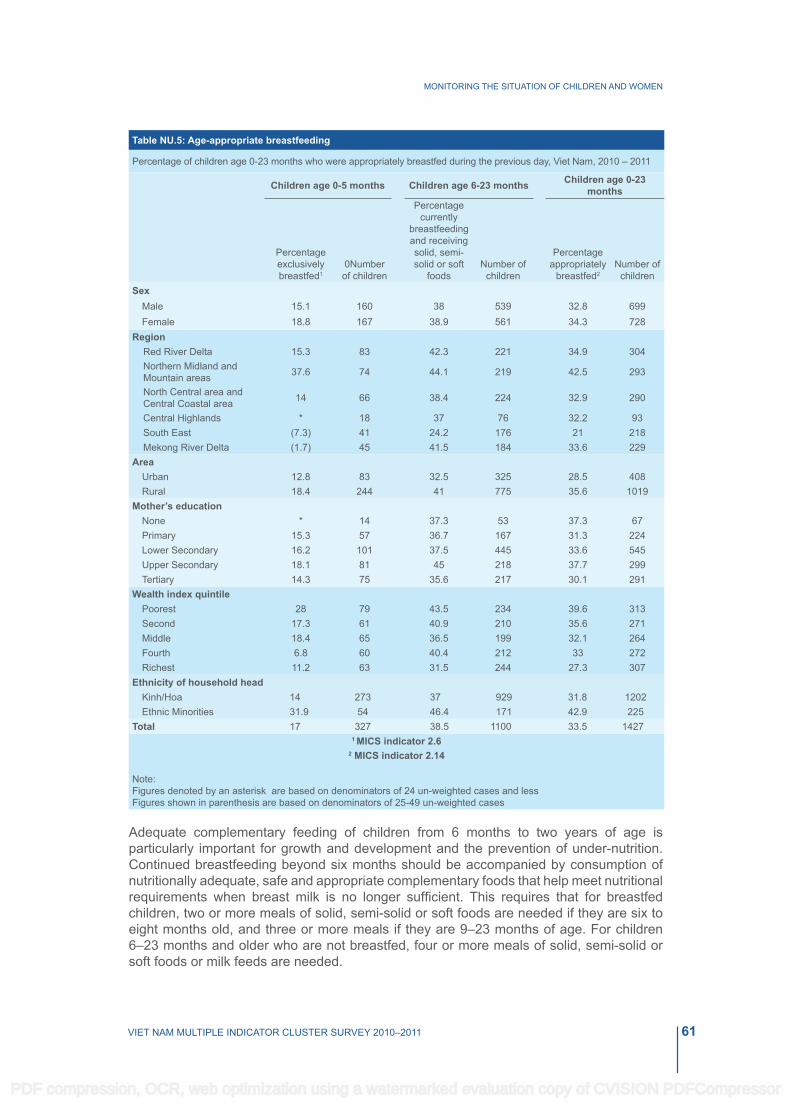
61VIET NAM MULTIPLE INDICATOR CLUSTER SURVEY 2010–2011
MONITORING THE SITUATION OF CHILDREN AND WOMEN
Table NU.5: Age-appropriate breastfeeding
Percentage of children age 0-23 months who were appropriately breastfed during the previous day, Viet Nam, 2010 – 2011
Children age 0-5 months Children age 6-23 months Children age 0-23 months
Percentage exclusively breastfed1
0Number of children
Percentage currently
breastfeeding and receiving solid, semi-solid or soft
foodsNumber of
children
Percentage appropriately
breastfed2Number of
childrenSex
Male 15.1 160 38 539 32.8 699Female 18.8 167 38.9 561 34.3 728
RegionRed River Delta 15.3 83 42.3 221 34.9 304Northern Midland and Mountain areas 37.6 74 44.1 219 42.5 293
North Central area and Central Coastal area 14 66 38.4 224 32.9 290
Central Highlands * 18 37 76 32.2 93South East (7.3) 41 24.2 176 21 218Mekong River Delta (1.7) 45 41.5 184 33.6 229
AreaUrban 12.8 83 32.5 325 28.5 408Rural 18.4 244 41 775 35.6 1019
Mother’s educationNone * 14 37.3 53 37.3 67Primary 15.3 57 36.7 167 31.3 224Lower Secondary 16.2 101 37.5 445 33.6 545Upper Secondary 18.1 81 45 218 37.7 299Tertiary 14.3 75 35.6 217 30.1 291
Wealth index quintilePoorest 28 79 43.5 234 39.6 313Second 17.3 61 40.9 210 35.6 271Middle 18.4 65 36.5 199 32.1 264Fourth 6.8 60 40.4 212 33 272Richest 11.2 63 31.5 244 27.3 307
Ethnicity of household headkinh/Hoa 14 273 37 929 31.8 1202Ethnic Minorities 31.9 54 46.4 171 42.9 225
Total 17 327 38.5 1100 33.5 14271 MICS indicator 2.6
2 MICS indicator 2.14
Note:Figures denoted by an asterisk are based on denominators of 24 un-weighted cases and lessFigures shown in parenthesis are based on denominators of 25-49 un-weighted cases
Adequate complementary feeding of children from 6 months to two years of age is particularly important for growth and development and the prevention of under-nutrition. Continued breastfeeding beyond six months should be accompanied by consumption of nutritionally adequate, safe and appropriate complementary foods that help meet nutritional requirements when breast milk is no longer sufficient. This requires that for breastfed children, two or more meals of solid, semi-solid or soft foods are needed if they are six to eight months old, and three or more meals if they are 9–23 months of age. For children 6–23 months and older who are not breastfed, four or more meals of solid, semi-solid or soft foods or milk feeds are needed.
PDF compression, OCR, web optimization using a watermarked evaluation copy of CVISION PDFCompressor

62 VIET NAM MULTIPLE INDICATOR CLUSTER SURVEY 2010–2011
MONITORING THE SITUATION OF CHILDREN AND WOMEN
Overall, 50.4 per cent of infants age 6–8 months received solid, semi-solid, or soft foods (Table NU.6). Among currently breastfeeding infants the percentage is 46. There are no noteworthy disparities by sex.
Table NU.6: Introduction of solid, semi-solid or soft foods
Percentage of infants age 6-8 months who received solid, semi-solid or soft foods during the previous day, Viet Nam, 2010 - 2011
All Currently breastfeeding
Percent receiving solid, semi-solid or soft foods1
Number of children age 6-8 months Percent receiving solid,
semi-solid or soft foodsNumber of children
age 6-8 months
Sex
Male 52 72 47 63
Female 49 79 45 68
Area
Urban (52.3) 37 (39.1) 25
Rural 49.8 114 47.6 106
Total 50.4 151 46 1311 MICS indicator 2.12
Note:Figures shown in parenthesis are based on denominators of 25-49 un-weighted cases
Table NU.7 presents the proportion of children age 6–23 months who received semi-solid or soft foods the minimum number of times or more during the previous day according to breastfeeding status. The note at the bottom of Table NU.7 provides the definition of minimum number of times for different age groups.
PDF compression, OCR, web optimization using a watermarked evaluation copy of CVISION PDFCompressor

63VIET NAM MULTIPLE INDICATOR CLUSTER SURVEY 2010–2011
MONITORING THE SITUATION OF CHILDREN AND WOMEN
Table NU.7: Minimum meal frequency
Percentage of children aged 6-23 months who received solid, semi-solid, or soft foods (and milk feeds for non-breastfeeding children) the minimum number of times or more during the previous day, according to breastfeeding status, Viet Nam, 2010 - 2011 Currently breastfeeding Currently not breastfeeding All
Percentage receiving solid,
semi-solid and soft foods the minimum
number of times§
Number of
children aged 6-23
months
Percentage receiving at least 2 milk
feeds1
Percentage receiving
solid, semi-solid and
soft foods or milk feeds 4 times or
more
Number of
children aged 6-23
months
Percentage with
minimum meal
frequency2
Number of
children aged 6-23
months Sex
Male 46 316 82.9 82.8 223 61.2 539Female 35.5 332 81.6 85.5 229 55.9 561
Age (months)6-8 41.1 131 * * 20 47.9 1519-11 33.1 167 * * 23 39.7 19012-17 39.3 274 85.7 85.8 141 55.1 41518-23 61.1 75 77.9 82.4 269 77.7 344
RegionRed River Delta 54.5 123 93.4 88.4 98 69.5 221Northern Midland and Mountain areas 37.3 150 62.3 80.6 68 50.8 219
North Central area and Central Coastal area
37.9 147 69.1 77.9 77 51.7 224
Central Highlands 24.3 54 * * 22 36.7 76South East 37.5 75 98.6 94.3 101 70.1 176Mekong River Delta 43.7 98 79 80.1 85 60.6 184
AreaUrban 33.3 169 95.1 90.9 156 61 325Rural 43.2 479 75.4 80.6 296 57.5 775
Mother’s educationNone (39.5) 36 * * 17 42.1 53Primary 43.1 95 64.9 73.4 72 56.2 167Lower Secondary 36.2 272 83.3 83.7 172 54.6 445Upper Secondary 49.8 138 89.6 88.1 81 63.9 218Tertiary 38.3 107 95.7 94.7 110 66.9 217
Wealth index quintilePoorest 42.5 155 51.9 70.6 79 52 234Second 44.8 137 72.1 74.8 73 55.2 210Middle 33.5 118 84.5 81.9 81 53.2 199Fourth 42.3 126 92.7 89.1 86 61.2 212Richest 38.5 111 97.7 95.6 133 69.6 244
Ethnicity of household headkinh/Hoa 40.9 523 85 85.5 407 60.4 929Ethnic Minorities 39.3 125 (57.6) (72.3) 45 48.1 171
Total 40.6 648 82.2 84.2 452 58.5 11001 MICS indicator 2.152 MICS indicator 2.13
§Among currently breastfeeding children aged 6-8 months, minimum meal frequency is defined as children who also received solid, semi-solid or soft foods 2 times or more. Among currently breastfeeding children aged 9-23 months, receipt of solid, semi-solid or soft foods at least 3 times constitutes minimum meal frequency. For non-breastfeeding children aged 6-23 months, minimum meal frequency is defined as children receiving solid, semi-solid or soft foods, and milk feeds, at least 4 times during the previous day.
Note: Figures denoted by an asterisk are based on denominators of 24 un-weighted cases and lessFigures shown in parenthesis are based on denominators of 25-49 un-weighted cases
PDF compression, OCR, web optimization using a watermarked evaluation copy of CVISION PDFCompressor
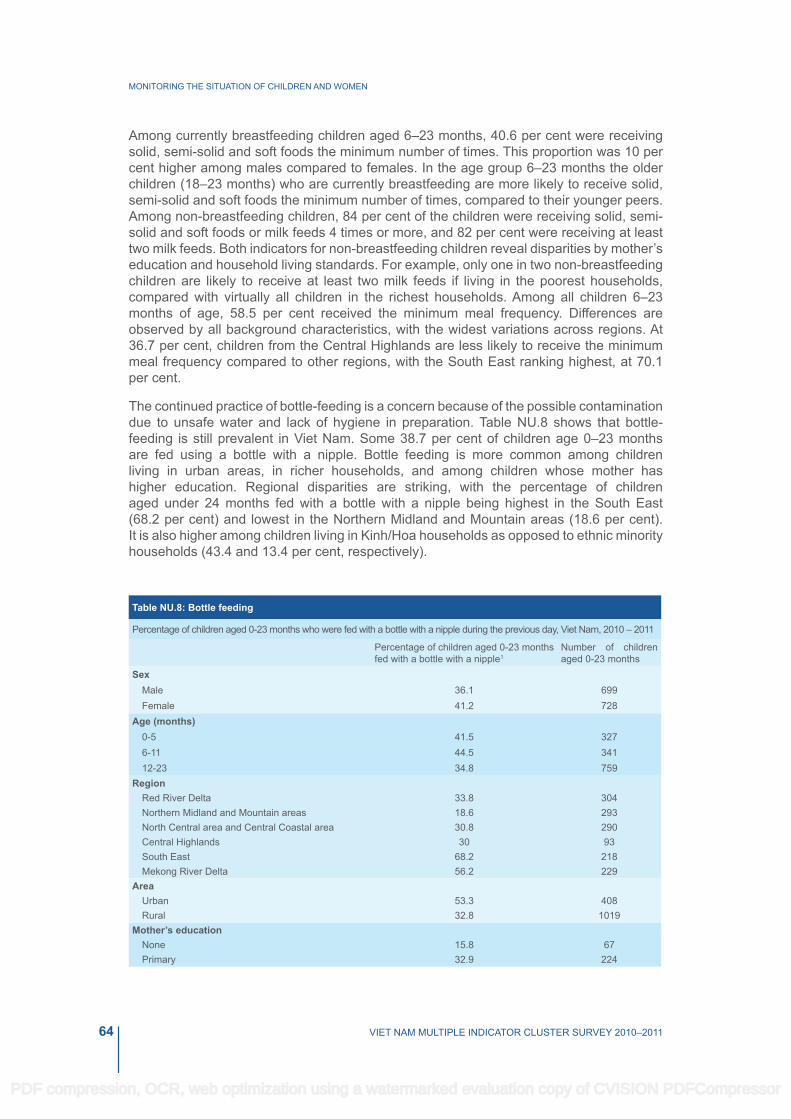
64 VIET NAM MULTIPLE INDICATOR CLUSTER SURVEY 2010–2011
MONITORING THE SITUATION OF CHILDREN AND WOMEN
Among currently breastfeeding children aged 6–23 months, 40.6 per cent were receiving solid, semi-solid and soft foods the minimum number of times. This proportion was 10 per cent higher among males compared to females. In the age group 6–23 months the older children (18–23 months) who are currently breastfeeding are more likely to receive solid, semi-solid and soft foods the minimum number of times, compared to their younger peers. Among non-breastfeeding children, 84 per cent of the children were receiving solid, semi-solid and soft foods or milk feeds 4 times or more, and 82 per cent were receiving at least two milk feeds. Both indicators for non-breastfeeding children reveal disparities by mother’s education and household living standards. For example, only one in two non-breastfeeding children are likely to receive at least two milk feeds if living in the poorest households, compared with virtually all children in the richest households. Among all children 6–23 months of age, 58.5 per cent received the minimum meal frequency. Differences are observed by all background characteristics, with the widest variations across regions. At 36.7 per cent, children from the Central Highlands are less likely to receive the minimum meal frequency compared to other regions, with the South East ranking highest, at 70.1 per cent.
The continued practice of bottle-feeding is a concern because of the possible contamination due to unsafe water and lack of hygiene in preparation. Table NU.8 shows that bottle-feeding is still prevalent in Viet Nam. Some 38.7 per cent of children age 0–23 months are fed using a bottle with a nipple. Bottle feeding is more common among children living in urban areas, in richer households, and among children whose mother has higher education. Regional disparities are striking, with the percentage of children aged under 24 months fed with a bottle with a nipple being highest in the South East (68.2 per cent) and lowest in the Northern Midland and Mountain areas (18.6 per cent). It is also higher among children living in kinh/Hoa households as opposed to ethnic minority households (43.4 and 13.4 per cent, respectively).
Table NU.8: Bottle feeding
Percentage of children aged 0-23 months who were fed with a bottle with a nipple during the previous day, Viet Nam, 2010 – 2011
Percentage of children aged 0-23 months fed with a bottle with a nipple1
Number of children aged 0-23 months
Sex Male 36.1 699Female 41.2 728
Age (months)0-5 41.5 3276-11 44.5 34112-23 34.8 759
RegionRed River Delta 33.8 304Northern Midland and Mountain areas 18.6 293North Central area and Central Coastal area 30.8 290Central Highlands 30 93South East 68.2 218Mekong River Delta 56.2 229
AreaUrban 53.3 408Rural 32.8 1019
Mother’s educationNone 15.8 67Primary 32.9 224
PDF compression, OCR, web optimization using a watermarked evaluation copy of CVISION PDFCompressor
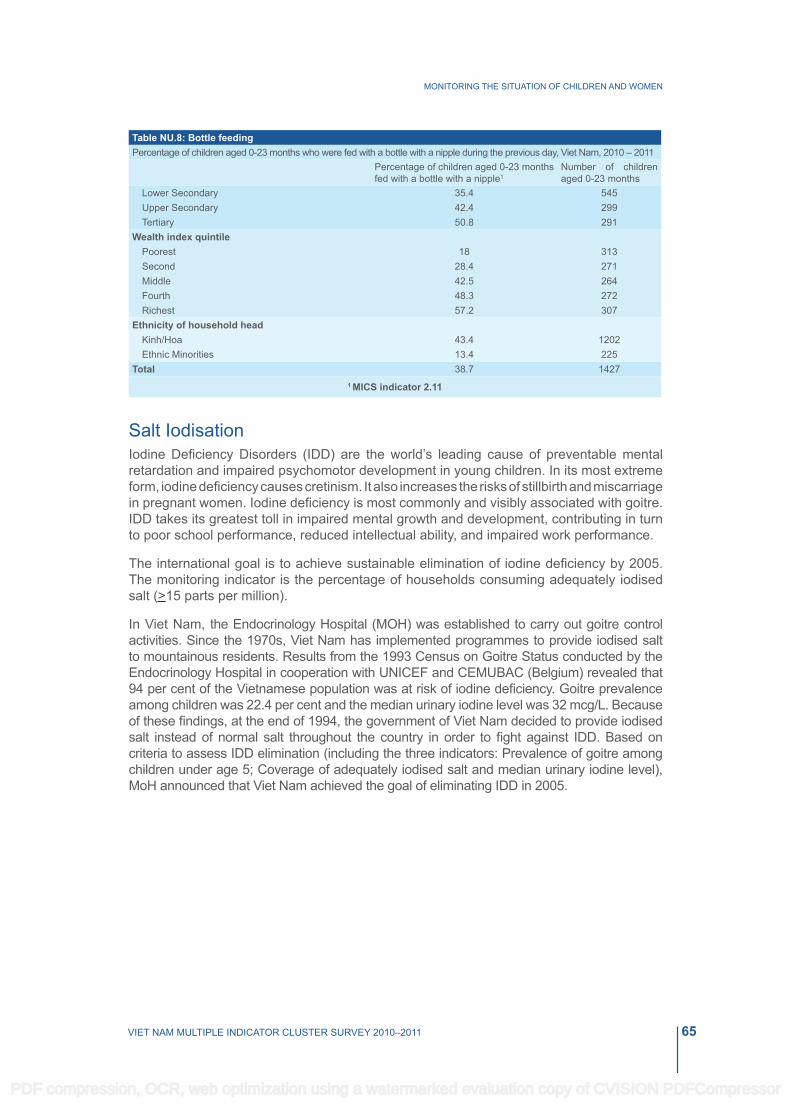
65VIET NAM MULTIPLE INDICATOR CLUSTER SURVEY 2010–2011
MONITORING THE SITUATION OF CHILDREN AND WOMEN
Table NU.8: Bottle feedingPercentage of children aged 0-23 months who were fed with a bottle with a nipple during the previous day, Viet Nam, 2010 – 2011
Percentage of children aged 0-23 months fed with a bottle with a nipple1
Number of children aged 0-23 months
Lower Secondary 35.4 545Upper Secondary 42.4 299Tertiary 50.8 291
Wealth index quintilePoorest 18 313Second 28.4 271Middle 42.5 264Fourth 48.3 272Richest 57.2 307
Ethnicity of household headkinh/Hoa 43.4 1202Ethnic Minorities 13.4 225
Total 38.7 14271 MICS indicator 2.11
Salt IodisationIodine Deficiency Disorders (IDD) are the world’s leading cause of preventable mental retardation and impaired psychomotor development in young children. In its most extreme form, iodine deficiency causes cretinism. It also increases the risks of stillbirth and miscarriage in pregnant women. Iodine deficiency is most commonly and visibly associated with goitre. IDD takes its greatest toll in impaired mental growth and development, contributing in turn to poor school performance, reduced intellectual ability, and impaired work performance.
The international goal is to achieve sustainable elimination of iodine deficiency by 2005. The monitoring indicator is the percentage of households consuming adequately iodised salt (>15 parts per million).
In Viet Nam, the Endocrinology Hospital (MOH) was established to carry out goitre control activities. Since the 1970s, Viet Nam has implemented programmes to provide iodised salt to mountainous residents. Results from the 1993 Census on Goitre Status conducted by the Endocrinology Hospital in cooperation with UNICEF and CEMUbAC (belgium) revealed that 94 per cent of the Vietnamese population was at risk of iodine deficiency. Goitre prevalence among children was 22.4 per cent and the median urinary iodine level was 32 mcg/L. Because of these findings, at the end of 1994, the government of Viet Nam decided to provide iodised salt instead of normal salt throughout the country in order to fight against IDD. Based on criteria to assess IDD elimination (including the three indicators: Prevalence of goitre among children under age 5; Coverage of adequately iodised salt and median urinary iodine level), MoH announced that Viet Nam achieved the goal of eliminating IDD in 2005.
PDF compression, OCR, web optimization using a watermarked evaluation copy of CVISION PDFCompressor
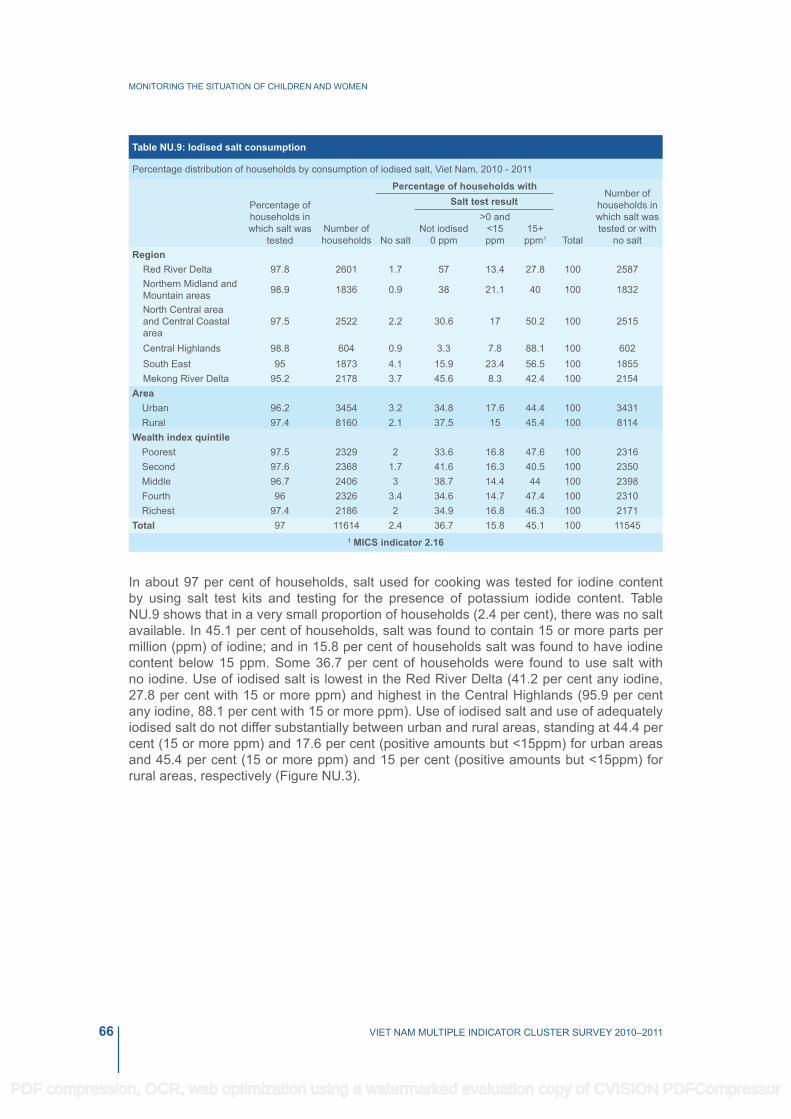
66 VIET NAM MULTIPLE INDICATOR CLUSTER SURVEY 2010–2011
MONITORING THE SITUATION OF CHILDREN AND WOMEN
Table NU.9: Iodised salt consumption
Percentage distribution of households by consumption of iodised salt, Viet Nam, 2010 - 2011
Percentage of households in which salt was
testedNumber of households
Percentage of households with Number of
households in which salt was tested or with
no saltNo salt
Salt test result
Not iodised 0 ppm
>0 and <15 ppm
15+ ppm1 Total
Region Red River Delta 97.8 2601 1.7 57 13.4 27.8 100 2587Northern Midland and Mountain areas 98.9 1836 0.9 38 21.1 40 100 1832
North Central area and Central Coastal area
97.5 2522 2.2 30.6 17 50.2 100 2515
Central Highlands 98.8 604 0.9 3.3 7.8 88.1 100 602South East 95 1873 4.1 15.9 23.4 56.5 100 1855Mekong River Delta 95.2 2178 3.7 45.6 8.3 42.4 100 2154
Area Urban 96.2 3454 3.2 34.8 17.6 44.4 100 3431Rural 97.4 8160 2.1 37.5 15 45.4 100 8114
Wealth index quintile Poorest 97.5 2329 2 33.6 16.8 47.6 100 2316Second 97.6 2368 1.7 41.6 16.3 40.5 100 2350Middle 96.7 2406 3 38.7 14.4 44 100 2398Fourth 96 2326 3.4 34.6 14.7 47.4 100 2310Richest 97.4 2186 2 34.9 16.8 46.3 100 2171
Total 97 11614 2.4 36.7 15.8 45.1 100 115451 MICS indicator 2.16
In about 97 per cent of households, salt used for cooking was tested for iodine content by using salt test kits and testing for the presence of potassium iodide content. Table NU.9 shows that in a very small proportion of households (2.4 per cent), there was no salt available. In 45.1 per cent of households, salt was found to contain 15 or more parts per million (ppm) of iodine; and in 15.8 per cent of households salt was found to have iodine content below 15 ppm. Some 36.7 per cent of households were found to use salt with no iodine. Use of iodised salt is lowest in the Red River Delta (41.2 per cent any iodine, 27.8 per cent with 15 or more ppm) and highest in the Central Highlands (95.9 per cent any iodine, 88.1 per cent with 15 or more ppm). Use of iodised salt and use of adequately iodised salt do not differ substantially between urban and rural areas, standing at 44.4 per cent (15 or more ppm) and 17.6 per cent (positive amounts but <15ppm) for urban areas and 45.4 per cent (15 or more ppm) and 15 per cent (positive amounts but <15ppm) for rural areas, respectively (Figure NU.3).
PDF compression, OCR, web optimization using a watermarked evaluation copy of CVISION PDFCompressor

67VIET NAM MULTIPLE INDICATOR CLUSTER SURVEY 2010–2011
MONITORING THE SITUATION OF CHILDREN AND WOMEN
Figure NU.3 Percentage of households consuming adequately iodised salt by region, Viet Nam, 2010–2011
Children’s Vitamin A SupplementationVitamin A is essential for eye health and proper functioning of the immune system. It is found in foods such as milk, liver, eggs, red and orange fruits, red palm oil and green leafy vegetables, although the amount of vitamin A readily available to the body from these sources varies widely. In developing areas of the world, where vitamin A is largely consumed in the form of fruits and vegetables, daily per capita intake is often insufficient to meet dietary requirements. Inadequate intakes are further compromised by increased requirements for the vitamin as children grow or during periods of illness, as well as increased losses during common childhood infections. As a result, vitamin A deficiency is prevalent in the developing world and particularly in countries with the highest burden of under-five deaths.
The 1990 World Summit for Children set the goal of virtual elimination of vitamin A deficiency and its consequences, including blindness, by the year 2000. This goal was also endorsed at the Policy Conference on Ending Hidden Hunger in 1991, the 1992 International Conference on Nutrition, and the UN General Assembly’s Special Session on Children in 2002. The critical role of vitamin A for child health and immune function also makes control of deficiency a primary component of child survival efforts, and therefore critical to the achievement of the fourth Millennium Development Goal: a two-thirds reduction in under-five mortality by the year 2015.
For countries with vitamin A deficiency problems, current international recommendations call for high-dose vitamin A supplementation every four to six months, targeted to all children between the ages of six to 59 months living in affected areas. Providing young children with two high-dose vitamin A capsules a year is a safe, cost-effective, efficient strategy for eliminating vitamin A deficiency and improving child survival. Giving vitamin A to new mothers who are breastfeeding helps protect their children during the first months
PDF compression, OCR, web optimization using a watermarked evaluation copy of CVISION PDFCompressor

68 VIET NAM MULTIPLE INDICATOR CLUSTER SURVEY 2010–2011
MONITORING THE SITUATION OF CHILDREN AND WOMEN
of life and helps to replenish the mother’s stores of vitamin A, which are depleted during pregnancy and lactation. For countries with vitamin A supplementation programmes, the definition of the indicator is the percentage of children 6–59 months of age receiving at least one high dose vitamin A supplement in the last six months.
In 1987, the Government of Viet Nam approved the National Programme for Prevention and Control of Vitamin A Deficiency. This programme was piloted in some districts and was then expanded to the entire country in 1993. Based on UNICEF/WHO guidelines, the Viet Nam Ministry of Health recommends that children aged 6–11 months be given one high dose Vitamin A capsule per year and children aged 12–59 months be given a vitamin A capsule every 6 months. Vitamin A is integrated with immunization services and is given when the child has contact with these services after six months of age. The Vitamin A supplementation campaigns in Viet Nam are organised twice per year in June and December. It is also recommended that mothers take a Vitamin A supplement within eight weeks of giving birth due to increased Vitamin A requirements during pregnancy and lactation It is noted that the Vietnamese Vitamin A Supplementation Programme targets children aged 6–36 (and not 6–59) months nation-wide, and that children up to 59 months are only targeted in selected provinces.
Within the six months prior to MICS4 data collection, 83.4 per cent of children aged 6–59 months received a high dose Vitamin A supplement (Table NU.10). Vitamin A supplementation coverage is lower in the South East (77.6 per cent) than in other regions (for example 88.2 per cent in the Red River Delta).This percentage is quite low when the mother has no education, at only 60.9 per cent. There are no large differences by sex, area and ethnicity.
PDF compression, OCR, web optimization using a watermarked evaluation copy of CVISION PDFCompressor

69VIET NAM MULTIPLE INDICATOR CLUSTER SURVEY 2010–2011
MONITORING THE SITUATION OF CHILDREN AND WOMEN
Table NU.10: Children's vitamin A supplementation
Percentage distribution of children aged 6-59 months by receipt of a high dose vitamin A supplement in the last 6 months, Viet Nam, 2010 – 2011
Percentage who received Vitamin A according to: Percentage of
children who received Vitamin
A during the last 6 months1
Number of children aged 6-59
monthsChild health book/card/
vaccination cardMother's
reportSex
Male 3.3 82.9 82.9 1709Female 5.1 83.8 83.9 1642
RegionRed River Delta 6.5 88.2 88.2 715Northern Midland and Mountain areas 2.4 84.9 84.9 633North Central area and Central Coastal area 1.2 84 84 653Central Highlands 5.7 85.8 85.8 216South East 4.4 77.6 77.6 530Mekong River Delta 5.5 79.5 79.6 605
AreaUrban 7.2 84.4 84.4 930Rural 3 83 83 2421
Age (months)6-11 5.9 72.5 72.5 34112-23 7.4 90.9 91 75924-35 5.5 88.9 88.9 79236-47 1.6 83.4 83.4 76448-59 1 74.2 74.2 695
Mother’s educationNone 2 60.9 60.9 193Primary 1.7 76.9 76.9 601Lower Secondary 2.5 85.6 85.7 1378Upper Secondary 6.1 85.8 85.8 589Tertiary 9.4 89.7 89.7 589
Wealth index quintilePoorest 2 76 76 752Second 3.1 81.6 81.6 613Middle 3.1 86.3 86.4 636Fourth 3.9 88.3 88.3 689Richest 8.8 85.4 85.4 662
Ethnicity of household headkinh/Hoa 4.6 84.5 84.5 2870Ethnic Minorities 1.5 76.4 76.4 481
Total 4.1 83.4 83.4 33511 MICS indicator 2.17
The age pattern of Vitamin A supplementation shows that the highest proportion of children are missing the first high dose of supplementation at the age 6–11 months, and the last dose at the age of 48–59 months, with the doses in between showing a higher percentage. Only 72.5 per cent of children receive the first dose and 74.2 per cent the last dose, with percentages in between ranging from 83.4 per cent for children aged 36–47 months to 91.0 per cent for those aged 12–23 months.
The mother’s level of education is also positively correlated with the likelihood of a child receiving Vitamin A supplementation, increasing from 60.9 per cent among children whose
PDF compression, OCR, web optimization using a watermarked evaluation copy of CVISION PDFCompressor

70 VIET NAM MULTIPLE INDICATOR CLUSTER SURVEY 2010–2011
MONITORING THE SITUATION OF CHILDREN AND WOMEN
mothers have no education to 76.9 per cent of children whose mothers have primary education and 85.7 per cent of children whose mothers have lower secondary education. Disparities are also observed by household living standards, with 76 per cent of children in the poorest households receiving Vitamin A during the 6 months preceding the survey, compared with 85.4 per cent in the richest households.
Low birth WeightWeight at birth is a good indicator reflecting a mother’s health and nutritional status but also a good indicator of the newborn’s chances for survival, growth, long-term health and psychosocial development. Low birth weight (less than 2500 grams) carries with it a range of grave health risks for children. Babies who were undernourished in the womb face a greatly increased risk of dying during their early months and years. Those who survive have impaired immune function and increased risk of disease; they are likely to remain undernourished, with reduced muscle strength, throughout their lives, and suffer a higher incidence of diabetes and heart disease in later life. Children born underweight also tend to have a lower IQ and cognitive disabilities, affecting their performance in school and their job opportunities as adults.
In the developing world, low birth weight stems primarily from the mother’s poor health and nutrition. Three factors have the most impact: the mother’s poor nutritional status before conception, short stature (due mostly to under nutrition and infections during her childhood), and poor nutrition during the pregnancy. Inadequate weight gain during pregnancy is particularly important since it accounts for a large proportion of foetal growth retardation. Moreover, diseases such as diarrhoea and malaria, which are common in many developing countries, can substantially impair foetal growth if the mother becomes infected while pregnant.
In the industrialized world, cigarette smoking during pregnancy is the leading cause of low birth weight. In developed and developing countries alike, teenagers who give birth when their own bodies have yet to finish growing run the risk of bearing underweight babies.
One of the major challenges in measuring the incidence of low birth weight is the fact that more than half of infants in the developing world are not weighed. In the past, most estimates of low birth weight for developing countries were based on data compiled from health facilities. However, these estimates are biased for most developing countries because the majority of newborns are not delivered in facilities, and those who are represent only a selected sample of all births.
because many infants are not weighed at birth and those who are weighed may be a biased sample of all births, the reported birth weights usually cannot be used to estimate the prevalence of low birth weight among all children. Therefore, the percentage of births weighing below 2500 grams is estimated from two items in the questionnaire: the mother’s assessment of the child’s size at birth (i.e., very small, smaller than average, average, larger than average, very large) and the mother’s recall of the child’s weight or the weight as recorded on a health card if the child was weighed at birth16.
16 For a detailed description of the methodology, see JT Boerma, KI Weinstein, SO Rutstein and AE Sommerfelt, 1996. “Data on birth weight in developing countries: can surveys help?” in Bulletin of the World Health Organization. 74(2): 209–216.
PDF compression, OCR, web optimization using a watermarked evaluation copy of CVISION PDFCompressor

71VIET NAM MULTIPLE INDICATOR CLUSTER SURVEY 2010–2011
MONITORING THE SITUATION OF CHILDREN AND WOMEN
Table NU.11: Low birth weight infants
Percentage of last-born children in the 2 years preceding the survey that are estimated to have weighed below 2500 grams at birth and percentage of live births weighed at birth, Viet Nam, 2010 - 2011
Percent of live births:
Number of live births in the last 2 yearsBelow 2500 grams1 Weighed at birth2
Region Red River Delta 4.4 99.2 294Northern Midland and Mountain areas 5.9 78.1 285
North Central area and Central Coastal area 4.3 96.6 287
Central Highlands 6.5 79.6 92South East 5.5 100 214Mekong River Delta 5.3 100 210
AreaUrban 5.2 98.4 402Rural 5.1 91.1 980
Mother’s educationNone 8.4 46.5 64Primary 6.5 87.5 203Lower Secondary 4.9 95.9 523Upper Secondary 5.4 97.1 296Tertiary 3.6 98.9 295
Wealth index quintilePoorest 5.4 75.1 300Second 5.5 97 263Middle 5.1 97.9 251Fourth 5.3 98.8 270Richest 4.4 99.2 299
Ethnicity of household headkinh/Hoa 5 98.6 1158Ethnic Minorities 6 65.8 225
Total 5.1 93.2 13831 MICS indicator 2.182 MICS indicator 2.19
Overall, 93.2 per cent of births were weighed at birth and approximately 5.1 per cent of infants are estimated to weigh less than 2500 grams at birth (Table NU.11). There was some variation by region (Figure NU.4). The percentage of low birth weight does not vary much by urban and rural areas or by mother’s education.
PDF compression, OCR, web optimization using a watermarked evaluation copy of CVISION PDFCompressor

72 VIET NAM MULTIPLE INDICATOR CLUSTER SURVEY 2010–2011
MONITORING THE SITUATION OF CHILDREN AND WOMEN
Figure NU.4 Percentage of infants weighing less than 2500 grams at birth by region, Viet Nam, 2010–2011
PDF compression, OCR, web optimization using a watermarked evaluation copy of CVISION PDFCompressor

73VIET NAM MULTIPLE INDICATOR CLUSTER SURVEY 2010–2011
MONITORING THE SITUATION OF CHILDREN AND WOMEN
VI. CHILD HEALTH
PDF compression, OCR, web optimization using a watermarked evaluation copy of CVISION PDFCompressor

74 VIET NAM MULTIPLE INDICATOR CLUSTER SURVEY 2010–2011
MONITORING THE SITUATION OF CHILDREN AND WOMEN
ImmunizationThe Millennium Development Goal (MDG) 4 is to reduce child mortality by two thirds between 1990 and 2015. Immunization plays a key part in this goal. It has saved the lives of millions of children in the three decades since the launch of the Expanded Programme on Immunization (EPI) in 1974. Worldwide there are still 27 million children overlooked by routine immunization and as a result, vaccine-preventable diseases cause more than two million deaths every year. One of the World Fit for Children goals is to ensure full immunization of children under 1 year of age at 90 per cent nationally, with at least 80 per cent coverage in every district or equivalent administrative unit.
According to the Viet Nam Ministry of Health (MoH) guidelines, a child should receive a bCG vaccination to protect against tuberculosis; a birth dose of hepatitis b vaccine, three doses of DPT to protect against diphtheria, pertussis, and tetanus; three doses of Hepatitis B vaccine; three doses of polio vaccine, and a measles vaccination by the age of 12 months. In June 2010 the new Pentavalent vaccine was introduced in Viet Nam, which combines DPT, Hepatitis B and Hib (Haemophilusinfluenza type B) antigens. Administered in three doses, the Pentavalent vaccine replaced the previously separate DPT and Hepatitis b vaccines. To accommodate the registration of the Pentavalent vaccine a new immunization handbook was issued.
In Viet Nam, a child is considered to be fully immunized if he/she received seven antigens, notably BCG, DPT (1–3), Polio (1–3), measles and Hepatitis B (1–3). Hepatitis B at birth is not included in the full immunization indicator.
In Viet Nam MICS4, mothers were asked to provide vaccination cards for children under the age of 5 years, from which interviewers copied vaccination information onto the MICS questionnaire. The questionnaire was customised to allow the registration of immunizations for children who received single as well as those who received combined vaccines.
PDF compression, OCR, web optimization using a watermarked evaluation copy of CVISION PDFCompressor
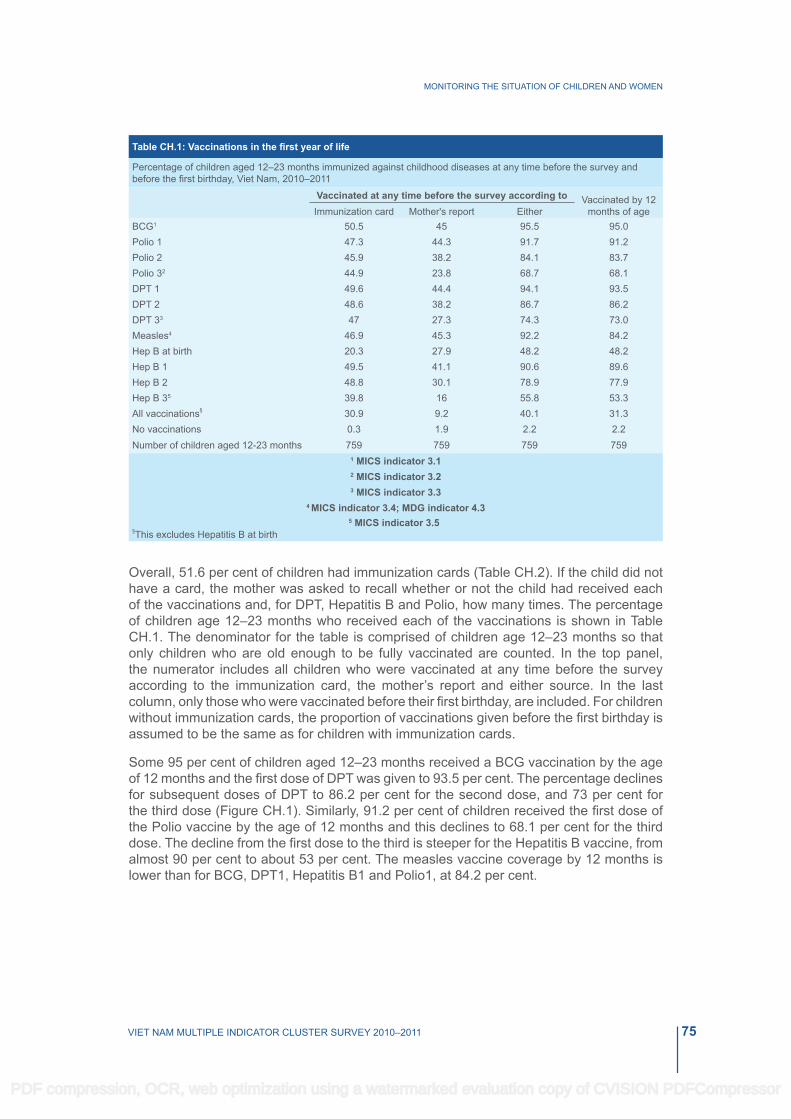
75VIET NAM MULTIPLE INDICATOR CLUSTER SURVEY 2010–2011
MONITORING THE SITUATION OF CHILDREN AND WOMEN
Table CH.1: Vaccinations in the first year of life
Percentage of children aged 12–23 months immunized against childhood diseases at any time before the survey and before the first birthday, Viet Nam, 2010–2011
Vaccinated at any time before the survey according to Vaccinated by 12
months of ageImmunization card Mother's report EitherbCG1 50.5 45 95.5 95.0Polio 1 47.3 44.3 91.7 91.2Polio 2 45.9 38.2 84.1 83.7Polio 32 44.9 23.8 68.7 68.1DPT 1 49.6 44.4 94.1 93.5DPT 2 48.6 38.2 86.7 86.2DPT 33 47 27.3 74.3 73.0Measles4 46.9 45.3 92.2 84.2Hep b at birth 20.3 27.9 48.2 48.2Hep b 1 49.5 41.1 90.6 89.6Hep b 2 48.8 30.1 78.9 77.9Hep B 35 39.8 16 55.8 53.3All vaccinations§ 30.9 9.2 40.1 31.3No vaccinations 0.3 1.9 2.2 2.2Number of children aged 12-23 months 759 759 759 759
1 MICS indicator 3.1 2 MICS indicator 3.2 3 MICS indicator 3.3
4 MICS indicator 3.4; MDG indicator 4.35 MICS indicator 3.5
§This excludes Hepatitis b at birth
Overall, 51.6 per cent of children had immunization cards (Table CH.2). If the child did not have a card, the mother was asked to recall whether or not the child had received each of the vaccinations and, for DPT, Hepatitis B and Polio, how many times. The percentage of children age 12–23 months who received each of the vaccinations is shown in Table CH.1. The denominator for the table is comprised of children age 12–23 months so that only children who are old enough to be fully vaccinated are counted. In the top panel, the numerator includes all children who were vaccinated at any time before the survey according to the immunization card, the mother’s report and either source. In the last column, only those who were vaccinated before their first birthday, are included. For children without immunization cards, the proportion of vaccinations given before the first birthday is assumed to be the same as for children with immunization cards.
Some 95 per cent of children aged 12–23 months received a BCG vaccination by the age of 12 months and the first dose of DPT was given to 93.5 per cent. The percentage declines for subsequent doses of DPT to 86.2 per cent for the second dose, and 73 per cent for the third dose (Figure CH.1). Similarly, 91.2 per cent of children received the first dose of the Polio vaccine by the age of 12 months and this declines to 68.1 per cent for the third dose. The decline from the first dose to the third is steeper for the Hepatitis b vaccine, from almost 90 per cent to about 53 per cent. The measles vaccine coverage by 12 months is lower than for bCG, DPT1, Hepatitis b1 and Polio1, at 84.2 per cent.
PDF compression, OCR, web optimization using a watermarked evaluation copy of CVISION PDFCompressor

76 VIET NAM MULTIPLE INDICATOR CLUSTER SURVEY 2010–2011
MONITORING THE SITUATION OF CHILDREN AND WOMEN
Figure CH.1: Percentage of children aged 12-23 months who received basic vaccinations by 12 months, Viet Nam, 2010–2011
Table CH.2 shows the vaccination coverage rates among children aged 12–23 months by background characteristics. The figures indicate children receiving the vaccinations at any time up to the date of the survey, and are based on information from both the immunization cards and mothers’/caregivers’ reports. Differentials are observed by all background characteristics, but the widest ranges are noticed by mother’s education and ethnicity of the household head. For example, the vaccine with the highest national coverage, BCG, shows an almost 15 percentage point difference between children living in Kinh/Hoa households and children living in ethnic minority households. Children whose mother has a higher education level are more likely to be vaccinated than those whose mother has lower or no education. In fact, the majority of children who received no vaccination (23.5 per cent) have uneducated mothers. Only 18.5 per cent of children whose mothers are uneducated received a Hepatitis B vaccination at birth compared to 62.5 per cent of children whose mothers have tertiary education. Household living standards also seem to be a factor. Some 30.4 per cent of children living in the poorest households received all recommended vaccinations, which is 20 percentage points lower than among their peers in the richest households. The North Central area and Central Coastal area is the region with the lowest percentage of children who received all vaccinations, only 28.2 per cent. This region indicates comparatively lower levels of immunization for the third dose of Hepatitis b, DPT and especially Polio, and compares to 53.6 per cent in the South East. As expected, higher immunization rates are observed in urban areas.
The percentage of children whose immunization cards were seen by the interviewers declines as mothers’ education level and wealth quintile decline, and is higher in urban areas than in rural areas. The details in the data quality table DQ.10 (see Appendix D) show a notably lower percentage of immunization cards seen for older children. This may indicate poor vaccination record keeping in households.
PDF compression, OCR, web optimization using a watermarked evaluation copy of CVISION PDFCompressor

77VIET NAM MULTIPLE INDICATOR CLUSTER SURVEY 2010–2011
MONITORING THE SITUATION OF CHILDREN AND WOMEN
Tabl
e C
H.2
: Vac
cina
tions
by
back
grou
nd c
hara
cter
istic
s
Per
cent
age
of c
hild
ren
aged
12-
23 m
onth
s cu
rren
tly v
acci
nate
d ag
ains
t chi
ldho
od d
isea
ses,
Vie
t Nam
, 201
0 - 2
011
Pe
rcen
tage
of c
hild
ren
who
rece
ived
:
Per
cent
age
with
va
ccin
atio
n ca
rd s
een
Num
ber
of c
hild
ren
age
12-2
3 m
onth
sb
CG
Mea
sles
Non
eA
ll§
Pol
io 1
Pol
io 2
Pol
io 3
DP
T 1
DP
T 2
DP
T 3
Hep
bat
birt
hH
epb
1H
epb
2H
epB
3Se
x
Mal
e95
.191
.182
.765
.794
.586
.272
.592
.846
.791
.377
.954
.72.
238
.451
391
Fem
ale
95.9
92.2
85.6
7293
.587
.276
.291
.649
.789
.980
572.
241
.952
.336
8R
egio
n
Red
Riv
er D
elta
98.4
95.5
89.3
72.6
100
95.9
82.3
95.8
64.9
98.3
8460
.70
50.3
43.3
156
Nor
ther
n M
idla
nd a
nd M
ount
ain
area
s92
88.2
77.7
63.5
9180
67.9
90.6
26.7
91.4
78.4
53.1
3.8
37.9
47.1
154
Nor
th C
entra
l are
a an
d C
entra
l C
oast
al a
rea
96.1
93.2
8361
.991
.979
.465
.194
.151
.382
.166
.946
.11.
228
.250
.416
0
Cen
tral H
ighl
ands
91.3
90.8
8263
.289
.381
.863
.487
.939
.684
.177
.144
.15.
436
.242
.454
Sou
th E
ast
98.8
88.3
84.4
78.7
99.5
9789
96.2
49.1
96.7
93.6
67.9
0.5
53.6
7112
1M
ekon
g R
iver
Del
ta93
.792
.787
.872
.189
.284
.673
.884
.652
.487
.974
.959
.24.
833
.354
.611
4A
rea
U
rban
97.5
93.6
87.1
7797
.893
.182
.395
.258
.393
.988
.465
0.6
5263
.323
2R
ural
94.6
90.8
82.8
65.1
92.4
83.9
70.7
90.9
43.7
89.2
74.7
51.7
2.9
34.8
46.5
527
Mot
her’s
edu
catio
n
Non
e(7
0.9)
(61.
9)(5
0.9)
(27.
9)(6
2.8)
(50.
3)(3
5.3)
(64.
8)(1
8.5)
(59.
6)(4
8.)
(31.
6)(2
3.5)
(14.
2)(1
7.3)
33P
rimar
y92
.289
76.8
6089
.478
.566
.285
.435
.687
.376
.453
.55.
237
.247
.811
3Lo
wer
Sec
onda
ry96
.593
.887
.270
.495
.187
.775
.595
.246
.290
.378
.954
.60.
937
.950
.330
0U
pper
Sec
onda
ry98
.591
.786
.373
97.5
9179
.296
.851
.792
.181
.456
.60.
444
.556
.114
4Te
rtiar
y97
.995
.187
.875
.598
.393
.780
.592
.662
.597
.784
63.3
047
59.6
168
Wea
lth in
dex
quin
tile
P
oore
st88
.486
.369
.255
.686
.771
.560
.485
.428
.185
.462
.944
.76
30.4
37.9
165
Sec
ond
97.4
98.3
94.3
7292
.885
.272
.494
.447
.885
.979
.753
.81.
737
.857
.613
1M
iddl
e97
.392
.988
66.1
95.6
88.7
74.1
95.2
50.4
91.3
8155
.20.
437
.442
.514
4Fo
urth
96.9
87.8
84.1
7195
.191
.978
.191
.155
.890
.780
.461
.22.
743
.652
.414
5R
iche
st98
93.9
87.3
78.9
99.7
9685
.595
.459
98.5
90.2
63.6
050
.367
.217
4Et
hnic
ity o
f hou
seho
ld h
ead
k
inh/
Hoa
97.7
93.6
87.6
71.6
96.5
90.6
78.2
93.9
53.3
9281
.157
.61.
140
.953
.264
6
Eth
nic
Min
oriti
es82
.580
.164
.352
.879
.863
.751
.282
.418
.282
.863
.645
.58.
535
.142
.611
3
Tota
l95
.591
.784
.168
.794
.186
.774
.392
.248
.290
.678
.955
.82.
240
.151
.675
9§ Th
is in
dica
tor e
xclu
des
Hep
atiti
s B
at b
irth.
In V
iet N
am, t
he n
ew P
enta
vale
nt v
acci
ne (c
ombi
ning
the
follo
win
g 5
antig
ens:
DP
T, H
epat
itis
B a
nd H
ib) w
as in
trodu
ced
in J
une
2010
. The
refo
re, a
ch
ild is
con
side
red
to h
ave
rece
ived
all
vacc
inat
ion
if he
/she
(1) r
ecei
ved
BC
G, P
olio
1-3
, DP
T 1-
3, H
epat
itis
B 1
-3 a
nd M
easl
es o
r (2)
rece
ived
Pen
tava
lent
1-3
, Pol
io 1
-3, B
CG
and
Mea
sles
Not
e:Fi
gure
s sh
own
in p
aren
thes
is a
re b
ased
on
deno
min
ator
s of
25-
49 u
n-w
eigh
ted
case
s
PDF compression, OCR, web optimization using a watermarked evaluation copy of CVISION PDFCompressor
78 VIET NAM MULTIPLE INDICATOR CLUSTER SURVEY 2010–2011
MONITORING THE SITUATION OF CHILDREN AND WOMEN
Neonatal Tetanus ProtectionMDG 5 is to reduce by three quarters the maternal mortality ratio, with one strategy being to eliminate maternal tetanus. Another goal is to reduce the incidence of neonatal tetanus to less than 1 case per 1,000 live births. One of the A World Fit for Children goals is to eliminate maternal and neonatal tetanus by 2005.
Prevention of maternal and neonatal tetanus requires assuring that all pregnant women receive at least two doses of tetanus toxoid vaccine. However, if women have not received two doses of the vaccine during the pregnancy, they (and their newborn) are also considered to be protected, if the following conditions are met:
● Received at least two doses of tetanus toxoid vaccine, the last within the past three years;
● Received at least three doses, the last within the past five years;
● Received at least four doses, the last within the past ten years;
● Received at least five doses during lifetime.
Table CH.3 shows the tetanus protection status of women who have had a live birth within the last two years. Figure CH.2 shows the protection of women against neonatal tetanus by major background characteristics.
PDF compression, OCR, web optimization using a watermarked evaluation copy of CVISION PDFCompressor

79VIET NAM MULTIPLE INDICATOR CLUSTER SURVEY 2010–2011
MONITORING THE SITUATION OF CHILDREN AND WOMEN
Table CH.3: Neonatal tetanus protection
Percentage of women aged 15-49 years with a live birth in the last two years protected against neonatal tetanus, Viet Nam, 2010- 2011
Percentage of women who
received at least two doses during last pregnancy
Percentage of women who did not receive two or more doses during their last pregnancy but
received:
Protected against tetanus1
Number of women with a live birth in the
last two years
two doses, the last
within the past three
years
three doses, the last
within the past five
years
four doses, the last
within the past ten
yearsRegion
Red River Delta 64.6 20.5 0 0 85.1 294Northern Midland and Mountain areas 60.6 14 0 0.4 74.9 285North Central area and Central Coastal area 63.6 15 0 0 78.6 287
Central Highlands 55 16.7 0.7 0.2 72.6 92South East 60.7 17.1 0.3 0.5 78.7 214Mekong River Delta 56.6 13.2 0 0 69.8 210
Area Urban 61.9 17.9 0.1 0 80 402Rural 60.8 15.4 0.1 0.2 76.5 980
Women’s education None 22.5 8.2 0 0 30.6 64Primary 49.9 18.1 0.3 0 68.3 203Lower Secondary 61.5 16.5 0.1 0 78.1 523Upper Secondary 68.1 17.3 0 0 85.4 296Tertiary 69.6 14.6 0.1 0.8 85.1 295
Wealth index quintile Poorest 49.7 10.8 0 0 60.5 300Second 65.5 15.8 0.3 0.4 81.9 263Middle 64.8 19 0 0 83.8 251Fourth 64.6 15 0.3 0.4 80.3 270Richest 62.5 20.2 0 0.1 82.8 299
Ethnicity of household head kinh/Hoa 63.6 17.2 0.1 0.1 81 1158Ethnic Minorities 48.3 10.4 0 0.5 59.2 225
Total 61.1 16.1 0.1 0.2 77.5 13831 MICS indicator 3.7
Table CH.3 shows that 77.5 per cent of women aged 15–49 with a live birth in the last two years are protected against tetanus.There is a considerable differential in tetanus protection across ethnic groups. About 81 per cent of women living in Kinh/Hoa households are protected against tetanus while the protection is only 59.2 per cent among women living in ethnic minority households. The widest gap, however, is observed across women’s education levels. There is a 54 percentage point difference between women with tertiary and those with no education. The likelihood of being protected against tetanus doubles between women with no education and those with at least primary education. Regional differentials show that in the Red River Delta 85.1 per cent of women of reproductive age who had a live birth in the last 2 years are protected against tetanus, while the percentage is about 69.8 among women living in the Mekong River Delta. Living standards also influence the prevalence of tetanus protection. About 80 per cent of women in the second, third, fourth, and fifth wealth index quintiles are protected against tetanus. The large disparity is observed for women in the poorest households, with only 60.5 per cent of women protected against neonatal tetanus.
PDF compression, OCR, web optimization using a watermarked evaluation copy of CVISION PDFCompressor

80 VIET NAM MULTIPLE INDICATOR CLUSTER SURVEY 2010–2011
MONITORING THE SITUATION OF CHILDREN AND WOMEN
Figure CH.2: Percentage of women with a live birth in the last 2 years protected against neonatal tetanus, Viet Nam, 2010 - 2011
Oral Rehydration TreatmentDiarrhoea is the second leading cause of death among children under age 5 worldwide. Most diarrhoea-related deaths in children are due to dehydration from loss of large quantities of water and electrolytes from the body in liquid stools. Management of diarrhoea – either through oral rehydration salts (ORS) or a recommended home fluid (RHF) – can prevent many of these deaths. Preventing dehydration and malnutrition by increasing fluid intake and continuing to feed the child are also important strategies for managing diarrhoea.
The goals are to: 1) reduce by one half the deaths due to diarrhoea among children under age 5 by 2010 compared to 2000 (A World Fit for Children); and 2) reduce by two thirds the mortality rate among children under age 5 by 2015 compared to 1990 (MDG). In addition, A World Fit for Children calls for a reduction in the incidence of diarrhoea by 25 per cent.
PDF compression, OCR, web optimization using a watermarked evaluation copy of CVISION PDFCompressor

81VIET NAM MULTIPLE INDICATOR CLUSTER SURVEY 2010–2011
MONITORING THE SITUATION OF CHILDREN AND WOMEN
The indicators are:
● Prevalence of diarrhoea
● Oral rehydration therapy (ORT)
● Home management of diarrhoea
● ORT with continued feeding
In the Viet Nam MICS4 questionnaire, mothers (or caregivers) were asked to report whether their child had diarrhoea in the two weeks prior to the survey. If so, the mother was asked a series of questions about what and how much the child was given to drink and eat during the episode and whether this was more or less than usual.
Overall, 7.4 per cent of children under age 5 had diarrhoea in the two weeks preceding the survey (Table CH.4). The peak of diarrhoea prevalence occurs in the infancy period, among children age 0–11 months. Diarrhoea prevalence varies across regions. More than 10 per cent of children under age 5 had diarrhoea in the Northern Midland and Mountain areas, compared to the lowest level at 5 per cent in the South East. This indicates that a child in the Northern Midland and Mountain areas is twice as likely to have diarrhoea than a child in the South East. Ethnic differentials indicate that 11.6 per cent of children living in ethnic minority households had diarrhoea in the last two weeks compared with 6.6 per cent of children in Kinh/Hoa households. It can also be observed that the younger the child, the more likely it is to suffer from diarrhoea. Indeed, the incidence of diarrhoea decreases substantially as age increases, from 13 per cent among children aged 0–11 months to 2.8 per cent for children aged 48–59 months.
PDF compression, OCR, web optimization using a watermarked evaluation copy of CVISION PDFCompressor

82 VIET NAM MULTIPLE INDICATOR CLUSTER SURVEY 2010–2011
MONITORING THE SITUATION OF CHILDREN AND WOMEN
Tabl
e C
H.4
: Ora
l reh
ydra
tion
solu
tions
and
reco
mm
ende
d ho
mem
ade
fluid
s
Per
cent
age
of c
hild
ren
age
0-59
mon
ths
with
dia
rrho
ea in
the
last
two
wee
ks, a
nd tr
eatm
ent w
ith o
ral r
ehyd
ratio
n so
lutio
ns a
nd re
com
men
ded
hom
emad
e flu
ids,
Vie
t Nam
, 201
0 –
2011
Had
di
arrh
oea
in la
st tw
o w
eeks
Num
ber
of c
hild
ren
age
0-59
m
onth
s
Chi
ldre
n w
ith d
iarr
hoea
who
rece
ived
:
Num
ber o
f chi
ldre
n ag
e 0-
59 m
onth
s w
ith d
iarr
hoea
in
last
two
wee
ks
O
RS
(F
luid
from
OR
S
pack
et o
r pre
-pa
ckag
ed O
RS
flui
d)
Rec
omm
ende
d ho
mem
ade
fluid
s
OR
S o
r any
re
com
men
ded
hom
emad
e flu
id
Ric
e po
rrid
ge/ r
ice
soup
Lem
on/o
rang
e/
coco
nut d
rink
Sou
p w
ater
fro
m b
oile
d ve
geta
bles
Any
re
com
men
ded
hom
emad
e flu
idSe
x
Mal
e7.
418
6955
10.6
8.8
33.5
42.1
70.3
138
Fem
ale
7.3
1809
37.7
7.7
14.4
34.2
43.6
60.7
132
Reg
ion
Red
Riv
er D
elta
879
849
.30.
915
.742
.945
.269
.564
Nor
ther
n M
idla
nd a
nd M
ount
ain
area
s10
.470
734
.811
.47.
535
.444
.363
.874
Nor
th C
entra
l are
a an
d C
entra
l C
oast
al a
rea
6.9
719
60.8
23.2
3.8
2741
.666
.849
Cen
tral H
ighl
ands
6.3
233
**
**
**
15
Sou
th E
ast
557
2(6
0.8)
(7.7
)(1
9.4)
(28.
7)(3
6.6)
(69.
4)28
Mek
ong
Riv
er D
elta
6.2
650
(33.
3)(2
.7)
(17.
7)(3
3.)
(45.
9)(5
6.6)
40
Are
a
Urb
an5.
310
1347
.38.
417
33.4
43.6
64.6
54
Rur
al8.
126
6546
.39.
410
.133
.942
.665
.921
6
Age
(mon
ths)
0-11
13
668
51.2
8.2
2.3
15.5
2461
.487
12-2
3 10
.475
948
.616
.417
.841
.352
.265
.479
24-3
5 6.
979
245
.14.
815
.641
.948
71.8
55
36-4
7 4
764
(32.
4)(6
.7)
(13.
7)(4
0.6)
(51.
8)(5
9.5)
30
48-5
9 2.
869
5*
**
**
*19
PDF compression, OCR, web optimization using a watermarked evaluation copy of CVISION PDFCompressor

83VIET NAM MULTIPLE INDICATOR CLUSTER SURVEY 2010–2011
MONITORING THE SITUATION OF CHILDREN AND WOMEN
Tabl
e C
H.4
: Ora
l reh
ydra
tion
solu
tions
and
reco
mm
ende
d ho
mem
ade
fluid
s
Per
cent
age
of c
hild
ren
age
0-59
mon
ths
with
dia
rrho
ea in
the
last
two
wee
ks, a
nd tr
eatm
ent w
ith o
ral r
ehyd
ratio
n so
lutio
ns a
nd re
com
men
ded
hom
emad
e flu
ids,
Vie
t Nam
, 201
0 –
2011
Had
di
arrh
oea
in la
st tw
o w
eeks
Num
ber
of c
hild
ren
age
0-59
m
onth
s
Chi
ldre
n w
ith d
iarr
hoea
who
rece
ived
:
Num
ber o
f chi
ldre
n ag
e 0-
59 m
onth
s w
ith d
iarr
hoea
in
last
two
wee
ks
O
RS
(F
luid
from
OR
S
pack
et o
r pre
-pa
ckag
ed O
RS
flui
d)
Rec
omm
ende
d ho
mem
ade
fluid
s
OR
S o
r any
re
com
men
ded
hom
emad
e flu
id
Ric
e po
rrid
ge/ r
ice
soup
Lem
on/o
rang
e/
coco
nut d
rink
Sou
p w
ater
fro
m b
oile
d ve
geta
bles
Any
re
com
men
ded
hom
emad
e flu
idM
othe
r’s e
duca
tion
Non
e10
207
**
**
**
21
Prim
ary
7.5
658
(22.
5)(4
.9)
(4.1
)(2
3.6)
(30.
6)(4
7.5)
49
Low
er S
econ
dary
7.4
1479
47.4
13.3
13.6
35.9
48.6
70.2
110
Upp
er S
econ
dary
6.7
670
(58.
7)(1
0.3)
(15.
8)(4
2.6)
(46.
6)(7
5.)
45
Terti
ary
6.9
664
(57.
2)(3
.8)
(14.
3)(3
5.6)
(42.
6)(6
4.7)
46
Wea
lth in
dex
quin
tile
Poo
rest
9.4
831
34.9
10.4
833
.742
.163
.578
Sec
ond
7.3
673
(43.
4)(9
.8)
(2.9
)(2
7.2)
(36.
2)(6
1.5)
49
Mid
dle
7.4
700
61.4
6.8
18.8
44.2
53.6
81.4
52
Four
th6.
374
9(4
6.8)
(12.
8)(1
1.1)
(25.
7)(3
5.)
(47.
9)47
Ric
hest
6.1
725
(52.
7)(5
.1)
(19.
1)(3
8.)
(47.
2)(7
4.5)
44
Ethn
icity
of h
ouse
hold
hea
d
kin
h/H
oa6.
631
4349
9.6
14.4
34.4
44.8
66.2
208
Eth
nic
Min
oriti
es11
.653
538
.17.
82
32.1
43.8
67.4
62
Tota
l7.
436
7846
.59.
211
.533
.842
.865
.627
0
Not
e:Fi
gure
s de
note
d by
an
aste
risk
are
bas
ed o
n de
nom
inat
ors
of 2
4 un
-wei
ghte
d ca
ses
and
less
Figu
res
show
n in
par
enth
esis
are
bas
ed o
n de
nom
inat
ors
of 2
5-49
un-
wei
ghte
d ca
ses
PDF compression, OCR, web optimization using a watermarked evaluation copy of CVISION PDFCompressor

84 VIET NAM MULTIPLE INDICATOR CLUSTER SURVEY 2010–2011
MONITORING THE SITUATION OF CHILDREN AND WOMEN
Table CH.4 also shows the percentage of children receiving various types of recommended liquids during the episode of diarrhoea. Since mothers were allowed to name more than one type of liquid, the percentages do not necessarily add to 100. About 46.5 per cent received fluids from ORS packets or pre-packaged ORS fluids. ORS is the rehydration treatment of choice for children with diarrhoea in the North Central area and Central Coast area and the South East. Recommended homemade fluids were given to 42.8 per cent of children who experienced diarrhoea in the last two weeks preceding the survey. Among the fluids, soup water from boiled vegetables was the most prevalent, given in 33.8 per cent of cases. It is interesting to note that ORS packets are the rehydration treatment of choice given to boys (55 per cent for boys versus 37.7 per cent for girls), whereas homemade fluids are the treatment of choice for girls (43.6 versus 42.1 per cent).
Some 65.6 per cent of children with diarrhoea received ORS or any recommended homemade fluid. About 70.3 per cent of boys with diarrhoea received ORS or any recommended homemade fluid compared to 60.7 per cent of girls. No notable disparities for ORS or any recommended homemade fluid preference are observed between urban and rural areas, and between Kinh/Hoa and ethnic minority households.
Less than one third (28.6 per cent) of children under age 5 with diarrhoea were given more than the usual amount to drink while 45.4 per cent were given the same amount (Table CH.5). Giving the child more to drink during diarrhoea is similar in the Red River Delta and Northern Midland and Mountain areas, with 36.6 and 35.6 per cent, respectively, while it is less practised in the other regions.
About one in three children (36.4 per cent) with diarrhoea were given somewhat less to eat than normal. 42.8 per cent of children were given the same amount to eat or more (continued feeding) and 16.9 per cent were given much less to eat during the episode of diarrhoea. There are considerable differences in continued eating practices by ethnic group, with as many as 20 per cent of children aged 0–59 months in Kinh/Hoa households being given much less to eat, compared with only 6.5 per cent of children in ethnic minority households.
PDF compression, OCR, web optimization using a watermarked evaluation copy of CVISION PDFCompressor

85VIET NAM MULTIPLE INDICATOR CLUSTER SURVEY 2010–2011
MONITORING THE SITUATION OF CHILDREN AND WOMEN
Tabl
e C
H.5
: Fee
ding
pra
ctic
es d
urin
g di
arrh
oea
Per
cent
age
dist
ribut
ion
of c
hild
ren
aged
0–5
9 m
onth
s w
ith d
iarr
hoea
in th
e la
st tw
o w
eeks
by
amou
nt o
f liq
uids
and
food
giv
en d
urin
g ep
isod
e of
dia
rrho
ea, V
iet N
am, 2
010–
2011
H
ad
diar
rhoe
a in
last
two
wee
ks
Num
ber
of
child
ren
aged
0–
59
mon
ths
Drin
king
pra
ctic
es d
urin
g di
arrh
oea:
Eatin
g pr
actic
es d
urin
g di
arrh
oea:
Num
ber o
f ch
ildre
n ag
ed
0–59
mon
ths
with
dia
rrho
ea
in la
st tw
o w
eeks
Giv
en
muc
h le
ss
to
drin
k
Giv
en
som
ewha
t le
ss to
dr
ink
Giv
en
abou
t th
e sa
me
to
drin
k
Giv
en
mor
e to
dr
ink
Giv
en
noth
ing
to d
rink
Giv
en
muc
h le
ss to
ea
t
Giv
en
som
ewha
t le
ss to
eat
Giv
en
abou
t th
e sa
me
to e
at
Giv
en
mor
e to
eat
Sto
pped
fo
od
Nev
er
been
gi
ven
food
be
fore
Tota
lTo
tal
Sex M
ale
7.4
1869
5.3
1942
.733
010
013
.539
.440
3.5
1.7
1.9
100
138
Fem
ale
7.3
1809
5.6
20.6
48.3
24.1
110
020
.433
.438
.63.
50
4.2
100
132
Reg
ion
R
ed R
iver
Del
ta8
798
08.
355
.136
.60
100
11.1
2952
.63.
70
3.6
100
64N
orth
ern
Mid
land
and
M
ount
ain
area
s10
.470
73.
616
44.7
35.6
0.1
100
9.6
46.3
35.9
7.4
0.5
0.3
100
74
Nor
th C
entra
l are
a an
d C
entra
l C
oast
al a
rea
6.9
719
(6.3
)(3
2.1)
(36.
7)(2
3.6)
(0)
100
(22.
9)(4
0.8)
(31.
3)(0
)(0
)(5
)10
049
Cen
tral H
ighl
ands
6.3
233
**
**
*10
0*
**
**
*10
015
Sou
th E
ast
557
2(1
1.1)
(26.
1)(4
6.4)
(16.
4)(0
)10
0(1
8.3)
(34.
9)(3
4.3)
(1.9
)(2
.1)
(8.5
)10
028
Mek
ong
Riv
er D
elta
6.2
650
(9.7
)(2
2.5)
(41)
(24.
9)(1
.9)
100
(27.
1)(2
7.8)
(39.
5)(2
.7)
(2.9
)(0
)10
040
Are
a
Urb
an5.
310
137.
127
.232
.631
.61.
510
019
.230
.444
.82.
60
2.9
100
54R
ural
8.1
2665
518
48.6
27.9
0.2
100
16.3
37.9
37.9
3.7
1.1
3.1
100
216
Age
(mon
ths)
0–
1113
668
4.2
15.1
60.2
200.
510
014
26.8
445.
71.
87.
810
087
12–2
3 10
.475
94.
925
.239
.430
.40
100
2138
.235
.92.
80.
21.
910
079
24–3
5 6.
979
26.
618
.647
.427
.20.
210
07
42.4
49.1
0.5
1.1
010
055
36–4
7 4
764
(3.1
)(2
2.2)
(35.
8)(3
6.4)
(2.5
)10
0(2
5.2)
(40.
1)(3
1.1)
(3.6
)(0
)(0
)10
030
48–5
9 2.
869
5(1
3.7)
(18.
5)(1
2.4)
(52)
(0)
100
(28.
3)(4
9.8)
(16.
9)(5
)(0
)(0
)10
019
Mot
her’s
edu
catio
nN
one
1020
7*
**
**
100
**
**
**
100
21P
rimar
y7.
565
8(1
0.3)
(19.
9)(4
7.9)
(19.
2)(1
.5)
100
(23.
1)(4
3.1)
(32.
2)(0
)(.3
)(1
.3)
100
49Lo
wer
Sec
onda
ry7.
414
795
17.4
47.6
29.9
0.1
100
1539
.541
.82
1.6
010
011
0U
pper
Sec
onda
ry6.
767
0(0
)(1
9.8)
(49.
3)(2
9.9)
(1)
100
(13.
2)(3
3.1)
(45.
7)(4
.7)
(.9)
(2.5
)10
045
Terti
ary
6.9
664
(9)
(22.
8)(3
4.6)
(33.
6)(0
)10
0(1
4.7)
(26.
6)(3
5.7)
(8.9
)(0
)(1
4.1)
100
46
PDF compression, OCR, web optimization using a watermarked evaluation copy of CVISION PDFCompressor
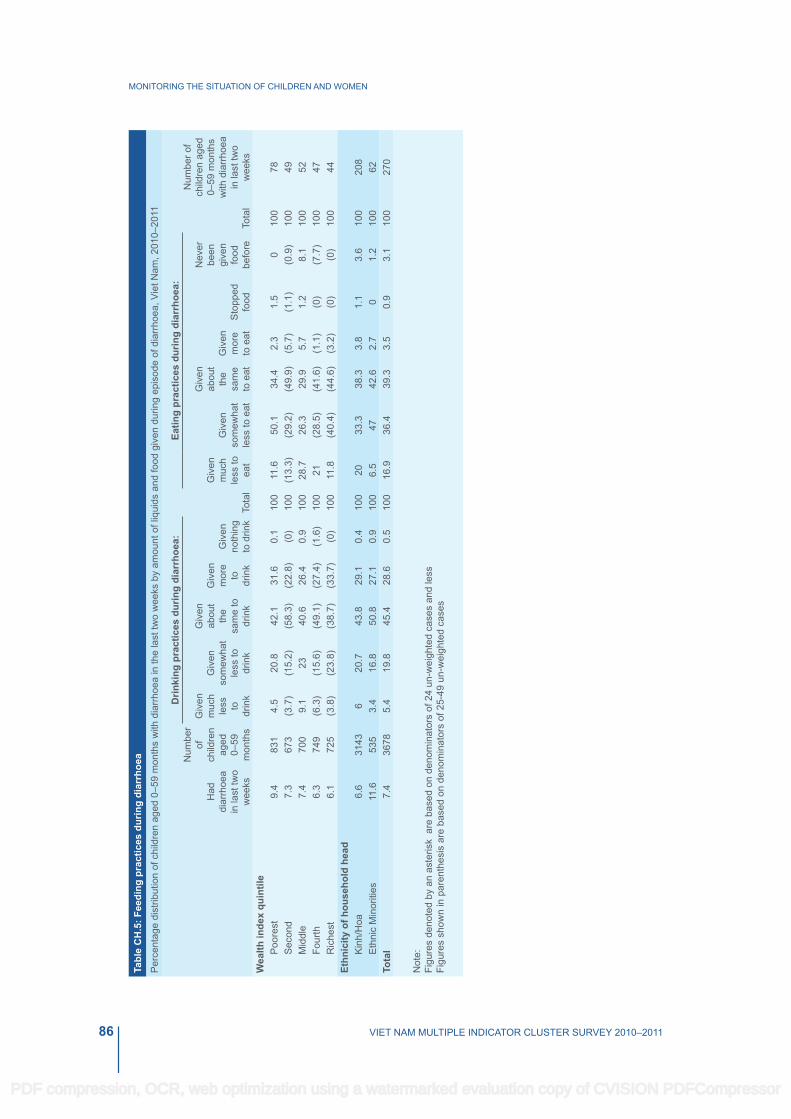
86 VIET NAM MULTIPLE INDICATOR CLUSTER SURVEY 2010–2011
MONITORING THE SITUATION OF CHILDREN AND WOMEN
Tabl
e C
H.5
: Fee
ding
pra
ctic
es d
urin
g di
arrh
oea
Per
cent
age
dist
ribut
ion
of c
hild
ren
aged
0–5
9 m
onth
s w
ith d
iarr
hoea
in th
e la
st tw
o w
eeks
by
amou
nt o
f liq
uids
and
food
giv
en d
urin
g ep
isod
e of
dia
rrho
ea, V
iet N
am, 2
010–
2011
H
ad
diar
rhoe
a in
last
two
wee
ks
Num
ber
of
child
ren
aged
0–
59
mon
ths
Drin
king
pra
ctic
es d
urin
g di
arrh
oea:
Eatin
g pr
actic
es d
urin
g di
arrh
oea:
Num
ber o
f ch
ildre
n ag
ed
0–59
mon
ths
with
dia
rrho
ea
in la
st tw
o w
eeks
Giv
en
muc
h le
ss
to
drin
k
Giv
en
som
ewha
t le
ss to
dr
ink
Giv
en
abou
t th
e sa
me
to
drin
k
Giv
en
mor
e to
dr
ink
Giv
en
noth
ing
to d
rink
Giv
en
muc
h le
ss to
ea
t
Giv
en
som
ewha
t le
ss to
eat
Giv
en
abou
t th
e sa
me
to e
at
Giv
en
mor
e to
eat
Sto
pped
fo
od
Nev
er
been
gi
ven
food
be
fore
Tota
lTo
tal
Wea
lth in
dex
quin
tile
Poo
rest
9.4
831
4.5
20.8
42.1
31.6
0.1
100
11.6
50.1
34.4
2.3
1.5
010
078
Sec
ond
7.3
673
(3.7
)(1
5.2)
(58.
3)(2
2.8)
(0)
100
(13.
3)(2
9.2)
(49.
9)(5
.7)
(1.1
)(0
.9)
100
49M
iddl
e7.
470
09.
123
40.6
26.4
0.9
100
28.7
26.3
29.9
5.7
1.2
8.1
100
52Fo
urth
6.3
749
(6.3
)(1
5.6)
(49.
1)(2
7.4)
(1.6
)10
021
(28.
5)(4
1.6)
(1.1
)(0
)(7
.7)
100
47R
iche
st6.
172
5(3
.8)
(23.
8)(3
8.7)
(33.
7)(0
)10
011
.8(4
0.4)
(44.
6)(3
.2)
(0)
(0)
100
44Et
hnic
ity o
f hou
seho
ld h
ead
k
inh/
Hoa
6.6
3143
620
.743
.829
.10.
410
020
33.3
38.3
3.8
1.1
3.6
100
208
Eth
nic
Min
oriti
es11
.653
53.
416
.850
.827
.10.
910
06.
547
42.6
2.7
01.
210
062
Tota
l7.
436
785.
419
.845
.428
.60.
510
016
.936
.439
.33.
50.
93.
110
027
0
Not
e:Fi
gure
s de
note
d by
an
aste
risk
are
bas
ed o
n de
nom
inat
ors
of 2
4 un
-wei
ghte
d ca
ses
and
less
Figu
res
show
n in
par
enth
esis
are
bas
ed o
n de
nom
inat
ors
of 2
5-49
un-
wei
ghte
d ca
ses
PDF compression, OCR, web optimization using a watermarked evaluation copy of CVISION PDFCompressor

87VIET NAM MULTIPLE INDICATOR CLUSTER SURVEY 2010–2011
MONITORING THE SITUATION OF CHILDREN AND WOMEN
Table CH.6 presents the proportion of children aged 0–59 months with diarrhoea in the last two weeks who received oral rehydration therapy with continued feeding, and the percentage of children with diarrhoea who received other treatments. Overall, more than half of all the children (58.2 per cent) with diarrhoea received ORS or increased fluids and 70.5 per cent received oral rehydration therapy (ORS or recommended homemade fluids or increased fluids). Most background characteristics indicate unclear patterns. However, it is clear that ORT use is higher among older children, boys and those living in ethnic minority households. For example, about 75.9 per cent of boys receive ORT compared with 64.8 per cent of girls. Combining the indicators in Table CH.5 and Table CH.4 on oral rehydration therapy, it is observed that 56.7 per cent of children received both oral rehydration therapy (ORT) and continued feeding, as is recommended. The same background characteristics, child age, sex and ethnicity of the household head, show differentials for the indicator ORT with continued feeding. The Northern Midland and Mountain areas show the highest percentage of children receiving ORT with continued feeding at 64.1 per cent. About a quarter of children with diarrhoea in the last two weeks were given antibiotics (pill, syrup or injection), which is the highest percentage among all treatments given. Still, 5.6 per cent of children with diarrhoea did not receive any treatment or drug.
Gender disparities are observed in the use of antibiotics for diarrhoea treatment, with as many as 30.1 per cent of girls aged 0-59 months with diarrhoea receiving antibiotics, compared to 18 per cent of boys.
PDF compression, OCR, web optimization using a watermarked evaluation copy of CVISION PDFCompressor

88 VIET NAM MULTIPLE INDICATOR CLUSTER SURVEY 2010–2011
MONITORING THE SITUATION OF CHILDREN AND WOMEN
Tabl
e C
H.6
: Ora
l reh
ydra
tion
ther
apy
with
con
tinue
d fe
edin
g an
d ot
her t
reat
men
tsP
erce
ntag
e of
chi
ldre
n ag
ed 0
–59
mon
ths
with
dia
rrho
ea in
the
last
two
wee
ks w
ho re
ceiv
ed o
ral r
ehyd
ratio
n th
erap
y w
ith c
ontin
ued
feed
ing,
and
per
cent
age
of c
hild
ren
with
dia
rrho
ea w
ho
rece
ived
oth
er tr
eatm
ents
, Vie
t Nam
, 201
0–20
11
Chi
ldre
n w
ith d
iarr
hoea
who
re
ceiv
ed:
O
ther
trea
tmen
ts:
Not
giv
en
any
treat
men
t or
dru
g
Num
ber
of c
hild
ren
aged
0–5
9 m
onth
s w
ith
diar
rhoe
a in
last
two
wee
ks
OR
S o
r in
crea
sed
fluid
s
OR
T (O
RS
or
reco
m-
men
ded
hom
emad
e flu
ids
or
incr
ease
d flu
ids)
OR
T w
ith
cont
inue
d fe
edin
g1
Pill
or s
yrup
Inje
ctio
n
Intra
-ve
nous
th
erap
y
Hom
e re
med
y,
herb
al
med
icin
eO
ther
A
nti-
biot
ic
Ant
i- m
otili
ty
drug
Zinc
Oth
erU
n-kn
own
A
nti-
biot
icU
n-kn
own
Sex
M
ale
66.4
75.9
64.4
185.
30.
910
.920
.11.
72
3.3
6.7
28.1
5.9
138
Fem
ale
49.7
64.8
48.8
30.1
7.4
16.
218
.91.
36.
31.
39.
928
.15.
313
2R
egio
n
Red
Riv
er D
elta
54.4
69.5
5723
.76.
23.
611
.219
.16.
35.
45
046
.14.
764
Nor
ther
n M
idla
nd a
nd
Mou
ntai
n ar
eas
58.9
74.2
64.1
263.
30
9.5
110
5.3
022
.519
.48
74
Nor
th C
entra
l are
a an
d C
entra
l Coa
stal
are
a(6
5.4)
(70.
1)(5
2.9)
(32.
4)(1
2.6)
(0)
(8.2
)(1
9.7)
(0)
(0)
(6.3
)(5
)(1
9.5)
(9.6
)49
Cen
tral H
ighl
ands
**
**
**
**
**
**
**
15S
outh
Eas
t(6
3.3)
(71.
9)(5
9.7)
(7.9
)(9
.5)
(0)
(4)
(32.
1)(0
)(3
.6)
(0)
(0)
(29.
8)(0
)28
Mek
ong
Riv
er D
elta
(50.
8)(6
3.1)
(44.
7)(2
4.4)
(2.5
)(0
)(4
.7)
(27.
5)(0
)(5
.8)
(0)
(7)
(31.
6)(0
)40
Are
a
Urb
an58
.571
56.8
25.6
7.7
3.1
10.7
18.5
02.
80
1.5
30.9
1.5
54
Rur
al58
.270
.356
.723
.56
0.4
8.1
19.8
1.9
4.4
2.9
9.9
27.4
6.6
216
Age
(mon
ths)
0–11
54
.862
.849
.120
3.3
1.6
4.8
110
2.7
010
.332
9.5
87
12–2
3 61
.269
.853
.835
.49.
30.
415
.529
.12.
24.
96.
15.
433
.41.
779
24–3
5 55
.476
.268
.819
12.5
07.
218
.44.
27.
12.
69.
413
.85.
455
36–4
7 (5
3.9)
(71)
(56.
9)(8
.8)
(0)
(3.1
)(9
)(1
7.5)
(0)
(3.3
)(0
)(7
.7)
(32.
1)(6
)30
48–5
9 *
**
**
**
**
**
**
*19
PDF compression, OCR, web optimization using a watermarked evaluation copy of CVISION PDFCompressor

89VIET NAM MULTIPLE INDICATOR CLUSTER SURVEY 2010–2011
MONITORING THE SITUATION OF CHILDREN AND WOMEN
Tabl
e C
H.6
: Ora
l reh
ydra
tion
ther
apy
with
con
tinue
d fe
edin
g an
d ot
her t
reat
men
ts
Per
cent
age
of c
hild
ren
aged
0–5
9 m
onth
s w
ith d
iarr
hoea
in th
e la
st tw
o w
eeks
who
rece
ived
ora
l reh
ydra
tion
ther
apy
with
con
tinue
d fe
edin
g, a
nd p
erce
ntag
e of
chi
ldre
n w
ith d
iarr
hoea
who
re
ceiv
ed o
ther
trea
tmen
ts, V
iet N
am, 2
010–
2011
Chi
ldre
n w
ith d
iarr
hoea
who
re
ceiv
ed:
O
ther
trea
tmen
ts:
Not
giv
en
any
treat
men
t or
dru
g
Num
ber
of c
hild
ren
aged
0–5
9 m
onth
s w
ith
diar
rhoe
a in
last
two
wee
ks
OR
S o
r in
crea
sed
fluid
s
OR
T (O
RS
or
reco
m-
men
ded
hom
emad
e flu
ids
or
incr
ease
d flu
ids)
OR
T w
ith
cont
inue
d fe
edin
g1
Pill
or s
yrup
Inje
ctio
n
Intra
-ve
nous
th
erap
y
Hom
e re
med
y,
herb
al
med
icin
eO
ther
A
nti-
biot
ic
Ant
i- m
otili
ty
drug
Zinc
Oth
erU
n-kn
own
A
nti-
biot
icU
n-kn
own
Mot
her’s
edu
catio
nN
one
**
**
**
**
**
**
**
21P
rimar
y37
.356
.146
9.9
3.6
08.
115
03
021
7.5
17.6
49Lo
wer
Sec
onda
ry61
.574
61.6
26.7
6.2
06.
827
1.6
4.3
2.8
5.4
35.3
2.1
110
Upp
er S
econ
dary
(70.
4)(7
9.8)
(67.
3)(2
5.3)
(3)
(5.8
)(6
.2)
(21.
5)(5
.1)
(8.2
)(3
.9)
(1.8
)(1
9.5)
(5.5
)45
Terti
ary
(60.
7)(6
8.2)
(48)
(32.
9)(1
5.5)
(0)
(19.
8)(6
.2)
(0)
(0)
(3.1
)(5
.3)
(46.
5)(2
)46
Wea
lth in
dex
quin
tile
Poo
rest
51.9
70.2
57.8
232.
30
6.6
12.3
07.
33.
917
.915
.710
.378
Sec
ond
59.4
67.2
62.1
18.4
6.3
02.
510
.54.
74.
43.
611
.532
.86.
149
Mid
dle
68.8
81.4
56.4
18.7
00
11.7
43.4
3.4
3.3
00.
436
.73.
852
Four
th(5
3.8)
(55)
(40.
7)(2
9.4)
(15)
(2)
(7.5
)(2
1)(0
)(1
.1)
(0)
(5.2
)(3
1.3)
(4.2
)47
Ric
hest
(60.
5)(7
8.1)
(66.
3)(3
1.7)
(11.
7)(3
.8)
(16.
5)(1
2.9)
(0)
(2.3
)(3
.2)
(0)
(31.
2)(0
)44
Ethn
icity
of h
ouse
hold
he
ad
kin
h/H
oa58
.568
.553
.425
.58
1.2
9.4
22.4
1.9
3.3
34.
133
.93.
820
8
Eth
nic
Min
oriti
es57
.477
.170
.118
.50.
70
6.1
10.1
06.
90
22.1
8.6
11.5
62To
tal
58.2
70.5
56.7
23
.96.
31
8.6
19.5
1.
54.
12.
38.
228
.15.
627
0
Not
e:Fi
gure
s de
note
d by
an
aste
risk
are
bas
ed o
n de
nom
inat
ors
of 2
4 un
-wei
ghte
d ca
ses
and
less
Figu
res
show
n in
par
enth
esis
are
bas
ed o
n de
nom
inat
ors
of 2
5-49
un-
wei
ghte
d ca
ses
PDF compression, OCR, web optimization using a watermarked evaluation copy of CVISION PDFCompressor

90 VIET NAM MULTIPLE INDICATOR CLUSTER SURVEY 2010–2011
MONITORING THE SITUATION OF CHILDREN AND WOMEN
Care Seeking and Antibiotic Treatment of PneumoniaPneumonia is the leading cause of death of children globally and the use of antibiotics for children under age 5 with presumed pneumonia is a key intervention. One of the A World Fit for Children goals is to reduce by one third the deaths due to acute respiratory infections.
Children with suspected pneumonia are those who had an illness with a cough accompanied by rapid or difficult breathing and whose symptoms were NOT due to a blocked nose.
The indicators are:
● Prevalence of suspected pneumonia
● Care seeking for suspected pneumonia
● Antibiotic treatment for suspected pneumonia
● knowledge of the danger signs of pneumonia
PDF compression, OCR, web optimization using a watermarked evaluation copy of CVISION PDFCompressor
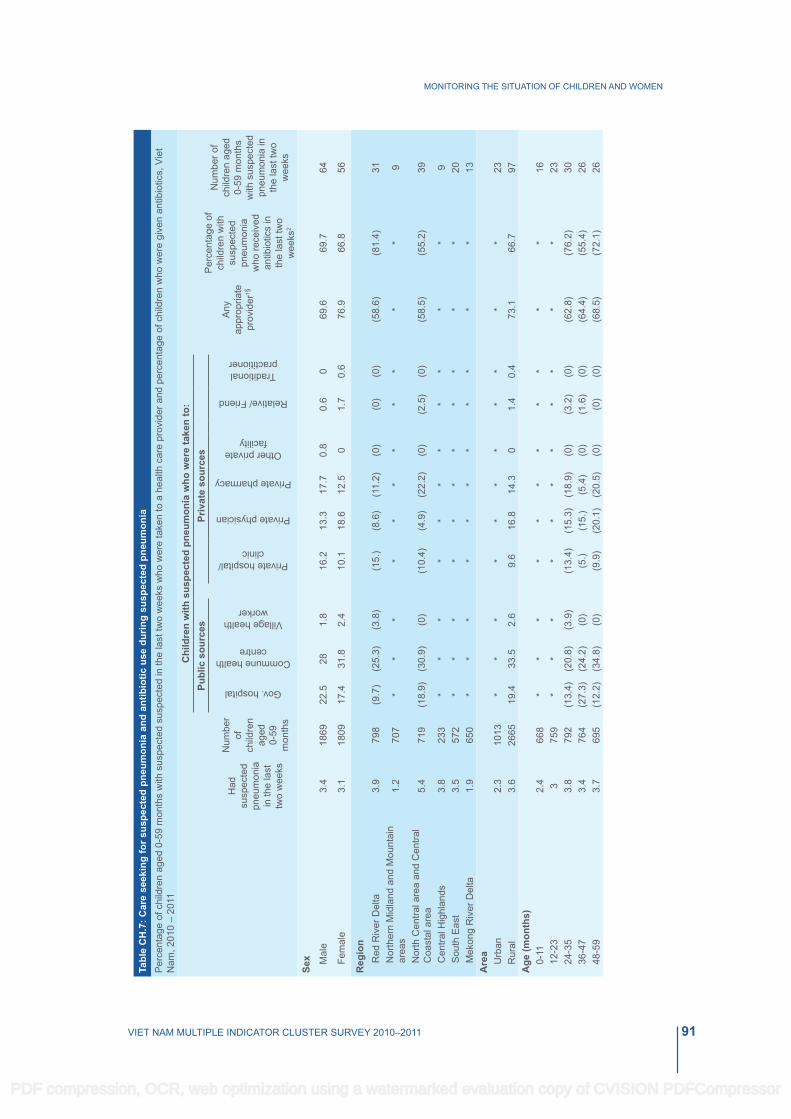
91VIET NAM MULTIPLE INDICATOR CLUSTER SURVEY 2010–2011
MONITORING THE SITUATION OF CHILDREN AND WOMEN
Tabl
e C
H.7
: Car
e se
ekin
g fo
r sus
pect
ed p
neum
onia
and
ant
ibio
tic u
se d
urin
g su
spec
ted
pneu
mon
iaP
erce
ntag
e of
chi
ldre
n ag
ed 0
-59
mon
ths
with
sus
pect
ed s
uspe
cted
in th
e la
st tw
o w
eeks
who
wer
e ta
ken
to a
hea
lth c
are
prov
ider
and
per
cent
age
of c
hild
ren
who
wer
e gi
ven
antib
iotic
s, V
iet
Nam
, 201
0 –
2011
Had
su
spec
ted
pneu
mon
ia
in th
e la
st
two
wee
ks
Num
ber
of
child
ren
aged
0-
59
mon
ths
Chi
ldre
n w
ith s
uspe
cted
pne
umon
ia w
ho w
ere
take
n to
:
Any
ap
prop
riate
pr
ovid
er1§
Per
cent
age
of
child
ren
with
su
spec
ted
pneu
mon
ia
who
rece
ived
an
tibio
tics
in
the
last
two
wee
ks2
Num
ber o
f ch
ildre
n ag
ed
0-59
mon
ths
with
sus
pect
ed
pneu
mon
ia in
th
e la
st tw
o w
eeks
Publ
ic s
ourc
es
Priv
ate
sour
ces
Gov. hospital
Commune health centre
Village health worker
Private hospital/ clinic
Private physician
Private pharmacy
Other private facility
Relative/ Friend
Traditional practitioner
Sex
Mal
e3.
418
6922
.528
1.8
16.2
13.3
17.7
0.8
0.6
069
.669
.764
Fem
ale
3.1
1809
17.4
31.8
2.4
10.1
18.6
12.5
01.
70.
676
.966
.856
Reg
ion
R
ed R
iver
Del
ta3.
979
8(9
.7)
(25.
3)(3
.8)
(15.
)(8
.6)
(11.
2)(0
)(0
)(0
)(5
8.6)
(81.
4)31
Nor
ther
n M
idla
nd a
nd M
ount
ain
area
s1.
270
7*
**
**
**
**
**
9
Nor
th C
entra
l are
a an
d C
entra
l C
oast
al a
rea
5.4
719
(18.
9)(3
0.9)
(0)
(10.
4)(4
.9)
(22.
2)(0
)(2
.5)
(0)
(58.
5)(5
5.2)
39
Cen
tral H
ighl
ands
3.8
233
**
**
**
**
**
*9
Sou
th E
ast
3.5
572
**
**
**
**
**
*20
Mek
ong
Riv
er D
elta
1.9
650
**
**
**
**
**
*13
Are
a
Urb
an2.
310
13*
**
**
**
**
**
23R
ural
3.6
2665
19.4
33
.5
2.6
9.6
16.8
14
.3
0 1.
4 0.
4 73
.1
66.7
97
Age
(mon
ths)
0-
11
2.4
668
**
**
**
**
**
*16
12-2
3 3
759
**
**
**
**
**
*23
24-3
5 3.
879
2(1
3.4)
(20.
8)(3
.9)
(13.
4)(1
5.3)
(18.
9)(0
)(3
.2)
(0)
(62.
8)(7
6.2)
3036
-47
3.4
764
(27.
3)(2
4.2)
(0)
(5.)
(15.
)(5
.4)
(0)
(1.6
)(0
)(6
4.4)
(55.
4)26
48-5
9 3.
769
5(1
2.2)
(34.
8)(0
)(9
.9)
(20.
1)(2
0.5)
(0)
(0)
(0)
(68.
5)(7
2.1)
26
PDF compression, OCR, web optimization using a watermarked evaluation copy of CVISION PDFCompressor

92 VIET NAM MULTIPLE INDICATOR CLUSTER SURVEY 2010–2011
MONITORING THE SITUATION OF CHILDREN AND WOMEN
Tabl
e C
H.7
: Car
e se
ekin
g fo
r sus
pect
ed p
neum
onia
and
ant
ibio
tic u
se d
urin
g su
spec
ted
pneu
mon
ia**
Per
cent
age
of c
hild
ren
aged
0-5
9 m
onth
s w
ith s
uspe
cted
sus
pect
ed in
the
last
two
wee
ks w
ho w
ere
take
n to
a h
ealth
pro
vide
r and
per
cent
age
of c
hild
ren
who
wer
e gi
ven
antib
iotic
s, V
iet N
am,
2010
– 2
011
H
ad
susp
ecte
d pn
eum
onia
in
the
last
tw
o w
eeks
Num
ber
of
child
ren
aged
0-
59
mon
ths
Chi
ldre
n w
ith s
uspe
cted
pne
umon
ia w
ho w
ere
take
n to
:
Any
ap
prop
riate
pr
ovid
er1§
Per
cent
age
of
child
ren
with
su
spec
ted
pneu
mon
ia
who
rece
ived
an
tibio
tics
in
the
last
two
wee
ks2
Num
ber o
f ch
ildre
n ag
ed
0-59
mon
ths
with
sus
pect
ed
pneu
mon
ia in
th
e la
st tw
o w
eeks
Publ
ic s
ourc
es
Priv
ate
sour
ces
Gov. hospital
Commune health centre
Village health worker
Private hospital/ clinic
Private physician
Private pharmacy
Other private facility
Relative/ Friend
Traditional practitioner
Mot
her’s
edu
catio
n
Non
e2.
620
7*
**
**
**
**
**
5P
rimar
y3.
465
8*
**
**
**
**
**
23Lo
wer
Sec
onda
ry3.
914
7918
.2
34.1
0
14
13.7
10
0
0 0.
6 72
.6
63.1
57
Upp
er S
econ
dary
2.9
670
**
**
**
**
**
*19
Terti
ary
2.4
664
**
**
**
**
**
*16
Wea
lth in
dex
quin
tile
P
oore
st4
831
(2.3
)(5
2.7)
(0)
(5.3
)(7
.7)
(16.
5)(0
)(0
)(0
)(6
7.9)
(43.
7)33
Sec
ond
3.7
673
(24.
9)(3
2.7)
(0)
(3.6
)(2
1.4)
(21.
7)(2
.)(5
.6)
(0)
(67.
4)(5
3.7)
25M
iddl
e3
700
**
**
**
**
**
*21
Four
th3.
974
9(1
7.6)
(10.
9)(0
)(2
2.7)
(24.
6)(1
4.8)
(0)
(0)
(1.2
)(6
8.4)
(90.
2)29
Ric
hest
1.7
725
**
**
**
**
**
*12
Ethn
icity
of h
ouse
hold
hea
d
kin
h/H
oa3.
431
4318
.326
.52.
414
.517
.214
.40.
50.
90.
372
.167
108
Eth
nic
Min
oriti
es2.
353
5*
**
**
**
**
**
12To
tal
3.3
3678
20.1
29.8
2.1
13.3
15.8
15.2
0.4
1.1
0.3
7368
.312
01 M
ICS
indi
cato
r 3.9
; 2 MIC
S in
dica
tor 3
.10
§ Thi
s in
dica
tor i
nclu
des
the
follo
win
g: G
over
nmen
t hos
pita
l, C
omm
une
heal
th c
entre
, Vill
age
heal
th w
orke
r, pr
ivat
e ho
spita
l/clin
ic, p
rivat
e ph
arm
acy,
and
oth
er p
rivat
e fa
cilit
ies
Not
e:Fi
gure
s de
note
d by
an
aste
risk
are
bas
ed o
n de
nom
inat
ors
of 2
4 un
-wei
ghte
d ca
ses
and
less
Figu
res
show
n in
par
enth
esis
are
bas
ed o
n de
nom
inat
ors
of 2
5-49
un-
wei
ghte
d ca
ses
PDF compression, OCR, web optimization using a watermarked evaluation copy of CVISION PDFCompressor

93VIET NAM MULTIPLE INDICATOR CLUSTER SURVEY 2010–2011
MONITORING THE SITUATION OF CHILDREN AND WOMEN
Table CH.7 presents results on prevalence of presumed pneumonia, whether care was sought outside the home, and the site of care. Some 3.3 per cent of children aged 0–59 months were reported to have had symptoms of pneumonia during the two weeks preceding the survey. Of these children, 73 per cent were taken to an appropriate health care provider, and 68.3 per cent received antibiotics for presumed pneumonia. The number of observations is small and makes it difficult to further conclude about the differences by background characteristics.
Details about the mother’s/caregiver’s knowledge of the danger signs of pneumonia are presented in Table CH.8. The mother’s/caregiver’s knowledge is an important determinant for care-seeking behaviour. Overall, only 5 per cent of mothers/caregivers recognised the two danger signs of pneumonia – fast and difficult breathing. The most commonly identified symptom for taking a child to a health facility is when the child develops a fever, 87.1 per cent. Only 10.6 per cent of mothers/caregivers identified fast breathing and 29.1 per cent of mothers/caregivers identified difficult breathing as symptoms for taking children immediately to a health care provider. Although knowledge about the two danger signs of pneumonia is generally low in Viet Nam, there is some indication that the mother’s/caregiver’s education is a factor. In addition, more mothers/caregivers in the Red River Delta know about the two danger signs (8.9 per cent), compared to 0.1 per cent in the Mekong River Delta and 2.8 in the Central Highlands.
PDF compression, OCR, web optimization using a watermarked evaluation copy of CVISION PDFCompressor

94 VIET NAM MULTIPLE INDICATOR CLUSTER SURVEY 2010–2011
MONITORING THE SITUATION OF CHILDREN AND WOMEN
Tabl
e C
H.8
: Kno
wle
dge
of th
e tw
o da
nger
sig
ns o
f pne
umon
ia
Per
cent
age
of m
othe
rs a
nd c
areg
iver
s of
chi
ldre
n ag
ed 0
-59
mon
ths
by s
ympt
oms
that
wou
ld c
ause
them
to ta
ke th
e ch
ild im
med
iate
ly to
a h
ealth
faci
lity,
and
per
cent
age
of m
othe
rs w
ho
reco
gnis
e fa
st a
nd d
ifficu
lt br
eath
ing
as s
igns
for s
eeki
ng c
are
imm
edia
tely,
Vie
t Nam
, 201
0 - 2
011
Pe
rcen
tage
of m
othe
rs/c
areg
iver
s of
chi
ldre
n ag
ed 0
-59
mon
ths
who
thin
k th
at a
chi
ld
shou
ld b
e ta
ken
imm
edia
tely
to a
hea
lth fa
cilit
y if
the
child
:
Mot
hers
/ car
egiv
ers
who
reco
gnis
e th
e tw
o da
nger
sig
ns o
f pn
eum
onia
Num
ber o
f mot
hers
/ca
regi
vers
of
child
ren
aged
0-5
9 m
onth
s
Is
not
abl
e to
drin
k or
br
east
feed
bec
omes
si
cker
Dev
elop
s a
feve
rH
as fa
st
brea
thin
g
Has
di
fficu
lty
brea
thin
g
Has
bl
ood
in
stoo
l
Is
drin
king
po
orly
Has
oth
er
sym
ptom
sR
egio
n
R
ed R
iver
Del
ta14
.838
.390
.413
.838
.814
8.4
41.7
8.9
654
Nor
ther
n M
idla
nd a
nd M
ount
ain
area
s10
.743
.184
.211
.125
.310
.45.
425
.44.
758
9N
orth
Cen
tral a
rea
and
Cen
tral C
oast
al a
rea
14.9
38.5
90.4
12.1
36.1
8.7
5.3
22.2
7.4
614
Cen
tral H
ighl
ands
10.1
36.6
79.5
10.1
22.2
6.7
9.7
23.4
2.8
195
Sou
th E
ast
10.1
23.5
86.1
922
.15.
47.
241
3.7
513
Mek
ong
Riv
er D
elta
6.4
21.9
86.2
6.6
22.6
1.5
2.4
30.8
0.1
552
Are
a
Urb
an12
.129
.888
.711
30.7
9.2
7.6
35.1
5.9
886
Rur
al11
.335
.486
.410
.528
.47.
85.
430
.24.
622
32M
othe
r's e
duca
tion
N
one
12.2
38.6
75.1
5.4
27.4
8.2
4.8
16.2
114
6P
rimar
y7.
331
.583
.29.
124
4.1
4.4
28.1
2.1
524
Low
er S
econ
dary
10.4
35.4
87.1
8.9
27.8
7.3
531
.14
1252
Upp
er S
econ
dary
16.8
35.1
90.5
1632
.710
.18.
135
.49.
960
1Te
rtiar
y12
29.9
90.1
11.6
3311
.77.
835
.55.
759
4W
ealth
inde
x qu
intil
e
Poo
rest
12.3
38.8
83.4
9.8
287.
53.
420
.72.
964
5S
econ
d9.
831
.486
.69.
328
.54.
24.
532
.35.
257
9M
iddl
e9.
433
.788
.811
.428
.17.
17.
732
.15.
261
0Fo
urth
12.9
36.8
88.1
12.3
28.9
10.8
7.2
36.5
6.6
649
Ric
hest
12.9
27.9
88.6
10.4
31.9
10.8
7.3
36.4
5.2
633
Ethn
icity
of h
ouse
hold
hea
d
kin
h/H
oa11
.232
.488
.110
.329
.98.
16.
632
.85.
327
43E
thni
c M
inor
ities
13.3
42.2
80.7
12.5
24.2
8.7
2.7
24.2
3.4
375
Tota
l11
.533
.887
.110
.629
.18.
26
31.6
531
18
PDF compression, OCR, web optimization using a watermarked evaluation copy of CVISION PDFCompressor

95VIET NAM MULTIPLE INDICATOR CLUSTER SURVEY 2010–2011
MONITORING THE SITUATION OF CHILDREN AND WOMEN
Solid Fuel UseMore than 3 billion people around the world rely on solid fuels (biomass and coal) for their basic energy needs, including cooking and heating. Cooking and heating with solid fuels leads to high levels of indoor smoke, a complex mix of health-damaging pollutants. The main problem with the use of solid fuels is products of incomplete combustion, including carbon monoxide (CO), polyaromatic hydrocarbons, sulphur dioxide (SO2) and other toxic elements. Use of solid fuels increases the risks of acute respiratory illness, pneumonia, chronic obstructive pulmonary disease, cancer, and possibly tuberculosis, low birth weight, cataracts and asthma. The primary monitoring indicator is the proportion of the household population using solid fuels as the primary source of domestic energy for cooking. Results presented here are calculated for the population living in households, and therefore represent the percentage of the population exposed to various types of fuels, not percentage of households.
PDF compression, OCR, web optimization using a watermarked evaluation copy of CVISION PDFCompressor

96 VIET NAM MULTIPLE INDICATOR CLUSTER SURVEY 2010–2011
MONITORING THE SITUATION OF CHILDREN AND WOMEN
Tabl
e C
H.9
: Sol
id fu
el u
se
Per
cent
age
dist
ribut
ion
of h
ouse
hold
pop
ulat
ion
acco
rdin
g to
type
of c
ooki
ng fu
el u
sed
by th
e ho
useh
old,
and
per
cent
age
of h
ouse
hold
pop
ulat
ion
livin
g in
hou
seho
lds
usin
g so
lid fu
els
for
cook
ing,
Vie
t Nam
, 201
0 –
2011
Pe
rcen
tage
of h
ouse
hold
pop
ulat
ion
in h
ouse
hold
s us
ing:
Num
ber o
f ho
useh
old
mem
bers
Ele
ctric
ity
Liqu
efied
P
etro
leum
G
as
(LP
G)
Nat
ural
G
asb
ioga
sk
eros
ene
Solid
fuel
s
Oth
er
fuel
No
food
co
oked
in
the
hous
ehol
dTo
tal
Sol
id
fuel
s fo
r co
okin
g1
Coa
l, lig
nite
Cha
r-
coal
Woo
d
Stra
w,
shru
bs,
gras
s
Agr
icul
tura
l cr
op
resi
due
Reg
ion
R
ed R
iver
Del
ta0.
759
.90.
31.
30
9.3
1.4
9.6
16.7
0.6
0.1
0.1
100
37.6
9261
Nor
ther
n M
idla
nd a
nd M
ount
ain
area
s0.
727
.50.
11.
60
10.
466
.81.
50
0.1
0.1
100
69.8
7242
Nor
th C
entra
l are
a an
d C
entra
l Coa
stal
ar
ea0.
345
.20.
11.
10.
40.
74.
144
.43.
20.
10
010
052
.594
43
Cen
tral H
ighl
ands
149
.10.
20.
40
0.1
1.4
47.6
00
0.1
0.1
100
49.1
2551
Sou
th E
ast
0.4
81.2
0.2
0.4
1.6
0.1
0.7
13.9
00
1.2
1.2
100
14.6
7066
Mek
ong
Riv
er D
elta
0.5
420.
10.
50.
70.
12.
551
.70.
20.
70.
40.
410
055
.284
34A
rea
Urb
an0.
680
.70
0.2
0.9
3.7
1.1
11.5
0.6
00.
60.
610
016
.913
003
Rur
al0.
538
.20.
21.
30.
31.
72.
248
.46.
10.
40.
20.
210
058
.930
995
Educ
atio
n of
hou
seho
ld h
ead
Non
e0.
521
.90.
10
0.8
1.3
4.4
67.6
2.9
00.
50.
510
076
.326
51P
rimar
y0.
535
.20.
10.
50.
70.
82.
953
.44.
70.
40.
30.
310
062
.311
331
Low
er S
econ
dary
0.5
490.
31.
40.
33
1.6
37.1
60.
30.
30.
310
047
.817
452
Upp
er S
econ
dary
0.6
65.5
01.
60.
53.
61.
422
.13.
80.
30.
30.
310
031
.172
22Te
rtiar
y0.
785
0.1
0.3
0.2
2.1
0.1
100.
70.
30.
50.
510
013
.251
90W
ealth
inde
x qu
intil
esP
oore
st0.
11.
50
0.3
0.2
0.1
2.2
89.5
5.4
0.2
0.2
0.2
100
97.4
8803
Sec
ond
0.9
16.4
0.1
1.1
0.4
1.5
3.7
64.2
10.5
0.5
0.3
0.3
100
80.3
8796
Mid
dle
0.8
52.7
0.5
2.1
1.1
3.8
2.2
29.2
5.8
0.8
0.5
0.5
100
41.7
8798
Four
th0.
885
.90.
11.
40.
44.
51.
14.
40.
80
0.6
0.6
100
10.8
8797
Ric
hest
0.2
97.4
00
0.3
1.7
0.3
00
00.
10.
110
02
8803
Ethn
icity
of h
ouse
hold
hea
dk
inh/
Hoa
0.6
56.5
0.2
10.
52.
62.
130
.55.
10.
30.
40.
310
040
.538
675
Eth
nic
Min
oriti
es0.
49.
20
0.6
0.1
0.3
0.7
88.3
0.3
00
0.1
100
89.5
5323
Tota
l0.
650
.80.
21
0.5
2.3
1.9
37.5
4.5
0.3
0.3
0.3
100
46.4
4399
81 M
ICS
indi
cato
r 3.1
1
PDF compression, OCR, web optimization using a watermarked evaluation copy of CVISION PDFCompressor

97VIET NAM MULTIPLE INDICATOR CLUSTER SURVEY 2010–2011
MONITORING THE SITUATION OF CHILDREN AND WOMEN
Overall, close to half (46.4 per cent) of all households in Viet Nam use solid fuels for cooking. Use of solid fuels is lower in urban areas (16.9 per cent) than in rural areas where 58.9 per cent of the household population uses solid fuels. The most important differentials are with respect to household living standards and the educational level of the household head. About 76.3 per cent of population in households with uneducated household heads rely on solid fuels compared to only 13.2 per cent among the population in which household heads have tertiary education. The findings show that use of solid fuels is rare among the richest households (2 per cent) and very common among the poorest (97.4 per cent). The reverse is found in relation to the use of liquefied petroleum gas, used by 97.4 per cent of the richest, but only 1.5 per cent of the poorest in the population.Table CH.9 clearly shows that the overall percentage of the populationrelying on solid fuels is high due to the high use of wood for cooking purposes. Clear disparities are also revealed by ethnicity, with population in ethnic minority households being twice as likely to use solid fuels for cooking as those in Kinh/Hoa households.
Solid fuel use alone is a poor proxy indicator for indoor air pollution, since the concentration of the pollutants varies when the same fuel is burnt in different stoves or ovens. Use of closed stoves with chimneys minimises indoor pollution, while open stoves or fires with no chimney or hood mean that there is no protection from the harmful effects of solid fuels. Solid fuel use by place of cooking is depicted in Table CH.10. Among the population in households using solid fuels about 63 per cent use a separate building as place for cooking, and 15.9 per cent use a separate room as kitchen. Some 18.9 per cent cook elsewhere in the house and only 1.9 per cent cook outdoors. Cooking elsewhere in the house among households using solid fuels is negatively correlated with the education level of the household head and household living standards. For example, 33.6 per cent of population in households where the head is uneducated cook elsewhere in the house compared to 8.4 per cent in households where the head has tertiary education. A higher prevalence of outdoor cooking is observed among richest households (23.8 per cent) and in the South East (10.3 per cent), compared to 1.9 per cent overall.
PDF compression, OCR, web optimization using a watermarked evaluation copy of CVISION PDFCompressor

98 VIET NAM MULTIPLE INDICATOR CLUSTER SURVEY 2010–2011
MONITORING THE SITUATION OF CHILDREN AND WOMEN
Table CH.10: Solid fuel use by place of cooking
Percentage distribution of household members in households using solid fuels by place of cooking, Viet Nam, 2010 – 2011
Place of cooking: Number of household
members in households using solid
fuels for cooking
In a separate
room used as kitchen
Elsewhere in the house
In a separate building Outdoors
At another place Total
Region Red River Delta 6.8 1.7 87.7 3.4 0.4 100 3480Northern Midland and Mountain areas 12.9 21.8 64.8 0.3 0.1 100 5056North Central area and Central Coastal area 21 11.8 65.5 1.6 0 100 4953
Central Highlands 20.2 29.5 48.5 1.5 0 100 1253South East 20.6 14.4 53.7 10.3 0 100 1035Mekong River Delta 18.6 34.3 45.8 1.2 0.1 100 4659
AreaUrban 19.2 18.3 54.9 7.3 0.3 100 2192Rural 15.5 19 63.9 1.3 0.1 100 18244
Education of household head None 20.8 33.6 42.7 2.5 0 100 2023Primary 18.2 24.5 54.9 2.2 0.1 100 7059Lower Secondary 13.6 14.2 70.6 1.3 0.2 100 8342Upper Secondary 14.4 9 73.7 2.3 0 100 2250Tertiary 9.3 8.4 78.6 3.4 0.3 100 684
Wealth index quintiles Poorest 15.4 27.8 55 1.5 0.2 100 8571Second 15 14.4 69 1.5 0 100 7067Middle 18.1 10 69.5 2.1 0 100 3671Fourth 17.3 9.6 67.1 5.2 0.8 100 954Richest 23 1.8 51.4 23.8 0 100 173
Ethnicity of household head kinh/Hoa 15.6 14.6 67.2 2.4 0.1 100 15671Ethnic Minorities 17.2 33.2 49.1 0.4 0.1 100 4764
Total 15.9 18.9 63 1.9 0.1 100 20435
MalariaMalaria contributes to anaemia in children and is a common cause of school absenteeism. Preventive measures, especially the use of insecticide treated mosquito nets (ITNs), can dramatically reduce malaria mortality rates among children. In areas where malaria is common, international recommendations suggest treating any fever in children as if it were malaria and immediately giving the child a full course of recommended anti-malarial tablets. Children with severe malaria symptoms, such as fever or convulsions, should be taken to a health facility. Also, children recovering from malaria should be given extra liquids and food and, for younger children, should continue to be breastfed.
Viet Nam is considered a low malaria prevalence country with considerable achievements in malaria prevention. The National Malaria Control Programme aims to reduce mortality and morbidity caused by malaria.
PDF compression, OCR, web optimization using a watermarked evaluation copy of CVISION PDFCompressor

99VIET NAM MULTIPLE INDICATOR CLUSTER SURVEY 2010–2011
MONITORING THE SITUATION OF CHILDREN AND WOMEN
Table CH.11: Household availability of insecticide treated nets and protection by a vector control method
Percentage of households with at least one mosquito net, percentage of households with at least one long-lasting treated net, percentage of households with at least one insecticide treated net (ITN) and percentage of households which either have at least one ITN or have received spraying through an indoor residual spraying (IRS) campaign in the last 12 months, Viet Nam, 2010 – 2011
Percentage of households with at least
one mosquito net
Percentage of households with at least one long-
lasting treated net
Percentage of
households with at least
one ITN1
Percentage of households with at least one ITN or
received IRS during the last
12 months2Number of households
Region Red River Delta 98.5 0.1 6.1 24 2601Northern Midland and Mountain areas 98.9 0.9 16.7 28.5 1836North Central area and Central Coastal area 98.5 0.2 10.5 25.4 2522
Central Highlands 97.9 1.1 22.8 28.8 604South East 79.8 0.7 5 22 1873Mekong River Delta 98.6 0.1 6.4 24.4 2178
Area Urban 88 0.1 4.4 27.4 3454Rural 98.7 0.5 11.6 24 8160
Education of household head None 94.3 1.2 13.5 28 691Primary 97 0.7 10.5 24.6 2919Lower Secondary 96.4 0.3 9.6 23.6 4568Upper Secondary 94 0.2 7.7 25.5 1904Tertiary 92.4 0.3 7.4 28.3 1504
Wealth index quintiles Poorest 98.5 1.3 16.8 26.2 2329Second 99.7 0.2 9.2 20.7 2368Middle 97.9 0.1 8.7 22.6 2406Fourth 94.3 0.4 7.1 23.6 2326Richest 86.6 0.1 5.3 32.7 2186
Ethnicity of household head kinh/Hoa 95.3 0.2 7.4 23.7 10436Ethnic Minorities 97.4 1.9 27.7 36.7 1178
Total 95.5 0.4 9.5 25 116141 MICS indicator 3.12, 2 MICS indicator 3.13
The Viet Nam MICS4 questionnaire incorporates questions on the availability and use of bed nets, both at the household level, among children under 5 years of age, and among pregnant women. It also includes anti-malarial treatment, intermittent preventive therapy for malaria, and indoor residual spraying of households. The survey results indicate that almost all households in Viet Nam have at least one mosquito net (Table CH.11). On the other hand, long-lasting treated nets are almost non-existent (0.4 per cent). Insecticide treated nets (ITN) include long-lasting treated nets, pre-treated nets obtained within the past 12 months and other nets treated in the previous 12 months. Other types of mosquito nets are considered untreated. Some 9.5 per cent of households have at least one ITN. The percentage is higher in malaria prone regions, such as the Northern Midland and Mountain areas (16.7 per cent) and the Central Highlands (22.8 per cent). Prevalence of households with at least one ITN is higher among those headed by ethnic minority (27.7 per cent), which is evidence of the Government’s policy to distribute ITNs among ethnic minority people. Mosquito net and ITN use is higher in rural compared to urban areas, and in poorer compared to richer households. This is attributable to the fact that households
PDF compression, OCR, web optimization using a watermarked evaluation copy of CVISION PDFCompressor
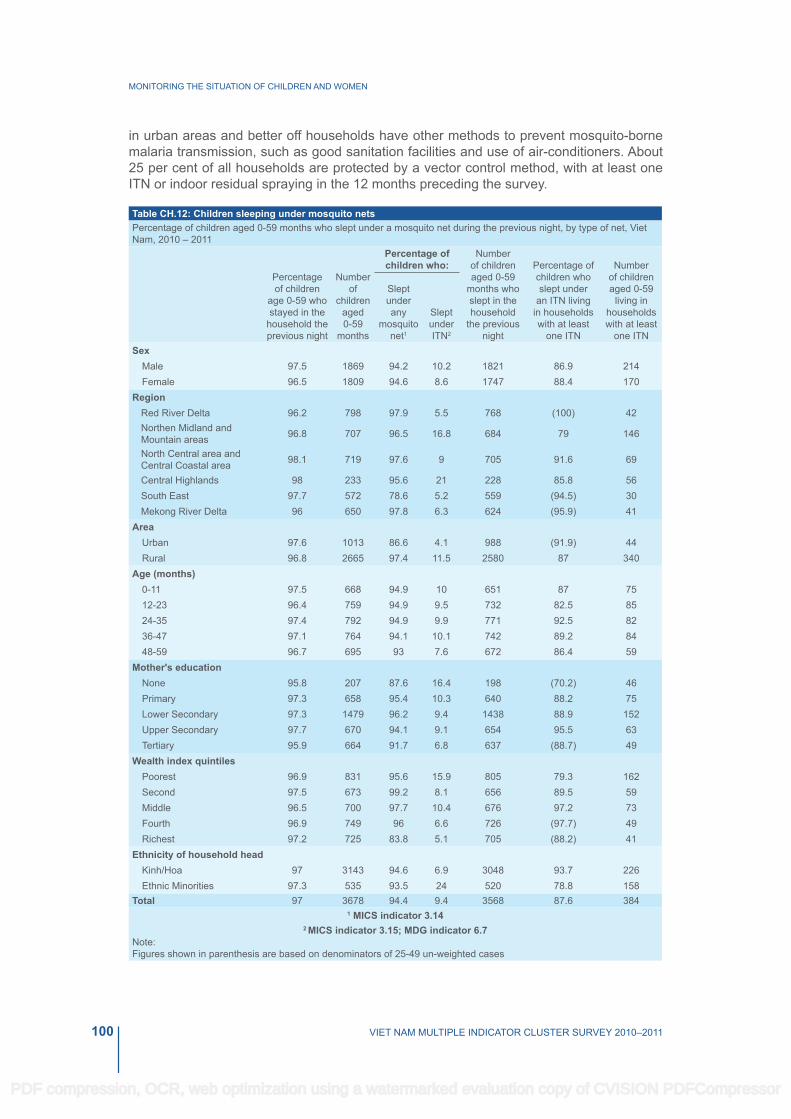
100 VIET NAM MULTIPLE INDICATOR CLUSTER SURVEY 2010–2011
MONITORING THE SITUATION OF CHILDREN AND WOMEN
in urban areas and better off households have other methods to prevent mosquito-borne malaria transmission, such as good sanitation facilities and use of air-conditioners. About 25 per cent of all households are protected by a vector control method, with at least one ITN or indoor residual spraying in the 12 months preceding the survey.
Table CH.12: Children sleeping under mosquito netsPercentage of children aged 0-59 months who slept under a mosquito net during the previous night, by type of net, Viet Nam, 2010 – 2011
Percentage of children
age 0-59 who stayed in the
household the previous night
Number of
children aged 0-59
months
Percentage of children who:
Number of children aged 0-59
months who slept in the household
the previous night
Percentage of children who slept under
an ITN living in households with at least
one ITN
Number of children aged 0-59
living in households with at least
one ITN
Slept under any
mosquito net1
Slept under ITN2
Sex Male 97.5 1869 94.2 10.2 1821 86.9 214Female 96.5 1809 94.6 8.6 1747 88.4 170
Region Red River Delta 96.2 798 97.9 5.5 768 (100) 42Northen Midland and Mountain areas 96.8 707 96.5 16.8 684 79 146
North Central area and Central Coastal area 98.1 719 97.6 9 705 91.6 69
Central Highlands 98 233 95.6 21 228 85.8 56South East 97.7 572 78.6 5.2 559 (94.5) 30Mekong River Delta 96 650 97.8 6.3 624 (95.9) 41
Area Urban 97.6 1013 86.6 4.1 988 (91.9) 44Rural 96.8 2665 97.4 11.5 2580 87 340
Age (months) 0-11 97.5 668 94.9 10 651 87 7512-23 96.4 759 94.9 9.5 732 82.5 8524-35 97.4 792 94.9 9.9 771 92.5 8236-47 97.1 764 94.1 10.1 742 89.2 8448-59 96.7 695 93 7.6 672 86.4 59
Mother's educationNone 95.8 207 87.6 16.4 198 (70.2) 46Primary 97.3 658 95.4 10.3 640 88.2 75Lower Secondary 97.3 1479 96.2 9.4 1438 88.9 152Upper Secondary 97.7 670 94.1 9.1 654 95.5 63Tertiary 95.9 664 91.7 6.8 637 (88.7) 49
Wealth index quintilesPoorest 96.9 831 95.6 15.9 805 79.3 162Second 97.5 673 99.2 8.1 656 89.5 59Middle 96.5 700 97.7 10.4 676 97.2 73Fourth 96.9 749 96 6.6 726 (97.7) 49Richest 97.2 725 83.8 5.1 705 (88.2) 41
Ethnicity of household headkinh/Hoa 97 3143 94.6 6.9 3048 93.7 226Ethnic Minorities 97.3 535 93.5 24 520 78.8 158
Total 97 3678 94.4 9.4 3568 87.6 3841 MICS indicator 3.14
2 MICS indicator 3.15; MDG indicator 6.7Note:Figures shown in parenthesis are based on denominators of 25-49 un-weighted cases
PDF compression, OCR, web optimization using a watermarked evaluation copy of CVISION PDFCompressor

101VIET NAM MULTIPLE INDICATOR CLUSTER SURVEY 2010–2011
MONITORING THE SITUATION OF CHILDREN AND WOMEN
The survey results indicate that 94.4 per cent of children under the age of 5 slept under some type of mosquito net the night prior to the survey and only 9.4 per cent slept under an insecticide treated net (Table CH.12). A higher percentage of children sleep under ITNs in poorer households and in rural areas. Having a mother with low or no education or living in an ethnic minority household is associated with a higher likelihood of sleeping under ITNs. Here too the living standards pattern mentioned above explains why children in disadvantaged households have higher ITN use rates. Overall, some 87.6 per cent of children slept under an ITN in the households that have such nets. This means that 12.4 per cent of children under age 5 did not sleep under an ITN even though the household had at least one of these nets. Table CH.13: Pregnant women sleeping under mosquito nets
Percentage of pregnant women who slept under a mosquito net during the previous night, by type of net, Viet Nam, 2010 - 2011
Percentage of pregnant women who stayed in the
household the previous night
Number of pregnant women
Percentage of pregnant women who: Number of
pregnant women who slept in the household
the previous night
Percentage of pregnant
women who slept under an
ITN, living in households with at least
one ITN
Number of pregnant women living in
households with at least
one ITN
Slept under any mosquito
netSlept
under ITN1
Region Red River Delta 98 68 100 4.9 67 * 5Northen Midland and
Mountain areas 97.8 76 98 10.6 74 * 14
North Central area and Central Coastal area 94.3 91 98.4 23.2 86 * 22
Central Highlands * 24 * * 24 * 7South East 94.8 70 73.6 3 66 * 3Mekong River Delta 95.9 60 97.7 4.2 58 * 2
Area Urban 97.3 119 87.5 4 116 * 5Rural 95.7 271 97 14.6 259 (78.3) 48
Age group 15-19 94.5 54 98.1 20.2 51 * 1520-24 96.2 147 94.1 8.6 142 * 1725-29 95.2 106 93.1 9.9 101 * 1030-34 98.3 64 94.7 10.9 63 * 735-39 * 16 * * 16 * 140-44 * 2 * * 2 * 245-49 * 1 * * 1 * 0
Women’s education None * 7 * * 7 * 2Primary 98.3 50 (95.4) (16.8) 49 * 13Lower Secondary 97.2 145 92.8 9.6 141 * 19Upper Secondary 95.3 102 97.5 12.5 98 * 12Tertiary 94.2 85 90.9 7.8 80 * 6
Wealth index quintiles Poorest 97.3 83 97.5 16 81 * 18Second 96 69 100 16.4 66 * 14Middle 95.9 61 97.8 11.2 58 * 9Fourth 94.9 92 90.9 9.1 87 * 9Richest 97 85 86.7 5 82 * 4
Ethnicity of household head `kinh/Hoa 95.8 334 93.8 9 320 (82.7) 35Ethnic Minorities 98.5 56 95.5 24.9 55 * 18
Total 96.2 390 94.1 11.3 375 80.2 531 MICS indicator 3.19
Note:Figures denoted by an asterisk are based on denominators of 24 un-weighted cases and lessFigures shown in parenthesis are based on denominators of 25-49 un-weighted cases
PDF compression, OCR, web optimization using a watermarked evaluation copy of CVISION PDFCompressor

102 VIET NAM MULTIPLE INDICATOR CLUSTER SURVEY 2010–2011
MONITORING THE SITUATION OF CHILDREN AND WOMEN
Table CH.13 presents the proportion of pregnant women who slept under a mosquito net or ITN during the previous night. Some 94.1 per cent of pregnant women slept under any mosquito net the night prior to the survey but only 11.3 per cent slept under an ITN.
Questions on the prevalence and treatment of fever were asked for all children under age 5. About 16.4 per cent of children under 5 years of age were ill with fever in the two weeks prior to the survey (Table CH.14). Fever prevalence peaked at the age group 12–23 months (20.1 per cent) and declined with age. Fever is less commonly reported among children from the Central Highlands (8.6 per cent) compared to those from the North Central area and Central Coastal area (21.7 per cent).
PDF compression, OCR, web optimization using a watermarked evaluation copy of CVISION PDFCompressor

103VIET NAM MULTIPLE INDICATOR CLUSTER SURVEY 2010–2011
MONITORING THE SITUATION OF CHILDREN AND WOMEN
Tabl
e C
H.1
4: A
nti-m
alar
ial t
reat
men
t of c
hild
ren
with
ant
i-mal
aria
l dru
gs
Per
cent
age
of c
hild
ren
aged
0-5
9 m
onth
s w
ho h
ad fe
ver i
n th
e la
st tw
o w
eeks
who
rece
ived
ant
i-mal
aria
l dru
gs, V
iet N
am, 2
010
– 20
11
H
ad a
fe
ver
in th
e la
st
two
wee
ks
Num
ber
of
child
ren
aged
0-
59
mon
ths
Num
ber
of
child
ren
with
fe
ver i
n la
st tw
o w
eeks
Ant
i-mal
aria
ls:
O
ther
med
icat
ions
:P
erce
ntag
e w
ho to
ok a
n an
ti-m
alar
ial
drug
the
sam
e or
ne
xt d
ay2
Chl
oro-
qu
ine
Qui
nine
sul
phat
e ,A
CT,
Qui
nine
di
hydr
ochl
orat
eDih
ydro
-ar
tem
isin
in-P
iper
aqui
ne,
Prim
aqui
ne
Oth
er
anti-
mal
aria
l
Any
an
ti-m
alar
ial
drug
1
Ant
i -b
iotic
pi
ll or
sy
rup
Ant
i -b
iotic
in
ject
ion
Par
acet
-am
ol/
Pan
adol
/ A
ceta
min
-op
hen
Asp
irin
Ibup
rofe
nO
ther
Mis
sing
/ D
kSe
x
Mal
e17
.41,
869
0.4
0.4
0.5
1.2
23.7
7.4
47.4
1.9
0.7
22.7
10.1
1.1
325
Fem
ale
15.3
1,80
90.
70.
60.
21.
223
.75.
238
.62.
30.
727
.28.
70.
727
7R
egio
n
Red
Riv
er D
elta
14.8
798
00
00
15.8
8.5
283.
40
24.8
3.2
011
8N
orth
ern
Mid
land
and
M
ount
ain
area
s16
.870
70
00
036
.58.
528
.33.
40
34.2
1.5
011
9
Nor
th C
entra
l are
a an
d C
entra
l Coa
stal
are
a21
.771
90.
90
0.5
1.3
21.1
6.9
57.8
11.
113
.36.
40.
515
6
Cen
tral H
ighl
ands
8.6
233
**
**
**
**
**
**
20S
outh
Eas
t19
.357
21.
22.
70.
83.
623
.53.
447
.91.
72.
329
.117
.83.
211
0M
ekon
g R
iver
Del
ta12
.365
00.
80
00.
820
3.5
51.9
0.8
028
.326
.80.
880
Are
a
Urb
an15
.51,
013
1.3
1.3
0.5
2.5
26.2
4.3
46.1
1.1
127
.98.
31.
415
7R
ural
16.7
2,66
50.
30.
20.
30.
722
.87.
142
.42.
40.
623
.79.
90.
744
5A
ge (m
onth
s)
0-11
14
.666
80
01.
51.
516
.51.
338
.70
1.8
26.2
4.1
1.5
9812
-23
20.1
759
00.
60
0.3
26.2
11.3
40.4
30.
628
.47.
80.
315
324
-35
18.4
792
00.
30
0.3
21.7
642
.31.
10.
426
.813
014
636
-47
14.2
764
1.8
1.4
02.
529
.33.
945
.93.
61
17.4
10.9
1.3
108
48-5
9 14
.169
51.
30
0.7
2.1
23.6
7.1
51.4
2.4
022
.810
.52.
198
Mot
her’s
edu
catio
n
Non
e19
.520
7(0
)(0
)(0
)(0
)(2
1.1)
(10.
4)(5
3.7)
(0)
(0)
(16.
9)(8
.3)
(0)
40P
rimar
y16
.665
81.
20
0.5
1.7
25.3
2.3
40.6
1.4
025
.212
.30.
510
9Lo
wer
Sec
onda
ry17
.71,
479
0.8
10.
61.
922
.67.
941
.42.
61
24.3
12.3
1.9
261
Upp
er S
econ
dary
13.9
670
00
00
25.7
6.4
47.3
0.2
015
.87.
50
93Te
rtiar
y14
.966
40
0.5
00.
524
5.2
43.7
41.
837
.11.
20
99
PDF compression, OCR, web optimization using a watermarked evaluation copy of CVISION PDFCompressor


