Code No: 13141
VIKRMA SIMHAPURI UNIVERSITY : NELLORE
FIRST B.A / B.Sc. – STATISTICS
PAPER – I : DESCRIPTIVE STATISTICS AND PROBABILITY DISTRIBUTIONS
(WITH MATHS COMBINATION)
UNIT – I
Descriptive Statistics: Moments, Central and non-central moments and their interrelationships,
Sheppard’s corrections for moments for grouped data. Measures of skewness based on quartiles
and moments and kurtosis based on moments with examples. 15L
Probability: Basic concepts in probability: Deterministic and random experiments, trail, outcome,
sample space, event, and operations of events mutually exclusive and exhaustive events and
equally likely and favorable outcomes with examples. Mathematical, statistical and axiomatic
definitions of probability with merits and demerits. Properties of probability based on axiomatic
definition. Conditional probability and independence of events. Addition and multiplication
theorems for n events. Boole’s inequality and Baye’s theorem. Problems on probability using
counting methods and theorems. 15L
UNIT – II
Random variables: Definition of random variable, discrete and continuous random variables,
functions of random variables, probability density function with illustrations. Distribution function
and its properties. Notion of bivariate random variable, bivariate distribution and statement of its
properties. Joint, marginal and conditional distributions. Independence of random variables. 15 L
Mathematical Expectation: Mathematical expectation of a function of a random variable. Raw
and central moments and covariance using mathematical expectation with examples. Addition and
multiplication theorems of expectation, Definition of moment generating function (m.g.f),
cumulant generating function (c.g.f), and characteristic function (c.f) and statements of their
properties with applications. Chebyshev’s , and Cauchy-Schwartz’s inequalities. 15 L
UNIT-III
Discrete distributions: Binomial, Poisson, Negative binomial, Geometric and Hyper-
geometric(mean and variance only) distributions. Properties of these distributions such as m.g.f
,c.g.f., c.f., and moments up to fourth order and their real life applications. Reproductive property
wherever exists. Binomial approximation to Hyper-geometric, Poisson approximation to Binomial
and Negative binomial distributions. 30L
UNIT – IV
Continuous distributions: Rectangular and Normal distributions, Normal distribution as a limiting
case of Binomial and Poisson distributions. Exponential, Gamma and Beta of two kinds (mean and

variance only) distributions. Properties of these distributions such as m.g.f., c.g.f., c.f., and
moments upto fourth order, their real life applications and reproductive productive property
wherever exists. 30L
List of reference books:
1. V.K.Kapoor and S.C.Gupta: Fundamentals of Mathematical Statistics, Sultan
Chand & Sons, New Delhi.
2. Statistics Paper – I (Telugu Academy, Hyderabad)
3. Willam Feller : Introduction to Probability theory and its applications. Volume –I, Wiley
4. Goon AM, Gupta MK, Das Gupta B : Fundamentals of Statistics , Vol-I, the World Press
Pvt.Ltd., Kolakota.
5. Hoel P.G: Introduction to mathematical statistics, Asia Publishing house.
6. M. JaganMohan Rao and Papa Rao: A Text book of Statistics Paper-I.
7. Sanjay Arora and Bansi Lal: New Mathematical Statistics: Satya Prakashan , New Delhi
8. Hogg Tanis Rao: Probability and Statistical Inference. 7th
edition. Pearson
9. K.V.S. Sarma: Statistics Made Simple: Do it yourself on PC. PHI
Instructions to the Paper Setter
1. Since each question carry only 10 Marks, simple questions with sufficient clarity is to be
set in the question paper.
2. Since there is a separate practical examination, higher focus should be on theoretical
concepts than numerical problems.
3. The following table reveals the distribution of questions for each unit and in each topic
Unit Topic
No. of
questions
to be set
UNIT - I
1. Moments, Skewness & Kurtosis
2. Probability
3 2
UNIT - II
1. Discrete random Variable
2.Continuous random variable
3. Mathematical expectation
4. Generating functions
5. Inequalities
1 1 1 1 1
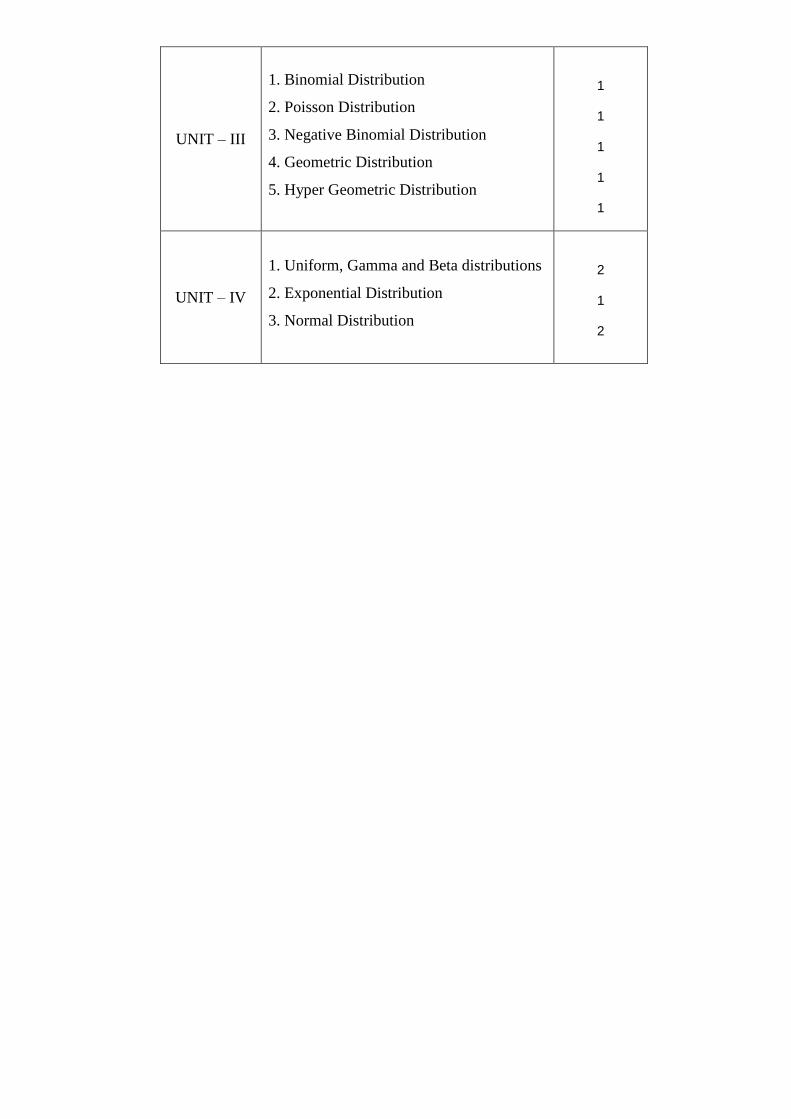
UNIT – III
1. Binomial Distribution
2. Poisson Distribution
3. Negative Binomial Distribution
4. Geometric Distribution
5. Hyper Geometric Distribution
1 1 1 1 1
UNIT – IV
1. Uniform, Gamma and Beta distributions
2. Exponential Distribution
3. Normal Distribution
2 1 2
Code No:13141
MODEL QUESTION PAPER
STATISTICS
(With Mathematics Combination)
Common to B.A / B.Sc
Paper-I: Descriptive Statistics and probability distributions
Time: 3hours Max.Marks:100
Note: 1. Answer any TEN questions choosing atleast one from each unit
2. Each question carry 10 Marks
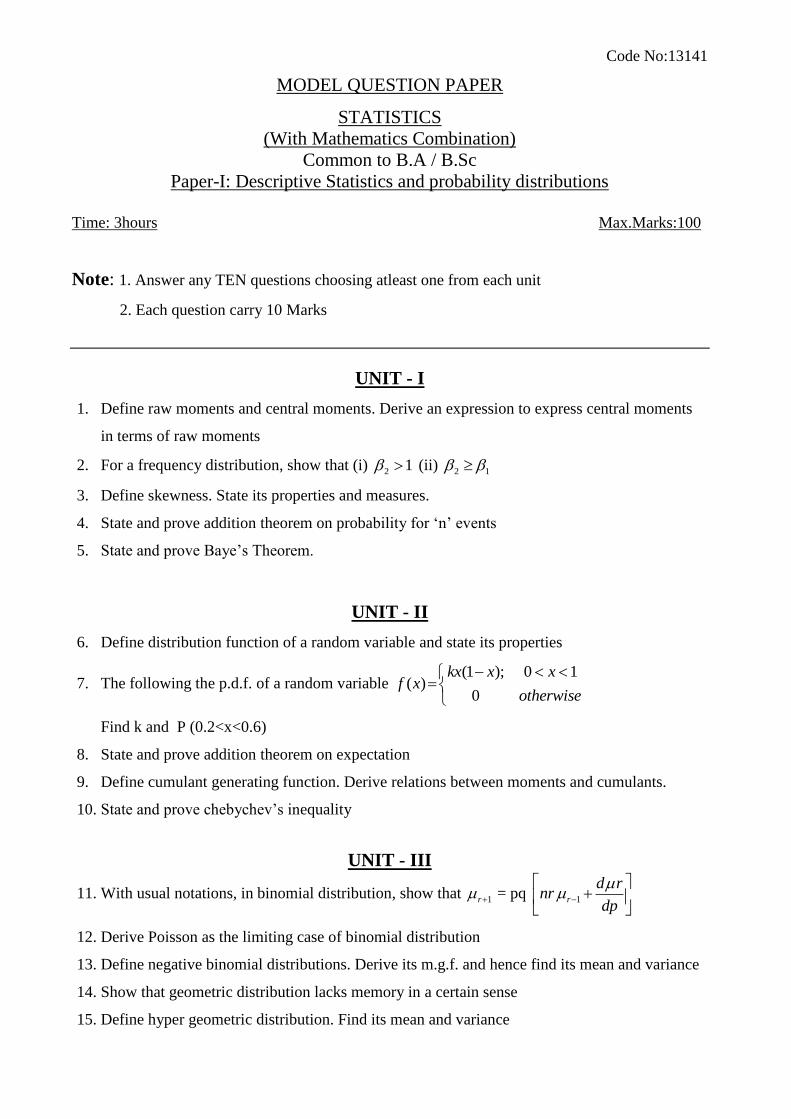
UNIT - I
1. Define raw moments and central moments. Derive an expression to express central moments
in terms of raw moments
2. For a frequency distribution, show that (i) 2 1 (ii) 2 1
3. Define skewness. State its properties and measures.
4. State and prove addition theorem on probability for ‘n’ events
5. State and prove Baye’s Theorem.
UNIT - II
6. Define distribution function of a random variable and state its properties
7. The following the p.d.f. of a random variable (1 ); 0 1
( )0
kx x xf x
otherwise
Find k and P (0.2<x<0.6)
8. State and prove addition theorem on expectation
9. Define cumulant generating function. Derive relations between moments and cumulants.
10. State and prove chebychev’s inequality
UNIT - III
11. With usual notations, in binomial distribution, show that 1r = pq 1r
d rnr
dp
12. Derive Poisson as the limiting case of binomial distribution
13. Define negative binomial distributions. Derive its m.g.f. and hence find its mean and variance
14. Show that geometric distribution lacks memory in a certain sense
15. Define hyper geometric distribution. Find its mean and variance
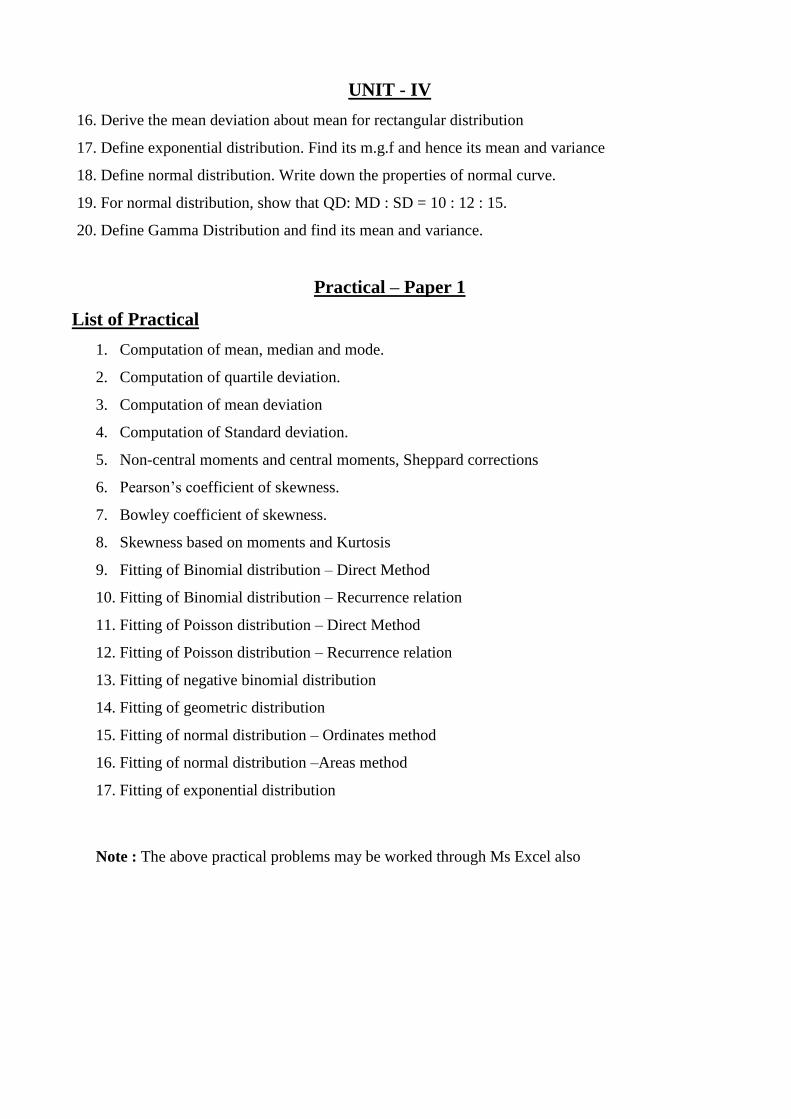
UNIT - IV
16. Derive the mean deviation about mean for rectangular distribution
17. Define exponential distribution. Find its m.g.f and hence its mean and variance
18. Define normal distribution. Write down the properties of normal curve.
19. For normal distribution, show that QD: MD : SD = 10 : 12 : 15.
20. Define Gamma Distribution and find its mean and variance.
Practical – Paper 1
List of Practical
1. Computation of mean, median and mode.
2. Computation of quartile deviation.
3. Computation of mean deviation
4. Computation of Standard deviation.
5. Non-central moments and central moments, Sheppard corrections
6. Pearson’s coefficient of skewness.
7. Bowley coefficient of skewness.
8. Skewness based on moments and Kurtosis
9. Fitting of Binomial distribution – Direct Method
10. Fitting of Binomial distribution – Recurrence relation
11. Fitting of Poisson distribution – Direct Method
12. Fitting of Poisson distribution – Recurrence relation
13. Fitting of negative binomial distribution
14. Fitting of geometric distribution
15. Fitting of normal distribution – Ordinates method
16. Fitting of normal distribution –Areas method
17. Fitting of exponential distribution
Note : The above practical problems may be worked through Ms Excel also
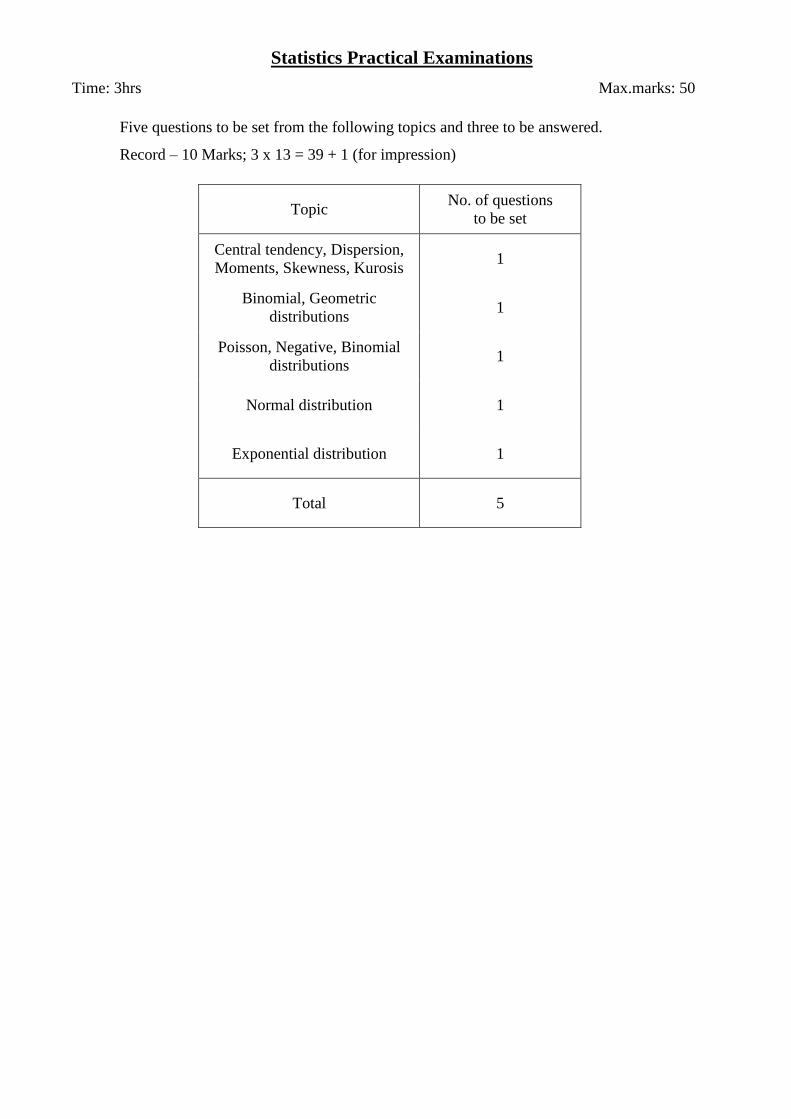
Statistics Practical Examinations
Time: 3hrs Max.marks: 50
Five questions to be set from the following topics and three to be answered.
Record – 10 Marks; 3 x 13 = 39 + 1 (for impression)
Topic No. of questions
to be set
Central tendency, Dispersion,
Moments, Skewness, Kurosis 1
Binomial, Geometric
distributions 1
Poisson, Negative, Binomial
distributions 1
Normal distribution 1
Exponential distribution 1
Total 5
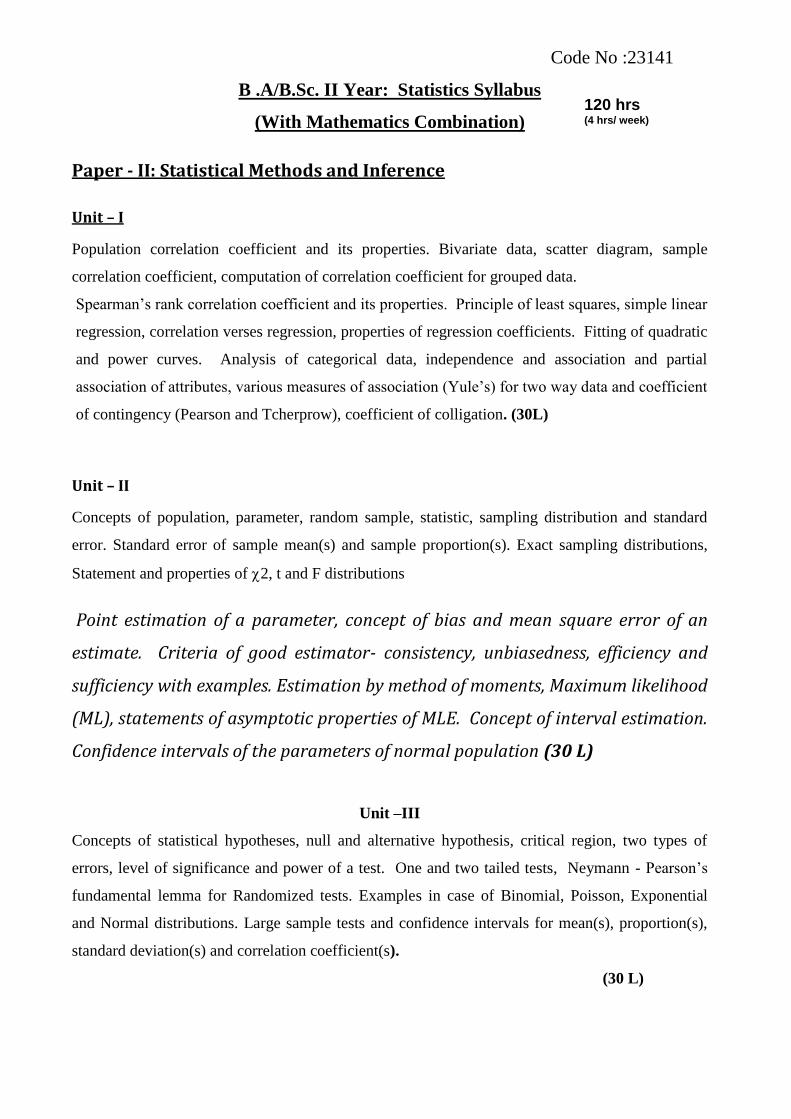
Code No :23141
B .A/B.Sc. II Year: Statistics Syllabus
(With Mathematics Combination)
Paper - II: Statistical Methods and Inference
Unit – I
Population correlation coefficient and its properties. Bivariate data, scatter diagram, sample
correlation coefficient, computation of correlation coefficient for grouped data.
Spearman’s rank correlation coefficient and its properties. Principle of least squares, simple linear
regression, correlation verses regression, properties of regression coefficients. Fitting of quadratic
and power curves. Analysis of categorical data, independence and association and partial
association of attributes, various measures of association (Yule’s) for two way data and coefficient
of contingency (Pearson and Tcherprow), coefficient of colligation. (30L)
Unit – II
Concepts of population, parameter, random sample, statistic, sampling distribution and standard
error. Standard error of sample mean(s) and sample proportion(s). Exact sampling distributions,
Statement and properties of 2, t and F distributions
Point estimation of a parameter, concept of bias and mean square error of an
estimate. Criteria of good estimator- consistency, unbiasedness, efficiency and
sufficiency with examples. Estimation by method of moments, Maximum likelihood
(ML), statements of asymptotic properties of MLE. Concept of interval estimation.
Confidence intervals of the parameters of normal population (30 L)
Unit –III
Concepts of statistical hypotheses, null and alternative hypothesis, critical region, two types of
errors, level of significance and power of a test. One and two tailed tests, Neymann - Pearson’s
fundamental lemma for Randomized tests. Examples in case of Binomial, Poisson, Exponential
and Normal distributions. Large sample tests and confidence intervals for mean(s), proportion(s),
standard deviation(s) and correlation coefficient(s).
(30 L)
120 hrs (4 hrs/ week)
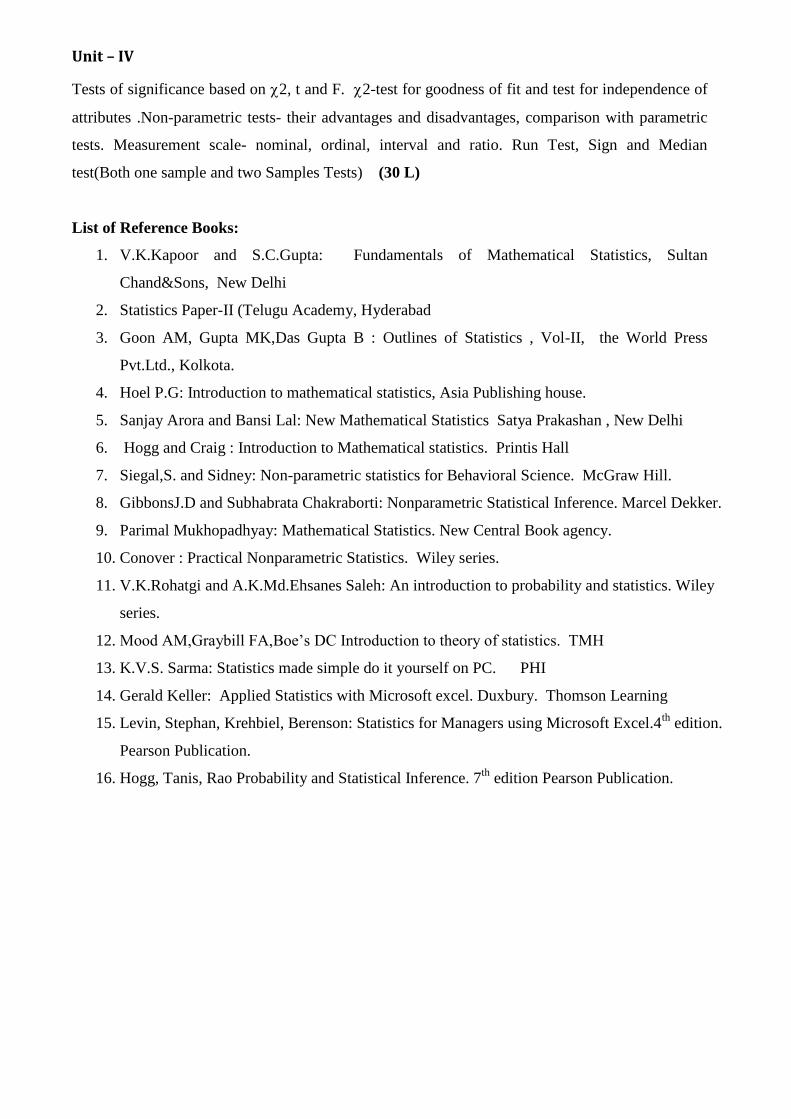
Unit – IV
Tests of significance based on 2, t and F. 2-test for goodness of fit and test for independence of
attributes .Non-parametric tests- their advantages and disadvantages, comparison with parametric
tests. Measurement scale- nominal, ordinal, interval and ratio. Run Test, Sign and Median
test(Both one sample and two Samples Tests) (30 L)
List of Reference Books:
1. V.K.Kapoor and S.C.Gupta: Fundamentals of Mathematical Statistics, Sultan
Chand&Sons, New Delhi
2. Statistics Paper-II (Telugu Academy, Hyderabad
3. Goon AM, Gupta MK,Das Gupta B : Outlines of Statistics , Vol-II, the World Press
Pvt.Ltd., Kolkota.
4. Hoel P.G: Introduction to mathematical statistics, Asia Publishing house.
5. Sanjay Arora and Bansi Lal: New Mathematical Statistics Satya Prakashan , New Delhi
6. Hogg and Craig : Introduction to Mathematical statistics. Printis Hall
7. Siegal,S. and Sidney: Non-parametric statistics for Behavioral Science. McGraw Hill.
8. GibbonsJ.D and Subhabrata Chakraborti: Nonparametric Statistical Inference. Marcel Dekker.
9. Parimal Mukhopadhyay: Mathematical Statistics. New Central Book agency.
10. Conover : Practical Nonparametric Statistics. Wiley series.
11. V.K.Rohatgi and A.K.Md.Ehsanes Saleh: An introduction to probability and statistics. Wiley
series.
12. Mood AM,Graybill FA,Boe’s DC Introduction to theory of statistics. TMH
13. K.V.S. Sarma: Statistics made simple do it yourself on PC. PHI
14. Gerald Keller: Applied Statistics with Microsoft excel. Duxbury. Thomson Learning
15. Levin, Stephan, Krehbiel, Berenson: Statistics for Managers using Microsoft Excel.4th
edition.
Pearson Publication.
16. Hogg, Tanis, Rao Probability and Statistical Inference. 7th
edition Pearson Publication.
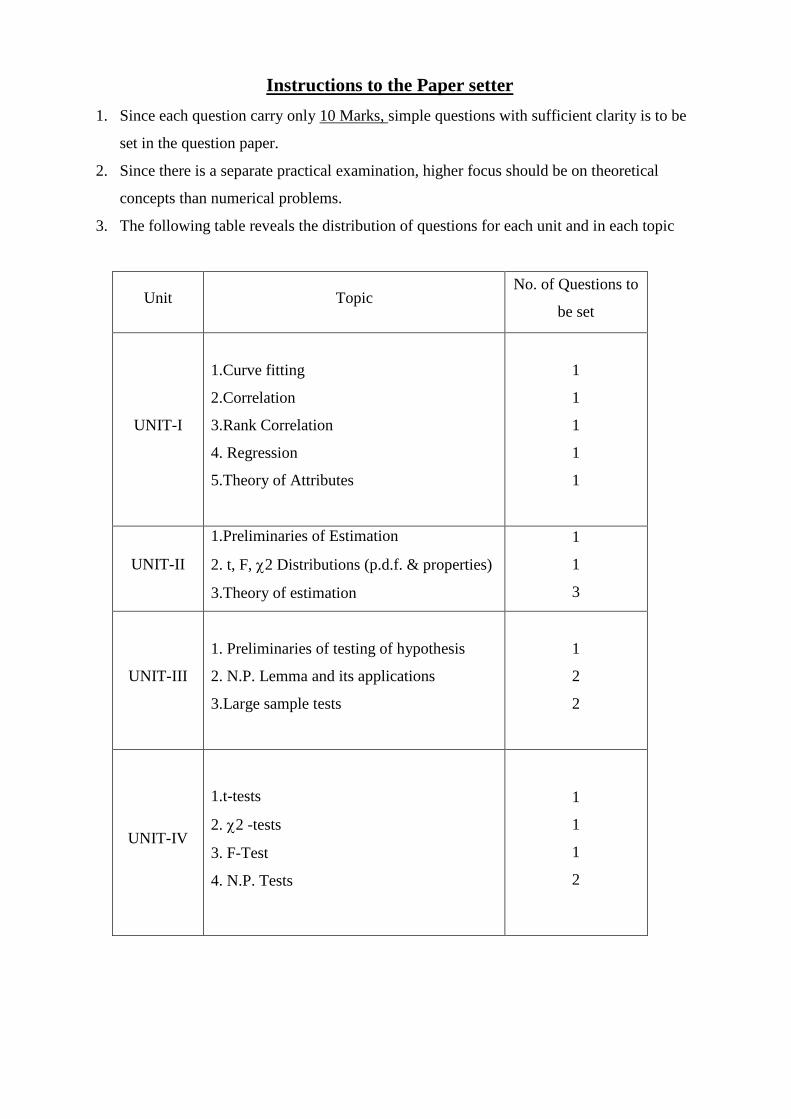
Instructions to the Paper setter
1. Since each question carry only 10 Marks, simple questions with sufficient clarity is to be
set in the question paper.
2. Since there is a separate practical examination, higher focus should be on theoretical
concepts than numerical problems.
3. The following table reveals the distribution of questions for each unit and in each topic
Unit Topic No. of Questions to
be set
UNIT-I
1.Curve fitting
2.Correlation
3.Rank Correlation
4. Regression
5.Theory of Attributes
1
1
1
1
1
UNIT-II
1.Preliminaries of Estimation
2. t, F, 2 Distributions (p.d.f. & properties)
3.Theory of estimation
1
1
3
UNIT-III
1. Preliminaries of testing of hypothesis
2. N.P. Lemma and its applications
3.Large sample tests
1
2
2
UNIT-IV
1.t-tests
2. 2 -tests
3. F-Test
4. N.P. Tests
1
1
1
2

Code No :23141
Model Question Paper
Statistics (With Mathematics Combination)
Common to B.A / B.Sc
Paper-II - Statistical Methods and Inference
Time : 3hours Max. marks: 100
Note: 1. Answer any TEN questions choosing at least ONE from each unit.
2. Each question carries 10 marks.
Unit-I
1. Derive normal equations fit a second degree parabola.
2. Define correlation coefficient and prove that -1<r<+1
3. Derive the limits for rank correlation coefficient
4. Derive the regression line of Y and X
5. Define Yule’s coefficient of association and coefficient of colligation and establish a
relation between them.
Unit - II
6. Define the following terms with examples
a) Population b) Sample c) Parameter d) Statistic
7. Define t-distribution Mention its properties and uses.
8. Explain the properties of a good estimate.
9. In normal distribution show that both sample mean square co-efficient and sample
variance are consistent estimators for population variance.
10. Derive a maximum likelyhood estimator for the parameter in exponential
distribution.
Unit - III
11. Explain the following terms
a) Two types of Errors. b) Critical region c) Power of the test.
12. Sate and prove Neymann - Pearson Lemma.
13. By Using N.P. Lemma, find the best critical region for testing 0 0 1 1: ( ) :H vs H
on the basis of sample drawn from a Poisson population.
14. Explain the large sample test to examine the significant difference between two sample
means.
15. Explain the test to examine the population correlation coefficient in large samples.
Unit - IV
16. Explain the –test for independence of attributes.
17. Explain paired t-test.
18. Explain the F-test for the significant difference between two sample variances.
19. Explain run test.
20. Explain median test.
List of Practical’s
1. Fitting of straight line
2. Fitting of second degree parabola.
3. Fitting of exponential curve of I Kind
4. Fitting of exponential curves of II Kind
5. Fitting of power curve
6. Computation of correlation coefficient
7. Computation of correlation coefficient – Bivariate data
8. Rank correlation coefficient.
9. Fitting of Regression lines
10. Computation of coefficient of association and Colligation
11. Computation of Contingency coefficients.
12. a) Test for Population Mean.
b) Test for the significant difference between two sample means.
13. a) Test for Population Standard deviations.
b) Test for the significant difference between two sample Standard deviation.
14. a) Test for Population Proportion.
b) Test for the significant difference between two sample Proportions.
15. a) Test for population correlation coefficient
b) Test for the significant difference between two sample correlation coefficient.
16. t- test for Population Mean.
17. t- test for the significant difference between two sample means.
18. Paired T-Test
19. Chi- Square test for goodness of fit - Binomial Distribution.
20. Chi- Square test for goodness of fit - Poisson Distribution
21. Chi- Square test for independence of attributes.
22. Test for the significant difference between two sample variances.
23. Run Test.
24. Sign Test.
25. Median Test.
Note : The above practical problems may be worked through Ms Excel also

B.A/B.Sc. II Year: Statistics Syllabus
(With Mathematics Combination)
(Examination at the end of II Year)
Practical Paper – II
Time :3 Hours Max. Marks:50
Five questions to be set from the following topics and three to be answered.
Record – 10 marks 3 X 13 = 39 + 1 (for impression)
Topic No. of Questions to be set
Curve fitting 1
Correlation, Rank Correlation,
Regression, Attributes
1
Large Sample Tests 1
Small Sample Tests 1
Non Parametric Tests 1
Total 5
90 hrs (3 hrs/ week)
Code No:33141
VIKRAM SIMHAPURI UNIVERSITY:NELLORE
Paper III – Applied Statistics
(With Maths Combination)
Common to BA/B.Sc 90hrs (3hrs / week)
Unit-I
Design of sample surveys:
Concept of population, sample, sampling unit, parameter, statistic, sampling errors, sampling
distribution, sampling frame and Standard Error. Principal steps in sample surveys, need for
sampling, census versus sampling.
Sampling and non-sampling errors, sources and treatment of non-sampling errors, advantages and
limitations of sampling.
Types of Sampling: Subjective, probability, and mixed sampling methods, methods of drawing
random samples with and without replacement. Estimation of population mean, total and
proportion, their variances
i) SRSWR AND SRSWOR
ii) Stratified random sampling with proportional and Neymann allocation and
iii) Systematic sampling when N = nk comparison of relative efficiencies. Advantages and
Disadvantages of above methods of sampling.
Unit-II
Analysis of Variance: One-way and Two-way classification with one observation per cell.
Expectation of various sum of squares, mathematical analysis and applications to design of
experiments.
Design of Experiments:
Principles of experimentation, analysis of completely randomised design (CRD), Randomised
block design (RBD) and Latin square design (LSD) including one missing observation.
Unit-III
Time series: Time series and its components with illustrations, additive, multiplicative models.
Determination of trend by least squares (Linear trend, parabolic trend only), moving average
method, simple average method. Determination of seasonal indices by Ratio to trend and Link
relative methods.

Index Numbers
Concept, Construction, uses and limitations of simple and weighted index numbers. Laspayer’s,
Paasche’s and Fisher’s index numbers, Criterion of good index number, problems involved in the
construction of index numbers. Fisher’s ideal index numbers. Fixed and chain base index numbers
cost of living index number and wholesale price index number. Base shifting, splicing and
deflation of index numbers.(6L)
Unit-IV
Official Statistics: Functions and organization of CSO and NSSO. National income and its
computation.
Vital Statistics: Introduction, definition and uses of vital statistics, sources of vital statistics,
Registration method and census method. Rates and ratios, crude death rate, age specific death rate,
standardised death rate, crude birth rate, age specific fertility rate, general fertility rate, total
fertility rate, measurement of population growth, crude rate of natural increase, pearl’s vital index.
Gross reproduction rate and net reproduction rate. life tables, construction and uses of life tables,
abridged life tables.
LIST OF REFERENCE BOOKS
1. V.K.KAPOOR AND S.C.Gupta: Fundamentals of applied statistics. Sultan Chand.
2. Statistics-Paper III (Telugu Academy, Hyderabad)
3. M.R.Saluja: Indian official statistics. ISI publications.
4. B.L.Agarwal: Basic Statistics, new age publications.
5. S.P.Guptha: Statistical methods. Sulthan Chand & sons.
6. K.V.S.Sarma:Statistics made simple: Do it yourself on PC.PHI
7. Arora,Sumeet Arora,S.Arora: comprehensive statistical methods. S.Chand.
8. Statistics:Theory & methods-B.N.Guptha.

Instructions to the Paper Setter
4. Since each question carry only 10 Marks, simple questions with sufficient clarity is to be
set in the question paper.
5. Since there is a separate practical examination, higher focus should be on theoretical
concepts than numerical problems.
6. The following table reveals the distribution of questions for each unit and in each topic
Unit Topic No. of
question is to be set
1.Design of sample
Surveys
1. Theoretical concepts of sampling.
2. SRSWOR & SRSWR
3.Estimate of stratified random sampling
4.Proportional and optimal allocation methods.
5. Systematic random sampling.
1
1
1
1
1
II. Analysis of
Variance and
Design of
Experiments
1. ANOVA one way and two way classifications.
2. Necessity and principles of experimentation
3. CRD
4.RBD
5.LSD
1
1
1
1
1
III. Time series
&index numbers.
1. Concept of time series.
2. Estimation of trend.
3. Determination of seasonal indices.
4. Index numbers.
1
1
1
2
IV. Official
Statistics and Vital
Statistics.
1. Functions and organization of CSO and NSSO
2. Computation and utility of national income.
3. Concepts of vital statistics
4.Different vital rates.
5. Life table.
1
1
1
1
1

Code No:33141
MODEL QUESTION PAPER
Statistics (With Maths Combination)
Common to BA/B.Sc
Paper-III: Applied Statistics
Time 3 Hrs Max marks:100
Note: 1. Answer any Ten questions choosing atleast one from each unit.
2. Each question caries 10 Marks.
Unit-I
1. Explain the main steps involved in planning and execution of sample survey.
2. In SRSWOR, Show that 2( )N n
V y SNn
3. Define stratified random sampling. Bring out its advantages over simple random sampling.
4. With usual notations, show that ( )ran prop opt ststV y V y V y
5. Define systematic random sampling. With usual notations, show that
22
11sys wsy
k nNV y S
N NS
Unit-II
6. Explain one way classification by brining the assumptions involved in it.
7. Explain the principles of experimentation with suitable examples.
8. Write down the statistical analysis of randomized block design.
9. Describe latin square design, Write down its layout.
10. Define missing plot in experimental designs. Derive the expression to estimate the
missing plot in an R.B.D.
Unit-III
11. Explain various components involved in time series analysis.
12. Explain the least square method to estimate the trend in time series analysis.
13. Explain the method of link relatives to estimate the seasonal indices in time series analysis.
14. Define Index Number, Explain various weighted index numbers.
15. Explain the procedure to construct the cost of living index number. Also bring out its uses
and limitations.
Unit - IV
16. Explain the main functions of central statistical organization.
17. Explain computational procedure of National income.
18. Define the rate of mortality. Explain various death rates in vital statistics and write the
merits and demerits.
19. Explain various rates of fertility and write the merits and demerits.
20. Explain the columns of a life table.
Paper-III: List of Practicals
1. Simple random sampling without replacement – Estimation of population means, variance
and total.
2. Simple random sampling with replacement – Estimation of population means, variance and
total.
3. Stratified random sampling - Proportional & Optimal allocation method.
4. Systematic random sampling - Estimation of population mean and variance.
5. One way classification - ANOVA
6. Two way classification - ANOVA
7. Analysis of CRD.
8. Analysis of RBD.
9. Analysis of RBD with one missing plot.
10. Analysis of LSD.
11. Analysis of LSD with one is missing Plot.
12. Measurement of Trend - Method of moving averages.
13. Measurement of Trend - Straight line.
14. Measurement of Trend - Second degree parabola.
15. Determination of seasonal indices - Ratio to trend method.
16. Determination of seasonal indices - Method of link relatives.
17. Computation of simple index numbers.
18. Computation of weighted index number.
19. Reversal test
20. Construction of cost of living index number.
21. Computation of various mortality rates.
22. Construction of life table.
23. Computation of various fertility rates.
24. Computation of gross and reproduction rates.
Note : The above practical problems may be worked through Ms Excel also

Statistics Practical Examination
Time 3 Hrs Max marks:50
Five questions to be set from the following topics and three to be answered.
Record - 10 marks; 3 x 13 = 39 + 1 (for impression).
Topic No. of questions
to be set
Sampling 1
ANOVA & Designs 1
Time Series 1
Index Numbers 1
Vital Statistics 1
Total 5
Code No:43141
VIKRAM SIMHAPURI UNIVERSITY:NELLORE
PAPER-IV: Quality, Reliability and Operations Research
(with Maths Combination)
Common to B.A / B.Sc 90hrs (3hrs / weak)
Unit-I
Statistical Process Control:
Importance of SQC in industry, Statistical basis of shewart control charts. Construction of control
charts for variables (mean, range and standard deviation) and attributes (pnp and c-charts with
fixed and varying sample sizes). Interpretation of control charts, Natural tolerance limits and
specification limits.(20L)
Unit-II
Acceptance sampling plans: Procedures risk and consumer’s risk and their OC and ASN
functions. Design of single and Double sampling plans for attributes using Binomial.
Reliability: Introduction failure rates, Hazard function, instantaneous failure rates, mean time
between failures, estimation of reliability, exponential distribution as life model, its memory less
property. (20L)
Unit-III
Linear programming: Meaning and scope of OR, Definition of general LPP, Formulation of LPP,
Solution of LPP by graphical method, simplex algorithm, concept of artificial variable, Big-M
method. (25L)
Unit-IV
Transportation, Assignment and Sequencing problems: Definition of transportation problem,
TPP as special case of LPP, feasible solution by north west corner rule, least cost method and
VAM for balanced and unbalanced transportation problem. Formulation and Description of
assignment problem, assignment problem as special case of TP and LPP, unbalanced assignment
problem, travelling sales person problem, optimal solution using Hungarian method.
Problem of sequencing: Optimal sequence of n jobs on two and three machines without
passing.(25L)
List of reference books
1.Kanti swaroop, P.K.Guptha and Man Mohan: Operation Research. Sultan Chand.
2.V.K.Kapoor and S.C.Gupta: Fundamentals of Applied Statistics. Sultan Chand.
3.Statistics – Paper IV (Telugu Academy, Hyderabad).
4.S.K Sinha: Reliability and life testing. Wiley Eastern.
5.R.C.Gupta: Statistical Quality Control.

INSTUCTIONS TO THE PAPER SETTER
1. Since each question carry only 10 marks, simple questions with sufficient clarity is to be set
in the question paper.
2. The ratio of theory and problems should be 60% to 40%.It means 8 numerical applications
should be set among the total 20 questions
3. While setting a numerical problem as a 10 marks question in the question paper , the
working time for the problem should not exceed 10 to 15 minutes for an average student.
For example,
Simplex method: 2 variables, 3 constants
3 variables, 2 constants.
Transportation : Should not exceed 3 rows & 4 columns or 4 rows & 3 columns
Assignment : Should not exceed 5X5 matrix
Sequencing : Should not exceed 6 jobs.
4. The following table reveals the distribution of questions for each unit in each topic.
Unit Topic No. of questions to be set
1.Statistical
process control
II. Acceptance
sampling plans
reliability
III. Linear
Programming
IV. Transportation,
Assignment and
sequencing
problem.
1.Importance, Statistical basis of SQC
2.Variable control charts
3.Attribute control charts
4.Tolerance limits and specification limits.
5. Numerical application.
1.Producer’s risk & consumer’s risk.
2.AQL and LTPD
3.Single sampling plan
4.Double Sampling plan
5.Reliability.
1.Meaning and scope
2.Formation of LPP
3.Graphical solution to LPP
4.Simplex method, type-I inequalities
5.Big-M-method
1.Transportation balanced problem
2.Transportation-unbalanced problem
3.Assignment problem
4.Sequencing:n jobs-2 machines
5.Sequencing :n jobs-3 machines
1
1
1
1
1
1
1
1
1
1
1
1
1
1
1
1
1
1
1

Code No : 43141
MODEL QUESTION PAPER
Statistics Syllabus
(With Maths Combination)
Common to BA/B.Sc
Paper-IV: Quality, Reliability and Operations Research
Time 3 Hrs Max marks:100
Note: 1.Answer any Ten questions choosing at least one from each unit.
2. Each question caries 10 Marks.
Unit-I
1. What do you understand by statistical quality control? Discuss briefly its need and utility in
industry.
2. Explain in detail the construction of x and R charts. Also write down its applications.
3. Explain the statistical basis and procedure to construct P-Chart. Also explain its application
method.
4. Distinguish between defect and defective. Explain how to construct c-Chart by brining the
statistical basis involved in it.
5. Explain the difference between specification limits, tolerance limits and control limits in
SQC.
Unit-II
6. What do you understand by acceptance sampling plan. State its uses by giving illustrations.
7. Describe single sampling plan and OC, AOQ curve for this plan.
8. Distinguish clearly between (i) Producer’s Risk and consumer’s risks ii) AQL and LTPD.
9. Define double sampling inspection plan. Bring out its merits and demerits over a single
sampling inspection plan.
10. Define reliability. Explain the importance of hazard function in the computation failure
rate.
Unit-III
11. Define linear programming problem. Explain the role of slack, surplus and artificial
variables in solving linear programming problems.
12. A company has three operational departments with capacity to produce three different types
of cloths yielding a profit of Rs.2 Rs.4 and Rs.3 per meter respectively. One meter of
suiting require 3 minutes in weaving 2 minutes in processing and 1 minute in packing. One
meter of woollen requires 3 minutes in each department. In a week, total run time of each
department is 60,40 and 80 hours for weaving, processing packing respectively. Formulate
the above as linear programming problem.
13. Solve the following LPP graphically
Maximize 1 2Z = 4 + 3 x
Subject to the Constraints
1 2
1 2
1 2
1 2
2 x + x = 1000
x + x = 800
x = 400 and x = 700
and x 0x
14. Solve the following LPP simplex method
Maximize. 1 2Z = 4 x + 10 x
Subject to the constraints
1 2
1 2
1 2
1 2
2 x +x 50
2 x + 5 x 100
2 x +3 x 90
x 0 and x 0
15. Use penalty method
Maximize. Z=6x1+4x2.
Subject to the constraints.
1 2
1 2
1 2
1 2
2 x +3 x 30
3 x +2 x 24
x + x 3
x 0 and x 0
Unit - IV
16. Write down in transportation problem in the form of LPP. Explain any one method to find
the IBFS of a transportation problem.
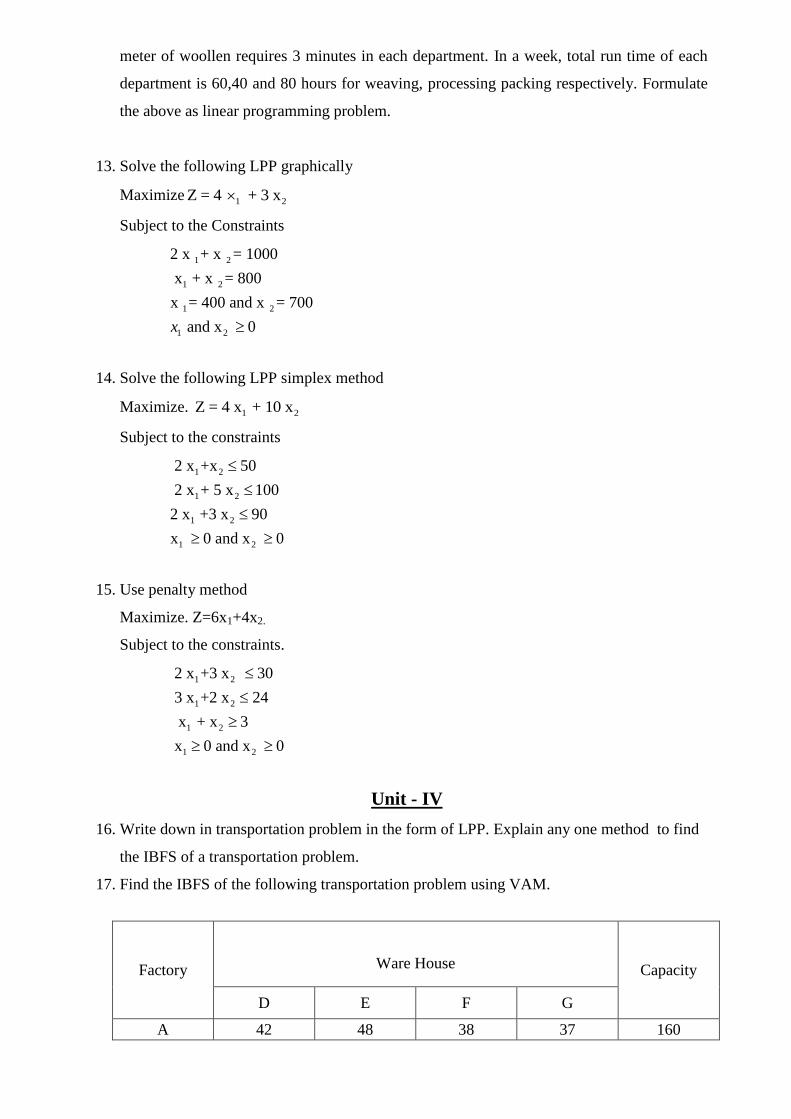
17. Find the IBFS of the following transportation problem using VAM.
Factory
Ware House Capacity
D E F G
A 42 48 38 37 160
B 40 49 52 51 150
C 39 38 40 43 190
Demand 80 90 110 160
18. Solve the following assignment problem using Hungarian algorithm.
8 7 9 10
7 9 9 8
10 8 7 11
10 6 8 7
w x y z
a
b
c
d
19. Define a sequencing problem. Explain the assumptions involved in a sequencing problem.
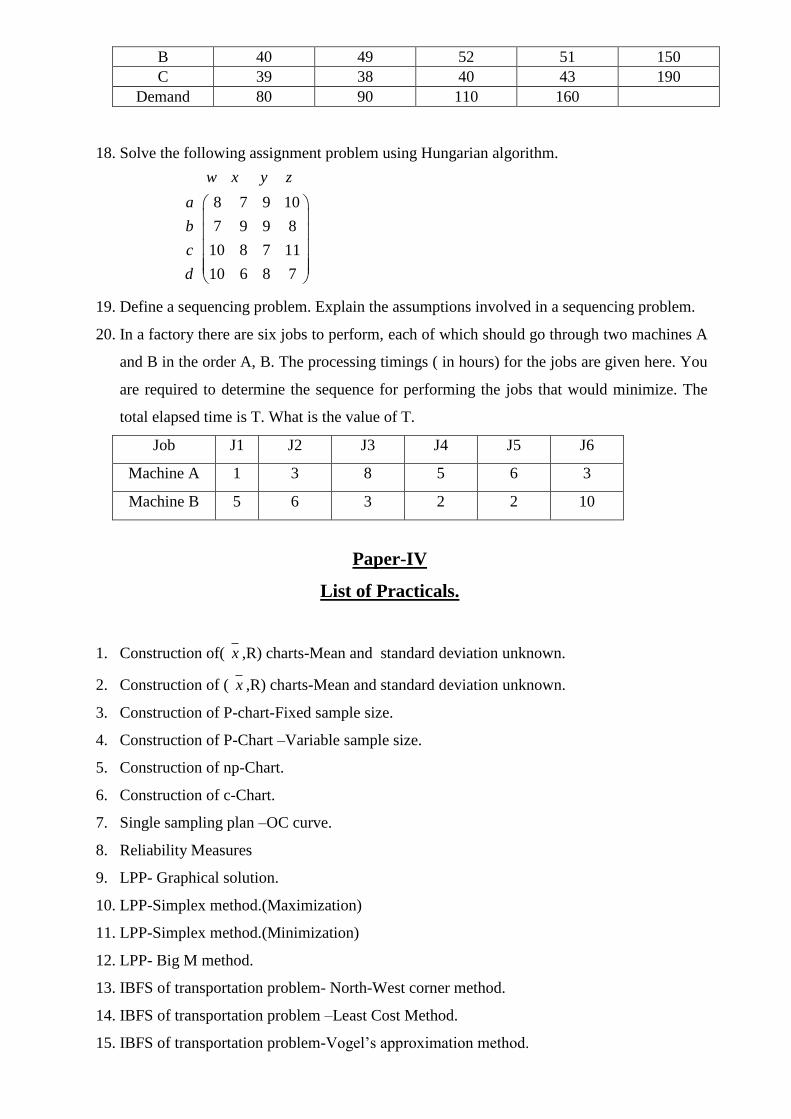
20. In a factory there are six jobs to perform, each of which should go through two machines A
and B in the order A, B. The processing timings ( in hours) for the jobs are given here. You
are required to determine the sequence for performing the jobs that would minimize. The
total elapsed time is T. What is the value of T.
Job J1 J2 J3 J4 J5 J6
Machine A 1 3 8 5 6 3
Machine B 5 6 3 2 2 10
Paper-IV
List of Practicals.
1. Construction of( x ,R) charts-Mean and standard deviation unknown.
2. Construction of ( x ,R) charts-Mean and standard deviation unknown.
3. Construction of P-chart-Fixed sample size.
4. Construction of P-Chart –Variable sample size.
5. Construction of np-Chart.
6. Construction of c-Chart.
7. Single sampling plan –OC curve.
8. Reliability Measures
9. LPP- Graphical solution.
10. LPP-Simplex method.(Maximization)
11. LPP-Simplex method.(Minimization)
12. LPP- Big M method.
13. IBFS of transportation problem- North-West corner method.
14. IBFS of transportation problem –Least Cost Method.
15. IBFS of transportation problem-Vogel’s approximation method.

16. Assignment Problem (Balanced).
17. Assignment Problem (Unbalanced).
18. Travelling sales person problem.
19. n jobs-2 machines sequencing problem.
20. n jobs-3 machine sequencing problem.
Note : The above practical problems may be worked through Ms Excel also
Statistics Practical Examination-IV
Time 3 Hrs Max marks:50
Five questions to be set from the following topics and three to be answered
Record-10 marks; 3x13=39+1(for impression)
Topic No. of questions to be set
SQC 1
OC Curves 1
OR (LPP) 1
Transportation Problem 1
Assessment and Sequencing Problem 1
Total 5


