
Design Flows Overview www.xilinx.com 1 UG888 (v2015.2) June 24, 2015
Vivado Design Suite Tutorial
Design Flows Overview
UG888 (v2015.2) June 24, 2015
Design Flows Overview www.xilinx.com 2 UG888 (v2015.2) June 24, 2015
Revision History The following table shows the revision history for this document.
Date Version Changes
06/24/2015 2015.2 Validated with 2015.2 release. Edited Tcl commands in Step 3: Synthesizing the
Design to allow for copying commands into the Tcl console.
04/01/2015 2015.1 Initial 2015.1, validated with release.
Send Feedback
Design Flows Overview www.xilinx.com 3 UG888 (v2015.2) June 24, 2015
Table of Contents
Revision History ......................................................................................................................................................2
Vivado Design Flows Overview ...................................................................................................................................4
Introduction ............................................................................................................................................................4
Lab 1: Using the Non-Project Design Flow .................................................................................................................8
Introduction ............................................................................................................................................................8
Step 1: Examine the Example Script .......................................................................................................................8
Step 2: Starting Vivado with the Example Design ..................................................................................................8
Step 3: Synthesizing the Design ........................................................................................................................... 10
Step 4: Launching the Vivado IDE ........................................................................................................................ 10
Step 5: Defining Timing Constraints and I/O Planning ........................................................................................ 12
Step 6: Exporting the Modified Constraints ........................................................................................................ 15
Step 7: Implementing the Design ........................................................................................................................ 16
Step 8: Opening a Design Checkpoint ................................................................................................................. 17
Step 9: Analyzing Implementation Results .......................................................................................................... 17
Step 10: Exiting the Vivado Tool .......................................................................................................................... 20
Lab 2: Using the Project Design Flow ...................................................................................................................... 21
Introduction ......................................................................................................................................................... 21
Step 1: Creating a Project ................................................................................................................................... 21
Step 2: Using the Sources Window and Text Editor ............................................................................................ 27
Step 3: Elaborating the RTL Design ...................................................................................................................... 31
Step 4: Using the IP Catalog ................................................................................................................................. 32
Step 5: Running Behavioral Simulation ............................................................................................................... 33
Step 6: Reviewing Design Run Settings ............................................................................................................... 34
Step 7: Synthesizing and Implementing the Design ............................................................................................ 37
Step 8: Analyzing the Synthesized Design ........................................................................................................... 38
Step 9: Analyzing the Implemented Design ......................................................................................................... 41
Step 10: Generating a Bitstream file ................................................................................................................... 43
Conclusion ........................................................................................................................................................... 45
Legal Notices ............................................................................................................................................................ 46
Please Read: Important Legal Notices ................................................................................................................. 46
Send Feedback

Design Flows Overview www.xilinx.com 4 UG888 (v2015.2) June 24, 2015
Vivado Design Flows Overview
IMPORTANT: This tutorial requires the use of the Kintex®-7 family of devices. You will
need to update your Vivado tools installation if you do not have this device family installed.
Refer to the Vivado Design Suite User Guide: Release Notes, Installation, and Licensing
(UG973) for more information on Adding Design Tools or Devices.
Introduction This tutorial introduces the use models and design flows recommended for use with the Xilinx® Vivado®
Integrated Design Environment (IDE). This tutorial describes the basic steps involved in taking a small
example design from RTL to bitstream, using two different design flows as explained below. Both flows
can take advantage of the Vivado IDE, or be run through batch Tcl scripts. The Vivado Tcl API provides
considerable flexibility and power to help set up and run your designs, as well as perform analysis and
debug.
VIDEO: You can also learn more about the Vivado Design Suite design flows by viewing the
quick take video at Vivado Design Flows.
TRAINING: Xilinx provides training courses that can help you learn more about the
concepts presented in this document. Use these links to explore related courses:
Vivado Introductory Workshop
Vivado Design Suite Tool Flow
Essentials of FPGA Design
Working in Project Mode and Non-Project Mode
Some users prefer the design tool for automatically managing their design flow process and design
data, while others prefer to manage sources and process themselves. The Vivado Design Suite uses a
project file ( ) and directory structure to manage the design source files, store the results of
different synthesis and implementation runs, and track the project status through the design flow. This
automated management of the design data, process and status requires a project infrastructure. For this
reason, Xilinx refers to this flow as the Project Mode.
Other users prefer to run the FPGA design process more like a source file compilation, to simply
compile the sources, implement the design, and report the results. This compilation style flow is
Send Feedback

Vivado Design Flows Overview
Design Flows Overview www.xilinx.com 5 UG888 (v2015.2) June 24, 2015
referred to as the Non-Project mode. The Vivado Design Suite easily accommodates both of these use
models.
Both of these flows utilize a project structure to compile and manage the design. The main distinctions
are that Non-Project mode processes the entire design in memory. No files are written to disk. While
Project mode creates and maintains a project directory structure on disk to manage design sources,
results, and project settings and status.
The following provides a brief overview of Project mode and Non-Project mode. For a more complete
description of these design modes, and the features and benefits of each, refer to the Vivado Design
Suite User Guide: Design Flows Overview (UG892).
Non-Project Mode
This use model is for script-based users who do not want Vivado tools to manage their design data or
track their design state. The Vivado tools simply read the various source files and compile the design
through the entire flow in-memory. At any stage of the implementation process, you can generate a
variety of reports, run design rule checks (DRCs), and write design checkpoints. Throughout the entire
flow, you can open the design in-memory, or any saved design checkpoint, in the Vivado IDE for design
analysis or netlist/constraint modification. Source files, however, are not available for modification in the
IDE when running the Non-Project mode. It is also important to note that this mode does not enable
project-based features such as source file and run management, cross-probing back to source files,
design state reporting, etc. Essentially, each time a source file is updated on the disk; you must know
about it and reload the design.
There are no default reports or intermediate files created within the Non-Project mode. You must direct
the creation of reports or design checkpoints with Tcl commands.
Project Mode
This use model is for users who want the Vivado tools to manage the entire design process, including
features like source file, constraint and results management, integrated IP design, and cross probing
back to sources. In Project mode, the Vivado tools create a directory to manage the design source files,
IP data, synthesis and implementation run results and related reports. The Vivado Design Suite manages
and reports the status of the source files, configuration, and the state of the design. You can create and
configure multiple runs to explore constraint or command options. In the Vivado IDE, you can cross-
probe implementation results back to the RTL source files. You can also script the entire flow with Tcl
commands, and open Vivado IDE as needed.
Using Tcl Commands
The Tcl commands and scripting approach vary depending on the design flow used. When using the
Non-Project mode, the source files are loaded using read_verilog, read_vhdl, read_edif,
read_ip, and read_xdc commands. The Vivado Design Suite creates an in-memory design database
to pass to synthesis, simulation, and implementation. When using Project mode, you can use the
create_project, add_files, import_files, and add_directories commands to create the
Send Feedback

Vivado Design Flows Overview
Design Flows Overview www.xilinx.com 6 UG888 (v2015.2) June 24, 2015
project infrastructure needed to manage source files and track design status. Replace the individual
“atomic” commands, synth_design, opt_design, place_design, route_design, and
write_bitstream in the Batch flow, with an all-inclusive command called launch_runs. The
launch_runs command groups the atomic commands together with other commands to generate
default reports and track the run status. The resulting Tcl run scripts for the Project mode are different
from the Non-Project mode. This tutorial covers the Project mode and Non-Project mode, as well as the
Vivado IDE.
Many of the analysis features discussed in this tutorial are covered in more detail in other tutorials. Not
every command or command option is represented here. To view the entire list of Tcl commands
provided in the tools, consult the Vivado Design Suite Tcl Command Reference Guide (UG835).
This tutorial contains two labs that can be performed independently.
Lab 1: Using the Non-Project Design Flow
Walk through a sample run script to implement the bft design.
View various reports at each step.
Review the vivado.log file.
Write design checkpoints.
Open the Vivado IDE after synthesis to review timing constraint definition and I/O planning and
demonstrate methods to update constraints.
Open the implemented Design Checkpoint to analyze timing, power, utilization and routing.
Lab 2: Using the Project Based Design Flow
Create a new project.
Walk through implementing the bft design using the Vivado IDE.
View various reports at each step.
Open the synthesized design and review timing constraint definition, I/O planning and design
analysis.
Open the implemented design to analyze timing, power, resource utilization, routing, and cross-
probing.
Tutorial Design Description
The sample design used throughout this tutorial consists of a small design called bft. There are several
VHDL and Verilog source files in the bft design, as well as a XDC constraints file.
The design targets an xc7k70T device. A small design is used to allow the tutorial to be run with
minimal hardware requirements and to enable timely completion of the tutorial, as well as to minimize
the data size.
Send Feedback

Vivado Design Flows Overview
Design Flows Overview www.xilinx.com 7 UG888 (v2015.2) June 24, 2015
Hardware and Software Requirements
This tutorial requires that the 2015.2 Vivado Design Suite software release or later is installed. The
following partial list describes the operating systems that the Vivado Design Suite supports on x86 and
x86-64 processor architectures:
See the Vivado Design Suite User Guide: Release Notes, Installation, and Licensing (UG973) for a
complete list and description of the system and software requirements.
Preparing the Tutorial Design Files
You can find the files for this tutorial in the Vivado Design Suite examples directory at the following
location:
<Vivado_install_area>/Vivado/<version>/examples/Vivado_Tutorial
You can also extract the provided ZIP file, at any time, to write the tutorial files to your local directory, or
to restore the files to their starting condition.
Extract the ZIP file contents from the software installation into any write-accessible location.
<Vivado_install_area>/Vivado/<version>/examples/Vivado_Tutorial.zip
The extracted Vivado_Tutorial directory is referred to as the <Extract_Dir> in this Tutorial.
Note: You will modify the tutorial design data while working through this tutorial. You should use a
new copy of the original Vivado_Tutorial directory each time you start this tutorial.
Send Feedback

Design Flows Overview www.xilinx.com 8 UG888 (v2015.2) June 24, 2015
Lab 1: Using the Non-Project Design Flow
Introduction This lab focuses on Non-Project mode and the associated Tcl commands.
Step 1: Examine the Example Script 1. Open the example script:
<Extract_Dir>/Vivado_Tutorial/create_bft_kintex7_batch.tcl, in a text editor and
review the different steps.
STEP#0: Define output directory location.
STEP#1: Setup design sources and constraints.
STEP#2: Run synthesis, report utilization and timing estimates, write checkpoint
design.
STEP#3: Run placement and logic optimization, report utilization and timing
estimates, write checkpoint design.
STEP#4: Run router, report actual utilization and timing, write checkpoint
design, run drc, write verilog and xdc out.
STEP#5: Generate a bitstream.
Notice that many of the Tcl commands are commented out. You will run them manually, one at a
time.
2. Leave the example script open, as you will copy and paste commands from it later in this tutorial.
Step 2: Starting Vivado with the Example Design
On Linux
1. Change to the directory where the lab materials are stored:
cd <Extract_Dir>/Vivado_Tutorial
2. Launch the Vivado Design Suite Tcl shell, and source a Tcl script to create the tutorial design:
vivado -mode tcl -source create_bft_kintex7_batch.tcl
On Windows
1. Launch the Vivado Design Suite Tcl shell:
Start > All Programs > Xilinx Design Tools > Vivado 2015.x >
Vivado 2015.x Tcl Shell
Send Feedback

Lab 1: Using the Non-Project Design Flow
Design Flows Overview www.xilinx.com 9 UG888 (v2015.2) June 24, 2015
Note: Your Vivado Design Suite installation may be called something other than Xilinx Design
Tools on the Start menu.
2. In the Tcl shell, change to the directory where the lab materials are stored:
Vivado% cd <Extract_Dir>/Vivado_Tutorial
3. Source a Tcl script to create the tutorial design:
Vivado% source create_bft_kintex7_batch.tcl
After the sourced script has completed, the Vivado Design Suite Tcl shell, hereafter called the Tcl
shell, displays the Tcl prompt: Vivado%
Figure 1: Start Vivado and Source Tcl Script
You can enter additional Tcl commands from the Tcl prompt.
Send Feedback
Lab 1: Using the Non-Project Design Flow
Design Flows Overview www.xilinx.com 10 UG888 (v2015.2) June 24, 2015
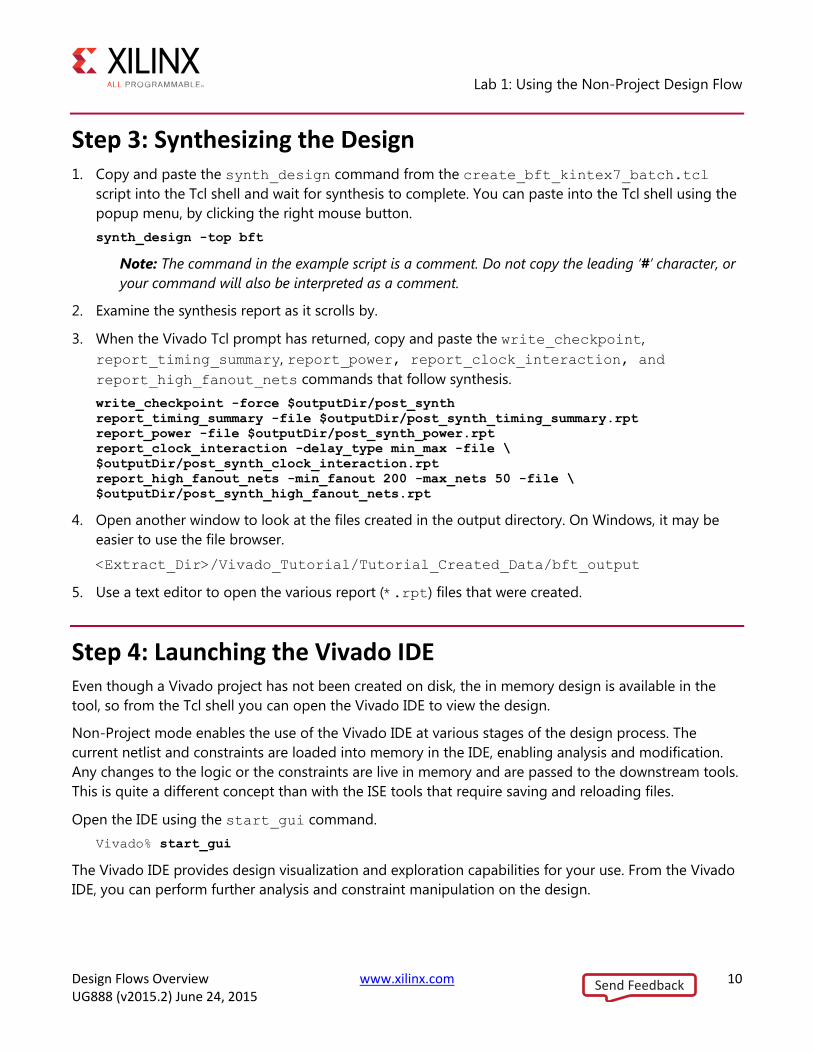
Step 3: Synthesizing the Design 1. Copy and paste the synth_design command from the create_bft_kintex7_batch.tcl
script into the Tcl shell and wait for synthesis to complete. You can paste into the Tcl shell using the
popup menu, by clicking the right mouse button.
synth_design -top bft
Note: The command in the example script is a comment. Do not copy the leading ‘#’ character, or
your command will also be interpreted as a comment.
2. Examine the synthesis report as it scrolls by.
3. When the Vivado Tcl prompt has returned, copy and paste the write_checkpoint,
report_timing_summary, report_power, report_clock_interaction, and
report_high_fanout_nets commands that follow synthesis.
write_checkpoint -force $outputDir/post_synth
report_timing_summary -file $outputDir/post_synth_timing_summary.rpt
report_power -file $outputDir/post_synth_power.rpt
report_clock_interaction -delay_type min_max -file \
$outputDir/post_synth_clock_interaction.rpt
report_high_fanout_nets -min_fanout 200 -max_nets 50 -file \
$outputDir/post_synth_high_fanout_nets.rpt
4. Open another window to look at the files created in the output directory. On Windows, it may be
easier to use the file browser.
<Extract_Dir>/Vivado_Tutorial/Tutorial_Created_Data/bft_output
5. Use a text editor to open the various report (*.rpt) files that were created.
Step 4: Launching the Vivado IDE Even though a Vivado project has not been created on disk, the in memory design is available in the
tool, so from the Tcl shell you can open the Vivado IDE to view the design.
Non-Project mode enables the use of the Vivado IDE at various stages of the design process. The
current netlist and constraints are loaded into memory in the IDE, enabling analysis and modification.
Any changes to the logic or the constraints are live in memory and are passed to the downstream tools.
This is quite a different concept than with the ISE tools that require saving and reloading files.
Open the IDE using the start_gui command.
Vivado% start_gui
The Vivado IDE provides design visualization and exploration capabilities for your use. From the Vivado
IDE, you can perform further analysis and constraint manipulation on the design.
Send Feedback

Lab 1: Using the Non-Project Design Flow
Design Flows Overview www.xilinx.com 11 UG888 (v2015.2) June 24, 2015
Figure 2: Vivado IDE - Non-Project Mode
TIP: To stop the GUI and return to the Vivado Design Suite Tcl shell, use the stop_gui
command. If you use the File > Exit command from the Vivado IDE, you will completely
exit the Vivado tool.
Since the design does not have a project in Non-Project mode, the Vivado IDE does not enable source
file or run management. You are effectively analyzing the current in memory design. The Vivado Flow
Navigator and other project based commands are also not available in Non-Project mode.
Send Feedback
Lab 1: Using the Non-Project Design Flow
Design Flows Overview www.xilinx.com 12 UG888 (v2015.2) June 24, 2015
Step 5: Defining Timing Constraints and I/O Planning You must often define timing and physical constraints for the design prior to implementation. The
Vivado tools let you load constraints from constraints file(s), or enter constraints interactively using the
IDE.
Defining Timing Constraints
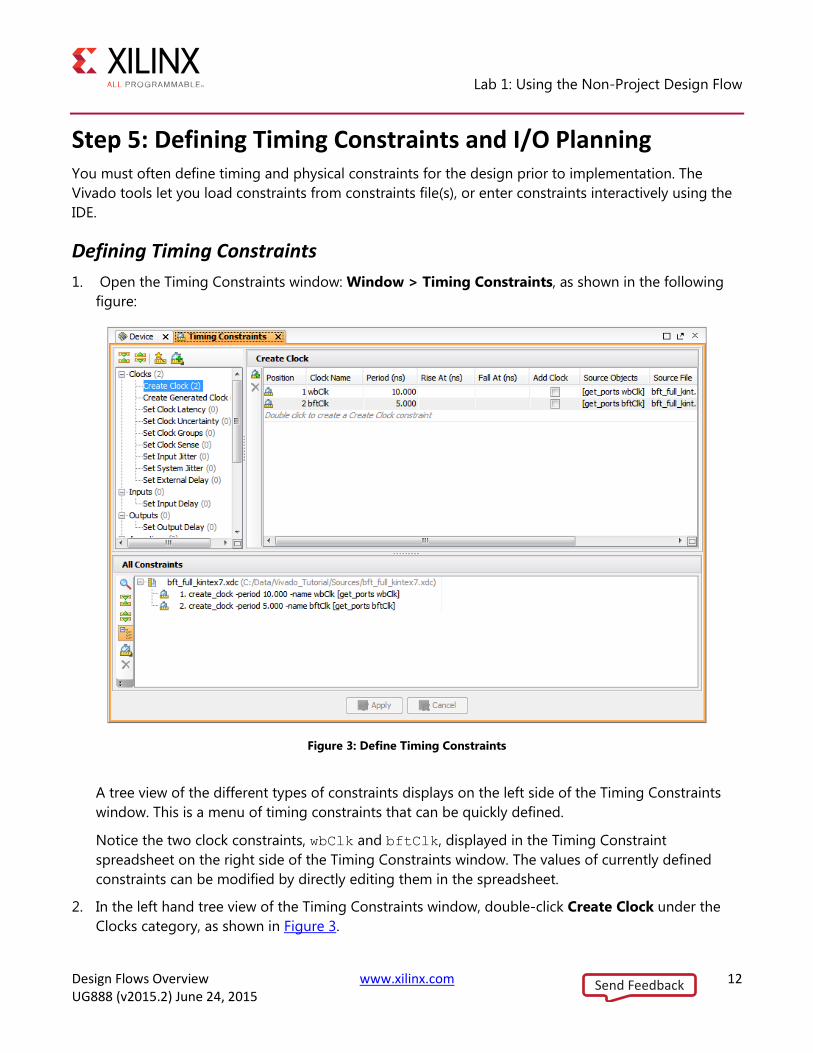
1. Open the Timing Constraints window: Window > Timing Constraints, as shown in the following
figure:
Figure 3: Define Timing Constraints
A tree view of the different types of constraints displays on the left side of the Timing Constraints
window. This is a menu of timing constraints that can be quickly defined.
Notice the two clock constraints, wbClk and bftClk, displayed in the Timing Constraint
spreadsheet on the right side of the Timing Constraints window. The values of currently defined
constraints can be modified by directly editing them in the spreadsheet.
2. In the left hand tree view of the Timing Constraints window, double-click Create Clock under the
Clocks category, as shown in Figure 3.
Send Feedback
Lab 1: Using the Non-Project Design Flow
Design Flows Overview www.xilinx.com 13 UG888 (v2015.2) June 24, 2015
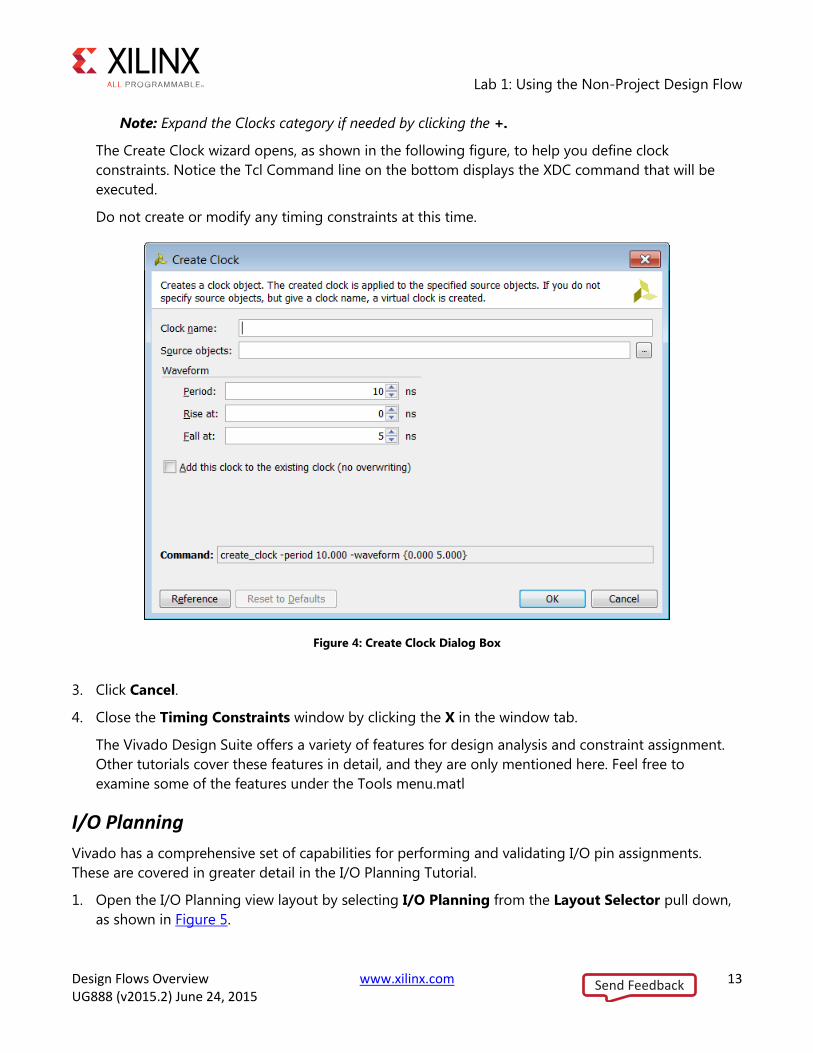
Note: Expand the Clocks category if needed by clicking the +.
The Create Clock wizard opens, as shown in the following figure, to help you define clock
constraints. Notice the Tcl Command line on the bottom displays the XDC command that will be
executed.
Do not create or modify any timing constraints at this time.
Figure 4: Create Clock Dialog Box
3. Click Cancel.
4. Close the Timing Constraints window by clicking the X in the window tab.
The Vivado Design Suite offers a variety of features for design analysis and constraint assignment.
Other tutorials cover these features in detail, and they are only mentioned here. Feel free to
examine some of the features under the Tools menu.matl
I/O Planning
Vivado has a comprehensive set of capabilities for performing and validating I/O pin assignments.
These are covered in greater detail in the I/O Planning Tutorial.
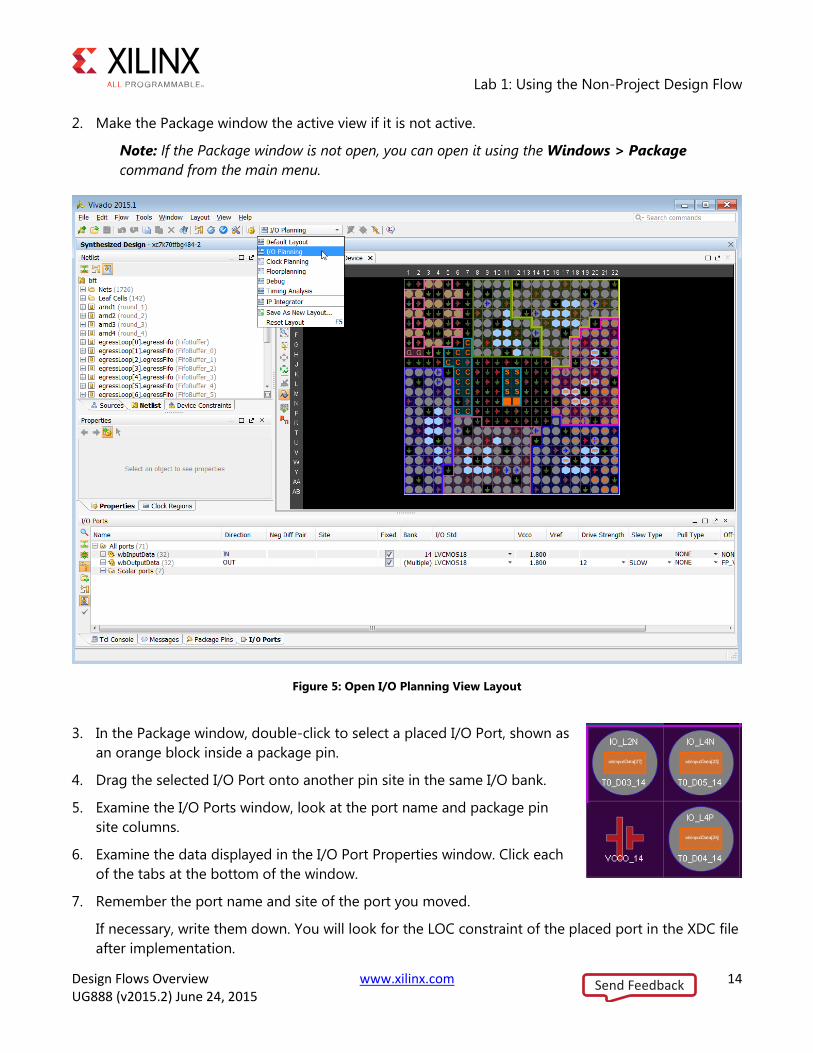
1. Open the I/O Planning view layout by selecting I/O Planning from the Layout Selector pull down,
as shown in Figure 5.
Send Feedback
Lab 1: Using the Non-Project Design Flow
Design Flows Overview www.xilinx.com 14 UG888 (v2015.2) June 24, 2015
2. Make the Package window the active view if it is not active.
Note: If the Package window is not open, you can open it using the Windows > Package
command from the main menu.
Figure 5: Open I/O Planning View Layout
3. In the Package window, double-click to select a placed I/O Port, shown as
an orange block inside a package pin.
4. Drag the selected I/O Port onto another pin site in the same I/O bank.
5. Examine the I/O Ports window, look at the port name and package pin
site columns.
6. Examine the data displayed in the I/O Port Properties window. Click each
of the tabs at the bottom of the window.
7. Remember the port name and site of the port you moved.
If necessary, write them down. You will look for the LOC constraint of the placed port in the XDC file
after implementation.
Send Feedback

Lab 1: Using the Non-Project Design Flow
Design Flows Overview www.xilinx.com 15 UG888 (v2015.2) June 24, 2015
Step 6: Exporting the Modified Constraints Modified constraints can be output for later use. You can also save design checkpoints that include
the latest changes. You will explore design checkpoints later in this tutorial.
IMPORTANT: The Vivado Design Suite does not support NCF/UCF constraints. You
should migrate existing UCF constraints to XDC format. Refer to the ISE to Vivado
Design Suite Migration Guide (UG911) for more information.
1. Use the Export Constraints command to output a modified XDC constraints file with the new I/O
LOC constraint value.
File > Export > Export Constraints
The Export Constraints dialog box opens to let you specify a file name to create, as shown in the
following figure.
Figure 6: Export Constraints
2. Enter a name and location for the file and click OK.
Notice the checkbox for Include unconstrained placement locations. When this is enabled, LOC
constraints of all placed cells are exported, rather than of only fixed cells. For a more detailed
description of fixed versus unfixed cells, refer to the Vivado Design Suite User Guide: Design
Analysis and Closure Techniques (UG906).
3. Use the File > Open File command to open the constraints file in the Text Editor.
4. Browse to select the newly exported constraints file and click OK.
5. Notice the file reflects the I/O Port placement change you made earlier.
You can open any ASCII file in the Text Editor. This is helpful for editing Tcl scripts and constraints
files, and viewing reports. The Text Editor is context sensitive, and highlights keywords and
comments when displaying file types such as Verilog, VHDL, XDC, and Tcl.
6. Select the Tcl Console tab at the bottom of the IDE, and enter the stop_gui command.
The Vivado IDE closes, and you are returned to the Tcl prompt in the Tcl shell.
Send Feedback
Lab 1: Using the Non-Project Design Flow
Design Flows Overview www.xilinx.com 16 UG888 (v2015.2) June 24, 2015
Step 7: Implementing the Design 1. Open the create_bft_kintex7_batch.tcl script, or bring the script window to the front.
2. Individually copy and paste the Tcl commands in the script, in order from opt_design to
write_bitstream:
opt_design
place_design
phys_opt_design
write_checkpoint -force $outputDir/post_place
report_timing_summary -file $outputDir/post_place_timing_summary.rpt
route_design
write_checkpoint -force $outputDir/post_route
report_timing_summary -file $outputDir/post_route_timing_summary.rpt
report_timing -sort_by group -max_paths 100 -path_type summary –file \
$outputDir/post_route_timing.rpt
report_clock_utilization -file $outputDir/clock_util.rpt
report_utilization -file $outputDir/post_route_util.rpt
report_power -file $outputDir/post_route_power.rpt
report_drc -file $outputDir/post_imp_drc.rpt
write_verilog -force $outputDir/bft_impl_netlist.v
write_xdc -no_fixed_only -force $outputDir/bft_impl.xdc
write_bitstream -force $outputDir/bft.bit
3. Examine each command and notice the various messages produced as the commands are run.
4. Close the text editor displaying the create_bft_kintex7_batch.tcl script.
5. Examine the files created in the output directory.
<Extract_Dir>/Vivado_Tutorial/Tutorial_Created_Data/bft_output
6. Use a text editor to open the various report (*.rpt) files that were created.
7. Open the bft_impl.xdc file.
8. Validate that the design has been implemented with the I/O Port constraint that you modified
earlier.
Send Feedback
Lab 1: Using the Non-Project Design Flow
Design Flows Overview www.xilinx.com 17 UG888 (v2015.2) June 24, 2015
Step 8: Opening a Design Checkpoint The Vivado IDE can open any saved design checkpoint. This snapshot of the design can be opened in
the Vivado IDE or Tcl shell for synthesis, implementation, and analysis.
1. Open the Vivado IDE again: start_gui
This loads the active design in-memory into the IDE.
You will now load the implemented design checkpoint, closing the current in-memory design.
2. Open the implemented checkpoint.
Use File > Open Checkpoint and browse to select the checkpoint file:
<Extract_Dir>/Vivado_Tutorial/Tutorial_Created_Data/bft_output/
post_route.dcp
3. If prompted, select Close Without Saving to close the current in-memory design.
Now you can use the visualization and analysis capabilities of the IDE, working from a placed and
routed design checkpoint.
Step 9: Analyzing Implementation Results Vivado has an extensive set of features to examine the design and device data from a number of
perspectives. You can generate standard reports for power, timing, utilization, clocks, etc. With the Tcl
API, the custom reporting capabilities in the Vivado tools are extensive.
1. Click on the Device window tab to bring it front to the screen.
2. Run the report_timing_summary command to analyze timing data.
Tools > Timing > Report Timing Summary
3. In the Report Timing Summary dialog, click OK to accept the default run options.
Examine the information available in the Timing Summary window. Select the various categories
from the tree on the left side of the Timing Summary window and examine the data displayed.
4. Now run the report_timing command to perform timing analysis
Tools > Timing > Report Timing
5. In the Report Timing dialog, click OK to accept the default run options.
6. Collapse the bftClk tree in the Timing Checks – Setup window.
7. Select the first path listed under the wbClk in the Setup area.
8. Maximize or float the Path Properties window to look at the path details.
Send Feedback

Lab 1: Using the Non-Project Design Flow
Design Flows Overview www.xilinx.com 18 UG888 (v2015.2) June 24, 2015
Figure 7: Float the Path Properties Window
9. Restore the Path Properties window by clicking the Restore button, or the Dock button, in the
window banner.
10. In the Timing – Report Timing window, right-click to open the popup menu and select the
Schematic command to open a Schematic window for the selected path.
Note: Alternatively, you can press the F4 function key to open the Schematic window.
11. Double-click on a schematic object, such as on a cell, pin, or wire, to expand the schematic
connections and traverse the design hierarchy.
12. Close the Schematic window, or click the Device window tab to bring it to the front.
13. In the Device window, check to ensure that the Routing Resources button is enabled to display
the detailed device routing.
Notice the Device window displays and highlights the routing for the selected path.
Send Feedback
Lab 1: Using the Non-Project Design Flow
Design Flows Overview www.xilinx.com 19 UG888 (v2015.2) June 24, 2015
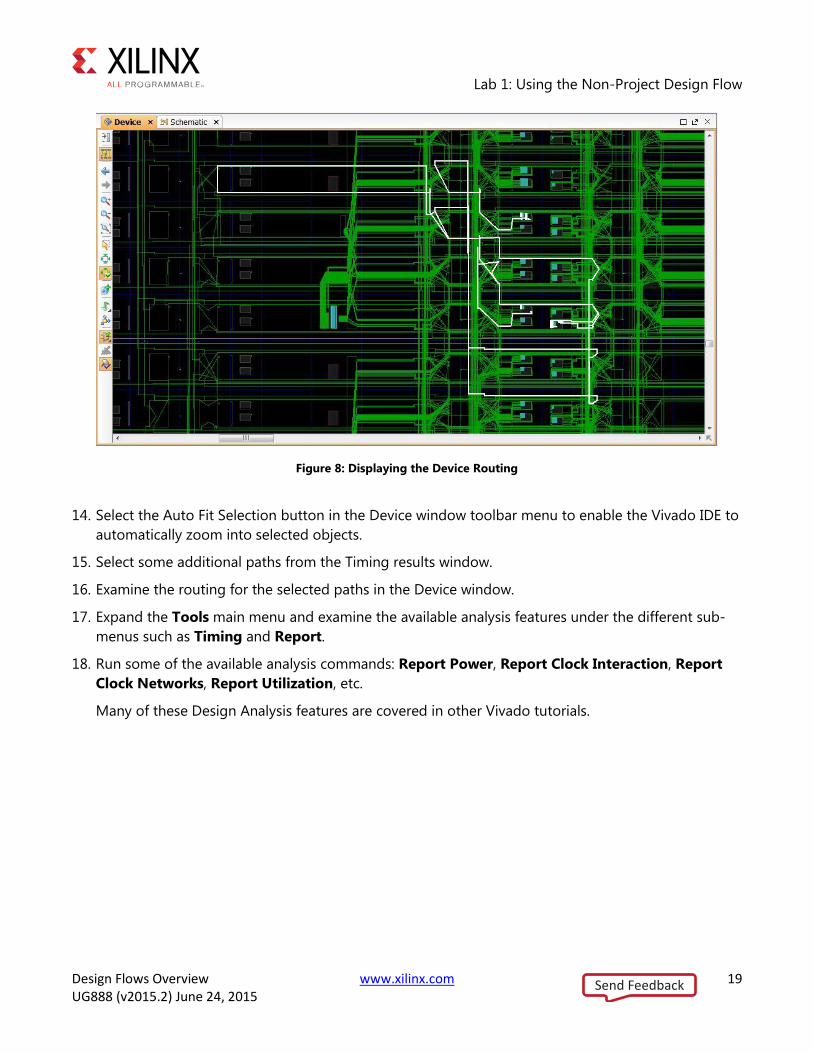
Figure 8: Displaying the Device Routing
14. Select the Auto Fit Selection button in the Device window toolbar menu to enable the Vivado IDE to
automatically zoom into selected objects.
15. Select some additional paths from the Timing results window.
16. Examine the routing for the selected paths in the Device window.
17. Expand the Tools main menu and examine the available analysis features under the different sub-
menus such as Timing and Report.
18. Run some of the available analysis commands: Report Power, Report Clock Interaction, Report
Clock Networks, Report Utilization, etc.
Many of these Design Analysis features are covered in other Vivado tutorials.
Send Feedback
Lab 1: Using the Non-Project Design Flow
Design Flows Overview www.xilinx.com 20 UG888 (v2015.2) June 24, 2015
Step 10: Exiting the Vivado Tool The Vivado tool writes a log file, called vivado.log, and a journal file called vivado.jou into the
directory from which Vivado was launched. The log file is a record of the Tcl commands run during the
design session, and the messages returned by the tool as a result of those commands. The journal is a
record of the Tcl commands run during the session that can be used as a starting point to create new
Tcl scripts.
Exit the Vivado IDE:
1. Select the Tcl Console window tab and type the following:
stop_gui
2. Exit Vivado:
Vivado% exit
3. Examine the Vivado log (vivado.log) file.
On Windows, it may be easier to use the file browser to locate and open the log file. The location of
the Vivado log and journal file will be the directory from which the Vivado tool was launched, or can
be separately configured in the Windows desktop icon. You will configure this in Lab #2.
In this case, look for the log file at the following location:
<Extract_Dir>/Vivado_Tutorial/vivado.log
Note: The vivado.log and vivado.jou may also be written to
%APPDATA%\Xilinx\Vivado, or to your /home directory.
Notice the log file contains the history and results of all Tcl commands executed during the Vivado
session.
4. Examine the Vivado journal (vivado.jou) file.
On Windows, it may be easier to use the file browser. Look for the journal file at the following
location:
<Extract_Dir>/Vivado_Tutorial/vivado.jou
Notice the journal file contains only the Tcl commands executed during the Vivado session, without
the added details recorded in the log file. The journal file is often helpful when creating Tcl scripts
from prior design sessions, as you will see in the next lab.
Send Feedback
Design Flows Overview www.xilinx.com 21 UG888 (v2015.2) June 24, 2015
Lab 2: Using the Project Design Flow
Introduction In this lab, you will learn about the Project mode features for project creation, source file management,
design analysis, constraint definition, and synthesis and implementation run management.
You will walk through the entire FPGA design flow using an example design, starting in the Vivado IDE.
Then you will examine some of the major features in the IDE. Most of these features are covered in
detail in other tutorials. Finally, you will create a batch run script to implement the design project and
see how easy it is to switch between running Tcl scripts and working in the Vivado IDE.
Step 1: Creating a Project
Launching Vivado
On Linux
1. Change to the directory where the lab materials are stored:
cd <Extract_Dir>/Vivado_Tutorial
2. Launch the Vivado IDE:
vivado
On Windows
1. Before clicking the desktop icon to launch the Vivado tool, configure the icon to indicate where to
write the vivado.log and vivado.jou files.
2. Right-click the Vivado 2015.x Desktop icon and select Properties from the popup menu.
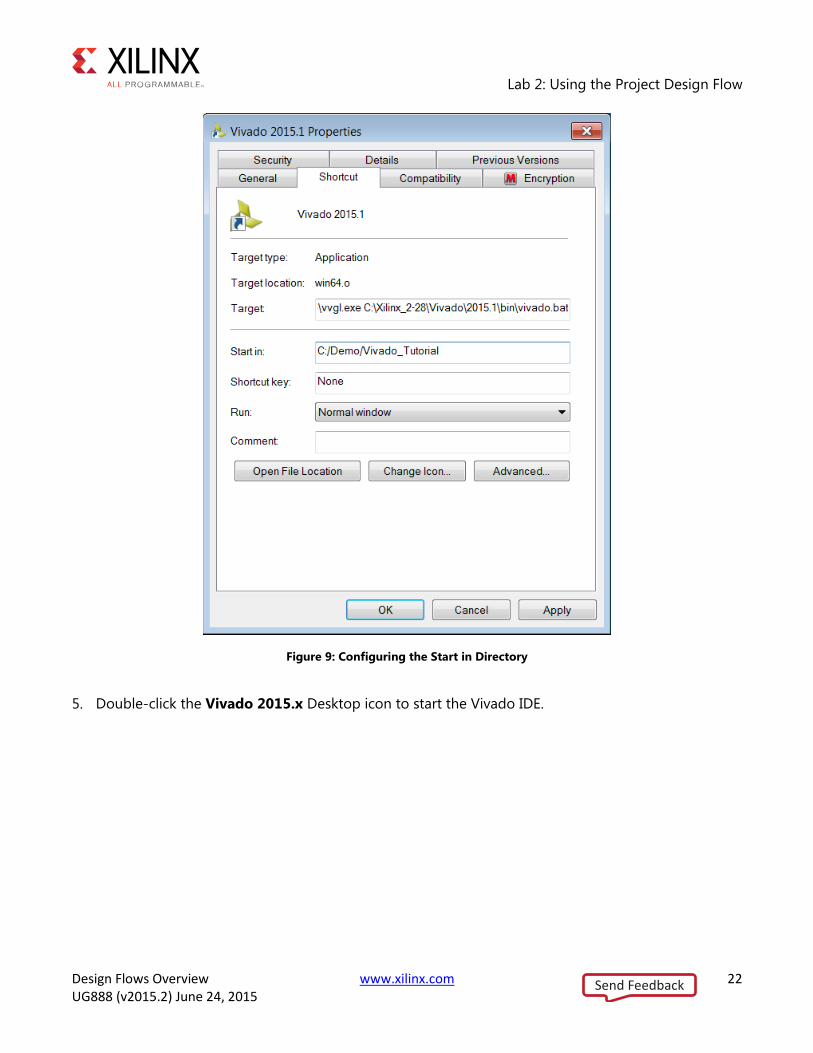
3. Under the Shortcut tab, set the Start in value to the extracted Vivado Tutorial directory, as shown
in Figure 9:
<Extract_Dir>/Vivado_Tutorial/
4. Click OK to close the Properties dialog box.
Send Feedback
Lab 2: Using the Project Design Flow
Design Flows Overview www.xilinx.com 22 UG888 (v2015.2) June 24, 2015
Figure 9: Configuring the Start in Directory
5. Double-click the Vivado 2015.x Desktop icon to start the Vivado IDE.
Send Feedback

Lab 2: Using the Project Design Flow
Design Flows Overview www.xilinx.com 23 UG888 (v2015.2) June 24, 2015
Creating a New Project
1. After Vivado opens, select Create New Project on the Getting Started page.
2. Click Next in the New Project wizard.
3. Specify the Project Name and Location:
a. Project name: project_bft
b. Project Location: <Extract_Dir>/Vivado_Tutorial/Tutorial_Created_Data
4. Click Next.
Figure 10: Create New Project
5. Select RTL Project as the Project Type and click Next.
6. Click the button and select Add Files.
a. Browse to <Extract_Dir>/Vivado_Tutorial/Sources/hdl/
b. Press and hold the Ctrl key, and click to select the following files:
async_fifo.v, bft.vhdl, bft_tb.v, FifoBuffer.v
c. Click OK to close the File Browser.
7. Click the button and select Add Directories.
a. Select the <Extract_Dir>/Vivado_Tutorial/Sources/hdl/bftLib directory
b. Click Select.
Send Feedback
Lab 2: Using the Project Design Flow
Design Flows Overview www.xilinx.com 24 UG888 (v2015.2) June 24, 2015
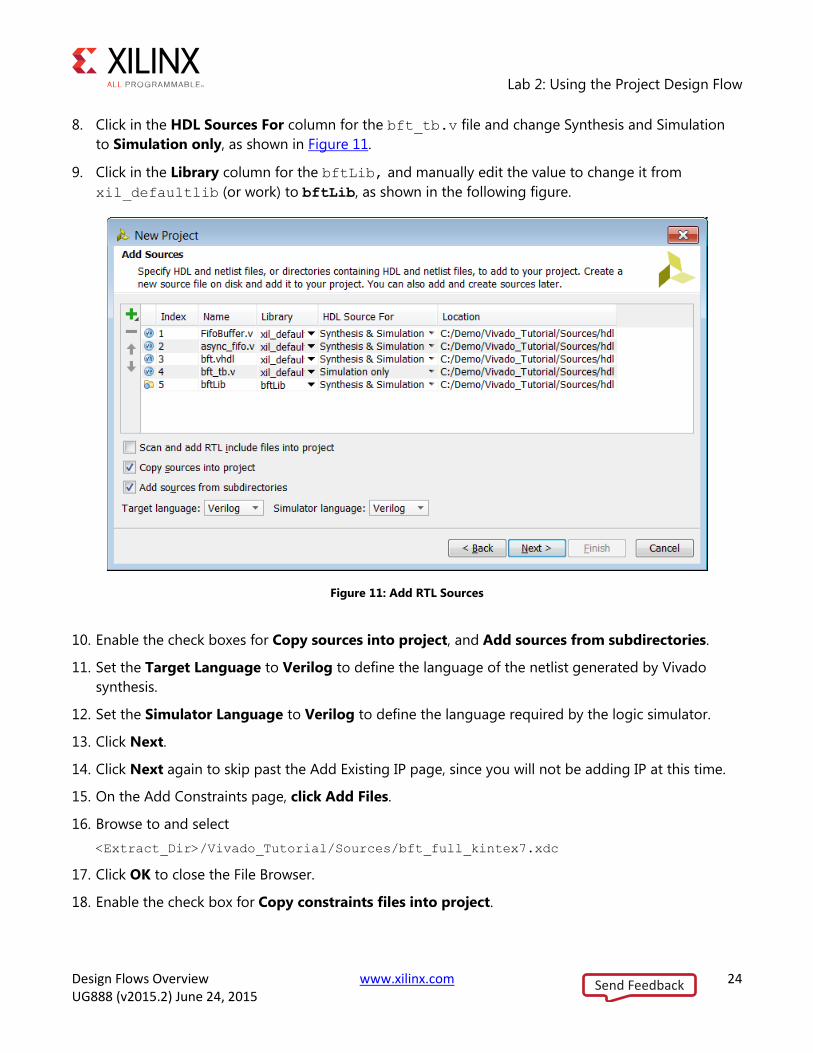
8. Click in the HDL Sources For column for the bft_tb.v file and change Synthesis and Simulation
to Simulation only, as shown in Figure 11.
9. Click in the Library column for the bftLib, and manually edit the value to change it from
xil_defaultlib (or work) to bftLib, as shown in the following figure.
Figure 11: Add RTL Sources
10. Enable the check boxes for Copy sources into project, and Add sources from subdirectories.
11. Set the Target Language to Verilog to define the language of the netlist generated by Vivado
synthesis.
12. Set the Simulator Language to Verilog to define the language required by the logic simulator.
13. Click Next.
14. Click Next again to skip past the Add Existing IP page, since you will not be adding IP at this time.
15. On the Add Constraints page, click Add Files.
16. Browse to and select
<Extract_Dir>/Vivado_Tutorial/Sources/bft_full_kintex7.xdc
17. Click OK to close the File Browser.
18. Enable the check box for Copy constraints files into project.
Send Feedback
Lab 2: Using the Project Design Flow
Design Flows Overview www.xilinx.com 25 UG888 (v2015.2) June 24, 2015
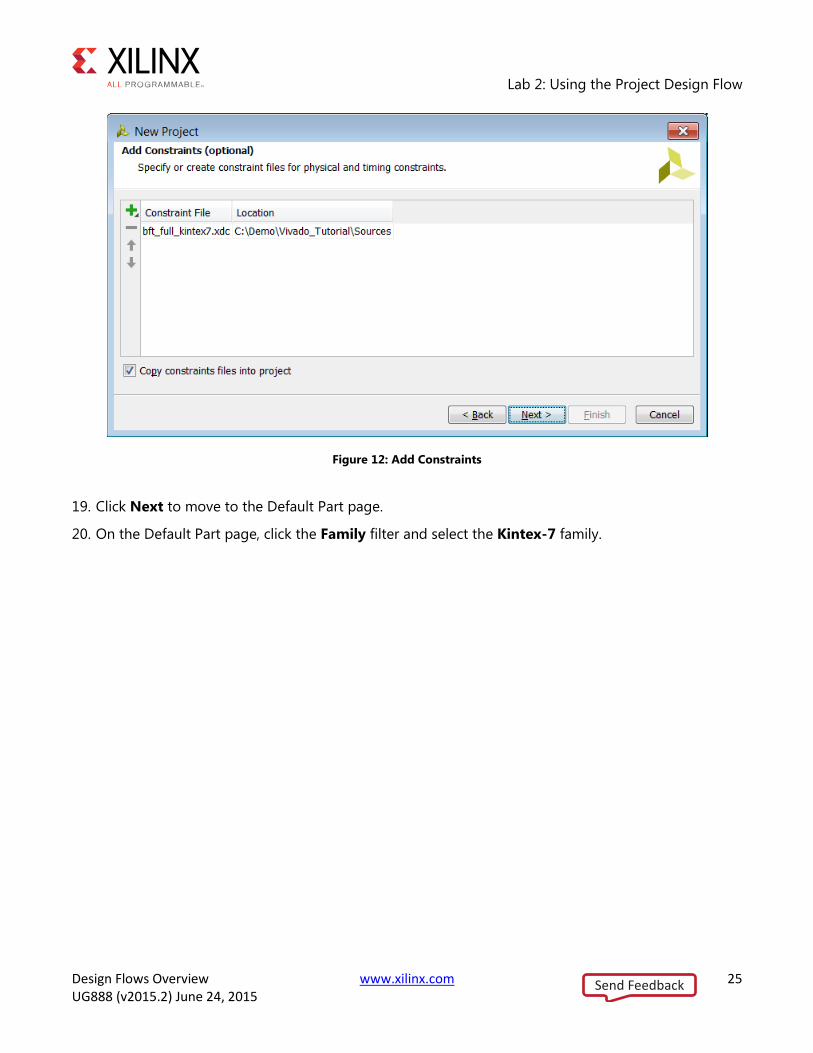
Figure 12: Add Constraints
19. Click Next to move to the Default Part page.
20. On the Default Part page, click the Family filter and select the Kintex-7 family.
Send Feedback

Lab 2: Using the Project Design Flow
Design Flows Overview www.xilinx.com 26 UG888 (v2015.2) June 24, 2015
21. Scroll to the top of the list and select the xc7k70tfbg484-2 part, and click Next.
Figure 13: Selecting the Default Part
22. Click Finish to close the New Project Summary page, and create the project.
Send Feedback
Lab 2: Using the Project Design Flow
Design Flows Overview www.xilinx.com 27 UG888 (v2015.2) June 24, 2015
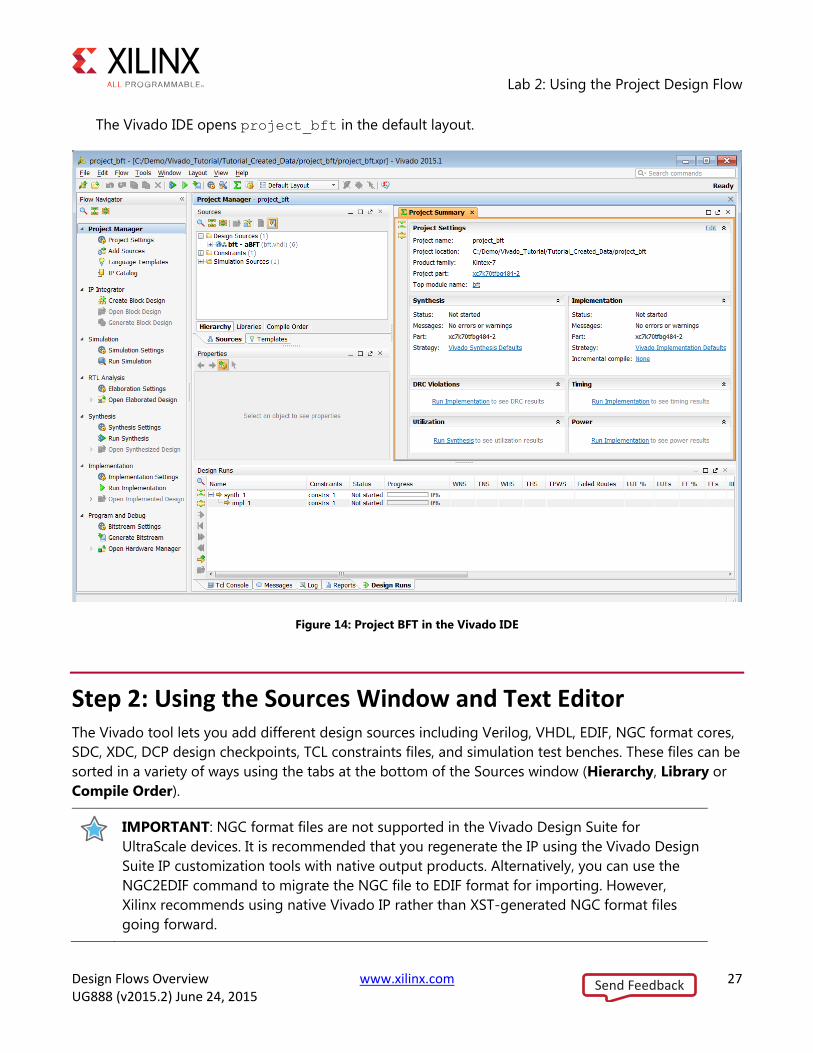
The Vivado IDE opens project_bft in the default layout.
Figure 14: Project BFT in the Vivado IDE
Step 2: Using the Sources Window and Text Editor The Vivado tool lets you add different design sources including Verilog, VHDL, EDIF, NGC format cores,
SDC, XDC, DCP design checkpoints, TCL constraints files, and simulation test benches. These files can be
sorted in a variety of ways using the tabs at the bottom of the Sources window (Hierarchy, Library or
Compile Order).
IMPORTANT: NGC format files are not supported in the Vivado Design Suite for
UltraScale devices. It is recommended that you regenerate the IP using the Vivado Design
Suite IP customization tools with native output products. Alternatively, you can use the
NGC2EDIF command to migrate the NGC file to EDIF format for importing. However,
Xilinx recommends using native Vivado IP rather than XST-generated NGC format files
going forward.
Send Feedback

Lab 2: Using the Project Design Flow
Design Flows Overview www.xilinx.com 28 UG888 (v2015.2) June 24, 2015
The Vivado IDE includes a context sensitive text editor to create and develop RTL sources, constraints
files, and Tcl scripts. You can also configure the Vivado IDE to use third party text editors. Refer to the
Vivado Design Suite User Guide: Using the IDE (UG893) for information on configuring the Vivado tool.
Exploring the Sources Window and Project Summary
1. Examine the information in the Project Summary. More detailed information is presented as the
design progresses through the design flow.
2. Examine the Sources window and expand the Design Sources, Constraints and Simulation
Sources folders.
Figure 15: Viewing Sources
The Design Sources folder helps keep track of VHDL and Verilog source files and libraries. Notice
the Hierarchy tab is displayed by default.
3. Select the Libraries tab and the Compile Order tabs in the Sources window and notice the different
ways that sources are listed.
The Libraries tab groups source files by file type. The Compile Order tab shows the file order used
for synthesis.
4. Expand the various folders to view the design source information.
5. Select the Hierarchy tab.
Send Feedback
Lab 2: Using the Project Design Flow
Design Flows Overview www.xilinx.com 29 UG888 (v2015.2) June 24, 2015
Exploring the Text Editor
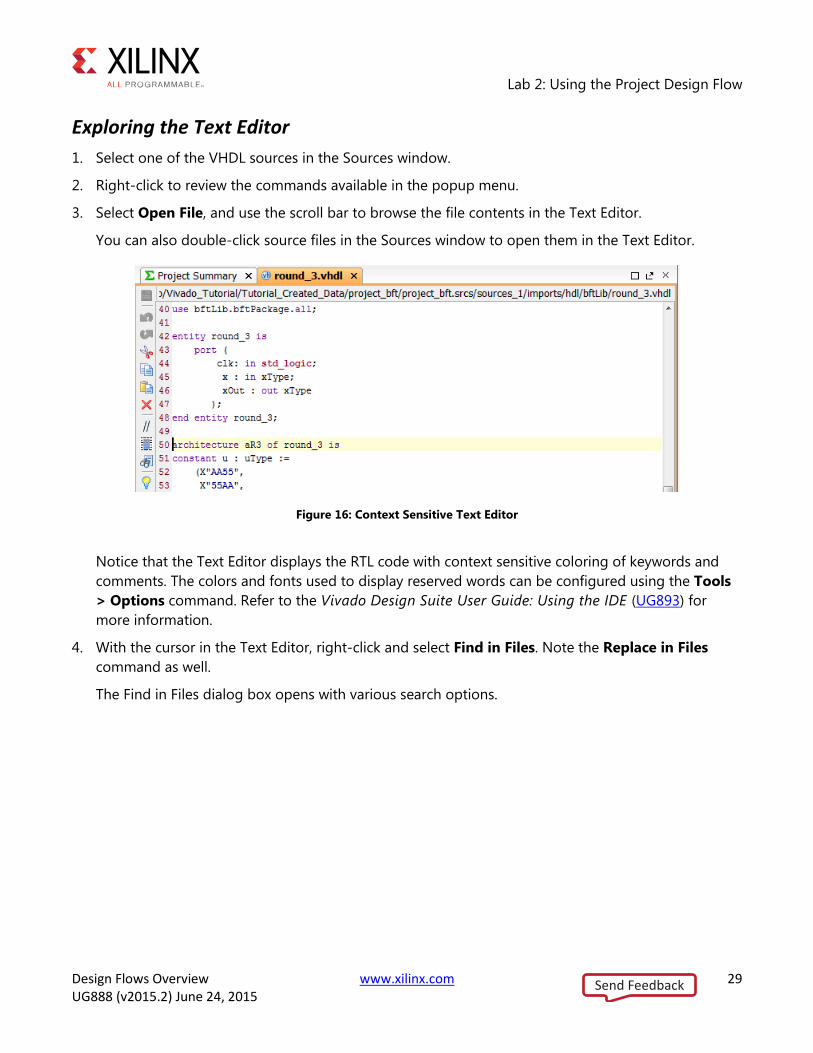
1. Select one of the VHDL sources in the Sources window.
2. Right-click to review the commands available in the popup menu.
3. Select Open File, and use the scroll bar to browse the file contents in the Text Editor.
You can also double-click source files in the Sources window to open them in the Text Editor.
Figure 16: Context Sensitive Text Editor
Notice that the Text Editor displays the RTL code with context sensitive coloring of keywords and
comments. The colors and fonts used to display reserved words can be configured using the Tools
> Options command. Refer to the Vivado Design Suite User Guide: Using the IDE (UG893) for
more information.
4. With the cursor in the Text Editor, right-click and select Find in Files. Note the Replace in Files
command as well.
The Find in Files dialog box opens with various search options.
Send Feedback

Lab 2: Using the Project Design Flow
Design Flows Overview www.xilinx.com 30 UG888 (v2015.2) June 24, 2015
Figure 17: Using Find in Files
5. Enter clk in the Find what: field, and click Find.
The Find in Files window displays in the messaging area at the bottom of the Vivado IDE.
Figure 18: Viewing the Find in Files Results
6. In the Find in Files window, expand one of the displayed files, and select an occurrence of clk in the
file.
Notice that the Text Editor opens the selected file and displays the selected occurrence of clk in the
file.
Send Feedback

Lab 2: Using the Project Design Flow
Design Flows Overview www.xilinx.com 31 UG888 (v2015.2) June 24, 2015
7. Close the Find in Files – Occurrences window.
8. Close the open Text Editor windows.
The next few steps highlight some of the design configuration and analysis features available prior to
running synthesis.
Step 3: Elaborating the RTL Design The Vivado IDE includes an RTL analysis and IP customizing environment. There are also several RTL
Design Rule Checks (DRCs) to examine ways to improve performance or power on the RTL design.
1. Select Open Elaborated Design in the Flow Navigator to elaborate the design.
Note: A dialog box appears informing you that your current settings will slow down netlist
elaboration. You can click OK to continue or Cancel to return to your project and edit your
Elaboration Settings, available in the Flow Navigator.
Figure 19: Elaborate Design Dialog Box
2. Ensure that the Layout Selector pull down menu in the main Toolbar has Default Layout selected.
The Elaborated Design enables various analysis views including an RTL Netlist, Schematic, and
Graphical Hierarchy. The views have a cross-select feature, which helps you to debug and optimize
the RTL.
3. Explore the logic hierarchy in the RTL Netlist window and examine the Schematic.
You can traverse the schematic by double-clicking on cells to push into the hierarchy, or by using
commands like the Expand Cone or Expand/Collapse from the Schematic popup menu. Refer to
the Vivado Design Suite User Guide: Using the Vivado IDE (UG893) for more information on using
the Schematic window.
4. Select any logic instance in the Schematic and right-click to select the Go to Source or Go to
Definition commands.
Send Feedback
Lab 2: Using the Project Design Flow
Design Flows Overview www.xilinx.com 32 UG888 (v2015.2) June 24, 2015
The Text Editor opens the RTL source file for the selected cell with the logic instance highlighted. In
the case of the Go to Definition command, the RTL source file containing the module definition is
opened. With Go to Source, the RTL source containing the instance of the selected cell is opened.
5. Click on the Messages window at the bottom of the Vivado IDE, and examine the messages.
6. Click the Collapse All button in the Messages toolbar.
7. Expand the Elaborated Design and the synth_design –name rtl_1 messages
Notice there are links in the messages to open the RTL source files associated with a message.
8. Click one of the links and the Text Editor opens the RTL source file with the relevant line highlighted.
9. Close the Text Editor windows.
10. Close the Elaborated Design by clicking on the X on the right side of the Elaborated Design window
banner, and click OK to confirm.
Step 4: Using the IP Catalog The Xilinx IP Catalog provides access to the Vivado IP configuration and generation features. You can
sort and search the Catalog in a variety of ways. IP can be customized, generated, and instantiated.
1. Click the IP Catalog button in the Flow Navigator.
2. Browse the IP Catalog to examine the various categories and IP filtering capabilities.
3. Click the Group icon and select Group > Group by taxonomy and repository
4. Expand the Basic Elements folder.
5. Double-click DSP48 Macro.
The Customize IP dialog is opened directly within Vivado Design Suite, which allows you to perform
native customization and configuration of IP within the tool. To learn more about IP configuration
and implementation, see the Vivado Design Suite User Guide: Designing with IP (UG896) and the
Vivado Design Suite Tutorial: Designing with IP (UG939).
6. Click Cancel to close the Customize IP dialog without adding the IP to the current design.
7. Close the IP Catalog tab by clicking on the X on the right side of the window banner.
Send Feedback
Lab 2: Using the Project Design Flow
Design Flows Overview www.xilinx.com 33 UG888 (v2015.2) June 24, 2015
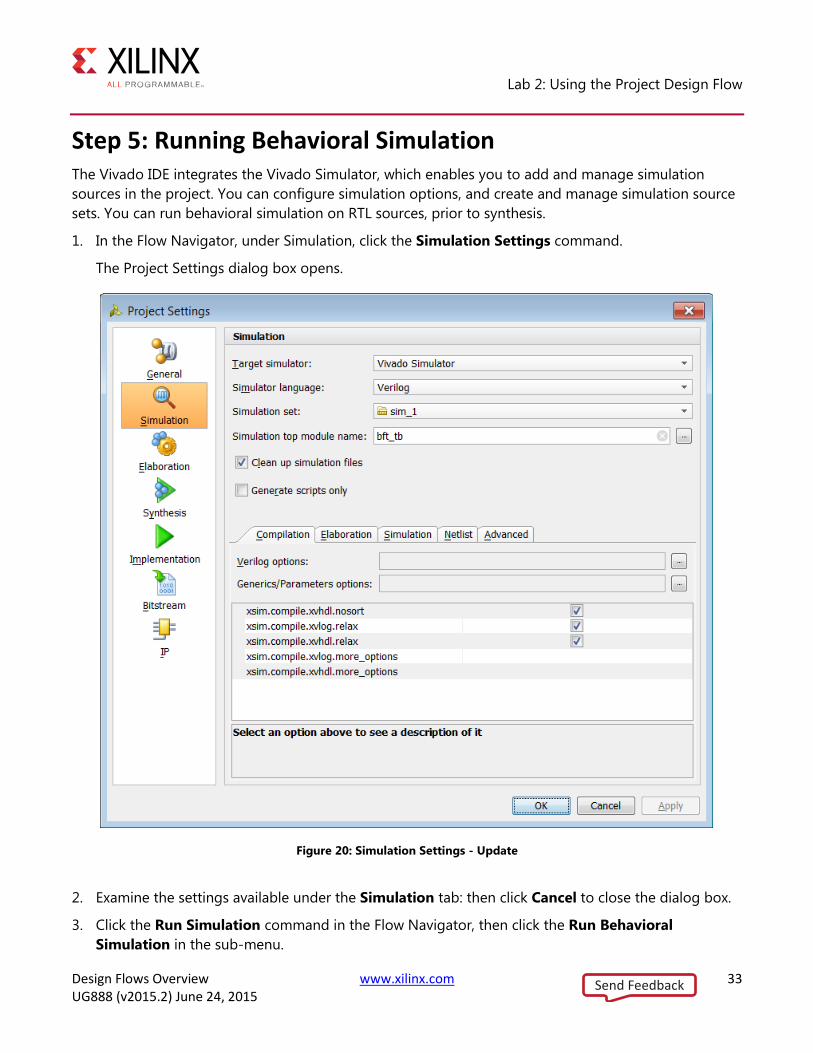
Step 5: Running Behavioral Simulation The Vivado IDE integrates the Vivado Simulator, which enables you to add and manage simulation
sources in the project. You can configure simulation options, and create and manage simulation source
sets. You can run behavioral simulation on RTL sources, prior to synthesis.
1. In the Flow Navigator, under Simulation, click the Simulation Settings command.
The Project Settings dialog box opens.
Figure 20: Simulation Settings - Update
2. Examine the settings available under the Simulation tab: then click Cancel to close the dialog box.
3. Click the Run Simulation command in the Flow Navigator, then click the Run Behavioral
Simulation in the sub-menu.
Send Feedback
Lab 2: Using the Project Design Flow
Design Flows Overview www.xilinx.com 34 UG888 (v2015.2) June 24, 2015
4. Examine and explore the Simulation environment.
Simulation is covered in detail in the Vivado Design Suite User Guide: Logic Simulation (UG900)
and the Vivado Design Suite Tutorial: Logic Simulation (UG937).
5. Close the simulation by clicking the X icon on the Behavioral Simulation view banner.
6. Click No if prompted to save changes.
Step 6: Reviewing Design Run Settings One of the main differences between the Non-Project mode you used in Lab #1 and the Project mode,
which you are now using, is the support of design runs for synthesis and implementation. Non-Project
mode does not support design runs.
Design runs are a way of configuring and storing the many options available in the different steps of
the synthesis and implementation process. You can configure these options and save the configurations
as strategies to be used in future runs. You can also define Tcl.pre and Tcl.post scripts to run
before and after each step of the process, to generate reports before and after the design progresses.
Before launching the synthesis and implementation runs you will review the settings and strategies for
these runs.
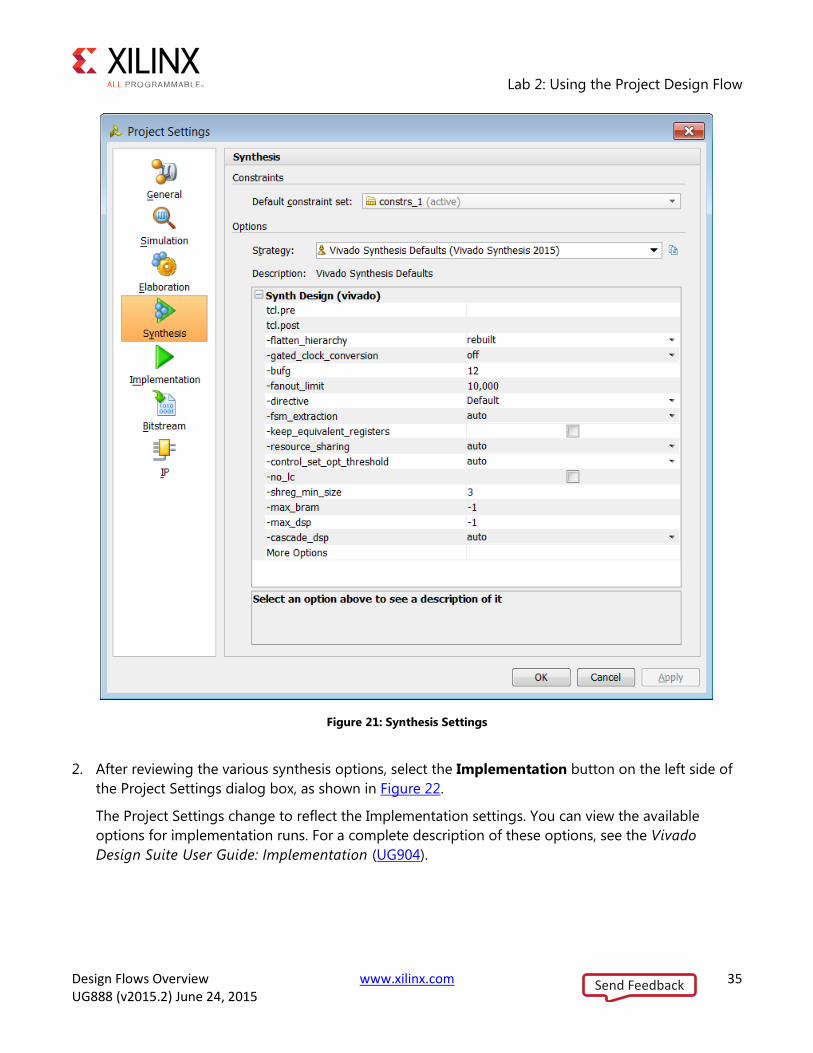
1. In the Flow Navigator, select Synthesis Settings under Synthesis.
The Project Settings dialog box opens. The Synthesis Settings provide you access to the many
options available for configuring Vivado synthesis. For a complete description of these options, see
the Vivado Design Suite User Guide: Synthesis (UG901).
Send Feedback
Lab 2: Using the Project Design Flow
Design Flows Overview www.xilinx.com 35 UG888 (v2015.2) June 24, 2015
Figure 21: Synthesis Settings
2. After reviewing the various synthesis options, select the Implementation button on the left side of
the Project Settings dialog box, as shown in Figure 22.
The Project Settings change to reflect the Implementation settings. You can view the available
options for implementation runs. For a complete description of these options, see the Vivado
Design Suite User Guide: Implementation (UG904).
Send Feedback

Lab 2: Using the Project Design Flow
Design Flows Overview www.xilinx.com 36 UG888 (v2015.2) June 24, 2015
Figure 22: Implementation Settings
3. Click Cancel to close the Project Settings dialog box.
You are now ready to launch Vivado synthesis and implementation.
Send Feedback
Lab 2: Using the Project Design Flow
Design Flows Overview www.xilinx.com 37 UG888 (v2015.2) June 24, 2015
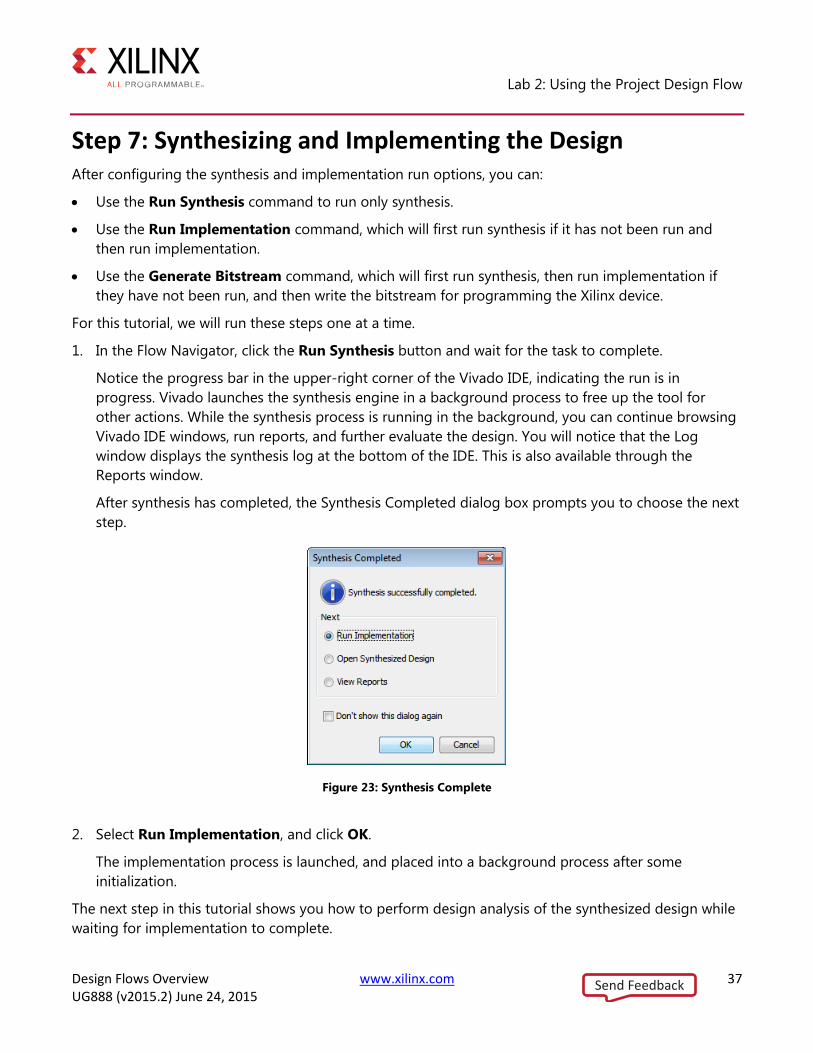
Step 7: Synthesizing and Implementing the Design After configuring the synthesis and implementation run options, you can:
Use the Run Synthesis command to run only synthesis.
Use the Run Implementation command, which will first run synthesis if it has not been run and
then run implementation.
Use the Generate Bitstream command, which will first run synthesis, then run implementation if
they have not been run, and then write the bitstream for programming the Xilinx device.
For this tutorial, we will run these steps one at a time.
1. In the Flow Navigator, click the Run Synthesis button and wait for the task to complete.
Notice the progress bar in the upper-right corner of the Vivado IDE, indicating the run is in
progress. Vivado launches the synthesis engine in a background process to free up the tool for
other actions. While the synthesis process is running in the background, you can continue browsing
Vivado IDE windows, run reports, and further evaluate the design. You will notice that the Log
window displays the synthesis log at the bottom of the IDE. This is also available through the
Reports window.
After synthesis has completed, the Synthesis Completed dialog box prompts you to choose the next
step.
Figure 23: Synthesis Complete
2. Select Run Implementation, and click OK.
The implementation process is launched, and placed into a background process after some
initialization.
The next step in this tutorial shows you how to perform design analysis of the synthesized design while
waiting for implementation to complete.
Send Feedback

Lab 2: Using the Project Design Flow
Design Flows Overview www.xilinx.com 38 UG888 (v2015.2) June 24, 2015
Step 8: Analyzing the Synthesized Design Opening the synthesized design enables design analysis, timing constraint definition, I/O planning,
floorplanning and debug core insertion. These features are covered in other tutorials, but you can take
a quick look in this step.
1. While implementation is running, select Open Synthesized Design in the Flow Navigator and wait
for the design to load.
Notice that as the Vivado IDE opens the synthesized design, the implementation continues running
in the background. At some point while you are exploring the synthesized design, implementation
will complete, and the Implementation Completed dialog box prompts you to choose the next step.
Figure 24: Implementation Complete
2. Click Cancel to close the dialog without taking any action.
This leaves the synthesized design open. You will open the implemented design after you are
finished examining the features of the synthesized design.
3. Ensure that the Layout Selector pull-down menu in the main Toolbar has Default Layout selected.
4. Click the Reports tab at the bottom of Vivado IDE.
If the Reports window is not open, you can open it with Windows > Reports.
5. Double-click Vivado Synthesis Report to examine the report.
6. Double-click Utilization Report to examine the report.
7. Close all reports when you have finished examining them.
8. Click the Messages tab at the bottom of the Vivado IDE.
If the Messages window is not open, you can open it with Windows > Messages.
Send Feedback

Lab 2: Using the Project Design Flow
Design Flows Overview www.xilinx.com 39 UG888 (v2015.2) June 24, 2015
The Messages window provides message type filters in its banner that display or hide Error, Critical
Warning, Warning, Info, and Status messages.
9. Click the Collapse All button to condense all of the Messages.
10. Expand the Synthesis messages.
11. Scroll through the Synthesis messages and notice the links to specific lines within source files. Click
some of the links and notice the source file opens in the Text Editor with the appropriate line
highlighted.
Figure 25: Synthesis Messages Linked to Source Files
12. In the Flow Navigator, under Synthesized Design, select Report Timing Summary.
The Report Timing Summary dialog box opens. Examine the various fields and options of this
command.
13. Click OK to run with default options.
The Timing Summary Results window opens.
Send Feedback
Lab 2: Using the Project Design Flow
Design Flows Overview www.xilinx.com 40 UG888 (v2015.2) June 24, 2015
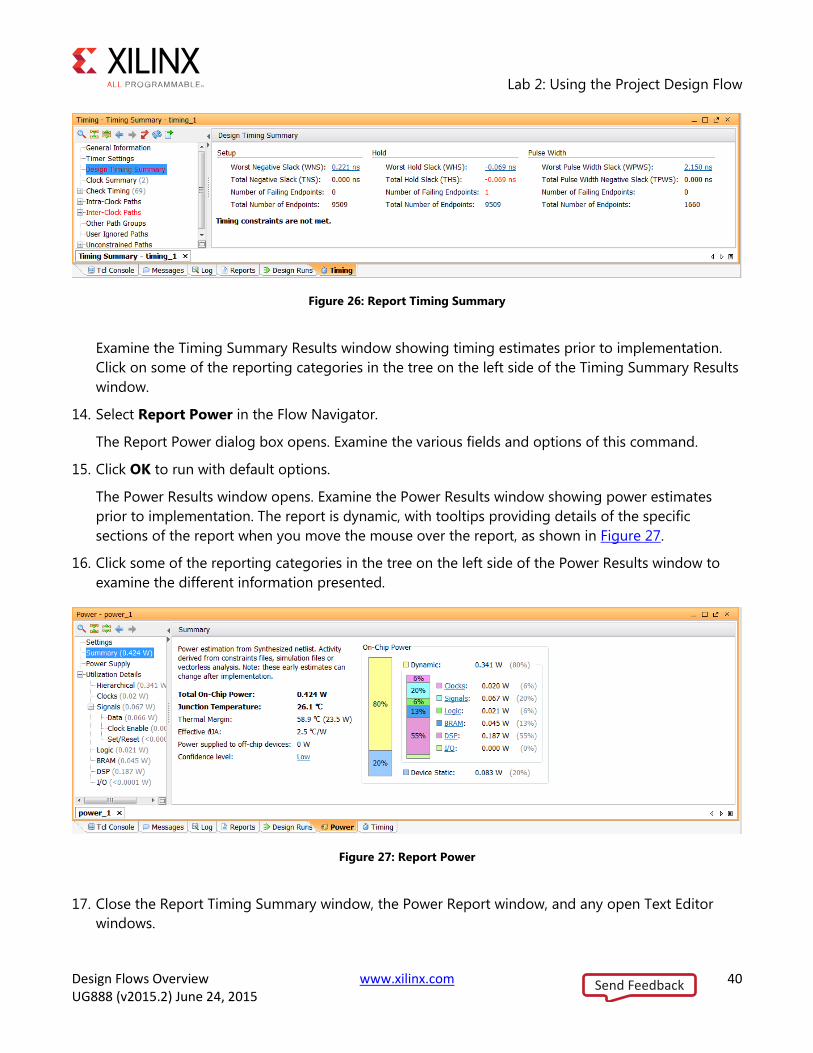
Figure 26: Report Timing Summary
Examine the Timing Summary Results window showing timing estimates prior to implementation.
Click on some of the reporting categories in the tree on the left side of the Timing Summary Results
window.
14. Select Report Power in the Flow Navigator.
The Report Power dialog box opens. Examine the various fields and options of this command.
15. Click OK to run with default options.
The Power Results window opens. Examine the Power Results window showing power estimates
prior to implementation. The report is dynamic, with tooltips providing details of the specific
sections of the report when you move the mouse over the report, as shown in Figure 27.
16. Click some of the reporting categories in the tree on the left side of the Power Results window to
examine the different information presented.
Figure 27: Report Power
17. Close the Report Timing Summary window, the Power Report window, and any open Text Editor
windows.
Send Feedback
Lab 2: Using the Project Design Flow
Design Flows Overview www.xilinx.com 41 UG888 (v2015.2) June 24, 2015
Step 9: Analyzing the Implemented Design The Vivado IDE is interactive, enabling editing of design constraints and netlists on the in-memory
design. When you save the design, constraint changes are written back to the original source XDC files.
Alternatively, you can save the changes to a new constraints file to preserve the original constraints.
This flexibility supports exploration of alternate timing and physical constraints, including floorplanning,
while keeping the original source files intact.
Opening the Implemented Design
1. Select Open Implemented Design in the Flow Navigator.
2. If prompted, select Yes to close the synthesized design and Don’t Save, if prompted.
After the Implemented Design has loaded, you can see the implementation results in the Device
window.
3. Click on the Reports tab at the bottom of the Vivado IDE.
If the Reports window is not open, you can open it with Windows > Reports. Select and examine
some of the reports from Place Design and Route Design. Close each of the reports when you are
done.
4. Select the Messages tab at the bottom of the IDE.
If the Messages window is not open, you can open it with Windows > Messages.
5. Click the Collapse All button to condense all of the Messages.
6. Expand the Implementation folder
7. View the messages from Design Initialization, Opt_Design, Place_Design, and Route_Design.
Analyzing Routing
After the design has been placed and routed, you can generate a timing report to verify that all the
timing constraints are met. You can select paths from the Timing Report window to examine the routed
path in the Device window. If there are timing problems, you can revisit the RTL source files or design
constraints to address any problems.
1. In the Device window, select the Routing Resources button to display the device routing.
This lets you see the routed connection in the Device window. Though you will need to zoom
closely into the device to see elements of the route, a zoomed-out view lets you see the route in its
entirety.
2. Select the Auto Fit Selection button in the Device window toolbar menu to enable the Vivado
IDE to automatically zoom into and center the selected objects.
3. On the left side pane of the Timing Summary Results window, select:
Send Feedback
Lab 2: Using the Project Design Flow
Design Flows Overview www.xilinx.com 42 UG888 (v2015.2) June 24, 2015
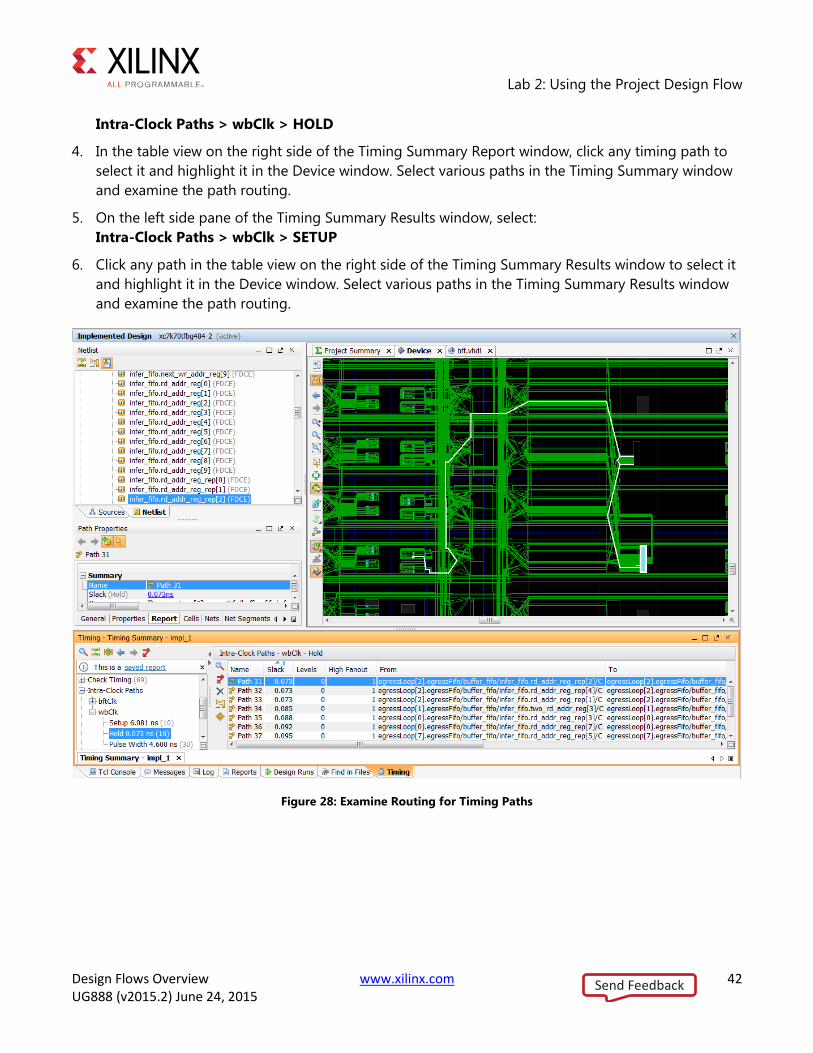
Intra-Clock Paths > wbClk > HOLD
4. In the table view on the right side of the Timing Summary Report window, click any timing path to
select it and highlight it in the Device window. Select various paths in the Timing Summary window
and examine the path routing.
5. On the left side pane of the Timing Summary Results window, select:
Intra-Clock Paths > wbClk > SETUP
6. Click any path in the table view on the right side of the Timing Summary Results window to select it
and highlight it in the Device window. Select various paths in the Timing Summary Results window
and examine the path routing.
Figure 28: Examine Routing for Timing Paths
Send Feedback
Lab 2: Using the Project Design Flow
Design Flows Overview www.xilinx.com 43 UG888 (v2015.2) June 24, 2015
7. With a timing path selected, right-click to open the popup menu in either the Device view or the
Timing Summary window, and select the Schematic command.
Note: Alternatively, you can press the F4 function key to open the Schematic window.
The Schematic window opens, displaying the schematic for the selected timing path. Use commands
from the popup menu in the Schematic window, such as Expand or Collapse Outside, or Expand
Cone, to traverse the schematic and examine the logic cells on the timing path.
8. Close the Schematic window.
9. In the Device window, select the Routing Resources toolbar button again to turn off routing
resources.
The Device window now displays just the placed instances, without the added details of the routed
connections.
Step 10: Generating a Bitstream file With IOSTANDARD constraints defined for all of the I/O ports, and the logic of the design placed with
assigned LOCs, you can generate a bitstream. Before launching Write Bitstream, you will review the
settings for this command.
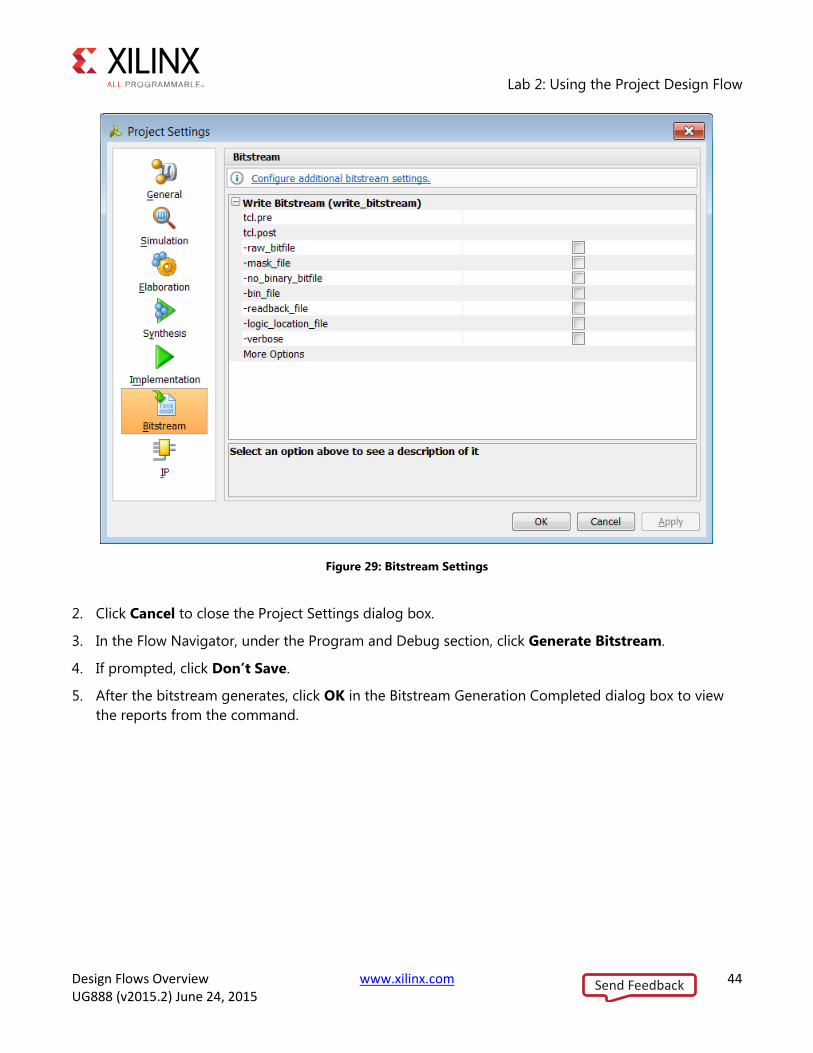
1. In the Flow Navigator, select Bitstream Settings under Program and Debug.
The Project Settings dialog box opens. The Bitstream Settings provides you access to the options
available for the write_bitstream command. For a complete description of these options and
how to use them, see the Vivado Design Suite User Guide: Programming and Debugging (UG908).
Note: There is a Configure additional bitstream settings link at the top of the Project Settings
dialog box. Click this to open the Edit Device Properties dialog box and configure general bitstream
properties.
Send Feedback
Lab 2: Using the Project Design Flow
Design Flows Overview www.xilinx.com 44 UG888 (v2015.2) June 24, 2015
Figure 29: Bitstream Settings
2. Click Cancel to close the Project Settings dialog box.
3. In the Flow Navigator, under the Program and Debug section, click Generate Bitstream.
4. If prompted, click Don’t Save.
5. After the bitstream generates, click OK in the Bitstream Generation Completed dialog box to view
the reports from the command.
Send Feedback

Lab 2: Using the Project Design Flow
Design Flows Overview www.xilinx.com 45 UG888 (v2015.2) June 24, 2015
Conclusion After completing this tutorial, you should be able to do the following:
Use Project mode and Non-Project mode.
Create an RTL project in Vivado IDE.
Configure the Vivado synthesis, simulation, and implementation tools.
Launch Vivado simulator, synthesis and implementation.
Apply constraints to the synthesized design.
Generate timing and power reports.
Examine routing results in the Device editor.
Generate a bitstream file.
Switch between the Vivado Design Suite Tcl shell and the Vivado IDE.
Send Feedback

Design Flows Overview www.xilinx.com 46 UG888 (v2015.2) June 24, 2015
Legal Notices
Please Read: Important Legal Notices The information disclosed to you hereunder (the “Materials”) is provided solely for the selection and use of Xilinx products. To the maximum
extent permitted by applicable law: (1) Materials are made available "AS IS" and with all faults, Xilinx hereby DISCLAIMS ALL WARRANTIES
AND CONDITIONS, EXPRESS, IMPLIED, OR STATUTORY, INCLUDING BUT NOT LIMITED TO WARRANTIES OF MERCHANTABILITY,
NON-INFRINGEMENT, OR FITNESS FOR ANY PARTICULAR PURPOSE; and (2) Xilinx shall not be liable (whether in contract or tort,
including negligence, or under any other theory of liability) for any loss or damage of any kind or nature related to, arising under, or in
connection with, the Materials (including your use of the Materials), including for any direct, indirect, special, incidental, or consequential loss
or damage (including loss of data, profits, goodwill, or any type of loss or damage suffered as a result of any action brought by a third party)
even if such damage or loss was reasonably foreseeable or Xilinx had been advised of the possibility of the same. Xilinx assumes no
obligation to correct any errors contained in the Materials or to notify you of updates to the Materials or to product specifications. You may not
reproduce, modify, distribute, or publicly display the Materials without prior written consent. Certain products are subject to the terms and
conditions of Xilinx’s limited warranty, please refer to Xilinx’s Terms of Sale which can be viewed at http://www.xilinx.com/legal.htm#tos; IP
cores may be subject to warranty and support terms contained in a license issued to you by Xilinx. Xilinx products are not designed or
intended to be fail-safe or for use in any application requiring fail-safe performance; you assume sole risk and liability for use of Xilinx products
in such critical applications, please refer to Xilinx’s Terms of Sale which can be viewed at http://www.xilinx.com/legal.htm#tos.
© Copyright 2012-2015 Xilinx, Inc. Xilinx, the Xilinx logo, Artix, ISE, Kintex, Spartan, Virtex, Zynq, UtlraScale, and other designated brands
included herein are trademarks of Xilinx in the United States and other countries. All other trademarks are the property of their respective
owners.
Send Feedback


