
VOT 74169
DEVELOPMENT OF SINGLE STEP PRESSURE REDUCTION SYSTEM FOR NGVM
(PEMBANGUNAN SISTEM PENURUN TEKANAN SEPERINGKAT BAGI NGVM)
ASSOC. PROF. Dr. RAHMAT MOHSIN ZULKIFLI ABD MAJID
PROF. Dr. ZULKIFLI YAACOB ASSOC. PROF. ZULKAFLI HASSAN
SHAMEED ASHRAF ABU SAMAH NASIR
MOHD REDHUAN RAMLEE
RESEARCH VOT NO: 74169
GAS TECHNOLOGY CENTRE (GASTEG) FAKULTI KEJURUTERAAN KIMIA DAN
KEJURUTERAAN SUMBER ASLI UNIVERSITI TEKNOLOGI MALAYSIA
2007

ACKNOWLEDGEMENT
Sincere appreciation is dedicated to the Management of the Faculty of
Chemical & Natural Resources Engineering (FKKKSA), UTM for their continual
support and useful advice. The technical staffs of Gas and Petroleum Engineering
department are also greatly acknowledged for their continuous efforts, technical
supports that they have shown throughout.
Full accreditation is addressed to the Research Management Centre (RMC),
UTM for their advices, support and kind services rendered, mainly to the Director,
Prof. Dr. Arifin Samsuri and RMC’s staff. The Ministry of Science Technology and
Innovations (MOSTI) is highly acknowledged for providing financial support
through the research Vot 74169.
Finally, the appreciation goes to researchers whom had directly and indirectly
contribute to the success of this project.

ii
ABSTRACT
The objective of this study is to design, fabricate and test a single step pressure regulation system for the natural gas motorcycle. The pressure regulator prototype design was based upon the fundamental principles of the pressure regulator. The aid of Computational Fluid Dynamic (CFD), pressure vessel code and threaded fastener standards were implied to design the pressure regulator prototype. The commercially available CFD code FLUENTTM was used to analyse and optimize the flow within the regulator. The structural design was based on the American Society of Mechanical Engineer (ASME) pressure vessel code. The Society of Automotive Engineers (SAE) and American Society of Testing and Materials (ASTM) served as reference for threaded fasteners selection. The material selection achieved for the prototype design consists of stainless steel 304, TeflonTM and 3 ply elastomer as the selected material of choice. The final CFD evaluation provided an optimum opening of 3 mm between the obturator and valve seat. The pressure regulator base has a wall thickness of 7.5 mm while the bonnet cap has 11.5 mm thickness. The loading element spring selected was a helical grounded type with 10 active coils and a wire diameter of 3 mm. The prototype designed was fabricated using Computer Numerical Configuration (CNC) machining as it is the best economically viable solution. The prototype performance was evaluated using the specially designed pressure regulator test bench equipped with data acquisition and high pressure gas supply system. Outlet gas flow rates were steadily controlled from 5 to 25 litres per minute and the outlet pressure was found to be steady at 4.5 bar. It is clearly proven that the developed pressure regulator is capable of providing the downstream components with natural gas at 4.5 bar up to 25 litres per minute. The single step pressure regulation developed, can be used on the Kriss Modenas 110cc or any small engines with similar fuel requirement.

iii
ABSTRAK
Objektif utama kajian ini adalah untuk merekabentuk, meghasil dan menguji pengatur tekanan seperingkat untuk kegunaan motorsikal gas asli. Rekabentuk prototaip pengatur tekanan in adalah berasaskan prinsip asas pengatur tekanan. Dengan bantuan Dinamik Bendalir Berkomputer (CFD), kod baling bertekanan dan pengedap berbebenang, reka bentuk pengatur tekanan seperingkat dicapai. Kod perisian CFD FLUENTTM telah digunakan untuk menganalisa aliran gas di dalam pengatur tekanan seperingkat. Rekabentuk diasaskan kepada kod balang bertekanan Persatuan Jurutera Mekanikal Amerika (ASME) dan pengedap berbebenang berasaskan oleh Persatuan Jurutera Otomobil (SAE) dan Persatuan Pengujian Bahan Amerika (ASTM). Bahan asas yang dipilih untuk pengatur tekanan seperingkat terdiri dari keluli tanpa karat 304, TeflonTM dan elastomer 3-lapis. Keputusan simulasi Dinamik Bendalir Berkomputer memberikan pembukaan optima sebesar 3 mm pada bukaan injap. Dinding tapak pengatur tekanan mempunyai ketebalan 7.5 mm manakala ketebalan penutup adalah 11.5 mm. Elemen pembeban yang dipilih adalah dari jenis helikal dengan 10 lingkaran aktif dan mempunyai ketebalan rod wayar 3 mm. Pembuatan prototaip pengatur tekanan seperingkat dihasilkan dengan menggunakan mesin Konfigurasi Numerikal Berkomputer (CNC) yang dipilih berasaskan keberkesanannya. Prestasi prototaip diuji dengan menggunakan kemudahan pengujian pengatur tekanan yang direka khas serta dilengkapi dengan sistem pengumpulan data dan bekalan gas bertekanan tinggi. Aliran keluar gas dikawal dari 5 hingga 25 liter seminit dengan tekanan keluaran mantap setinggi 4.5 bar. Ini membuktikan keberkesanan rekabentuk prototaip untuk membekalkan gas pada 4.5 bar dengan kadar alir setinggi 25 liter seminit. Pengatur tekanan seperingkat yang terhasil ini boleh digunakan untuk injin Modenas Kriss 110cc atau sebarang injin kecil lain yang mempunyai keperluan yang sama.

iv
TABLE OF CONTENTS
CHAPTER TITLE PAGE
TITLE i
DECLARATION ii
ACKNOWLEDGEMENT iii
ABSTRACT iv
ABSTRAK v
TABLE OF CONTENT vi
LIST OF TABLES xi
LIST OF FIGURES xii
LIST OF APPENDICES xv
1 1.0 INTRODUCTION 1
1.1 Motivation of Study 2
1.2 Research Problem Statement 3
1.3 Research Objective 4
1.4 Scope of Work 4
1.5 Contribution of the Study 5
2 2.0 INTRODUCTION
2.1 Natural Gas Vehicles 6
2.1.1 Development of Natural Gas Vehicles 7
2.1.2 Advantages of Natural Gas Vehicles 8
2.1.3 NGV Technology 11
v
2.2 Global Implementation of NGV 12
2.2.1 NGV in the United States of America 14
2.2.2 NGV in Canada 15
2.2.3 NGV in Latin America and Caribbean 15
2.2.4 NGV in Europe 16
2.2.5 NGV in India 17
2.3 Vehicle Manufacturers Resolution to NGV 18
2.4 Implementation of NGV in Malaysia 19
2.5 Natural Gas Vehicle Fuel System 20
2.6 Natural Gas Motorcycle 24
2.6.1 Natural Gas Motorcycle Performance
And Emisson Test 26
2.6.2 Natural Gas Motorcycle Lubrication
Oil Test 27
2.7 Natural Gas Motorcycle Second Generation Fuel
System 30
3 3.0 PRESSURE REGULATOR
3.1 Pressure Regulation System 33
3.1.1 Pressure Regulator Component 34
3.1.2 Pressure Regulator Body 36
3.1.3 Pressure Regulator Valve Trim 36
3.1.4 Pressure Regulator Actuator 38
3.2 Basic Operating Element of Pressure Regulator 40
3.2.1 Loading Mechanism 40
3.2.2 Sensing Element 40
3.2.3 Control Element 40
3.3 Operation of Pressure Regulator 41
3.4 Principle of Pressure Regulator Operation 43

vi
3.4.1 Single Stage Design 44
3.4.2 Double Stage Design 44
3.5 Natural Gas Vehicle (NGV) Pressure Regulator 45
3.5.1 Typical NGV Regulator System 45
3.6 Pressure Regulator Type 46
4 DESIGN AND DEVELOPMENT
4.0 Introduction 49
4.1 Pressure Regulation System Bi-Fuel Study 51
4.1.1 Lesson Learned from the Bi- Fuel Engine
Test Skid 51
4.2 Parameter Selection and Boundary Condition 53
4.3 Regulator Prototype Design 53
4.3.1 Regulator Restriction Design 54
4.3.2 Computational Fluid Dynamics Evaluation 57
4.3.3 Regulator Actuation Design 61
4.4 Compression Spring 62
4.4.1 Compression Spring Principles 64
4.5 Valve Body Wall Thickness 68
4.5.1 Minimal Wall Thickness of Shell Under
Internal Pressure 69
4.5.2 Minimal Wall Thickness of Unstayed Flat
Heads 70
4.5.3 Minimal Wall Thickness of Unstayed
Covers 71
4.6 Regulator Loading Element Design 72
4.7 Regulator Body Design 75
4.7.1 Threaded Fastener 76
4.8 Regulator Material Selection 77

vii
4.9 Regulator Prototype Fabrication 79
4.10 Regulator Prototype Testing 80
4.11 Regulator Prototype and Test Bench Testing 83
4.11.1 Pressure Regulator Test Bench Operation 84
5 REFINEMENT OF PRESSURE REGULATOR DESIGN
5.0 Introduction 86
5.1 AUTOCAD (v2004) Model Drawing 89
5.2 SOLIDWORKS (v 2005) Model Drawing 89
5.3 MSC PATRAN (v 2005r1) 91
5.3.1 Database Creation 91
5.3.2 Model Preferences Specification 92
5.3.3 Importing Geometry Model 93
5.3.3.1 Geometry Creation 94
5.4 Finite Element Model Creation 95
5.4.1 Loads and Boundary Condition Application 98
5.4.2 Material Property Models Creation 103
5.4.3 Elements Properties Creation 105
5.5 Running the Analysis 107
5.6 Retrieving the Analysis Result 108
5.6.1 Numerical Result Visualization 109
5.7 Analysis and Discussion 111
6 RESULTS AND DISCUSSIONS
6.0 Introduction 112
6.1 Regulator Restriction Results 113
6.2 Regulator Actuation Results 117
viii
6.3 Regulator Body Results 119
6.4 Regulator Prototype End Product 120
6.5 Pressure Regulator Performance Results 121
6.6 Refinement of Previous Product 123
6.7 Two Dimensional Modeling 123
6.8 Solidified Modeling 125
6.9 MSC PASTRAN/NASTRAN Analysis 127
6.9.1 Simulation Data for Single Stage Regulator 128
6.9.2 Comparison on MSC/PASTRAN Simulation
Results 132
6.10 Comparison on Material Selection 141
7 CONCLUSION 146 REFERENCES 148 APPENDIX

ix
LIST OF TABLES
TABLE NO. TITLE PAGE 2.1 Comparison of Natural Gas Characteristic 9
2.2 Combustion Related Properties of Gasoline & CNG 10
2.3 Natural Gas Vehicle Population Worldwide 12
2.4 Conversion Kit Component 21
2.5 Natural Gas Composition 26
2.6 Petrol Specification 27
2.7 Engine Oil Properties and Standard Testing Method 28
6.1 Simulation Data for Part A Using SS304 128
6.2 Simulation Data for Part A Using
Aluminium Cast Alloy 128
6.3 Simulation Data for Part A Using Brass 129
6.4 Simulation Data for Part B Using SS304 129
6.5 Simulation Data for Part B Using
Aluminium Cast Alloy 130
6.6 Simulation Data for Part B Using Brass 130
6.7 Yield Strength for Each Material 131
6.8 Material Design Stress 132
6.9 Optimise Thickness of Each Material Selection 132
6.10 Material Strength Preliminary Analysis for Part A 142 6.11 Material Strength Preliminary Analysis for Part B 143

x
6.12 Material Strength Preliminary Analysis for New Prototype
Model 144 6.13 Gross Material Cost of Regular New Prototype 145 7.1 Result Summary 147

xi
LIST OF FIGURES
FIGURE NO. TITLE PAGE 2.1 Natural Gas Vehicle Bi-Fuel System
Components and Layout 21 2.2 Schematic Diagram of Bi-Fuel Mechanism 23 2.3 Natural Gas Motorcycle First Generation Fuel System
Schematic Diagram. 30 2.4 Natural Gas Motorcycle Second-Generation Fuel System
Schematic Diagram 31 3.1 Components of Typical Spring Loaded Pressure Regulator 35 3.2 Schematic Diaphragm of Open Restricting Element 42 3.3 Schematic Diagram of Closed Restricting Element 43 3.4 Typical Stage Regulator 44 3.5 TN I SIC Regulator produced by Landirenzo 47 4.1 Methodology Flow Diagram of Study 50 4.2 Compress Natural Gas Fuel Line 55 4.3 Open and Close Position of the Restricting Element 57 4.4 The Meshed Geometry Used for CFD Simulation 58
4.5 3 Dimensional Fluid Flow Pattern Around the
Restricting Element 58
4.6 2-Dimensional Fluid Flow Pattern Around the
Restricting Element. 59
4.7 Obturator positioning simulated by CFD software 60
4.8 Mechanical Linkage Relating All Three Elements 62

xii
4.9 Single Coil of a Helical Compression Spring 64
4.10 The twisting moment on the spring coils 65
4.11 Pictorial Description of Longitudinal and Circumferential
Stress 70
4.12 Types of Unstayed Flat Heads and Covers 70
4.13 Schematic Drawing of the Pressure Regulator Test Bench 83
4.14 Pressure Regulator Test Bench 85
5.1 Methodology Process Flow 88
5.2 SOLIDWORK IGES File Save Format 90
5.3 Creating New Database 92
5.4 New Model Preferences Form 93
5.5 MSC.NASTRAN Import IGES File Format 94
5.6 Geometry Application Form 95
5.7 Finite Element Model Creation 97
5.8 Geometry Model after Meshing 99
5.9 Load/BCs Application Form for Displacement Force 100
5.10 LBC Select Application Region Subform for
Displacement Force 101
5.11 Region of Displacement Force Application (Red Line) 101
5.12 Region of Pressure Force Application (Red Line) 102
5.13 Geometry Model after Displacement and Pressure Force
Applied 102
5.14 Material Property Models Application Form 104
5.15 Element Properties Application Form 106
5.16 Analysis Application Form 107
5.17 Common Prompt Window 108
5.18 Access Result Application Form 109
5.19 Result Visualization 110
6.1 3-Dimensional Fluid Flow Pattern around the
Restricting Element 114
6.2 2-Dimensional Fluid Flow Pattern around the

xiii
Restricting Element 114
6.3 Velocity Magnitude of Each Cross-Sectional Plane 115
6.4 Total Pressure Profile of One Cross-Sectional Plane 115
6.5 CFD Simulation Results Comparing Mass Flow Rate
and Obturator Distance of Opening. 116
6.6 Final Loading Element Design 118
6.7 Pressure Regulator Body Dimensions 119
6.8 Bonnet Cap Dimensions 120
6.9 Fabricated Pressure Regulator Prototype 121
6.10 Performance Plot of the Pressure Regulator Prototype
Evaluated Using the Pressure Regulator Test Bench 122
6.11 Two Dimensional Drawing of Part A and Part B 124
6.12 Evolution of Structural Design Modification via
SOLIDWORK 126
6.13 Part A and Part B of New Design via SOLIDWORK 127
6.14 Stress Tensor Analysis Result for New Model of Part A
Using SS304 133
6.15 Deformation Analysis Result for New Model of Part A
Using SS304 133
6.16 Stress Tensor Analysis Result for New Model of Part A
Using Brass 134
6.17 Deformation Analysis Result for New Model of Part A
Using Brass 135
6.18 Stress Tensor Result for New Model of Part A
Using Aluminium Cast Alloy 136
6.19 Deformation Analysis Result for New Model of Part A
Using Aluminum Cast Alloy 136
6.20 Stress Tensor Result for New Model of Part B Using
SS304 138
6.21 Deformation Analysis Result for New Model of Part B
Using SS_304 138

xiv
6.22 Stress Tensor Result for New Model of Part B Using Brass 139
6.23 Displacement Result for New Model of Part B Using Brass 139
6.24 Stress Tensor Result for New Model of Part B Using
Aluminum Cast Alloy 140
6.25 Deformation Analysis Result for New Model of Part B
Using Aluminum Cast Alloy 140

CHAPTER 1
INTRODUCTION
Energy has proven to be the prerequisite and basis for life and mobility. We
owe the wealth and prosperity of today’s society to the use of fossil energies.
Petroleum products derived from fossil fuel have physical and chemical properties
that make them very desirable as transportation fuels. This combination of attractive
properties and affordability has resulted in more than 95% of the world’s
transportation system being fuelled by petroleum products. With all the conventional
oil we have discovered, and all we think awaits discovery, this source of virtually all
of the world’s transportation fuels will be forced to relinquish. This is estimated
within perhaps 10 to 40 years as oil demand continues to grow while world crude oil
production will begin an inevitable decline. The proportional depletion of supply has
also caused the rise in oil price. Among all human activities, driving motor vehicles
produces the most regulated air pollutants such as lead, hydrocarbons, oxides of
nitrogen (NOx), carbon monoxide, and particulate matter..
The increase in price and heavy pollution caused by the use of petrol and
diesel conventional fuel indicates we can no longer rely exclusively on it. This
supports the need for an alternative fuel source that would diversify the dependency
on mainstream petroleum fuel and help mitigate the pollution problem. Compressed
Natural Gas (CNG) is relatively well tested and is currently the cleanest and most
widely used alternative fuel in the world. The number of natural gas vehicle (NGV)
is currently about 4.6 million units worldwide as depicted in Table 2.3. Anyone who
desires to effectively contribute to the saving of our resources and the reduction of

2
emissions should resort to the use of natural gas. Natural gas as a fuel helps to save
oil resources and reduces emissions effectively.
1.1 Motivation of Study
Any vehicle operated by an internal combustion engine can be powered by
natural gas. Vehicles may operate solely on natural gas (mono-fuel), operate on
natural gas or other fuel as desired by user (bi-fuel) or operate on fuel mixture
containing natural gas and another fuel (dual-fuel). This diversity has caused various
vehicles, such as buses, trailers, forklifts, cars, tricycles, mopeds and even
motorcycles to be converted to NGV. Gas Technology Centre (GASTEG) of
Universiti Teknologi Malaysia is the pioneering local body to implement natural gas
as motorcycle fuel since 1997. This prototype Natural Gas Motorcycle (NGM) uses
a locally made Modenas Kriss 110cc.
The successful testing results of the first generation natural gas fuel system
are comprehensively described in Chapter 2. As a whole, the first generation natural
gas fuel system implied on this motorcycle begins at the Compressed Natural Gas
(CNG) storage cylinder and ends at the fuel-metering device that prepares the air fuel
mixture to be combusted by the engine. Between these two components lies the
pressure regulator that moderates the storage pressure to meet the requirement of the
fuel-metering device. Each component of the first generation natural gas fuel system
suits the Modenas Kriss 110cc motorcycle. The Natural Gas Vehicle – Motorcycle
(NGM) Research Group under GASTEG also carried out studies on an advance
storage system which employs Adsorption Natural Gas (ANG) which provides two
third of the gas volume storage capacity of CNG at one sixth of the current 3000 psi
operating pressure. A dedicated mixer was designed and fabricated to provide the
Kriss 110 a homogenous air-fuel mixture of 10:1 air fuel ratio.
The valuable experience and lesson learned form the development of the first
generation system has lead to the development of the improved second-generation

3
natural gas fuel system for the same motorcycle. The second-generation fuel system
further improves the carburetion fuel metering system by utilising an electronically
controlled injection system that provides better air-fuel mixing which in return
provides better fuel efficiency, power output and enhances fuel economy. This
current study completes part of the second-generation fuel system development.
1.2 Research Problem Statement
The implementation of the injection system (fuel-metering device) on the
second generation fuel system requires the pressure regulator to provide higher outlet
pressure compared to the carburetion system. The first generation system had the
storage cylinders charged with 1800 psi of pressure causing lighter loads on the
regulator. The actual charging pressure from the compressed natural gas (CNG)
refuelling station would provide 3000 psi of pressure that may cause severe loading
on the first generation pressure regulator, which may lead to regulator failure. The
first generation carburetion fuel system requires the pressure regulator to provide an
output of 5 psi. The vast pressure reduction requires the first generation pressure
regulation system to have two pressure regulators to reduce the pressure. The
second-generation fuel system that uses injection system requires the regulator to
provide higher output pressure. This higher pressure requirement has potentials to
employs only one stage of pressure reduction. The previous regulator was readily
available in the market and it is primarily design for common utility gas use. The
natural gas regulator is governed by various standards that cover gaseous fuels use on
automotive vehicles that needs to be addressed.
This generates the need to develop a dedicated pressure regulator that would
suit the second-generation fuel system. The regulator understudy will be designed to
comply with related standards and to work onboard the motorcycle where the space

4
is a major constraint. The outlet pressure and flow rate would be designed to meet
the requirement of the engine.
1.3 Research Objective The aim of this study is to design, fabricate and test a single step pressure regulation
system prototype to provide constant pressure output at varying flow demands
dedicated for natural gas motorcycle Modenas Kriss 110cc Natural Gas Motorcycle
(NGM) second generation fuel system and to designed new prototype of NGVM and
to gain the optimize thickness of this designed prototype of NGVM pressure
regulator via the assistance of finite element analysis (FEA).
1.4 Scope of Work
The scopes of study are as follows:
i. To establish basic understanding on the design criteria required for a
NGV pressure regulator.
ii. To formulate a pressure regulation mechanism that incorporates
restricting, loading and measuring elements of the pressure regulator.
iii. To utilize Computational Fluid Dynamic as design aid.
iv. To develop a final operational prototype natural gas pressure regulator
that would suite the operational conditions.
v. To design and develop basic performance test bench for the NGM
pressure regulator system equipped with data acquisition system.
vi. Understand the basic concept and function of NGVM pressure
regulator.
vii. Develop of a 3D model of the existing prototype using AutoCAD and
SolidWorks
5
viii. Simulate the process model using finite element analysis (FEA)
system known as NASTRAN / PATRAN.
ix. Analyze the simulation results in terms of material selection, wall
thickness and stress analysis of the regulator
x. Optimize the pressure regulator in terms of spacing to be fitted into
NGVM
1.5 Contribution of the Study
The successful design, fabrication and testing of the current work would
provide a comprehensive method to produce a pressure regulator in general. The
dedicated prototype pressure regulator would compliment the second-generation fuel
system by providing appropriate gas flow and pressure from the storage tank to the
fuel-metering device. The bi-fuel engine test skid provides an overall understanding
of the natural gas fuel system for carburetion engines in general. The pressure
regulator test bench would be a suitable facility to conduct basic pressure regulation
testing for other pressure regulators in the future. The current work also provides an
overall method on the development of the test bench. Calibration and data
acquisition that includes flow, pressure and temperature monitoring is covered within
this scope of study. Safety issues that relate high pressure and flammable gas
handling concerning all designs are addressed accordingly.

CHAPTER 2
NATURAL GAS VEHICLE
2.0 Introduction
This section begins with the natural gas vehicle introduction that covers its
benefits and the global implementation of it. The support of the vehicle manufacturers on
natural gas vehicle is also discussed. This discussion is then lead to the implementation of
natural gas vehicle (NGV) in Malaysia. Interest is then diverted to the NGV fuel system
by the description of the entire fuel system. This discussion then cascades to the previous
work on the natural gas motorcycle followed by the intended improved second generation
fuel system. The pressure regulation system is elaborated in terms of its types. The
regulator components and their functions are expressed in Chapter 3. As for the pressure
regulator operation is illustrated in Chapter 3 graphically too. The final part of chapter
reviews the natural gas vehicle pressure regulator.
2.1 Natural Gas Vehicle
The use of natural gas as a transportation fuel can offer emissions and
environmental benefits, energy diversity and security. Relative to petrol, this fuel reduces
the particulate matter of up to 10 microns in size (PM10) significantly and the unburned
hydrocarbons to substantial degrees. Compressed Natural Gas (CNG) generally costs
less than petrol and many countries are making CNG economically favorable. The
natural gas distribution infrastructure in many countries increases the availability of

7
natural gas. CNG vehicles emit reduced amount of carbon monoxide than petrol or
methanol vehicles because CNG mixes better with air than do liquid fuels and requires
less enrichment for engine start-up. Greater energy and heat efficiency can be obtained
(11,000 kilocalories per cubic meter) due to the higher octane number (130) of natural
gas that permits internal combustion engines to operate at higher compression ratios. The
use of natural gas over petrol reduces carbon monoxide (CO) by 97%, unburned
hydrocarbon (HC) by 72%, nitrogen dioxide (NOX) by 39%, and carbon dioxide (CO2)
by 25% of the emission content. The absence of benzene or aromatic hydrocarbon in
natural gas ensures minimal harmful emissions from natural gas-powered engines2.
2.1.1 Development of Natural Gas Vehicles
The first natural gas engine was built in 1860, before the development of the
gasoline engine. Compressed Natural Gas (CNG) has been used in vehicles since 1930’s
and the current worldwide NGV population is more than 4.5 million according to the
International Association for Natural Gas Vehicle (IANGV) statistics and this figure is
fast increasing everyday.
Natural gas vehicles have been used with much success in the United States since
the 1960s and in Europe for nearly 50 years. Natural gas as a vehicle fuel has a long and
established record in Europe, Canada, New Zealand, Australia, and in the U.S.A. In fact,
there are currently more than 30,000 natural gas vehicles on U.S. roads and over 700,000
worldwide. The use of natural gas as vehicular fuel is growing more popular by the hour,
as it is demonstrated by the fact that more than 60 countries have chosen this alternative
fuel. In Malaysia, the number of registered vehicles is 12 million with 51% of them are
using gasoline (Ministry of transport, Malaysia’ 2002) and there are only 15,600
conventional NGV (July’ 2005), which are mainly taxi.
There are two main reasons why countries chose to implement NGV projects,
mainly due to ecology and economic factors. The advantages of NGV from these two
different perspectives may initially be considered conflicting, but that in fact has an

8
intimate connection. Natural gas is chosen as a means of drastically reducing social
health costs due to the reduction in polluting emissions, mainly particulates, benzene and
ground level ozone. At the other hand NGV is chosen as an economic instrument, by
taking advantage of its low cost in order to motorize expansion through cheap freights
and increased savings for large sectors of society; at the same time exportable surplus of
oil and fuels generate solid incomes to the nation (Diego Goldin and Santiago Manconi,
2004)
2.1.2 Advantages of Natural Gas Vehicles
Natural gas is the cleanest-burning fossil fuel available. Natural gas vehicles can
achieve up to a 93 percent reduction in carbon monoxide emissions, 33 percent reduction
in nitrogen oxides emissions and a 50 percent reduction in reactive hydrocarbons in
comparison with gasoline vehicles as reported by Washington Gas NGV Holding (1999).
Natural gas vehicles emit virtually no carcinogenic particulate matter. Therefore, it
becomes a strong force in improving the nation’s air quality.
NGVs operate so cleanly because the fuel is inherently clean. Natural gas is
generally composed of at least 90 percent methane and may contain other hydrocarbons
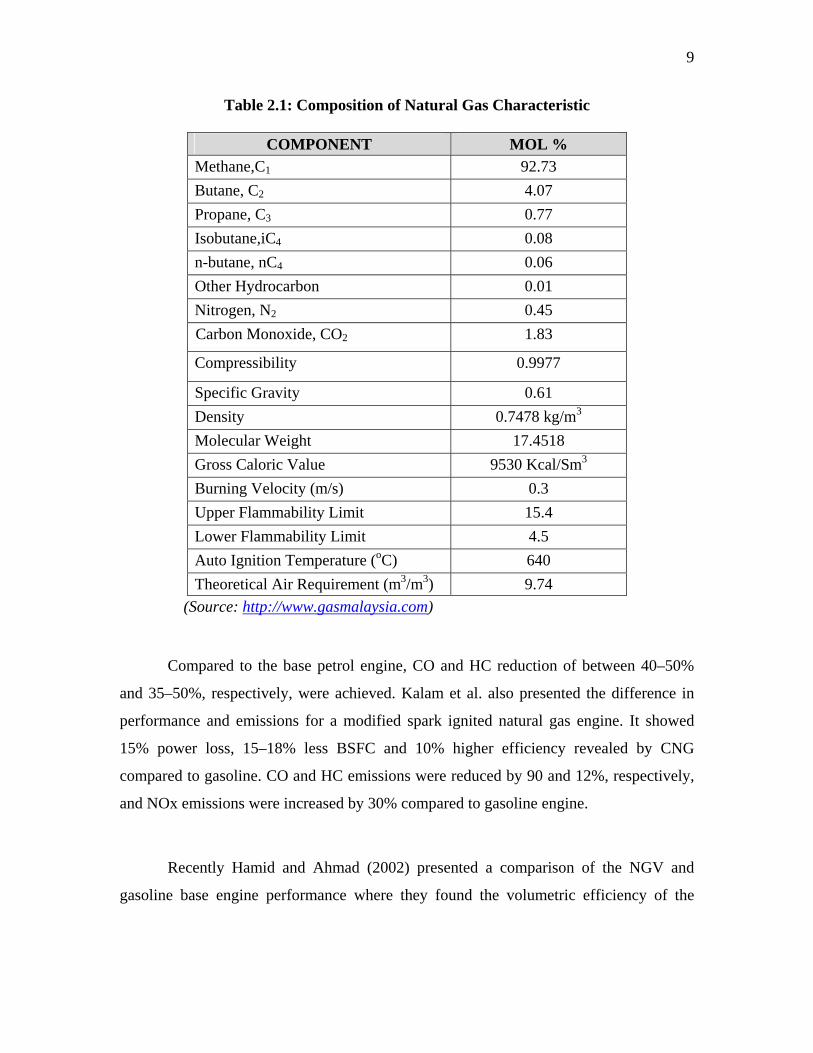
in small amounts including ethane, propane and butane. Table 2.1 showed the
composition of Natural Gas characteristic by Gas Malaysia (2003). Because the methane
is relatively pure component, the emissions of hydrocarbon, carbon monoxide and in
some cases nitrogen dioxide can be significantly less from the NGV than from a gasoline
or diesel vehicle. Per unit of energy, natural gas contains less carbon than any other fossil
fuel, and thus lower carbon monoxide (CO2) emissions per vehicles mile traveled. In
addition, natural gas has an octane rating of 130, which means it has an efficiency
advantage over gasoline (Rashidi, 2001)
9
Table 2.1: Composition of Natural Gas Characteristic
COMPONENT MOL % Methane,C1 92.73 Butane, C2 4.07 Propane, C3 0.77 Isobutane,iC4 0.08 n-butane, nC4 0.06 Other Hydrocarbon 0.01 Nitrogen, N2 0.45 Carbon Monoxide, CO2 1.83
Compressibility 0.9977
Specific Gravity 0.61 Density 0.7478 kg/m3
Molecular Weight 17.4518 Gross Caloric Value 9530 Kcal/Sm3
Burning Velocity (m/s) 0.3 Upper Flammability Limit 15.4 Lower Flammability Limit 4.5 Auto Ignition Temperature (oC) 640 Theoretical Air Requirement (m3/m3) 9.74
(Source: http://www.gasmalaysia.com)
Compared to the base petrol engine, CO and HC reduction of between 40–50%
and 35–50%, respectively, were achieved. Kalam et al. also presented the difference in
performance and emissions for a modified spark ignited natural gas engine. It showed
15% power loss, 15–18% less BSFC and 10% higher efficiency revealed by CNG
compared to gasoline. CO and HC emissions were reduced by 90 and 12%, respectively,
and NOx emissions were increased by 30% compared to gasoline engine.
Recently Hamid and Ahmad (2002) presented a comparison of the NGV and
gasoline base engine performance where they found the volumetric efficiency of the

10
NGV engine is reduced by about 15% and overall performance lowered by circa 9% at
maximum torque and maximum power conditions.
The substantial advantage that CNG has in anti knock quality is related to the
higher auto ignition temperature and higher octane number compared to that of gasoline
as shown in Table 2.2. Due to such antiknock properties, dedicated SI CNG engines
could potentially be designed with compression ratio (CR) as high as 13:1 (Thomas J.F.,
Staunton R.H., 1999).
Table 2.2: Combustion Related Properties of Gasoline & CNG
Properties Gasoline CNG Motor octane number
Molar mass (kg/mol)
Carbon weight fraction (mass %)
(A/F)x
Stoichiometric mixture density (kg/m3)
Lower heating value (MJ/kg)
Lower heating value of stoic. mixture (MJ/kg)
Flammability limits (vol% in air)
Spontaneous ignition temperature (˚C)
80 -90
110
87
14.6
1.38
43.6
2.83
1.3-7.1
480-550
120
16.04
75
16.79
1.24
47.377
2.72
5-15
645
Note: (A/F)x = Stoichiometric air fuel ratio
Natural gas has a high ignition temperature, about 1,200 ˚ F, compared with about
600 ˚ F for gasoline. It also has a narrow range of flammability that is, in concentrations
in air below about 5% and above about 15%, natural gas will not burn. The high ignition
temperature and limited flammability range make accidental ignition or combustion of
natural gas unlikely. An American Gas Association study reported o injuries or fatalities
after more than a half billion miles driven with natural gas vehicles.
In addition, natural gas vehicle also much safer compared to gasoline-powered
vehicles. The fuel storage cylinders used in NGVs are much stronger than gasoline fuel

11
tanks. The design of NGV cylinders subjected to a number of federally required “severe
abuse” tests such as heat and pressures extremes, gunfire, collisions and fires. NGV fuel
systems are “sealed” which prevents any spills or evaporative losses. Even if a leak were,
occur in an NGV fuel system, the natural gas would dissipate into the atmosphere instead
of forming a spreading pool or vapor cloud on the ground, as other fuels do because it is
lighter than air.
Natural gas is an economical fuel because the use of natural gas is no exception to
that economic rule. In addition, because natural gas is an inherently clean fuel, it reduces
engine wear. Therefore, use of natural gas as a vehicle fuel extends engine life as well as
reduces engine maintenance. Finally, natural gas fuel use decreases the federal trade
deficit. Currently, over 50 percent of the oil currently used comes from imports.
Approximately 90 percent of the natural gas used produced in the United States. It has
been projected that there is an ample supply of Natural Gas and that it will last
approximately 150 years or more as reported by A.J. Taormina (2005).
2.1.3 NGV Technology
There are some recent important advances in NGV technology that will keep the
industry on track with the most advanced technologies being produced by the major
automotive manufacturers. NGVs now are compatible with computerized fuel injected
engines. They are superior to carbureted vehicles because natural gas is injected directly
into the combustion chamber in its gaseous state without having to go through a special
gas/air mixer. This makes the changeover instantaneous from gasoline to natural gas and
back again.
The newest systems are 'closed loop'; they are part of the systems that include
oxygen sensors in the vehicle tailpipe, and provide feedback to the engine control
systems to alter the fuel/air ratio depending upon the requirements of a vehicle's
performance at any given time (Rashidi, 2005). Dedicated natural gas heavy-duty engines
are based on diesel technology, but the engines include spark plugs since natural gas,
unlike diesel fuel, does not combust under pressure. A great deal of development is under

12
way to improve the efficiencies of heavy-duty natural gas engines, and improvements are
occurring rapidly.
Some heavy duty natural gas engines also have used a mixture of 80% natural gas
to about 20% diesel as a 'pilot' fuel that causes ignition under the normal 'heat-of
compression' common in the diesel cycle engine. The dual fuel approach which is
principally used as retrofit systems, have not seen widespread acceptability in countries
where emissions standards are increasingly strict, but the vehicles do perform in such a
mode.
2.2 Global Implementation of NGV
The successful implementation of alternative fuels throughout the world can be
clearly seen from the natural gas vehicle population according to country as shown in the
Table 2.3 below. In some countries, vehicles have been operated on natural gas for over
twenty years without technical problems, as the technology is simple and mature. Even
at this moment, the number of vehicle operating on natural gas is increasing. Apart from
this, the following sub topics that follow describe some examples of the advances,
policies and strategies taken by countries and regions across the planet.
Table 2.3: Natural Gas Vehicle Population Worldwide
Country Vehicles*Refuelling
Stations VRA**
Last Updated
Argentina 1,439,527 1,402 32 Apr 05
Brazil 1,018,163 1158 Oct 05
Pakistan 800,000 740 Jul 05
Italy 382,000 509 May 05
India 204,000 198 Apr 04
USA 130,000 1,340 3,331 Dec 04
China 97,200 355 Jan 05
Ukraine 67,000 147 May 05
Egypt 62,150 90 Sep 05
Colombia 60,000 90 May 05
Iran 48,029 72 Aug 05

13
Bangladesh 44,534 106 8 Nov 05
Venezuela 44,146 149 Apr 04
Russia 41,780 213 15 May 05
Bolivia 38,855 63 Sep 05
Armenia 38,100 60 Feb 05
Germany 27,200 558 779 Apr 05
Japan 25,000 289 686 Sep 05
Canada 20,505 222 3,258 Sep 03
Malaysia 14,900 39 1 May 05
Tajikistan 10,600 53 May 05
Ireland 9,780 10 6 Jul 04
France 7,400 105 209 Jan 05
Sweden 6,709 86 Nov 05
Indonesia 6,600 17 Jul 05
Korea 6,487 170 Feb 05
Thailand 5,500 34 Aug 05
Bielorussia 5,500 24 May 05
Chile 5,500 12 May 05
Moldova 4,500 8 May 05
Bulgaria 4,177 9 May 05
Trinidad & Tobago 4,000 13 Apr 05
Myanmar (Burma) 4,343 14 Nov 05
Mexico 3,037 6 Mar 04
Switzerland 1,346 56 89 Jul 05
Australia 895 12 55 Aug 01
Great Britain 875 34 40 Jul 03
Spain 797 28 21 Jan 05
Poland 771 28 18 Apr 05
United Kingdom 543 31 115 Nov 04
Austria 500 68 58 May 05
New Zealand 471 12 Jun 04
Turkey 400 5 Aug 04
Czech Republic 390 16 6 May 05
Netherlands 348 8 394 Jun 04
Latvia 310 4 5 Oct 04
Belgium 300 5 60 Aug 04
Slovakia 250 7 Sep 04
Portugal 242 5 Jan 05
Hungary 202 13 Feb 05
Norway 147 4 Apr 05
Algeria 125 3 Oct 04
Croatia 100 1 May 05
Serbia 92 2 Dec 04
Finland 84 3 4 Mar 05
Yugoslavia 81 1 Jul 03

14
Nigeria 60 2 May 05
Iceland 45 1 May 05
Cuba 45 1 Feb 01
Greece 40 May 03
U.A.E 35 Dec 05
Macedonia 32 1 Jan 05
Luxembourg 32 3 Jul 04
Liechtenstein 26 1 Sep 04
South Africa 22 1 4 Jan 00
Uraguay 20 Dec 01
Philippines 12 1 Jul 04
Singapore 7 1 May 05
Denmark 5 1 3 Feb 00
Taiwan 4 1 Apr 05
North Korea 4 1 Aug 00
Bosnia 1 1 Apr 05
TOTALS 4,696,881 8,722 9,198
* Includes both OEM and converted NGVs ** VRA = Number of Vehicle Refueling Appliances Source: www.iangv.org
2.2.1 NGV in the United States of America
The Department of commerce (DOC) has issued mandatory guidelines in
February 27, 2003, to all the department bureaus requiring that all light-duty petroleum
fuelled vehicles due for replacement be replaced with alternative fuel vehicles as this
would ensure compliance with Environmental Protection Act and Executive Order
13149. The department of transportation in the final report on “Fuel options for reducing
green house gas emission from motor vehicles” in year 2003 has highlighted the prospect
of alternative fuels within the near-term time horizon. One of these alternative fuels is
the compressed natural gas (CNG), which can be used in both bi-fuel (vehicles that can
operate on either petrol or CNG) and dedicated vehicles (which operate only on CNG).
The exhaust emission reduction by replacing 25% of petrol with CNG would amount to
5-6% when emissions during both vehicle use and fuel production are accounted.
The Alternative Fuel News published by the department of energy of the U.S.,
pointed out that the Natural gas buses emit 40 to 86 % less particulate matter and 38 to 58

15
% less nitrogen oxide than diesel buses. According to “bus features”, natural gas is
“virtually toxic-free, while diesel exhaust contains more than 40 toxic constituents, about
half of which are known or suspected carcinogens.” There are approximately 2,675
alternative fuel school buses operated by nearly 130 school districts across the country.
Majority is located in California, with large number also in Texas, Oklahoma, Indiana,
and Pennsylvania. Several standards and rating systems for green vehicles have been
developed. The Clean Car Campaign, for example, defines a green vehicle as one that is
1.5 times more fuel efficient than the average in its class. This clean car should comply
with the California's super-ultra-low-emission vehicle (SULEV) tailpipe emissions
standards and must be manufactured using non-toxic, recyclable materials.
2.2.2 NGV in Canada
The Ontario’s green energy strategy carried out by the Ontario Government under
the Ministry of Energy, Science and Technology has highlighted the goals of maximizing
energy conservation and the generating capacity for green energy in Ontario. It also plans
to create viable conservation and green energy industry in Ontario to provide consumers
with access to affordable conservation measures and green power options. Reduction in
emission is also a prime target similar to the Kyoto target of a 6% reduction in
greenhouse gases by 2012. Another program that curbs the emission is the Anti Smog
Action Plan target of 45% reduction in nitrogen oxides (NOx) and volatile organic
compound (VOCs) by 2015.
2.2.3 NGV in Latin America and Caribbean
Latin America and The Caribbean (LAC) is among the most urban of the world’s
developing country regions. Indeed, three of the world’s largest cities are found in this
region: Mexico City, Rio de Janeiro, and Sao Paulo. In these cities, motor vehicles
account for virtually all of the carbon monoxide emissions, anywhere from 50 to 90 % of
hydrocarbons, at least three-quarters of nitrogen oxides, and as much as 40 % of
16
suspended particulate matter. The impact on human health of these pollutants is
substantial, especially when they exceed recommended maximum limits. A recent study
by World Resources Institute has found that the level of total suspended particulate is a
major contributor to lung problems in Mexico City, Rio de Janeiro and Sao Paulo. In
addition, both Mexico City and Rio de Janeiro violate World Health Organization
(WHO) air concentration guidelines for sulphur dioxide and nitrogen oxides. Apart from
being the major source of local air pollution in cities, motor vehicles are also the most
rapidly growing source of greenhouse gas emissions in the region, including carbon
dioxide, chlorofluorocarbons, nitrous oxide, and carbon monoxide. The use of natural
gas as a vehicular fuel in Latin America was introduced in Argentina in 1984. With
decades of experience in the industrial and domestic use of natural gas, Argentine
companies soon developed the new market. Chile has an ongoing NGV program, looking
for an answer to the very serious air pollution in Santiago. Bolivia, Colombia, Venezuela,
Mexico have also introduced NGVs. Integration will bring many benefits, but mainly, it
will allow NGV users to move around the area with a clean and inexpensive domestic
fuel.
2.2.4 NGV in Europe
The Commission of European Committees sees three main potential alternative
fuels namely biofuels, natural gas and hydrogen to have high volume potential that could
each be developed up to the level of 5% or more of the total automotive fuel market by
2020. In Italy, 400,800 vehicles run on natural gas provided through a network of 463
refueling points. In addition, 50,000 more vehicles throughout Europe operate on natural
gas. These vehicles normally operate in a limited geographical area and refuel at one or a
few dedicated points. Natural gas has great potential in principle as a motor fuel. It is a
cheap alternative fuel, has a high octane number, is clean and has no problem in meeting
existing and future emission standards. It offers potential for a 20-25% lowers CO2-
emission than the energy equivalent amount of petrol, although no significant CO2
advantage over the more efficient diesel engine. When used in buses, natural gas offers a

17
most welcome noise reduction in cities. Increased use of natural gas would move the
dependency away from the oil market, normally is seen as an advantage.
2.2.5 NGV in India
The significant implications of vehicle emissions have led to control regulations
in conjunction with environment-friendly technologies to reduce vehicle pollution. The
emission norms are being aligned with Euro Standards and vehicular technology is being
upgraded accordingly. Vehicle manufactures are also working towards bridging the gap
between Euro Standards and Indian Emission Norms. Due to the directions from
Supreme Court of India, New Delhi was the first city in India to introduce CNG as a fuel
for all public transports such as buses, taxis and three wheelers. This effort is going to be
implemented in Mumbai followed by Chennai, Baroda, Surat and Kolkata. The demand
for the natural gas engine is tremendous and taking the example of Mumbai market alone,
each bus manufactures can sell on the average 700 to 800 buses per annum for the next
10 years there. India’s leading commercial vehicle manufacturers and gas distribution
agency are working with Canadian firms in acquiring conversion technology including
developing natural gas engines and the latest dispensing infrastructure to suit the Indian
conditions. A study conducted by Bose from the Tata Energy Research Institute of India
to predict the automotive energy use and emission control for Indian metropolis shows
the increase in the use of alternative fuels based on business as usual prediction by year
2010. The following assumptions related to alternative fuels were made based on
business as usual assumption on the model generated:
a) The share of 4-stroke engines in Delhi, Calcutta and Mumbai would increase from
11%–12% to 50%, while that in Bangalore would increase from 20% to 25% with
a view to phase out 2-stroke technologies.
b) It is predicted that 15% of auto rickshaws (tricycle) would run on propane and
10% would run on electricity (battery operated vehicles).

18
c) The share of cars fitted with three-way catalytic converters using unleaded petrol,
battery operated electric cars, and cars that use compressed natural gas (CNG)
cars would increase whereas, the share of old model petrol and diesel cars would
decrease.
d) The share of CNG-powered taxis would increase whereas, that of diesel-powered
ones would decrease, and all taxis using petrol would be fitted with three-way
catalytic converters.
e) The share of CNG-powered and battery operated buses would increase.
f) Sulphur content in petrol and diesel would be reduced to 0.05% and 0.25%,
respectively.
2.3 Vehicle Manufacturers Resolution to NGV
Strong reasons for car manufacturers to embark on alternative fuel strategy is that
it truly mitigates environmental matters such as reduced emission, the technology is
commercially available, it has hand in hand market and technology development and it is
well accepted by customers. In conjunction with this, many vehicle manufacturers have
added models that are readily available to operate on CNG to existing range of models.
The introduction of the “316G Compact” model in December 1995 by BMW became
Europe’s first car maker to add an Original Equipment Manufacturer (OEM) produced
natural-gas powered passenger car to its model program. Volvo Car Corporation has the
S80, V70 and S60 models available in the bi-fuel NGV form and has sold 3500 units in
year 200216. These models are made right from the beginning on the assembly line
causing no after market adaptation.
The potential of a NGV as Environmentally Enhanced Vehicle (EEV) is proven
by The Honda Research & Development Department with there Honda Civic GX17. This
model can meet the Super-Ultra-Low-Emission Vehicle (SULEV) emission standard in
California and also meet the future European & Japanese emission standards. Car maker,

19
DaimlerChrysler now configures many of its vans and ever-popular minivans for natural
gas flex fuelling. The Dodge Ram Van and Ram Wagon are designed to use dedicated
CNG-powered 5.2 liter V8 engines that produces 200 horsepower. Ford’s half-ton
pickups F-150 are produced with CNG-dedicated, CNG bi-fuel and even LPG bi-fuel
power. These are only a fraction of the car makers that included alternative fuel models
in their product line, as they are many other car makers doing the same.
2.4 Implementation of NGV in Malaysia
The implementation of NGV in Malaysia is strongly supported by the Department
of Environment (DOE) whom has been encouraging the use of natural gas as alternative
fuel for motor vehicles, especially by the public service vehicles in urban areas where
piped natural gas is available and where air quality is deteriorating mainly due to motor
vehicle exhaust emission. Other factors that directly contribute to the implication of NGV
in Malaysia are the infrastructure of the Peninsular Gas Utilization (PGU) networks that
supplies natural gas throughout Peninsular Malaysia. The government has introduced
various incentives to boost the number of vehicles by relieving tax on the conversion kit.
The bi-fuel (able to operate on both petrol or gas separately) and duel fuel (operates with
a mixture of natural gas and other fuel) vehicles operating with natural gas are given 25%
road tax reduction, while mono-fuel vehicles that operate solely on natural gas are given
50% road tax reduction.
Existing pipeline systems ensures full coverage and steady supply of natural gas
in most industrial countries especially Malaysia. Natural Gas which composed mainly of
methane is odorized to have a pungent smell using odorizing agent (mercaptans) to ease
detection of its presence. Natural Gas processed by the PETRONAS Gas Processing
Plant (GPP) in Kerteh is sent via the Natural Gas Distribution System (NGDS) to the
conventional NGV refueling stations. The gas is then compressed to 3600psi via three
stage compressors to increase the packing density. It is then stored in a cascading storage

20
bank system before being transferred to the vehicles storage cylinders. The storage
pressures in these cylinders are at 3000psi, giving a pressure gradient of 600psi between
the dispenser and the cylinder for speedy refueling.
The Compressed Natural Gas (CNG) is discharged in two types of stations; one
being the mother stations while the other is called the daughter station. The mother
station has the natural gas supplied via pipeline and it has a three-stage compressor to
convert the natural gas into CNG. The CNG is then stored in the cascading bulk storage
system prior to being sold to the NGV owners. The portable CNG cascading bulk storage
system is charged in the mother station and freighted to the daughter station. This
enables the daughter station to operate without the supply of natural gas via pipeline and
compressor.
2.5 Natural Gas Vehicle Fuel System
There are two types of Natural Gas Vehicle. The first type is specifically designed
to operate on natural gas while the other is a petrol-powered vehicle fitted with a
conversion kit enabling petrol or gas operation with the ease of a switch. Malaysia has
14,900 NGV as up to May 2005 consisted mostly of the second type. A typical petrol
powered vehicle is fitted with a conversion kit to enable the bi-fuel operation that
provides the user with fuel options of either petrol or natural gas with the ease of a
switch. NGV in Malaysia mostly consists of bi-fuel taxis having a 1500cc carburetion
petrol engine. The bi-fuel NGV conversion kit used on the 1500cc carburettor petrol
engines consists of a fuel selector switch, a spark advancer, air fuel mixer, pressure
regulator, CNG solenoid valve, petrol solenoid valve and a storage cylinder.

21
NGV Cylinder
Petrol Tank
Petrol shutoff solenoid valve
CNG Solenoid valve Petrol carburettor
Fuel selector Air fuel mixer
Refuelling connector Pressure gauge
Pressure Regulator
Figure 2.1: Natural Gas Vehicle Bi-Fuel System Components and Layout20
Figure 2.1 shows the position of the various NGV components where the storage
cylinder is placed in the rear trunk while the other components are in the front engine
compartment. A detailed schematic diagram of the bi-fuel system is shown in Figure 2.2.
On the other hand, Table 2.4 shows the description of conversion kit components that are
can be found in the NGV fuel system. The fuel pressure regulator, mounted on the fuel
rail, is used to maintain a constant pressure drive from the fuel rail to the intake manifold.
In the case of CNG, the pressure regulator regulates the CNG from the storage cylinder
according to the engine requirement and sends it to the mixer. In the carburetion fuel
system, this natural gas then enters the air-fuel mixer where it forms a combustible
mixture with air23.

22
Table 2.4: Conversion Kit Components
COMPONENTS DESCRIPTIONS The cylinder The cylinder used to store CNG at a
working pressure of 200bars. It is fitted with a shut-off valve and a safety burst disc.
The Vapor Bag Fitted onto the cylinder, the Vapor Bag used to enclose the cylinder valve and the pipes connecting it and vented out of the car.
The High Pressure Solenoid Allows gas to flow through only when the engine is running and the switch is in the gas position.
The High Pressure Pipe This high pressure pipe connects the refueling valve to the CNG cylinder and pressure regulator
The Refueling Valve The refueling valve is used to refuel the CNG Cylinder
The Pressure Regulator The Pressure Regulator has a Solenoid Valve to shut-off gas supply to the engine. The CNG stored at a high pressure in the cylinder reduced to just below atmospheric pressure by this unit. This negative pressure is also a safety feature that will not allow gas to pass through when the engine is not running.
The Gas Air –Mixer The air/fuel mixer constantly maintained at a stoichiometric ratio and continually adapts the rate flow of gas to engine by means of the linear electromechanical actuator to ensure optimum carburetion in terms of driving, consumption and emission.
The Petrol Solenoid Valve The Petrol Solenoid Valve is used to cut off petrol supply to the engine when it is run on CNG.
The Selector Switch The Selector switch is fitted at the dashboard enabling the driver to choose either the CNG mode or the petrol mode of operation. The electronics built into this unit also ensures safety by switching off the gas solenoid whenever the engine is switched off.

23
Common Air Fuel Mixing CNG System Petrol System
Figure 2.2: Schematic Diagram of Bi-Fuel Mechanism
During normal petrol operation, the petrol solenoid valve is left open while the
CNG solenoid is held shut. This restricts the natural gas from entering the common
carburetion system as shown in Figure 2.2. When the fuel selector switch is turned to
natural gas, the petrol solenoid valve blocks the flow of the petrol to the carburettor while
the current is supplied to the NGV solenoid valve that in turn permits natural gas to flow
into the pressure regulator. The natural gas supplied to the engine is proportional to the
vacuum pressure generated by the air flow through the mixer. The air fuel mixer’s fuel
passage is normally closed and opens at the actuation of a vacuum signal from the engine
cranking or running. This again is a desirable safety feature because if the engine stops or
is turned off, the fuel flow automatically stops.
24
When the mixer receives the desired vacuum signal from the engine, it draws a
metered amount of natural gas from the pressure regulator and blends it with air at the
proper ratio to achieve peak engine performance over the complete operating range. This
vacuum signal generated by the mixer geometry acts on the third stage diaphragm of the
pressure regulator to ensure suitable supply of natural gas according to the engine speed.
The high pressure fuel line between the storage tank and high pressure regulator is fitted
with a quarter turn valve which serves as an emergency shut-off. The high pressure
regulator is equipped with a solenoid valve that permits gas flow only when the ignition
of the vehicle is turned on. The spark advancer is activated during natural gas operation
to alter the spark angle.
The only major difference between a gasoline vehicle and an NGV system is the
fuel system. When natural gas powers the engines, it leaves the storage cylinders, passes
through a master manual shut-off valve, travels through stainless steel lines, and goes to
the engine compartment through a high-pressure pipe, which is also connected to the
refueling system.
2.6 Natural Gas Motorcycle
A prototype model of the natural gas motorcycle was designed and developed by
the Natural Gas Motorcycle (NGM) Research Group under Gas Technology Center
(GASTEG) of UTM back in 1997. The Modenas Kriss 110cc was selected, as it was the
most widely used motorcycle that is made locally. The four stroke natural gas prototype
motorcycle was prepared for testing with a new set of conversion kit that includes a
mixer, a regulator, a storage tank, related control elements and measuring apparatus. The
CNG storage cylinder and pressure regulator were purchased to meet the operating
condition of the new fuel system, while a dedicated air fuel mixer was designed and
fabricated to provide air fuel mixture within the natural gas flammability limit. After the
preparation stage of developing the prototype NGVM Modenas KRISS 110cc

25
motorcycle, the vehicle was evaluated by several tests to attain the engine’s performance,
exhaust emission and the lubrication oil quality in order to conduct a comparison between
the natural gas and petrol operations.
The power output of the engine and exhaust emission data was successfully
recorded using the CycleDyn Pro SF 250 chassis dynamometer and Horiba MEXA 324J
emission analyzer at the Modenas assembly plant in Gurun, Kedah. Physical and
chemical testing on the lubrication oil was conducted in the Laboratory Service Unit
(UNIPEM) of Universiti Teknologi Malaysia. UNIPEM is an accredited laboratory under
SAMM (Sijil Akredetasi Makmal Malaysia) (ISO/IEC G25) scheme Exhaust emission
test was conducted at constant speed using the standard procedure from ISO 3929. The
physical and chemical testing of the lubrication oil were based on ASTM standards as
outlined in the following section. The results of both tests together with the methods that
were taken to conduct these tests are described in depth in the following sections. In
general, the NGM offers great advantages over petrol operation in terms of emission
where the carbon monoxide (CO) is reduced by 99.7% while the unburned hydrocarbon
(HC) emitted is reduced by 79.3% compared to petrol operation. The degradation of the
engine oil after operating for a distance of 2500 km, favors the natural gas over petrol.
However, power is reduced by 15% at high engine speeds due to the gaseous medium of
the natural gas displacing the amount of air induced.
The power loss disadvantage of natural gas operation (that may be altered by
modifications) is compensated with advantages in emission and lubrication oil quality as
both tests favors natural gas operation. Various modifications could be made to improve
the natural gas operation. This includes the ignition spark advancement to compensate the
slow flame speed of natural gas combustion. The compression ratio could be increased to
suite the natural gas combustion. The air fuel mixture could be modified between lean
and rich to suite the engine power requirement. The injection system is also a simple way
to enhance performance of the natural gas fuel system.

26
2.6.1 Natural Gas Motorcycle Performance and Emission Test
The performance test was previously conducted to obtain the maximum engine
power output and the vehicle velocity. The results obtained at wide-open throttle with
manufacturer ignition timing setting showed that the natural gas operation had 10 to 15 %
power loss at high engine RPM compared to the petrol operation. The top speed of 105
km/hr achieved during petrol operation decreases to 92 km/hr during natural gas
operation. The engine operating at maximum speed was supplied with 24 liters/ min of
natural gas supplied at 5 psi. This performance depletion is caused by the gaseous phase
of the fuel which displaces the amount of air induced at high engine velocity. This is not
experienced during the petrol operation as the petrol is in liquid form. Other contributing
factor towards the performance drop of the natural gas operation is slower flame speed
compared to petrol. The octane rating of natural gas is 130 whereas the petrol has 92-98
RON rating. This requires the natural gas to operate at a compression ratio of 16:1 while
the engine under study has a compression ratio of 9.3:1. The specification of
PETRONAS Primax PX2 petrol and the natural gas used for the testing are given in the
Tables 2.5 and 2.6 as provided by PETRONAS.
Table 2.5: Natural Gas Composition
Component Mol% C6+ 0.07 C3 0.90 iC4 0.29 nC4 0.13 iC5 0.07 N2 0.68 C1 93.07
CO2 1.10 C2 3.70
Density 0.7404 kg/sm3 Relative Density 0.6042
Molecular Weight 17.4663 Gross Calorie Value 39.20 MJ/sm3

27
Table 2.6: Petrol Specification
Description Value Density @ 15°C, kg/l 0.733
Research Octane Number (RON) 97.0 Lead Content, kPa 0.008
Reid Vapour Pressure, % wt 62 Total Sulphur Trace
Distillation 50% evaporated, °C 90% evaporated, °C
105 152
Colour Yellow The exhaust emission for both petrol and natural gas were analysed at idle and
average speeds of 40 to 90km/hr. This emission analysis is in accordance with the ISO
3929 test procedure. The motorcycle evaluated on a chassis dynamometer at various
constant speeds: idle, 40 to 90km/hr, respectively using the Horiba MEXA 324J infrared
emission analyzer. The carbon monoxide (CO) emission analysis at idle speed shows that
the natural gas powered motorcycle releases an average of 0.02% volume compared to
3.99% volume for petrol operations giving 99.7% reductions over petrol operation this is
due to the complete combustion of natural gas with air. The amount of unburned
hydrocarbon (HC) emitted by natural gas motorcycle detected was 79.3% lower than
petrol powered motorcycle, which is equivalent to 48.875 ppm volume at idle speed.
2.6.2 Natural Gas Motorcycle Lubrication Oil Test
Locally produced engine oil, PETRONAS Sprinta 4XT, was used for the test.
After running at a constant speed of 4265rpm for a distance of 2500km using natural gas
and petrol, respectively, the engine oil was tested for its physical and chemical properties
using ASTM Standards as shown in Table 2.4. The stable engine oil temperature after
certain duration of operation at 4265rpm was attained at 85.5°C for petrol while natural
gas operation was at 57.8°C. These operation temperatures are known to influence the
deterioration and the quality of the engine oil. The cooler temperature during natural gas

28
operation is due to the lower calorific value of the air fuel mixture. Table 2.7 represents
the quality of engine oil after running 2500km on both fuels.
The sulphated ash content test result provides the chemical characteristic changes
to the physic of the engine oil. The test is important because an increase in ash content of
used oil usually indicates combustion chamber deposits and top ring wear problem or a
build-up of contaminants. Build-up contaminants are commonly contributed by dust, dirt,
wear debris and possibly other contaminations such as lead salts, which are derived from
the combustion of the leaded petrol in internal combustion engines. This study showed
that the ash content in the lubricant oil operated with natural gas increases only by 2.06%
while petrol caused an increment of 6.89% compared to the unused lubricant oil.
Table 2.7: Engine Oil Properties and Standard Testing Method
Test Standard
Sulphated ASTM 874 -92 Carbon Residue content (MCRT method) ASTM D 4530 – 30
Kinematic Viscosity ASTM D 455- 94 Colour (ASTM Colour Scale) ASTM D 1500 -91
Flash Point (Cleveland Open Cup) ASTM D 92 – 90 Pour Point ASTM D 97 – 93
Density, Specific Gravity, API Gravity ASTM D 1298 – 85 Engine Oil Samples
Properties Unused Used With Natural Gas
Used With Petrol
Ash Content (wt%) 1.45 1.48 1.55 Carbon Residue (wt%) 1.09 1.19 1.30 Cloud point (°C) -5.88 -5.83 -6.21 Colour ASTM L4 D8 D8 Density 893.8 893.8 894.8 Specific Gravity 0.8943 0.8943 0.8953 API gravity 26.83 26.83 26.66 Flash Point 248 258 246 Water content 0 0 0 Kinematic Viscosity (40°C), cSt 151.3 129.2 122.1 Kinematic Viscosity (100°C), cSt 16.57 14.79 14.31

29
The carbon residue of lubricating oil is the amount of deposit left after
evaporation and pyrolysis of the oil under prescribed conditions. In an internal
combustion engine, carbon is deposited on the cylinder head and piston crown. This
carbon is from the incomplete combustion of the fuel as well as the carbonizing of the
engine oil carried over by the piston rings into the combustion chamber. The increase of
carbon contamination in the lubricant oil will decrease the viscosity of the oil. The carbon
residue is increased by 8.4% for the natural gas operation while the petrol operation
caused an increase of 19.3% compared to the unused engine oil.
Since both density and specific gravity change with temperature, determinations
are made at a controlled temperature and then corrected to a standard temperature by
using special tables. However for the used lubricant oil, a decrease in specific gravity
(increase in API gravity) may indicate that the fuel is diluted, whereas an increase in
specific gravity might indicate the presence of contaminants such as fuel soot or oxidized
materials. The API gravity value based on the ASTM D1298-85(90) for the oil used with
natural gas shows no changes compared to the unused oil, whereas the oil operated with
petrol shows a decrease of 0.6%.
The viscosity of any fluid changes with temperature where the decrease in
temperature will increase the viscosity and vice versa. Two temperatures most often used
for reporting viscosity are 40°C and 100°C. Plotting these points on special viscosity
temperature chart developed by ASTM would provide linear correlation between these
points. The kinematic viscosity conducted at 40°C for the natural gas operated engine oil
decreased by 14.6% while the petrol operated engine oil decreased by 19.3%. Similar
patterns are observed in the kinematic viscosity test conducted at 100°C. The ability of
the engine oil to lubricate the engine component depletes proportionally to the
degradation of its kinematic viscosity. The success of the NGM is clear at this point. The
fuel system implied on board the NGM is described to provide the reader with an overall
picture to enhance understanding.

30
2.7 Natural Gas Motorcycle Second Generation Fuel System
The successful testing elaborated in Section 2.7 uses the standard Modenas Kriss
110cc carburetion system fitted with a natural gas and air mixer as shown in Figure 2.3.
The air fuel mixer was supplied with 5psi of natural gas that was regulated from a storage
supply of 1800psi by two regulators. This first mixer was then again modified with the
aid of computational fluid dynamics to obtain better mixing. After all the optimisation
done on the carburetion system the only way to further improve the air fuel mixing
system is to introduce the fuel injection system. There are generally two types of fuel
metering devices employed on internal combustion engines being the carburetion system
or a fuel injection system.
Carburettor with air fuel
mixer
Combustion Chamber of
engine
Exhaust
Air intake from atmospheric
Air exhaust to atmospheric
Figure 2.3: Natural Gas Motorcycle First Generation Fuel System Schematic Diagram.
The fuel metering device for the carburetion system is called an air fuel mixer.
This device is pneumatically operated where the air entering the carburettor generates
strong static pressure vacuum based on the venturi effect. This pressure vacuum acts on
the final stage of the pressure regulator to draw more natural gas to mix with the
increasing amount of air entering the carburettor.
31
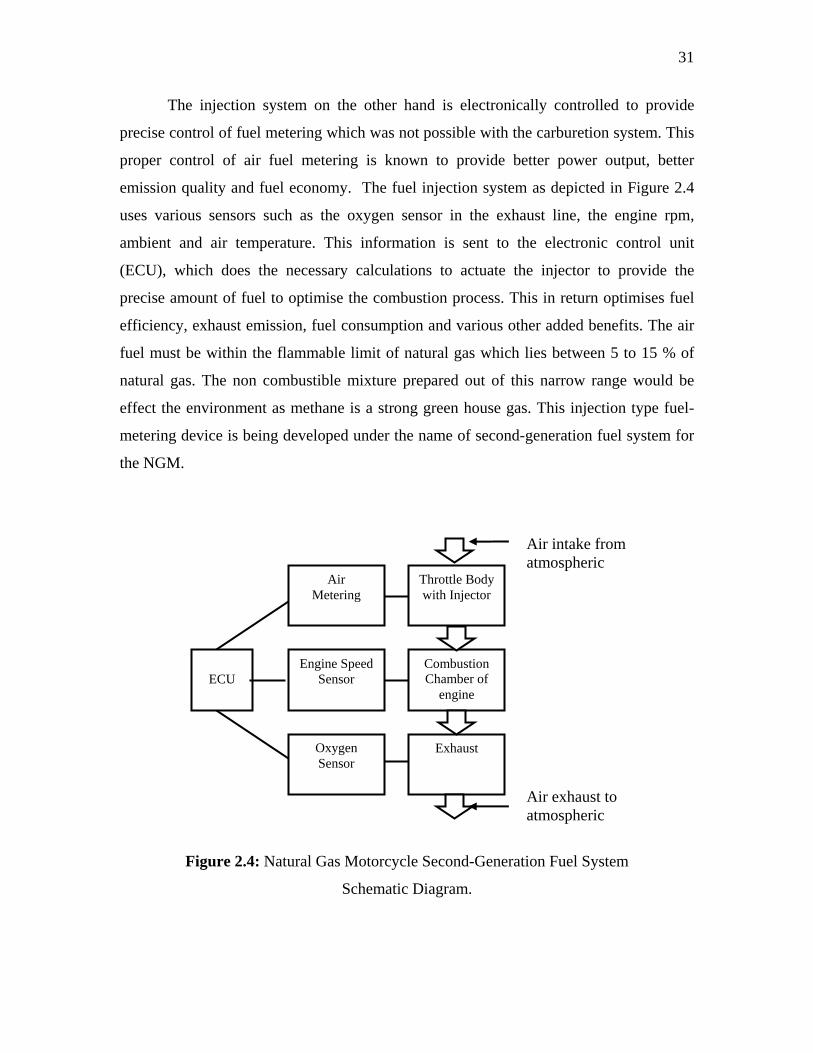
The injection system on the other hand is electronically controlled to provide
precise control of fuel metering which was not possible with the carburetion system. This
proper control of air fuel metering is known to provide better power output, better
emission quality and fuel economy. The fuel injection system as depicted in Figure 2.4
uses various sensors such as the oxygen sensor in the exhaust line, the engine rpm,
ambient and air temperature. This information is sent to the electronic control unit
(ECU), which does the necessary calculations to actuate the injector to provide the
precise amount of fuel to optimise the combustion process. This in return optimises fuel
efficiency, exhaust emission, fuel consumption and various other added benefits. The air
fuel must be within the flammable limit of natural gas which lies between 5 to 15 % of
natural gas. The non combustible mixture prepared out of this narrow range would be
effect the environment as methane is a strong green house gas. This injection type fuel-
metering device is being developed under the name of second-generation fuel system for
the NGM.
ECU
Throttle Body with Injector
Air Metering
Combustion Chamber of
engine
Oxygen Sensor
Engine Speed Sensor
Exhaust
Air intake from atmospheric
Air exhaust to atmospheric
Figure 2.4: Natural Gas Motorcycle Second-Generation Fuel System
Schematic Diagram.
32
The supply of natural gas to the fuel-metering device regardless of types requires
attention as it depicts the density and energy of the gas supply. This is a crucial criterion
on the fuel metering devices performance. The key component that links the storage and
the fuel-metering device is the pressure regulator. The previous pressure regulator used
with the first generation fuel system provided 5 psi of pressure to the air fuel mixer
attached to the carburettor. This pressure would not be sufficient for the second-
generation fuel system, as the injector requires operating on a choke condition that
requires greater supply pressure from the pressure regulator.

CHAPTER 3
PRESSURE REGULATOR
3.1 Pressure Regulation System
Fluids are generally divided into liquid and gas, where the compressibility of gas
significantly improves the packing density compared to liquid. For this reason, gas is
generally stored and distributed in the compressed form. A pressure regulator is required
to reduce the pressure of the compressed state of the gas to a lower desired pressure
regardless of the demand posed on the line. This clearly indicates that a regulator is
required to reduce and maintain downstream pressure regardless of upstream conditions.
A number of examples of pressure regulator encountered in our life are elaborated in the
paragraphs below. Open source systems such as gas transmission pipelines transport
natural gas from one place to another, usually over long distances. Control valves, pilot-
operated regulators, and relief valves are used to control the pressure and flow of gas
through these pipelines. Fuel gas regulators are used to control the gas pressure to a
burner. Accurate pressure control is a vital factor that affects the efficiency of the burner.
The regulator must maintain the pressure within a specified range regardless of flow to
ensure perfect combustion of the fuel. The ideal mixing pattern of air and fuel will give
the desired energy output from the burner.
Although the duty of the regulator in every application is deemed similar, the
regulator requirements relatively differ. Regulators used for LPG gas regulation has
certain standard that it should meet as the gas is flammable. The regulator truly is the
heart of any LPG installation system. It must compensate for variations in tank pressure

34
from as low as 8 psi to 220 psi and still has an ability to deliver a steady flow of LPG at
11" w.c. to the consuming appliances.
Regulators used with oxygen lines also have designated standards that cover its
appropriate application. The application determines the design and shape of the regulator
whereas the flow rate and pressure variation depicts the size. High flow rate pressure
regulators used in the natural gas city gates are very large in size while the regulators
used with the domestic LPG tanks are relatively small in size. The components within
this device that are designed and arranged to perform its precise task will be elaborated
within this chapter.
3.1.1 Pressure Regulator Components
Pressure regulators are produced in many sizes and configurations, but all are
bounded to three basic components namely the regulator body, the regulator trim and the
actuator. These components can be further described in terms of elements that are the
restricting, loading and measuring. The regulator trim is the restricting element, while the
actuator is a combination of the loading and measuring element. Each part of the pressure
regulator components is described in greater depth in the following sections. Figure 3.1
describes the position of these components. It clearly shows that the spring that is the
loading element is seated against the diaphragm. This loading element exerts force
against the measuring element that is the diaphragm.
The spring permits the gas to enter the regulator compartment while the
diaphragm restricts the entrance of gas. Both these loading and measuring element
controls the restricting element. The restricting element consists of the valve seat and
valve pad or obturator. Other supporting elements are added to aid this mechanism. This
includes the support disc that supports the diaphragm, set point screw that varies the
spring force, vent that enables the movement of air from the compartment above the
diaphragm. The cap secures the set point screw from unwanted adjustments, while the

35
regulator bonnet cover combined with the pressure regulator body houses all the
components that form a pressure regulator.
11
10
9
8
7
5
4
6
No Component Name No Component Name 1 Spring 2 Diaphragm 3 Obturator 4 Threaded Fastener 5 Regulator 6 Support Disk 7 Set Point Screw 8 Bonnet Cover 9 Cap 10 Valve Seat 11 Breather Vent
Figure 3.1: Components of Typical Spring Loaded Pressure Regulator

36
3.1.2 Pressure Regulator Body
The regulator body in this context refers to the structure that houses the valve trim
and actuator. It provides support to all the other components and ensures that the fluid
flow is leak tight. Regulator bodies are frequently designed with a bonnet or top closure
piece to ease maintenance and assembly. The bonnet of the valve body serves as a guide
to the spring that actuates the valve movement. Careful packing and adjustment is
required particularly when the valve is fitted with a spring and diaphragm actuator. This
is to ensure the clearances between the relevant components are properly set. The bonnet
or upper part of the valve body generally contains the means for mounting the spring
which pairs with the diaphragm to actuate the valve.
Sealing gasket maintains pressure tightness. The types and selection of sealing
gasket largely depend on the conditions of service. Suitable threaded fasteners are used to
ensure the bonnet is fastened on the body against various internal forces. The external
geometry of the pressure regulator body requires various design considerations that
having prime focus on the regulator body minimum wall thickness and the required
threaded fasteners to hold the bonnet cover in position.
3.1.3 Pressure Regulator Valve Trim
Valve trim refers to those internal parts controlling the flow and in physical
contact with the line fluid, comprises of plugs or disc, seat(s), bushes, guides, cages and
stem. The valve trim of the actuator control portion generally includes an obturator and
seat. The movement of the plug or disc relative to the seat regulates the amount of fluid
passing, which may be linear or rotary, depending on the type of valve being considered.
There are five basic designs of valves, which are distinguished by the operation
motion of their closure device (obturator) and the direction of low in the seating area.
37
1) Gate Valve: A valve where the closure device moves in a straight line and, in
the seating area, across (at right angles to) the direction of flow. This sliding
method causes the closure member to slide across the valve seat face to open
or close the valve.
2) Globe valve: A valve in which the closure device moves in a straight line and,
in the seating area, longitudinally (parallel) to the direction of flow. This
closing method causes the closure member to move away from or towards the
valve seat to open or close the valve. Closure is achieved by abutment against
the seat face or by projection into the seat orifice.
3) Plug and Ball valves: Valves that has the closure device which rotates about
an axis at right angles to the direction of flow and, in the open position the
flow passes through it.
4) Butterfly valve: A valve wherein the closure device rotates about an axis at
right angles to the direction of flow and, in the open position, the flow passes
around it.
5) Diaphragm (pinch) valve: A valve in which the closure device is provided by
the deformation of a flexible diaphragm or tube. This implies the flexing
method where the opening and closing is achieved by flexure of a resilient
membrane within the valve body.
Many types of valves have been used as control valves, with varying degrees of
success, but for many years the most commonly used and supplied type was the globe
style. The most suitable restricting method to be employed in the regulating valve design
would be the globe valve type36. This valve is designed to regulate or stop the flow of
fluid and can be applied in all positions between fully open and fully closed. The glove
type valve has high flow resistance that frequently creates turbulence, resulting in a
significant pressure drop.
38
3.1.4 Pressure Regulator Actuator
An actuator provides the force necessary to move the plug or disc and maintain it
in the desired position against the fluid line forces. Pneumatically operated control valve
actuators are the most popular type in use, but electric, hydraulic, and manual actuators
can also be used. The spring and diaphragm pneumatic actuator is commonly specified
because of its dependability and its simplicity of design. The net output thrust is the
difference between the diaphragm force and the opposing spring force. Molded
diaphragms are used to provide linear performance and increase the traveling distance.
The size of diaphragm actuator dependence on the output thrust required and the
availability of pressure supplied. They are simple, dependable and economical to use.
Electric and electro-hydraulic actuators are considered as more complex and relatively
expensive than pneumatic actuators. The pneumatic system requires pressured air supply
to actuate the pressure regulator accordingly to maintain the downstream pressure. The
diaphragm spring type offers advantage over the pneumatic system where no air supply is
available, where low ambient temperatures could freeze condensed water, in pneumatic
supply lines, or where unusually large stem forces are needed.
The study will focus on the diaphragm and spring combination as the actuating
system due to its advantages over other methods. It also suits the condition under study
best. The designs of the most popular actuator styles for pressure regulators are
diaphragm and spring. The diaphragm actuator is pressure operated which is done by
tapping the downstream pressure that is sensed by the diaphragm. The diaphragm then
retracts the actuator stem or vice versa to ensure the downstream pressure is at the set
point level.
The diaphragm under development would also play the role of a gasket that is
placed between the regulator body and its bonnet cover. For this reason the material that
is selected must be of a suitable type to serve as a gasket as well as a diaphragm. One of
the most widely used materials for such condition would be the three ply fabric inserted
elastomer. This diaphragm’s prime duty is to convert the pressure of the fluid in terms of

39
movement that would be balanced by the spring to actuate the obturator. Circular shapes
are preferred to ensure proper force distribution of the fluid onto the diaphragm. This
proper force distribution ensures the stability and workability of the components within
the regulator.
The need of a loading element is to provide force to the restricting element to
open and to provide resistance to the closure by the measuring element according to the
set point pressure. This indeed proves that the loading element should be of an elastic
type of design. The spring is the best candidate for the job. Springs are often considered
to be one of the most important yet most difficult items to design. In many cases the
spring is considered the most troublesome part of a machine or mechanism. This applies
great responsibility on the product manufacturer and the spring manufacturer to produce a
reliable system that ensures proper workability. Both parties would benefit if the designer
devotes a little more time on investigating the wide variety of materials and the simplified
design procedures available.
Comprehensive evaluation on the design requirement during the preliminary
design stage would help minimizing trouble, reduce breakage and extend fatigue life. The
springiness of metals is related in a general way to their hardness. Lead, for example, is a
soft, with virtually no ‘spring’ properties, and extreme hardness. On the other hand,
results in lack of spring properties, as the material is brittle rather than ‘elastic’. The
range of suitable spring materials should combine suitable hardness with elasticity.
Springs come in various forms that in general can be categorized into three groups,
compression, extension and torsion. The compression type is the most widely used type
as it has several benefits (discussed later) over the other types.
40
3.2 Basic Operating Element of Pressure Regulator There are three basic operating element of pressure regulator, which is:
i. Loading Mechanism
ii. Sensing Element
iii. Control Element
3.2.1 Loading Mechanism
Loading mechanism is used to determine the setting of the regulator delivery
pressure. Spring normally used as the loading mechanism. When the regulator hand knob
is turned, the spring is compressed. Force that is placed on the spring is communicated to
the sensing element and the control element to achieve the outlet pressure.
3.2.2 Sensing Element
Sensing element senses the force placed on the spring to set the delivery pressure.
Most regulators used a diaphragm as the sensing element. The diaphragm may be
constructed of elastomers or metal. The sensing element communicates this change in
force to the control element.
3.2.3 Control Element
In this control element, valve normally used to accomplish the reduction of inlet
pressure to the outlet pressure. When the regulator hand knob is turned, the spring
(loading mechanism) is compressed. The spring displaces the diaphragm (sensing
element). Diaphragm then pushes on the control element, causing it to move away from
the gas pressure regulator’s seat. The orifice becomes larger in order to provide the flow
and pressure required.

41
3.3 Operation of Pressure Regulator
This section elaborates the operation of the pressure regulator that incorporates
three elements within its structure. The combined motion of the entire mechanism is
described with the aids of a simplified example shown in Figure 2.6 below. The
restricting element determines the amount of gas being transferred from the upstream-
pressurized compartment to the downstream-regulated compartment. A spring rests on
the diaphragm, while vent holes allow atmospheric pressure to reach the atmospheric side
of the pressure reducing stage. The loading element encourages the restricting element to
permit gas from the upstream to flow to the downstream. The measuring element moves
against the loading element to restrict the gas flow to reduce the downstream pressure.
When the downstream pressure is lower or equivalent to the set-point pressure, the spring
is fully extended, the diaphragm is in a relaxed position while the valve seat is fully open
as shown in Figure 3.2.

42
Atmospheric Pressure
Downstream Pressure
Upstream Pressure
Figure 3.2: Schematic Diaphragm of Open Restricting Element.
When downstream demand reduces, the pressure build-up causes the regulator to
react to reduce and maintain the downstream pressure. These downstream pressure built-
up acts on the diaphragm causing the diaphragm to push against the spring force. This
will cause the restricting element to prevent upstream pressure from being transferred
downstream as shown in Figure 3.3. This inevitably reduces the flow to the downstream
and maintains the downstream pressure close to set point pressure. Once the downstream
pressure is lower then the set point value, the loading element would open up again and
permit gas to flow downstream. This set-point pressure is the relation between the forces
of the fluid pressure translated to force that is measured and countered by both loading
and measuring element.
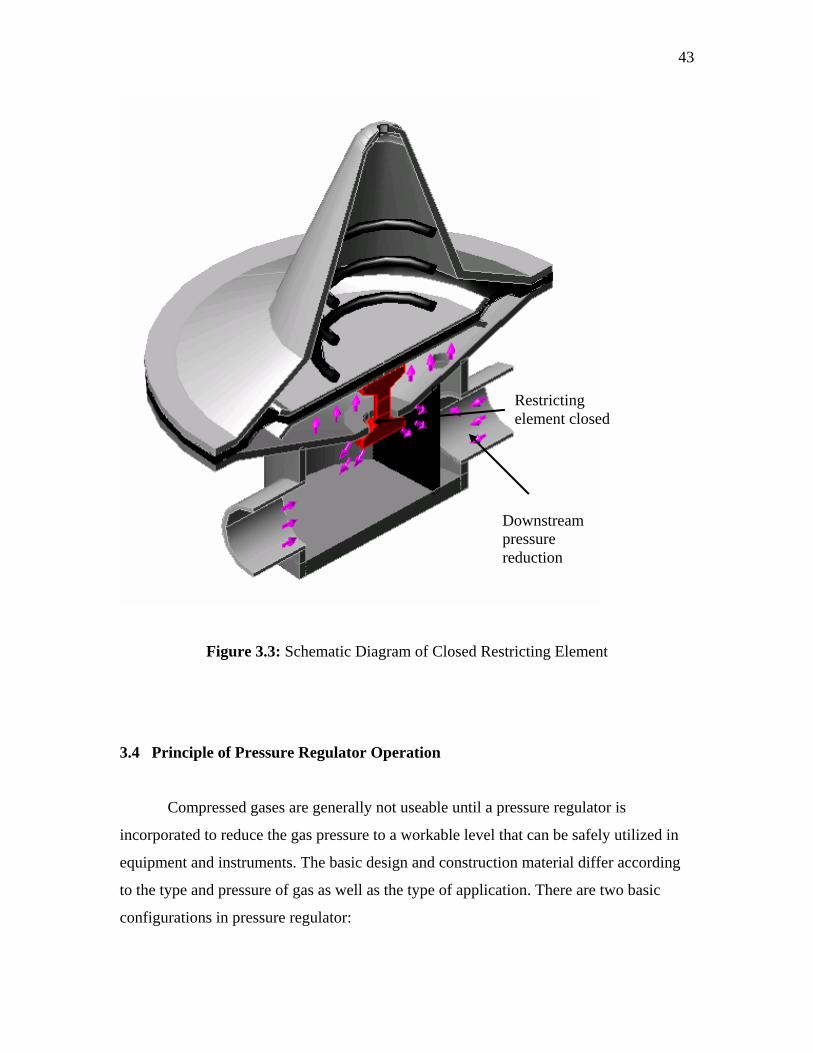
43
Restricting element closed
Downstream pressure reduction
Figure 3.3: Schematic Diagram of Closed Restricting Element
3.4 Principle of Pressure Regulator Operation
Compressed gases are generally not useable until a pressure regulator is
incorporated to reduce the gas pressure to a workable level that can be safely utilized in
equipment and instruments. The basic design and construction material differ according
to the type and pressure of gas as well as the type of application. There are two basic
configurations in pressure regulator:
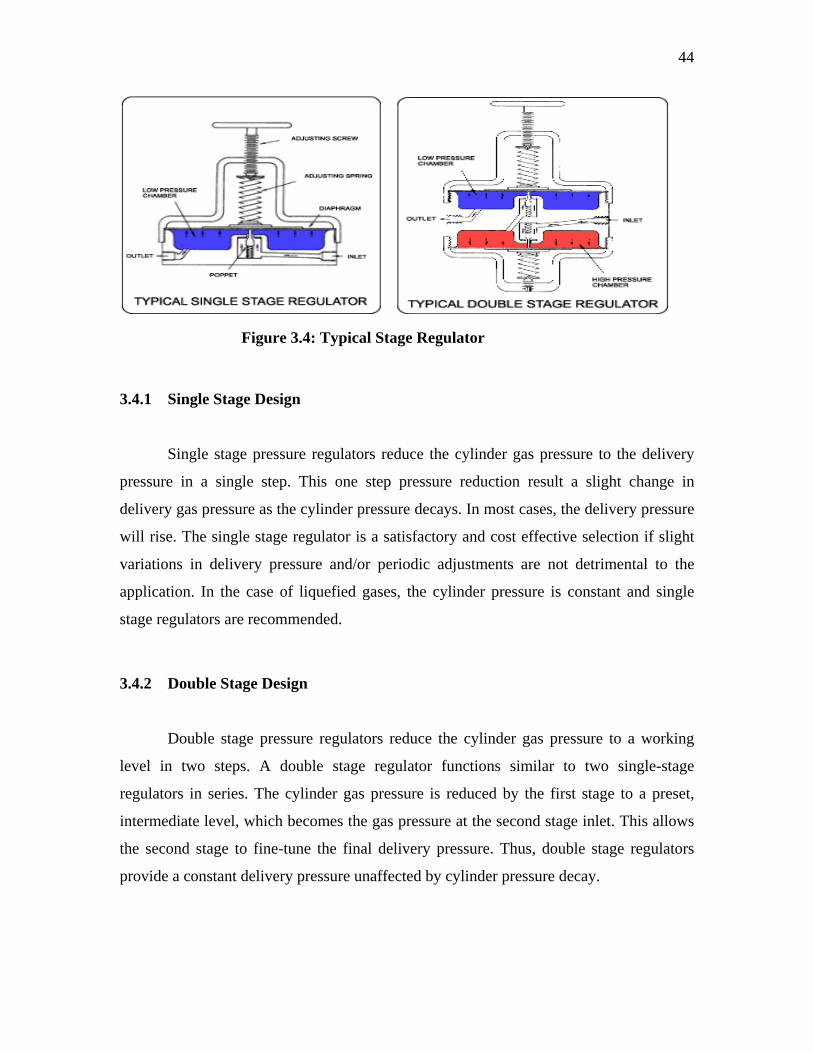
44
Figure 3.4: Typical Stage Regulator
3.4.1 Single Stage Design
Single stage pressure regulators reduce the cylinder gas pressure to the delivery
pressure in a single step. This one step pressure reduction result a slight change in
delivery gas pressure as the cylinder pressure decays. In most cases, the delivery pressure
will rise. The single stage regulator is a satisfactory and cost effective selection if slight
variations in delivery pressure and/or periodic adjustments are not detrimental to the
application. In the case of liquefied gases, the cylinder pressure is constant and single
stage regulators are recommended.
3.4.2 Double Stage Design
Double stage pressure regulators reduce the cylinder gas pressure to a working
level in two steps. A double stage regulator functions similar to two single-stage
regulators in series. The cylinder gas pressure is reduced by the first stage to a preset,
intermediate level, which becomes the gas pressure at the second stage inlet. This allows
the second stage to fine-tune the final delivery pressure. Thus, double stage regulators
provide a constant delivery pressure unaffected by cylinder pressure decay.

45
3.5 Natural Gas Vehicle (NGV)Pressure Regulator
The pressure regulator is a pneumatic or electro-pneumatic device designed to
reduce the cylinder pressure close to atmospheric level and to supply fuel on engine
demand. The function of a pressure regulator is to regulate the storage pressure to suit the
fuel metering device regardless of the flow rate. This is achieved by the regulation of the
line fluid quantity through the restricting valve. Tight closure may be obtained but this
should be a secondary consideration in the choice of equipment. Without accurate
pressure regulation it is difficult, and costly, to obtain low emissions and good
performance benefits from NGV. All CNG vehicles operating as mono-fuel, dual-fuel or
bi-fuel uses similar type of pressure regulator. Early developments resulted in the spring
and diaphragm pneumatic actuator which, on attachment to the valve, made remote
operation possible. Among all types of regulator, the direct acting type is the most widely
used with the NGV fuel system.
The self-acting regulator or reducing valve is generally acknowledged to be the
forerunner of the modern control valve. The regulator design changes according to the
manufacturer but they utilize three basic elements, namely the restricting element,
loading, and measuring. The restricting element is a variable orifice, controlled directly
or through a lever action by the measuring element. Typically the variable orifice is a
combination of a fixed orifice and a moveable seat disc. The fixed disk is made from a
soft material like rubber to insure tight sealing when fully closed. The loading element
can either be a weight, spring or a pressurized area that acts to counter the force exerted
by downstream pressure on the underside of the measuring element. The measuring
element is usually a diaphragm made of a gas tight flexible material, which senses
downstream pressure and moves up or down to open or close the restricting element.
Sensing from the line fluid and utilizing the pressure energy available, the valve
controls the flow to give a regulated condition downstream. The valve controls flow by
absorbing pressure from the line fluid, the quantity passing being a function of the
pressure drop across the valve. Movement of the valve plug in relation to the seat

46
provides an orifice of variable area that is utilized to regulate the flow from minimum to
maximum. The pressure regulator inlet is equipped with an electrical operated solenoid
valve. This solenoid permits the high pressure gas to flow into the regulator only when
required by the engine. Due to the pressure drop that occurs in the regulator, the natural
gas may cool to temperature below to water freezing point. This may hinder the operation
of the regulator as icing of the water condensate in the natural gas may form. The NGV
regulators are provided with engine radiator water circulation to ensure the gas leaving
the regulator is at constant temperature. The fluctuation of gas temperature may affect the
density of the gas which would interrupt the operation of the fuel metering device.
The ISO 15500 covers all the components related to the NGV fuel line. Part 9 of
the ISO 15500 cover the NGV pressure regulator requirements. The local Malaysian
standard MS 1096 covers the installation of the NGV fuel system on board vehicles.
Market research indicates the design criteria for an NGV pressure regulator requires the
following considerations as highlighted by Heenan below.
a) Many mounting options
b) Small, neat architecture
c) Low cost
d) “Instant On” high pressure solenoid (HPS)
e) Automotive durability
f) Easy filter change
g) High flow
h) Integral fuel pressure sender (FPS)
i) Light weight
j) Good transient response
k) Controlled heat exchange
l) Low Pout error

47
Among these considerations the flow performance, heat exchange control and
outlet pressure error are the prime governing factors that effect the performance of the
regulator. The next chapter elaborates on the methodology of this study.
3.5.1 Typical NGV Regulator System
The electronic control device to reduce the natural gas pressure will allow a
regular flow of gas every time the engine requires it. It is equipped with three natural gas
reduction stages that allow stability at both high and low pressures and a high pressure
solenoid valve upstream from the first stage. The absorption of heat, taken from parts of
the regulator heated with the liquid of the engine cooling circuit, prevents the natural gas
freezing during the fall in pressure phase. The flow of gas necessary for engine idling has
a positive pressure from the second stage and is activated by means of a gas pipe
separated from the main flow. It includes an electronic starting device with a built-in
safety system that trips and shuts off the gas solenoid valves if the engine is switched off
or even stalls. Figure 3.5 shows the figure of TN I SIC Regulator produced by
Landirenzo.
(Source: http://www.landi.it/eng/prodotti/scheda_prod_met536116000.html) Figure 3.5: TN I SIC Regulator produced by Landirenzo

48
3.6 Pressure Regulator Types
Pressure Regulators also known as Pressure Control Valves or Pressure Reducing
Valves are used to control pressure in a system and do not require an external power
source to activate them. These regulators are installed where it is required to reduce from
one level of pressure to another, while providing the required fluid flow to satisfy a
downstream demand, irrespective of fluctuations in the inlet pressure or flow demand.
The valve is automatic in operation. Self- operating valves can be designed with a single
seat, which usually indicates the ability to close tight under “no flow” or “dead end”
conditions, or they can be of double seat construction, which improves the maximum
flow rate and accuracy of pressure control, but incurs the penalty of the loss of ability to
control pressure at zero or very low flow rates. Self-operated pressure reducing valve
falls into two main categories, direct acting and pilot operated.
In the case of direct acting valve, the controlled pressure acts directly through a
diaphragm, piston or bellow against an imposing force from a compressed helical spring,
weight or weighted lever, or from compressed air (accumulator). The construction is
simple and robust and based on the axiom that the simpler a control system the better it is
(as long as it is functional). Such a valve can provide long life, with maintenance free
operation, even under adverse working conditions. Although the pressure control
provided by the direct acting valves is not as accurate as with pilot operated valves, they
are less costly and have many applications for which the fine control offered by the pilot
would be unnecessary. Because of the complexity of design, pilot operated valves
require regular maintenance and clean working conditions.
CHAPTER 4
DESIGN AND DEVELOPMENT
4.0 Introduction
The sole dependency on conventional fuel for vehicles and its polluting emission
has caused the growth of alternative fuel vehicles. Natural gas is the most widely used
alternative fuel as described vividly in Chapter 2. The commercially available fuel system
described in Chapter 2 serves as a basis for the new fuel system design. The natural gas
motorcycle’s successful implementation of the alternative fuel is elaborated in previous
chapter. This has been the prime driving force of this current study which is the second
generation fuel system for the natural gas motorcycle. This second generation fuel system
is compared with the first generation fuel system to identify its strength. Due to the
variation of the second generation fuel system, new components are required to be
developed. This point is described in as the problem statement which then moves on the
research objectives in Section 1.3. This methodology chapter is derived from the scope of
work given in Section 1.4. The flow diagram in Figure 4.1 provides the frame work for
the entire study and the following sections describes them in detail.

50
Regulator Prototype Design
Restriction Design
Actuator Design
Regulator Body Design
Computational Fluid Dynamic Flow Study
Spring Diaphragm Leverage
Pressure Vessel Code
Threaded Fastener
Regulator Prototype Fabrication
Parameter Selection & Boundary Conditions
Regulator Prototype Testing
Findings and Recommendation
Bi-Fuel System Pressure Regulation Study
Figure 4.1: Methodology Flow Diagram of Study

51
4.1 Bi-Fuel System Pressure Regulation Study
A bi-fuel engine test skid as discussed in Section 2.1.4 is designed and fabricated
to form strong theoretical and practical understanding on its functionality and operation.
A Proton Magma 1.5 litre 12 Valve carburettor engine is fitted with an NGV conversion
kit to form the bi-fuel engine test skid. This kit consists of a fuel selector switch, a spark
advancer, air fuel mixer, pressure regulator, CNG solenoid valve, petrol solenoid valve
and a storage cylinder. The working of this system has been described in depth in Section
2.1.4. All three mounting points are made adjustable in both horizontal and vertical
direction to aid the alignment of the engine. The test skid has closure panels to safe guard
the operator from moving component hazard. The skid is also fitted with wheels to ease
the maneuvering of the skid. The skid metal structure is coated with epoxy (powder
coating) to avoid corrosion caused by extreme working conditions in terms of heat and
corrosive fluids. The installations of the NGV fuel system was based on the MS 1096 and
NFPA 52 to ensure safe operation. Drawing of this test skid is shown in Appendix A, the
engine wiring diagram in Appendix B and the bi-fuel wiring diagram in Appendix C. The
display and control panel has various control devices such as the throttle control, ignition
key, emergency shut-off, pressure and temperature display.
4.1.1 Lesson Learned from the Bi-Fuel Engine Test Skid
1. Safety in terms of wiring is seen extremely crucial in a natural gas fuel
system compared to conventional liquid fuel. Liquid fuel is visible where
as gaseous fuel can not be seen. For this reason, all wirings are done in
suitable manner to avoid the occurrence of spark that may ignite the
gaseous fuel.
2. Issue that relates with high pressure fitting must be properly addressed to
avoid leak. All fittings must be ensured to meet the operating pressure and
have sufficient safety margin in case of over pressure. In the case of over

52
pressure, the pressurized system must be equipped with pressure relief
device.
3. Flammable material handlings are addressed in accordance to the National
Fire Protection Agency code NFPA52 and MS 1096 that covers natural
gas vehicle.
4. Suitability of wiring system is studied as the natural gas fuel system
requires electric current to power its solenoid valve and its spark advancer.
Similar conditions must be made available else where to enable the natural
gas system to work.
5. Solenoid valve to cut-off the natural gas supply to the regulator is
mandatory and must be made available in the current study.
6. Heating for regulator using circulating radiator water is seen in this test
skid. This is due to the cooling effect that occurs during the expansion of
the compressed natural gas within the regulator. Heating is provided to
avoid any formation of ice within the regulator that may hinder its
operation. The temperature homogeneity of the gas regulator is crucial as
it would affect the air fuel mixer’s performance.
7. The varying natural gas supply to the engine based on engine RPM is
achieved by having vacuum actuation to the final stage for the pressure
regulator. This vacuum signal varies the amount of natural gas (flow rate)
leaving the pressure regulator.
8. The requirements of pressure, temperature and flow metering points are
seen crucial in order to monitor and study the natural gas fuel system.

53
9. It is seen that the outlet pressure and temperature would determine the
density of the gas supply to the fuel metering device. If the fuel metering
device is based on volumetric measurement, then the fuel metering would
fluctuate according to conditions.
10. The flow measurement basis if possible should be done on mass flow and
not volumetric to avoid any variation in flow monitoring.
4.2 Parameter Selection and Boundary Conditions
Through all the materials covered until this point, it is seen that the regulator
needs to meet the fuel flow rate requirement of the Kriss 110cc engine that tops at 24
litres per minute. This fuel flow rate requirement would fluctuate with engine speed. It is
also noted that the fuel injector operates at 4.5 bar of pressure thus requiring the outlet
pressure of the regulator to be that value. It is seen that the flow temperature vary due to
the pressure drop. This temperature profile would be taken as a study parameter and
monitored.
Design conditions begin with the material selection. The selection of material
governs pressure regulator wall thickness, spring design and the obturator seal. The
fabrication of the prototype pressure regulator depends on material selection as well.
4.3 Regulator Prototype Design
The compressed natural gas from the storage tank is directed by the high pressure
tubing to the regulator. At the entrance of the regulator, a high pressure solenoid valve
and a filter is fitted. The filter installed could obstruct the entry of any foreign matter that
may affect the regulator operation. The high pressure solenoid valve is used to block the
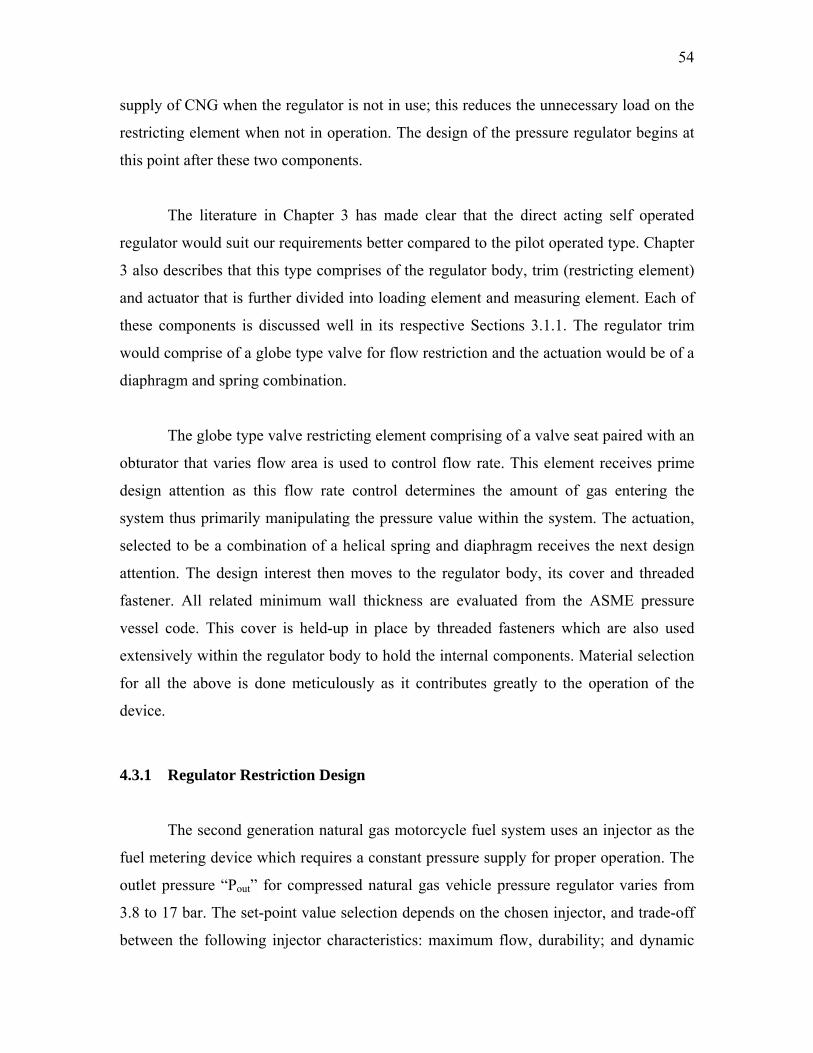
54
supply of CNG when the regulator is not in use; this reduces the unnecessary load on the
restricting element when not in operation. The design of the pressure regulator begins at
this point after these two components.
The literature in Chapter 3 has made clear that the direct acting self operated
regulator would suit our requirements better compared to the pilot operated type. Chapter
3 also describes that this type comprises of the regulator body, trim (restricting element)
and actuator that is further divided into loading element and measuring element. Each of
these components is discussed well in its respective Sections 3.1.1. The regulator trim
would comprise of a globe type valve for flow restriction and the actuation would be of a
diaphragm and spring combination.
The globe type valve restricting element comprising of a valve seat paired with an
obturator that varies flow area is used to control flow rate. This element receives prime
design attention as this flow rate control determines the amount of gas entering the
system thus primarily manipulating the pressure value within the system. The actuation,
selected to be a combination of a helical spring and diaphragm receives the next design
attention. The design interest then moves to the regulator body, its cover and threaded
fastener. All related minimum wall thickness are evaluated from the ASME pressure
vessel code. This cover is held-up in place by threaded fasteners which are also used
extensively within the regulator body to hold the internal components. Material selection
for all the above is done meticulously as it contributes greatly to the operation of the
device.
4.3.1 Regulator Restriction Design
The second generation natural gas motorcycle fuel system uses an injector as the
fuel metering device which requires a constant pressure supply for proper operation. The
outlet pressure “Pout” for compressed natural gas vehicle pressure regulator varies from
3.8 to 17 bar. The set-point value selection depends on the chosen injector, and trade-off
between the following injector characteristics: maximum flow, durability; and dynamic

55
range. For the system under development, a set-point pressure of 4.5 bar is selected to
suit the injector intended to be used. The flow path of the natural gas from the storage
tank to the fuel metering device is described in the Figure 4.2. Gas from the storage
cylinder is transferred via high pressure tubing to the pressure regulator. The fluid passes
through the solenoid valve at the inlet of the regulator before going to the restricting
element of the regulator.
Figure 4.2: Compress Natural Gas Fuel Line
The mass of gas flowing through a close conduit is limited by the occurrence of a
phenomenon called “choke flow” which occurs when the flow velocity is equivalent to
the speed of sound. Choked flow occurs at any throat if the ratio of the upstream pressure
to downstream pressure exceeds a critical value. Equation 4.1 provided by Oosthuizen
and Carscallen46 relates the critical area with other parameters such as specific heat ratio,
mass flow rate, stagnation pressure and density.
( ) ⎟⎟⎠
⎞⎜⎜⎝
⎛−+
−
⎟⎟⎠
⎞⎜⎜⎝
⎛+
=12
1
12*
γγ
γργ OOPmA&
(4.1)
*A = Critical Area
m& = Mass Flow rate

56
γ = Specific Heat Ratio
OP = Stagnation Pressure
Oρ = Stagnation Density
The stagnation condition occurs as the natural gas storage tank is considered to be
a large reservoir compared to the flow of gas into the pressure regulator through the valve
seat. The equation shows that the smaller the area the smaller the amount of mass of
natural gas that would be able to flow through. This argument would be used to evaluate
the entire path taken by the natural gas from the storage tank to the regulator. The
outcome of this evaluation takes two parameters into account. This includes the area of
the path taken by the natural gas traveling from the tank to the valve seat of the restricting
element and the nature of the regulating mechanism that requires the obturator to oppose
inlet pressure force during closure.
Next, we deal with the obturator positioning of the restricting element design
under consideration as shown in Figure 4.3. The valve seat sizing is followed by the
determination of the obturator movement locus which dynamically controls the amount
of gas entering the system to sustain the desired set point pressure. The movement of the
obturator away from the valve seat dictates the amount of gas entering the system.
Insufficient opening may restrict the regulator from supplying sufficient gas into the
system. On the other hand large opening may cause great amount of gas to enter and
creates over pressure the system in the occurrence of a failure on the loading and
measuring element. Because of this, there is a need to predetermine the maximum
distance of the obturator movement to provide the required gas to the fuel metering
device. The locus of the obturator movement and the required force would be used to
design the diaphragm and spring combination. Based on the sizes of the internal
components, the regulator body would be designed.
57
Obturator
Valve Seat
Flow Through
Flow Restricted
Figure 4.3: Open and Close Position of the Restricting Element
The complex geometry of fluid flow pattern through the opening between the
valve seat and the obturator makes manual calculation to predict the amount of mass flow
at various obturator positions to be difficult. The computational fluid dynamic software
called FLUENTTM was used to simulate the flow of gas through the restricting element at
various obturator positioning.
4.3.2 Computational Fluid Dynamic Evaluation
The valve seat and the obturator would be positioned virtually as desired in the
geometry generation software called GAMBIT. The geometry within the GAMBIT
software will be meshed and the related boundary conditions assigned accordingly. The
geometry is then imported in to FLUENTTM and simulated. The coupled, implicit solver
combination was used as it pairs the equations and solves them while the segregated
solver does this separately. The energy equation and viscous heating was enabled for the
simulation. The k-epsilon 2 equation model with RNG and standard wall functions were
used. The thermophysical properties of the fluid are defined within the user-defined
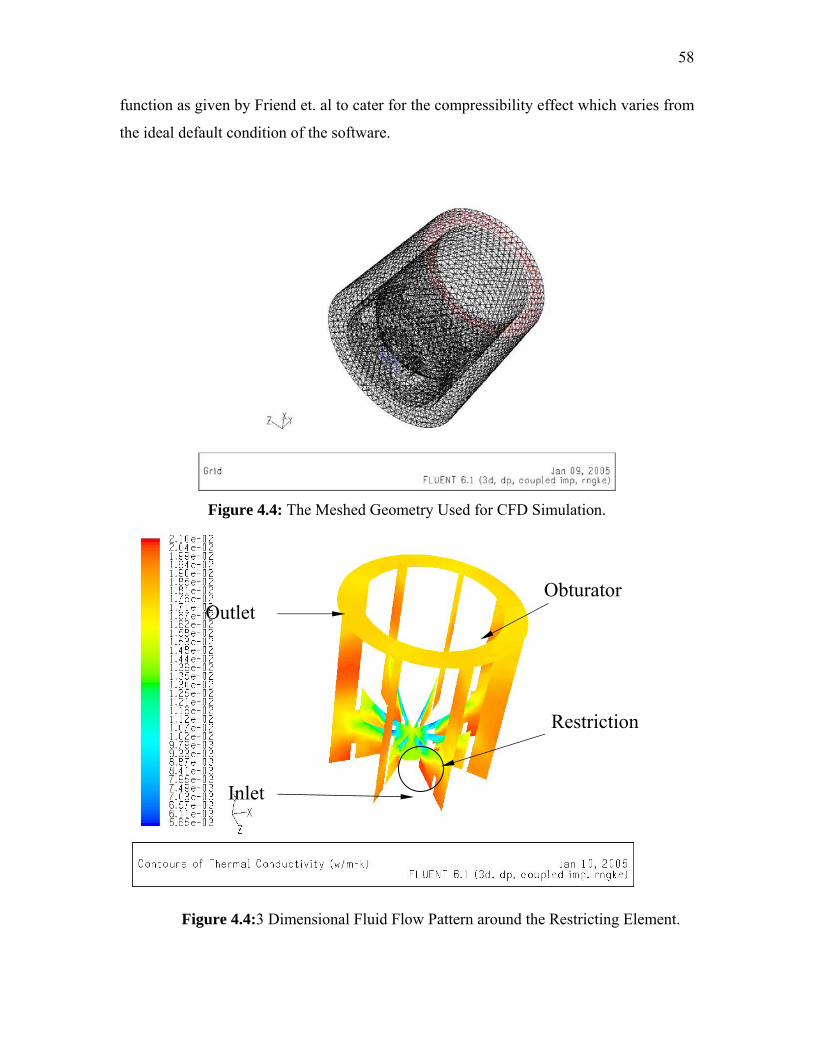
58
function as given by Friend et. al to cater for the compressibility effect which varies from
the ideal default condition of the software.
Figure 4.4: The Meshed Geometry Used for CFD Simulation.
Restriction
Obturator Outlet
Inlet
Figure 4.4:3 Dimensional Fluid Flow Pattern around the Restricting Element.

59
Outlet
Restriction
Obturator
Inlet
Figure 4.5: 2-Dimensional Fluid Flow Pattern Around The Restricting Element.
0mm Opening 0.1 mm Opening
0.2 mm Opening 0.3 mm Opening
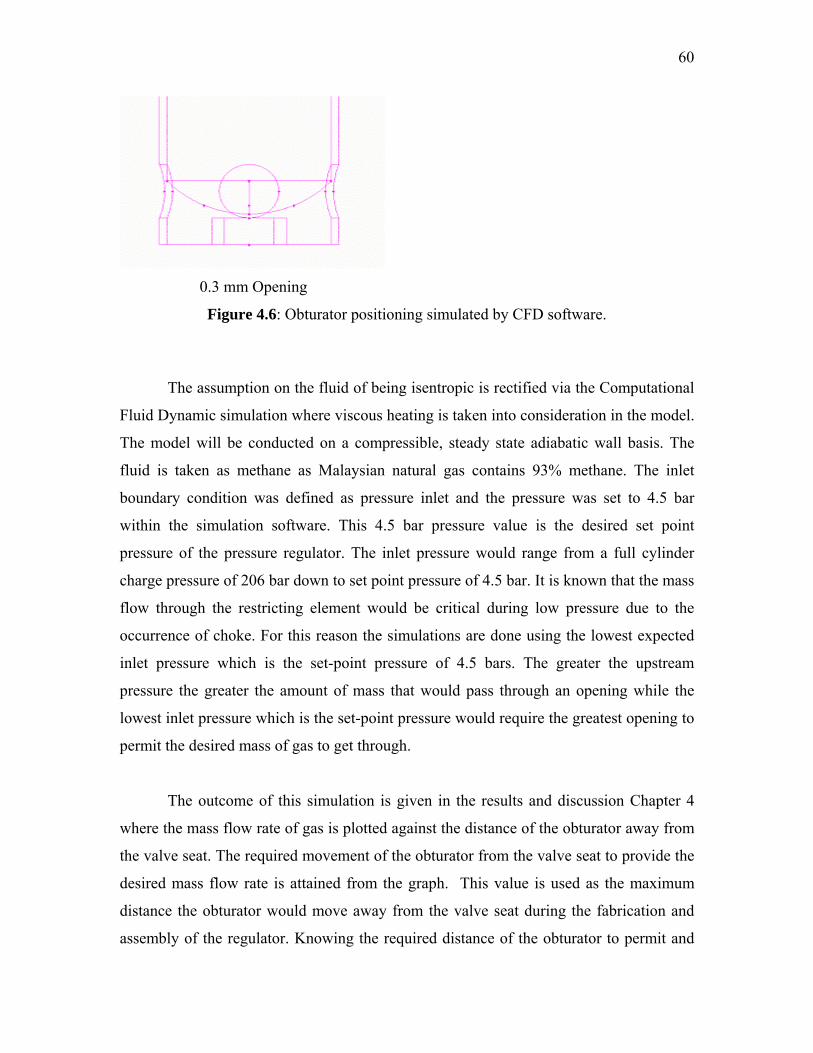
60
0.3 mm Opening
Figure 4.6: Obturator positioning simulated by CFD software.
The assumption on the fluid of being isentropic is rectified via the Computational
Fluid Dynamic simulation where viscous heating is taken into consideration in the model.
The model will be conducted on a compressible, steady state adiabatic wall basis. The
fluid is taken as methane as Malaysian natural gas contains 93% methane. The inlet
boundary condition was defined as pressure inlet and the pressure was set to 4.5 bar
within the simulation software. This 4.5 bar pressure value is the desired set point
pressure of the pressure regulator. The inlet pressure would range from a full cylinder
charge pressure of 206 bar down to set point pressure of 4.5 bar. It is known that the mass
flow through the restricting element would be critical during low pressure due to the
occurrence of choke. For this reason the simulations are done using the lowest expected
inlet pressure which is the set-point pressure of 4.5 bars. The greater the upstream
pressure the greater the amount of mass that would pass through an opening while the
lowest inlet pressure which is the set-point pressure would require the greatest opening to
permit the desired mass of gas to get through.
The outcome of this simulation is given in the results and discussion Chapter 4
where the mass flow rate of gas is plotted against the distance of the obturator away from
the valve seat. The required movement of the obturator from the valve seat to provide the
desired mass flow rate is attained from the graph. This value is used as the maximum
distance the obturator would move away from the valve seat during the fabrication and
assembly of the regulator. Knowing the required distance of the obturator to permit and
61
to restrict flow, the loading and measuring elements would be designed as described in
the following section.
4.3.3 Regulator Actuation Design
The combination of the loading (spring) and measuring (diaphragm) elements is
used to actuate the restricting element. These two elements are linked using a mechanical
linkage to direct the restricting element. Force exerted by the fluid on to the obturator
shown in Figure 4.5 is opposed by the force generated by the compartment fluid onto the
diaphragm. This linkage is designed based on fundamental force calculation which
mainly evolves on moment evaluation. This diaphragm would convert the compartment
fluid pressure that requires governing to force, based on the fundamental physic relation
where pressure equals force over area exposed to the pressure. Circular shapes are the
best geometry to equally distribute force on a given surface. This sensing diaphragm
would also serve as a gasket seat between the regulator body and its bonnet cover. The
diaphragm would be made of three-ply elastomer as it is the most suitable material for the
given situation.
The spring force depicted as serves as the loading element which goes against the
closure of the obturator to allow the compartment pressure to rise to the desired set point.
The measuring element (diaphragm) closes the gas inlet of the compartment when the
compartment pressure exceeds the set point value. The linkage provides the obturator
with sufficient force to hold the inlet gas flow from entering the compartment to avoid
pressure build up. Usage of the gas from the regulator compartment by the outlet stream
will cause the compartment pressure to deplete from the set point thus allowing the
obturator to open the inlet again. The best loading element for the required condition
would be the helical compression spring which is described in depth in the flowing
sections.

62
1 Setting Screw
Support Plate Spring
Obturator
Fixture Point to Regulator body
3
Diaphragm
2
3
2
Leverage
Figure 4.7: Mechanical Linkage Relating All Three Elements
4.4 Compression Springs
Compression springs made from round wire are the easiest to design and produce.
They are accurate, reliable, tolerable to high stress, have longer fatigue life, and should be
used in preference to any other type. They have an automatic stop when compressed solid
that prevents over deflection, thus limiting the stress, whereas extension and torsion
springs can easily be overextended. However, even with all these advantages, they can
still be troublesome-usually due to buckling or improper design specification.
There are basically four types of ends for a fully formed helical compression
spring. Plain ends which is also called open ends, is a simple cutoff with no attempt to

63
close the end coil. This prevents a spring to stand upright and causes uneven forces
distribution that makes the spring to buckle quickly. They are occasionally used when a
spring is supported over a rod and inaccurate forces or where buckling is not detrimental
to the application. All coils are active; the solid height equals the total coils plus 1 times
the wire diameter.
The second type known as plain ends ground is also called open ends ground.
This type is made by grinding a small portion of a spring having plain ends. About 25
percent of the end coil may be ground. The amount varies with the pitch or angle of the
end coil. This small amount of grinding does not help retard buckling, but it does reduce
the solid height of the spring, which is advantageous when a limited distance is
necessary. They are hazardous when handled. The total coils plus 1 the solid height
equals the total coils times the wire diameter. The third type which is the closed ends not
ground are also called squared ends. This type, automatically made on spring coilers,
retard tangling, provides a fairly good seating and is particularly useful on light sections
of wire under 1/32 in. (0.080mm) and especially so when the spring index D/d is over 10.
The total coils equal the active coils plus 2; the solid height equals the total coils plus 1
times the wire diameter.
Closed ends ground also called squared and ground is the fourth type of ends
implied on a helical compression spring. This type is made by coiling the springs with
closed ends automatically as described for closed ends not ground, the springs are
individually inserted into supporting tubes or plates, and both ends are then ground
simultaneously in specially designed spring grinding machines. Closed and ground ends
are often necessary to comply with specifications, for accurate precision force
requirements, for low force tolerances, to reduce buckling, and to be within the specified
tolerances when a spring must stand upright within 3° or 4° or less. The total coils equal
the active coils plus 2; the solid height equals the total coils times the wire diameter. The
loading element spring of the pressure regulator will be designed to have the closed ends
ground as it requires accurate precision force requirements and resistance towards
buckling.
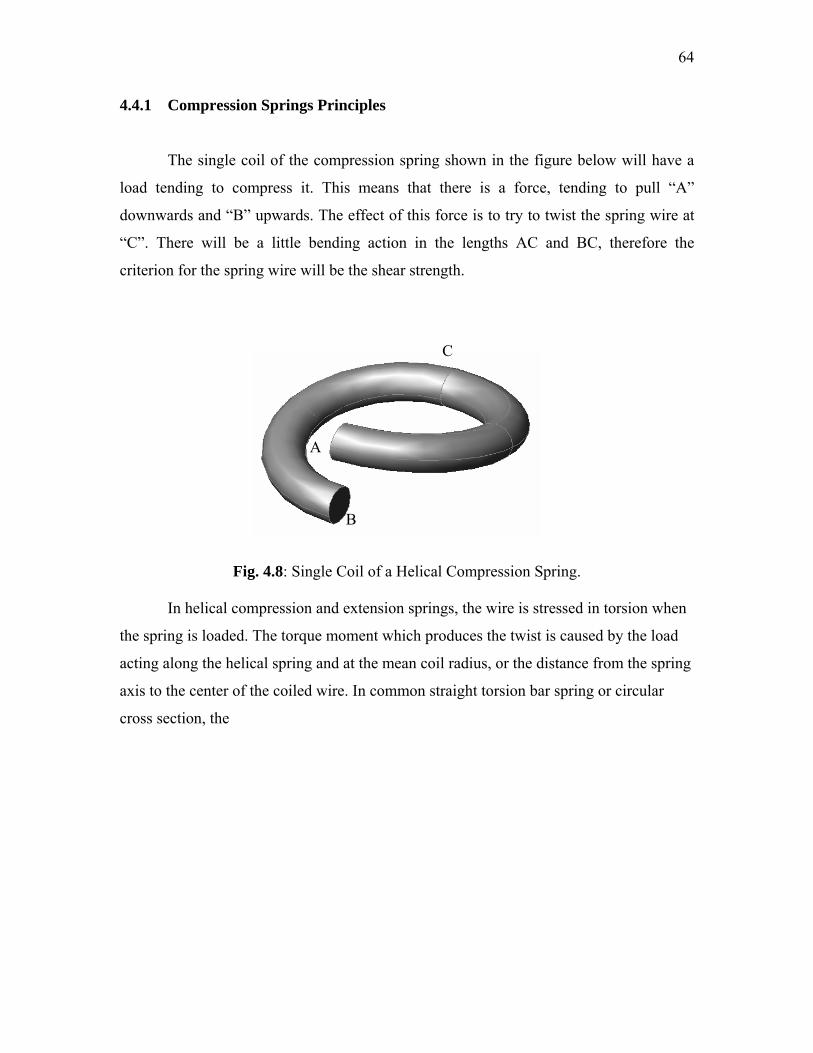
64
4.4.1 Compression Springs Principles
The single coil of the compression spring shown in the figure below will have a
load tending to compress it. This means that there is a force, tending to pull “A”
downwards and “B” upwards. The effect of this force is to try to twist the spring wire at
“C”. There will be a little bending action in the lengths AC and BC, therefore the
criterion for the spring wire will be the shear strength.
C
A
B
Fig. 4.8: Single Coil of a Helical Compression Spring.
In helical compression and extension springs, the wire is stressed in torsion when
the spring is loaded. The torque moment which produces the twist is caused by the load
acting along the helical spring and at the mean coil radius, or the distance from the spring
axis to the center of the coiled wire. In common straight torsion bar spring or circular
cross section, the

65
D
P
P
A
B
d wire
Fig. 4.9: The twisting moment on the spring coils.
In the straight torsion bar spring of circular cross section, the twisting produces a
shear stress which is uniform at every point of the bar surface; but in the helical spring
coiled from round wire, the stress pattern on the wire surface gets complex. Two reasons
that causes this occurrence are the torque moment that results in a steeper twist angle for
the short wire fibers at the outside of the coil, which produces a higher shear stress at the
inside of the coil. The second reason is that the axial load causes a direct shear stress
which adds to the shear stress from the torque moment at the inside of the coil, but
subtracts from it at the outside of the coil.
Under static loading conditions, the variations in stress over the cross section of
the spring wire can be neglected. The standard stress formula can be used, as it will
furnish an average stress over the entire surface of the wire. However, when the spring is
subjected to fatigue loading, the standard formula is inadequate because it conveys
neither the higher local stress nor the wider stress range prevailing during each cycle at
the inside of the coil. Fatigue failures are induced by a combination of high stress level
and wide stress range, and it is a common experience that fatigue failures in helical
springs occur at the inside of the coil. A failure at some other point can usually be traced
to a local flaw in the wire surface or to severe coiling or presetting stresses.
The maximum design stresses allowed for loading with various spring materials
for helical springs are established as a percentage of the minimum tensile strength of the

66
material. It has been found convenient to take into account the stress conditions at the
inside of the coil by using a “corrected stress”. This is obtained by computing the stress
from the standard formula and then multiplying the result with a stress correction factor
KW. The factor increases with greater curvature of the coiled wire. Greater curvature is
equivalent to a smaller spring index, which is the ratio of mean coil diameter to wire
diameter. The Wahl factor KW is most commonly used, and its values may be calculated
based on the equation below.
⎥⎦⎤
⎢⎣⎡ +
−⋅−⋅
=CC
CKW615.0
4414 (4.2)
dDC = (4.3)
As we can see the correction factor given above is a function of the spring index
(C). The ratio of the mean coil diameter D divided by the wire diameter d is called the
spring index and is one of the most important factors in design and manufacture. Low
ratios under 4 cannot always be coiled on automatic coilers because the high pressure of
the cutoff tool needed to sever the wire may break the portion of the arbor used as a
cutting edge. Low ratios also may cause pre-tempered wire to crack or may reduce its
ability to withstand the deflection desired. High indexes over 16 and particularly those
over 20 causes greater flexibility in the coils and require tolerance at least 50 percent
larger than standard. Higher ratios require modification on the coiling tools and cause
difficulty large variations in coil diameter. Indexes 3.5-15 are commercially practical to
manufacture, but indexes in the range of 5.5-9 are preferred, particularly for close
tolerance springs and those subjected to cyclic loading.
The number of coils does have an effect on the spring performance; in many cases
the spring deflection under load is almost as important as the load itself. The
corresponding end B of the bottom half coil is thus displaced upwards where as end A is
displaced downwards. The total deflection is 2 “δ” where “δ” movement downwards for
point A and δ upwards for B. Add another pair of half coils and the next end will move
by 4 “δ”, and so on. Deflection depends on the number of coils. In spring work, this
deflection is usually stated as the Rate of the spring “R” and in Imperial measure is

67
defined as the load in lbf/in. (in S.I. units this would be stated, for our size of spring, in
Newton/mm.) Spring rate is called by many names including scale, gradient, constant,
load per inch, force per unit of deflection, and other terms which add to the confusion.
The simplest way is to deflect a compression or extension spring any convenient distance
and note the first force and then deflect the spring any convenient second distance and
note the second force. The difference in the two forces divided by the second amount of
deflection is the rate. Rate should be determined between 20 and 60 % of total deflection
when test lengths are not otherwise established. If these factors are unknown, the
deflection under a given load W is given by the formula below:
The basic design formulae for round wire compression and extension spring are
shown below:
aNDFdGP
⋅⋅⋅⋅
= 3
4
8 (Force N) (4.4)
aNDdG
FPR
⋅⋅⋅
== 3
4
8 (Linear spring rate N/mm) (4.5)
3
8d
PDS⋅⋅⋅
=π
(Basic Stress MPa) (4.6)
3
8d
KPDS Wc ⋅
⋅⋅⋅=
π (Corrected Stress MPa) (4.7)
F= deflection, (mm) Na = number of active coils G = Torsional modulus of elasticity. MPa R= spring rate, lbf/in. of deflection. P = Force, N d = diameter of spring wire (mm) D = Diameter of coil (mm)
Iteratively equation 4.7 is used to determine suitable spring index that gives the
working torsional stress below the allowable limit given in the sentence above. A ten coil
spring will carry exactly the same safe load as one with only two if the wire and coil
diameters are the same. Having these values, we then determine the amount of coils that
are required to provide the desired deflection based on the preloading and force
distributions involved in actuating the restricting element with the help of the measuring
element which is the diaphragm

68
4.5 Valve Body Wall Thickness
The American Society of Mechanical Engineer (ASME) Boiler and pressure
vessel code provides rules for the construction of boilers, pressure vessels and nuclear
components. This includes requirements for materials, design, fabrication, examination,
inspection and stamping. This code is further divided into 11 sections covering a vast
number of applications related to the field. Section VIII Division 1 covers pressure vessel
in general which is suitable for the current study. For this reason, the 1977 ASME Boiler
and Pressure Vessel Code Section VIII Division 1 is referred to determine the minimal
wall thickness that surrounds the pressurized compartment. The vast amount of material
covered by this code eases material selection based on the operating condition of the
vessel under design. All related calculations including gasket and bolt joints are provided
within the code.
The following sections describes the equations used based on the code. Three
evaluations would be used due to the geometry of the pressure regulator body. This
would be the base of the regulator, the surrounding wall and the cover of the regulator
body which are elaborated by the sections bellow. Part (a) describes the side wall of the
pressured compartment which falls under Section UG- 27: Thickness of shell under
internal pressure. Part (b) explains the flat bottom portion of the pressured compartment
which complies with Section UG-34: Unstayed flat heads and cover of the pressure
vessel code. Part (c) Determines the minimal thickness evaluation would be the cover
which is under the field of Section UG-34 as well.
The regulator developed would be fabricated using stainless steel 304 as it is
found suitable with the natural gas pressure regulator operating conditions of -200C to
1200C. The maximum allowable stress value is a function of temperature for the selected
stainless steel 304 material, where the value decreases with the rise in temperature. We
attain the maximum allowable stress value (S) as 14.1x10³ psi from table UHA-23 of the
code that would be used in all the related calculations.

69
4.5.1 Minimal Wall Thickness of Shell Under Internal Pressure
The minimal wall thickness (t) is determined in accordance to Section UG-27-
Thickness of shells under internal pressure where the minimum thickness or maximum
allowable working pressure of cylindrical shells shall be the greater thickness or lesser
pressure as given by (1) or (2). The maximum allowable stress value in tension (S) is
taken as 14.1 x 10³ psi due to the argument described by the previous section. The
design pressure (P) is taken as four times the desired pressure regulator outlet set point;
the inner radius (R) of shell is obtained based on the design of the measuring element
while the joint efficiency (E) is taken as 1 for perfect defect free joint. Both equation (1)
and (2) are evaluated where the greater value of thickness would be used as the minimal
wall thickness value during fabrication.
(1) Circumferential stress (longitudinal joints). When the thickness does not exceed
one-half of the inside radius, or P does not exceed 0.385 SE, the following
formulas shall apply:
5.1732348385.0 ≤=≤ SEP
PSEPRt
6.0−= or
tRSEtP
6.0+= (4.8)
(2) Longitudinal stress (circumferential joints). When the thickness does not exceed
one-half of the inside radius, or P does not exceed 1.25 SE, the following
formulas shall apply:
562534825.1 ≤=≤ SEP
PSEPRt
4.02 += or
tRSEtP
.042−
= (4.9)

70
1
Longitudinal Stress
Control Volume
1
2 2
Circumferential Stress
Figure 4.10: Pictorial Description of Longitudinal and Circumferential Stress
4.5.2 Minimal Wall Thickness of Unstayed Flat Heads
The minimum thickness of the flat headed bottom of the regulator base is
calculated in accordance with Section UG -34 Unstayed Flat Heads and Covers which
provides equation 4.11. The depth of the pressure compartment (d) is acquired based on
the design of the loading element and the mechanical linkages involved within the
regulator. The value of C for the use of equation 4.11 is 0.2 given in Section UG-34 as
described in figure 4.11. The equations provide the minimal flat head wall thickness and
the required radiusing between the flat head and the side wall.
SECPdt /= (4.11)
C = 0.20
d r = ¼ t
t
Figure 4.11: Types of Unstayed Flat Heads and Covers
C = 0.30
d
hG
t

71
4.5.3 Minimal Wall Thickness of Unstayed Covers
The minimal thickness of the cover to be used with the pressure regulator base is
covered by the same section of the pressure vessel code where equation 4.11 is used. The
dimension less factor C is taken as 0.30 for the design understudy as described by figure
1. The diameter value (d) as described in figure 1 is determined from the design of the
internal components. The bolt circle diameter (C) is based on the cylindrical shell
thickness and the use of threaded fasteners. The radial distance from gasket load reaction
to the bolt circle is given in equation 4.12
mminGChG 31175.02
56.2795.22
==−
=−
= (4.12)
The Flange Design Bolt Load (W) is evaluated for operating condition and gasket
seating condition as shown below. The greater value between Wm1 (operating condition)
and WS (gasket seating) will be used in equation 4.13. The bolts loads used in the design
of the flange during operational conditions shall be values obtained from formulas (5) for
operational conditions.
( ) (47.2249
34825.246.214.30492.0234846.2785.0
)14.32(785.0
1
21
21
1
=×××××+××=
×+=+=
=
m
m
Pm
m
WW
GmPbPGHHW
WW
) (4.13)
m = is given as 2.25 for Elastomers with 3-ply asbestos fabric insertion, with or
without wire reinforcement. G = when G = mean diameter of gasket contact face, in. (mm) = 62.5 mm inb 25.00 ≤b = b0 when inb 25.00 ≤ in our case, b0 = 2.5mm/2 = 1.25mm
Where additional safety against abuse is desired, or where it is necessary that the
flange be suitable to withstand the full available bolt load, the gasket value for the flange
design bolt load is taken as the full available bolt load as provided by the M6 Bolt of 8.04
kN (1807.46lbf) Giving WS = 1807.46. It is clear that the W value calculated based on

72
Wm1 for the operational condition is greater than WS thus it would be used in equation
4.14.
3
3
56.2114100118.047.22499.1
1141003483.056.2
/9.1/
××××
+×
×=
+=
t
SEdWhSECPdt G
(4.14)
4.6 Regulator Loading Element Design
Compression springs made from round wire are the easiest to design and produce.
They are accurate, reliable and tolerable to high stress, have longer fatigue life, and
should be used in preference to any other type. They have an automatic stop when
compressed solid that prevents over deflection, thus limiting the stress, whereas extension
and torsion springs can easily be overextended. However, even with all these advantages,
they can still be troublesome-usually due to buckling or improper design specification.
There are basically four types of ends for a fully formed helical compression
spring. A plain end, which is also called open ends, is a simple cut-off with no attempt to
close the end coil. This prevents a spring to stand upright and causes uneven forces
distribution that makes the spring to buckle quickly. They are occasionally used when a
spring is supported over a rod and inaccurate forces or where buckling is not detrimental
to the application. All coils are active; the solid height equals the total coils plus 1 times
the wire diameter.
The second type known as plain ends ground is also called open ends ground.
This type is made by grinding a small portion of a spring having plain ends. About 25
percent of the end coil may be ground. The amount varies with the pitch or angle of the
end coil. This small amount of grinding does not help retard buckling, but it does reduce
the solid height of the spring, which is advantageous when a limited distance is
necessary. They are hazardous when handled. The total coils plus 1 the solid height

73
equals the total coils times the wire diameter. The third type which is the closed ends not
ground are also called squared ends. This type, automatically made on spring coilers,
retard tangling, provides a fairly good seating and is particularly useful on light sections
of wire under 1/32 in. (0.080mm) and especially so when the spring index D/d is over 10.
The total coils equal the active coils plus 2; the solid height equals the total coils plus 1
times the wire diameter.
Closed ends ground also called squared and ground is the fourth type of ends
implied on a helical compression spring. This type is made by coiling the springs with
closed ends automatically as described for closed ends not ground, the springs are
individually inserted into supporting tubes or plates, and both ends are then ground
simultaneously in specially designed spring grinding machines. Closed and ground ends
are often necessary to comply with specifications, for accurate precision force
requirements, for low force tolerances, to reduce buckling, and to be within the specified
tolerances when a spring must stand upright within 3° or 4° or less. The total coils equal
the active coils plus 2; the solid height equals the total coils times the wire diameter. The
loading element spring of the pressure regulator will be designed to have the closed ends
ground as it requires accurate precision force requirements and resistance towards
buckling.
The maximum design stresses allowed for loading with various spring materials
for helical springs are established as a percentage of the minimum tensile strength of the
material. It has been found convenient to take into account the stress conditions at the
inside of the coil by using a “corrected stress”. This is obtained by computing the stress
and then multiplying the result with a stress correction factor KW. The factor increases
with greater curvature of the coiled wire. Greater curvature is equivalent to a smaller
spring index, which is the ratio of mean coil diameter to wire diameter. The Wahl factor
KW is most commonly used, and its values may be calculated based on the equation
below.
74
⎥⎦−⋅ CC 44⎤
⎢⎣⎡ +
−⋅=
CKW615.014 (4.15)
dC = (4.16)
The correction factor given above is a function of the “spring index” (C). The
ratio of the mean coil diameter D divided by the wire diameter d is called the spring
index and is one of the most important factors in design and manufacture. Low ratios
under 4 cannot always be coiled on automatic coilers because the high pressure of the
cut-off tool needed to sever the wire may break the portion of the arbor used as a cutting
edge. Low ratios also may cause pre-tempered wire to crack or may reduce its ability to
withstand the deflection desired. High indexes over 16 and particularly those over 20
causes greater flexibility in the coils and require tolerance of at least 50 percent larger
than standard. Higher ratios require modification on the coiling tools and cause difficulty
large variations in coil diameter. Indexes 3.5-15
D
are commercially practical to
anufacture, but indexes in the range of 5.5-9 are preferred, particularly for close
toleran
and 60 % of total deflection when test lengths are
ot otherwise established . If these factors are unknown, the deflection under a given
load W
shown below. Where F represents deflection (mm), Na represents the number of active
m
ce springs and those subjected to cyclic loading.
Deflection depends on the number of coils. In spring work, this deflection is
usually stated as the Rate of the spring “R” and in Imperial measure is defined as the load
in lbf/in. (in S.I. units this would be stated, for our size of spring, in Newton/mm.) Spring
rate is called by many names including scale, gradient, constant, load per inch, force per
unit of deflection, and other terms that add to the confusion. The simplest way is to
deflect a compression or extension spring any convenient distance and note the first force
and then deflect the spring any convenient second distance and note the second force.
The difference in the two forces divided by the second amount of deflection is the rate.
Rate should be determined between 20 51n
is given by the formula below:
The basic design formulae for round wire compression and extension spring are

75
coils, G represents Torsional modulus of elasticity (MPa), RS represents spring rate of
deflection (lbf/in), PF represents Force (N), d represents diameter of spring wire (mm), D
presents the diameter of the spring coil (mm).
re
aF ND
FdGP⋅⋅⋅⋅
= 3
4
8 (Force N) (4.17)
aND ⋅⋅ 3F
SdG
FPR ⋅
==4
8 (Linear spring rate N/mm) (4.18)
3
8d
PDS F
⋅⋅⋅
=π
(Basic Stress MPa) (4.19)
3
8d
KPDS WFc ⋅
⋅⋅⋅=
π (Corrected Stress MPa) (4.20)
g
e restricting element with the help of the measuring element which is the diaphragm.
.7 Regulator Body Design
Iteratively Equation 4.18 is used to determine suitable spring index that gives the
working torsional stress below the allowable limit. A ten coil spring will carry exactly the
same safe load as one with only two if the wire and coil diameters are the same. Having
these values, we then determine the amount of coils that are required to provide the
desired deflection based on the preloading and force distributions involved in actuatin
th
4
The American Society of Mechanical Engineer (ASME) Boiler and Pressure
Vessel code provides rules for the construction of boilers, pressure vessels and nuclear
components. This includes requirements for materials, design, fabrication, examination,
inspection and stamping. This code is further divided into 11 sections covering a vast
number of applications related to the field. Section VIII Division 1 covers pressure vessel
in general which is suitable for the current study. For this reason, the 1977 ASME Boiler
and Pressure Vessel Code Section VIII Division 1 is referred to determine the minimal
wall thickness that surrounds the pressurized compartment. The vast amount of material
covered by this code eases material selection based on the operating condition of the
76
vessel under design. All related calculations including gasket and bolt joints are provided
within the code. All calculations on minimal wall thickness of the pressure regulator body
nd bonet cover using the Stainless Steel 304 are shown in Appendix G
.7.1 Threaded Fasteners
olt will initially break. This
ccurrence eases the detection of failures prior to loading.
fastener M profile is selected for the current study as it is easily
ttainable in the market.
a
4
Several countries have combined their research resources and working together in
ISO technical committees to design the ISO metric nut strength grade system. Properly
used, the system guarantees as fool-proof safe bolt and nut assemblies as sound
engineering and prudent economics can provide. Once installed, the failure mode if the
assembly is overstressed will normally be bolt fracture and not thread stripping. One of
the distinct advantages of the ISO metric nut strength system is that each property class
of nut was specifically designed, dimensionally and metallurgical, to properly mate with
a property class of bolt. Consequently, when the correct class of nut is selected, even
under the most adverse combination of conditions, the b
o
There are just two metric screw thread forms, the M profile which is the standard
for commercial fastener and the MJ which is the standard for aerospace quality fasteners.
The differences between these two profiles are in the root radiusing where the M profile
has radiusing of 0.125p and the MJ forms recommend 0.15p. Both the metric screw
thread comes with root radiusing which provides better fatigue resistance of the
fastener54. This is due to the fact that fatigue failure occurs at locations of high stress
concentration, such as notches or abrupt changes in cross-sectional configuration. The
highest stress concentration in threads occurs at the roots and the magnitude of the stress
concentration factor relates directly to whether the root is rounded and to what degree.
The Standard commercial
a

77
4.8 Regulator Material Selection
bove 125°C. It has an elastic limit in shear very slightly higher than regular carbon steel.
while retaining corrosion resistance more or less equivalent to that of S30400 or
31600.
The selection of material to design is crucial as it ensure safe working of the
entire pressure regulator at the operating condition. The material of the pressure regulator
body is required to externally suit the engine compartment heat and corrosive
environment. The inner part of the pressure regulator body should be able to with stand
low temperature due to the pressure drop within the regulator body. Selection of
component materials for high temperature or corrosive service is generally limited to
stainless steels or high nickel alloys. For the spring material, metals such as carbon steels
and the non-ferrous alloys have a maximum service temperature of 400 F. In addition;
they are not normally resistant to corrosion and other forms of high temperature attack.
The high nickel alloys such as Inconel and the beryllium-copper are about 3 to 4 times
the cost of Type 18-8 stainless steel. 18-8 hard drawn stainless steel is a very useful
material, especially for situations where the temperature may be high or there is risk of
corrosion, it can be worked up to 300°C, whereas carbon steel wire is unable to perform
a
The austenitic group, generally nonmagnetic, is the most important for process
industry applications. By virtue of their austenite-forming alloy additions, notably nickel
and manganese, these stainless steels have the face-centered austenite structure from far
below 0°C (32°F) up to near melting temperatures. They are not hardenable by heat
treatment, but can be strain-hardened by cold-work. The conventional 18-8 austenitic
stainless steels are exemplified by Type 304 (S30400). These alloys have rare
combination of corrosion resistance, high-temperature strength, and oxidation resistance,
ease of fabrication and weldability, good ductility and good impact resistance down to at
least -183°C (-216°F). Their mechanical properties in general, are excellent. Other
grades, such as Types 17-4 PH (S17400) and 17-7 PH (S17700), as well as a
molybdenum-bearing variant such as PH 15-7 Mo (S15700) can be precipitation-
hardened
S

78
Consistent performance of a spring is ensured if the spring material retains its
original properties. Many metals are subject to ‘work-hardening’ where a change of
hardness occurs when stressed. Experience shows that all working springs are subject to
cycles of stress. Brass, for example, is a metal that is relatively soft, but repeated
stressing or ‘working’ causes its hardness to increase, with the metal becoming springier
as a consequence. Thus whilst soft brass is quite useless as a spring material, fully
hardened brass possesses reasonably good spring properties. Even with the best materials
and apparently correct design, failures occasionally occur due to defective materials,
improper selection of materials, incorrect sizes, or any other event. By large, early
failures may be caused by high stress, shock loading, stress corrosion, high or low
temperatures, hydrogen embrittlement, sharp bends, improper winding or one of many
other conditions.
Heat treatment used upon spring material to improve the material properties is
preferably avoided as it commonly causes spring failure. Without considerable
experience in the techniques of heat treatment, therefore, spring materials should always
be used ‘as is’. Among the types of stainless steel, the Type (18-8) cannot be heat treated
as these alloys do not respond to the hardening and tempering method. At low
temperatures, the stainless steels of the 300 series are useful, but those of the 400 series
are not. A creep comparison carried out between the music wire widely used for highly
stressed springs and Type 304 stainless steel which has ability to withstand the effects of
moderately elevated temperature previously carried out proved the credibility of the Type
304 stainless steel. At room temperature the creep of music wire spring and Type 304
stainless steel springs is about the same, but at 150°C, the creep of music wire is
considerably greater than that of Type 304. At 250°C the stainless springs show fair creep
resistance preliminary tests on music wire at this temperature have shown it to be
unsuitable for service.
The arguments above prove that the best common component material that would
oblige the design requirement is the stainless steel Type 304 (18-8). This material would
be used throughout the pressure regulator due to its advantages over other materials for

79
the fabrication of all metal components. The most suitable material for the diaphragm is
the 3-ply elastomer, as it is tabulated in the ASME pressure vessel code. It is strong to
transfer the force exerted by the compartment fluid to the loading element to actuate the
restricting element. The tip of the obturator is required to have Teflon as the most
suitable material as it suits the condition best. This would be incorporated in the
fabrication section of the restricting element.
4.9 Regulator Prototype Fabrication
The successful completion of the design method would result in a complete
geometry which is presented in Chapter 6. This geometry requires to be fabricated using
the material of interest to form a prototype pressure regulator model. This section covers
methods implied during the fabrication, assembly, and configuration of the pressure
regulator prototype. The materials used for fabrication of the components are dependent
on the material selection. The resulting geometry of the restricting element from the
Computational Fluid Dynamic simulation is fabricated based on the material selected.
All components are manufactured in the most cost effective manner to ensure the
cost is minimal as this involves only one prototype unit. Other methods could be
evaluated during the production of this product at a greater volume. The tip of the
obturator requires Teflon as it is required to provide pressure tight seal to ensure the inlet
gas is restricted form entering the pressure regulator compartment. The lathe machine is
used to shape the obturator and its tip. The same equipment is also used to shape the inlet
valve seat, while other holes are drilled according to the desired thread.
The loading element which is the helical compression spring is fabricated using
an automatic spring coiler. The wire was selected to be stainless steel 304 while the wire
diameter and the spring diameter were selected based on the design calculation of the
spring. The measuring element which works together with the loading element is

80
fabricated using 3-ply elastomer that suits the condition best. The fabrication method
implied here is the press method where a mould is made according to the required
geometry and is used to cut the material to form the desired shape.
The biggest component of all which is the pressure regulator body is fabricated
based on the most suitable manner in terms of time consumption and cost. The Computer
Numerical Configuration Machining is seen to be the most suitable method to produce a
single piece of the pressure regulator body. The cap of the pressure regulator is machined
using a lathe machine as the shape suits the equipment. The threaded fasteners are used as
required to secure parts and components in place as designed.
The assembly is given equal amount of attention as it jointly contributes to the
integrity of the pressure regulator prototype. All components are fastened with suitable
fasteners firmly to ensure proper working. Accurate tightening is crucial as it would
ensure there is no leak of gas from the regulator. The spring should be loaded accordingly
during the assembly; any variations would cause the set point pressure to vary as the
loading element which is the spring would exert access force open the restricting element.
4.10 Regulator Prototype Testing
In order to conduct the test on the pressure regulator, a special pressure regulator
test bench has been successfully developed. The bench is required to hold high pressure
compressed natural gas (CNG). The handling of high pressure flammable gas requires
meticulous design consideration. Related Standard by the National Fire Protection
Agency NFPA 52-1984 and local Malaysian Standard MS 1096 were viewed. Referring
to Chapter 3, the high pressure fluid line begins with the 55 litre bulk storage cylinder has
a built-in needle valve to control the gas flow leaving the cylinder. A quarter turn ball
valve provides quick open and close to the gas flow leaving the bulk storage cylinder.
The tee-joint splits the flow to the manifold and the other goes to fill the onboard system.

81
This manifold block is fitted with pressure gauge to monitor the pressure within the hose
connection. The manifold block also provides bleed capability for depressurization prior
to dismantling of line.
The Teflon hose used to link the storage cylinder and the sample cylinder onboard
the test bench is fitted with a quick-connect connection that eases the fitting which just
snaps on. The combined sample cylinders have two ends, one for charging and the other
is to dispense the gas to the pressure regulator. The charging end is fitted with a check
valve to ensure one way flow and a needle valve to control the rate of gas transfer. The
other end is fitted with a pressure gauge to measure the pressure within the sample
cylinder and a needle valve that would control the flow of gas out of the sample cylinder
and to the pressure regulator.
The outlet of the cylinders is connected to the NGV pressure regulator via high
pressure tubing. The natural gas flow from the storage tank to the regulator is controlled
by a high pressure solenoid valve. The test bench is equipped with a power supply to
activate the high pressure solenoid valve to allow natural gas to enter the pressure
regulator. The outlet of the pressure regulator is fitted with a flow meter and a needle
valve. This controls the outlet flow rate allowing performance test to be conducted in a
controlled manner. Two pressure sensors were used in this system, where one is
designed to measure the upstream pressure which is the storage pressure that enters the
regulator and the other is positioned at the pressure regulator compartment after the gas
pressure has been regulated. An upstream pressure sensor having an operating range of 0
to 250 bar and a downstream pressure sensor having an operating range of 0 to 10 bar are
installed before and after regulator. The ACD-16 by PICO is used to convert the output
of the sensor to pressure values through the user interface software. The thermocouple is
solely operated with the Pico TC-08 which is connected to the personal computer. Both
the signals from the pressure sensors and the flow meter are processed by the Pico ADC-
16. Pico log software provided with both the TC-08 and ADC-16 is used to provide real
time data logging and can be stored onboard the personal computer.
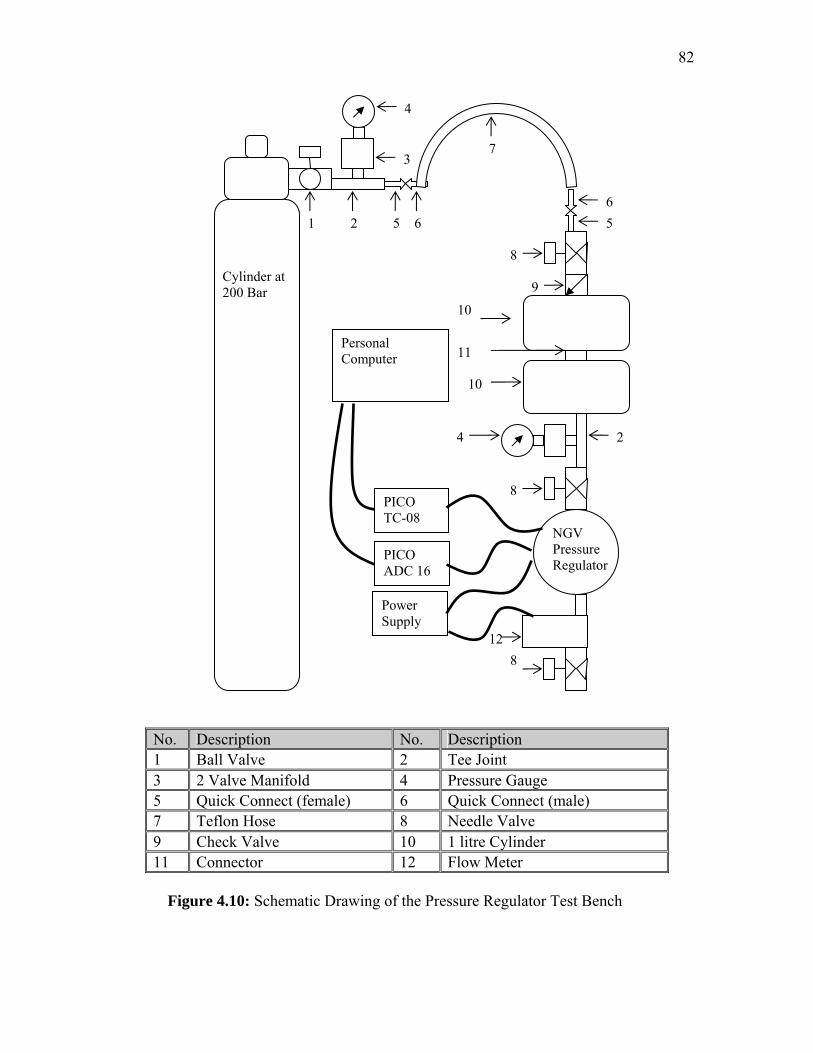
82
Cylinder at 200 Bar
NGV Pressure Regulator
2 1
4
3
5 6
7
6 5
8
910
10
11
2 4
8
812
Power Supply
PICO TC-08
PICO ADC 16
Personal Computer
No. Description No. Description 1 Ball Valve 2 Tee Joint 3 2 Valve Manifold 4 Pressure Gauge 5 Quick Connect (female) 6 Quick Connect (male) 7 Teflon Hose 8 Needle Valve 9 Check Valve 10 1 litre Cylinder 11 Connector 12 Flow Meter
Figure 4.10: Schematic Drawing of the Pressure Regulator Test Bench

83
4.11 Regulator Prototype and Test Bench Testing
Testing begins with the leak test of the entire fluid flow that begins from the
storage tank to the outlet of the flow meter to ensure there is no leak. The “Snoop”
produced by Swagelok is used due to its common acceptance by many in the industry and
the natural gas vehicle fuel line inspection practices in Malaysia. This step is then
followed by the sensor and data acquisition system calibration. Calibration of the data
acquisition system is required as it would ensure accurate results during the performance
testing. All pressure sensor thermocouple and flow meter are purchased newly.
This is followed by the final performance test method that would evaluate the
performance of the regulator to meet the set point outlet pressure regardless of the flow
demand posed upon it. The high pressure test gas is supplied to the pressure regulator
through the high pressure fluid system. The outlet of the pressure regulator is artificially
controlled by a needle valve. The needle valve is used to vary the out going fluid flow
just as it would be done in the actual system by the injector due to engine speed.
The outlet flow rate is varied from no flow up to the maximum flow consumable
by the Modenas Kriss 110cc motorcycle which is 24 Liters/minute. While the flow rate is
being varied, the pressure and temperature is logged using the data acquisition system.
The prime motive of this test is to prove that the pressure regulator is capable of
producing constant outlet pressure regardless of the outlet flow rate demand. The results
this test is shown and elaborated in the results and discussion chapter.
4.11.1 Pressure Regulator Test Bench Operation
Basically two types of gas mediums are used to test the pressure regulator,
compressed nitrogen or Compressed Natural Gas. The bulk storage cylinder has a built-

84
on needle valve to control the gas flow leaving the cylinder. This outlet is fitted with the
dispense unit which enable the quick connect hose connection to transfer gas, pressure
monitoring, bleed and control of flow. This unit is dedicatedly designed to enable the
charging of the storage cylinders onboard the test bench. The dispense unit consist of
fittings that would suite the outlet of the cylinder. A quarter turn ball valve provides
quick open and close to the gas flow leaving the bulk storage cylinder. The flow then
enters the 2 valve manifold block. This block is fitted with pressure gauge to monitor the
pressure within the hose connection. The manifold block also provides bleed capability
for depressurization prior to dismantle the hose after charging.
The test bench is equipped with a pair of high pressure storage cylinders having
connected to provide a combined capacity of two litres. Both ends of the storage
cylinders are fitted with needle valve to control the gas flow entering and leaving the
cylinder. The inlet is fitted with a check valve between the needle valve and the cylinder
to ensure there is no back flow if the valve is accidentally opened. The outlet is fitted
with a pressure gauge prior to the needle valve to provide the storage pressure of the
cylinders. The outlet is connected to the NGV pressure regulator via high pressure tubing.
The high pressure solenoid built in with the pressure regulator provides additional safety
to the system. A flow meter is attached to the outlet of the regulator to measure the flow
rate of gas leaving the system. A needle valve is paired with the flow meter to vary and
control the flow rate.
With the set up explained above, we would be able to obtain the pressure and
temperature at every stage of the regulator and the overall regulator outlet flow. The
experimental rig is fitted as shown in the schematic diagram above. A similar AutoCAD
picture is provided below.

85
Figure 4.21: Pressure Regulator Test Bench

CHAPTER 5
REFINEMENT OF PRESSURE REGULATOR DESIGN 5.0 Introduction
In order to acquire an optimum design of pressure regulator, an improvement of
design regarding to the previous prototype pressure regulator design has been completed
by using finite element analysis. A structural analysis on pressure regulator of Natural
Gas Vehicle-Motorcycle (NGVM) implemented through finite element analysis (FEA).
The finite element method uses a substitute structure, whose parts are in a sense, pieces
of the actual structure. Our substitute structure is a finite element. Serious study of solid
and contact element have to be conducted prior to continue with the modeling process.
Detailed drawing of the pressure regulator model is visualized in three
dimensions, symmetric and asymmetric via AUTOCAD V2004 and SOLIDWORK
V2005 computer programmed. The model then exported to MSC/NASTRAN to perform
analysis of flow rate deformation and stress of regulator base. In addition, structure
vibration also is analyzing in order to verify the structure body of NGVM pressure
regulator
In the analyzing process, the process have to be repeated if it does not well
performing these way errors contributed from convergence to boundary conditions,
meshing and material properties. The simulation work is considered completed if
simulation result is successfully obtained. Comparison of the various results obtained has

87
to be carried out to predict the characteristics of fluid flow in term of pressure reduction
caused by various setting of valve and forces exist on the regulator wall.
The exact deformation and stress tensor provided by the selected material of
construction is analyses when pressure 3000psi applied to regulator base to authenticate
the ability of the structure to resist the force excreted by the flowing gas. Satisfactory
results using the latest NGVM pressure regulator model obtained indicates the final step
of the process. Figure 5.1 below showed the process flow of this research project.

88
Visualize Model Drawing (2D) AUTOCAD V2004
Model Drawing (3D & Solid)
SOLIDWORK V2004
Creating a Database
Specifying Model Preferences
Importing Geometry Models
Creating Geometry
Creating a Finite Element Model
Creating Material Property Models
Create Element Properties
Applying Loads and Boundary Conditions
if error
Running the Analysis
Retrieving the Analysis Result
Result Analysis and Discussion
Visualizing Numerical Result MSC.PATRAN & NASTAN
Figure 5.1: Methodology Process Flow

89
5.1 AutoCAD (v2004) Model Drawing
Preliminary, regulator body is drawn separately into two parts using AUTOCAD
which known as Part A and Part B. Part A represents the bowl of the regulator and Part B
represents the cap of the bowl. The model is based on the prototype model developed by
Rahmat M., Zulkefli Y., and Shameed A in the project Development of Regulator Base.
Both parts of the body is drawn in two dimensional (2D) form which shows the upper
profile of Part A and bottom profile of Part B. Drawing process is carried out using
AutoCAD v2004.
5.2 SOLIDWORKS (v2005) Model Drawing
Two dimensional drawing of the regulator model, then represented in solid profile
by using computer program of SOLIDWORK v2005 ha been constructed. From this
process, the model can be viewed in three dimensions (3D). The model of regulator is
drawn separately in Part A and Part B for easier analysis process. Drawing process based
on the two dimensional (2D) drawing. At this stage, structural modification and thickness
are carried out on the original model of regulator in order to obtain the ideal design of
NGVM regulator with the optimized thickness.
For the finite element analysis, the entire solid drawing model has to be saved in
IGES File (*.igs) by changing the format of saving file in the SOLIDWORK
(*.prt;*sldprt). It is important to ensure the MSC.PATRAN (v2005r1) programming can
read the file for the simulation analysis on the structure.

90
Figure 5.2: SOLIDWORK IGES File Save Format

91
5.3 MSC.PATRAN (v2005r1)
MSC.PATRAN v2005r1 is the platform used to develop and establish all the
requirement of the model required to perform finite element analysis. It is considered
crucial to carry out pre-processing prior to solve mathematically of the model using
NASTRAN solver. Both of the two programming system are bundled in a package. The
analysis of the result will be presented graphically by using the MSC.Patran platform.
Finite element analysis codes use sophisticated structure analysis techniques to
predict the response of the model. A computer model submitted to an FEA code for
evaluation must be broken into small units called finite elements. The code then applies
fundamental engineering principles to calculate the response of the model. The analysis
in term of deformation and stress tensor are carried out to the structure of regulator body
to ensure the model is safe to operate at applied pressure. The following Figure 5.3 shows
several tasks has to be taken to perform such analysis.
5.3.1 Database Creation
The first step in this program analysis is creating a new database as shown in
Figure 5.3. To create a new data base, ‘File’ button has to be selected, followed by
clicking ‘New’ in the ‘Main menu’. New Database form will display. Specified Project
name in the form of New Database, and followed by clicking OK. .Now, the entire icon
in the program can be activated.

92
Figure 5.3: Create New Database Figure 5.3: Database Creation Window
5.3.2 Model Preferences Specification
It is important to select the Analysis Code, Analysis Type and Global Model
Tolerance before begin building analysis model. New Model Preferences form
automatically displays right after completing the New Database form as shown in Figure
3.4 below. Global Model Tolerance impact how to construct the model. While, Analysis
Code and Analysis Type affect code specific forms as well as the options available for
elements types, element properties and material definition. Firstly, Default was chosen
for the ‘Global Model Tolerance’, followed by selecting MSC.NASTRAN as the
‘Analysis Code’ and Structural as the ‘Analysis Type’. The form is complete by clicking
‘OK’ button.

93
Figure 5.4: New Model Preferences Form
5.3.3 Importing Geometry Model
MSC.PATRAN has two types of choices to develop a model, either by using
drawing facilities or by importing the model from other sources. In many cases, it is
much more efficient to use an existing CAD geometry model created outside of
MSC.PATRAN rather than constructing a new model. Importing CAD model may avoid
repetitive modeling efforts and ensure better accuracy between a CAD design model and
its analysis model. Other third-party modeling packages can be supported via the use of
ANSI industry standard IGES (Initial Graphic Exchange Standard) protocol.

94
To import a CAD model, select File and click Import in the MSC.PATRAN main
menu. The import form will display as shown in Figure 5.5 below. In the Object drop-
down menu, select Model. Then follow by selecting IGES File (*.igs) in the Source
drop-down menu. Then, the entire file name where the model was drawn and saves
before is selected. The process is finished by clicking the ‘Apply’ button.
Choose the .IGES file from the storage
Figure 5.5: MSC.NASTRAN Import IGES File Format
5.3.3.1 Geometry Creation
Geometry creation for the model imported is started by clicking the toggle of
Geometry on the MSC.PATRAN main form. The Geometry Application form will appear
as shown in Figure 5.6 below. ‘Create’ is selected in the Action drop-down menu
followed by selecting ‘Solid’ in Object drop-down menu. For the Method, boundary
representation (B-rep) is selected, that comprises the entire boundary of solid. Solid ID
List will become 2. For ‘Surface List’ textbox, drag the entire model imported on the
screen layer. Finish the process by clicking the ‘Apply’ button.
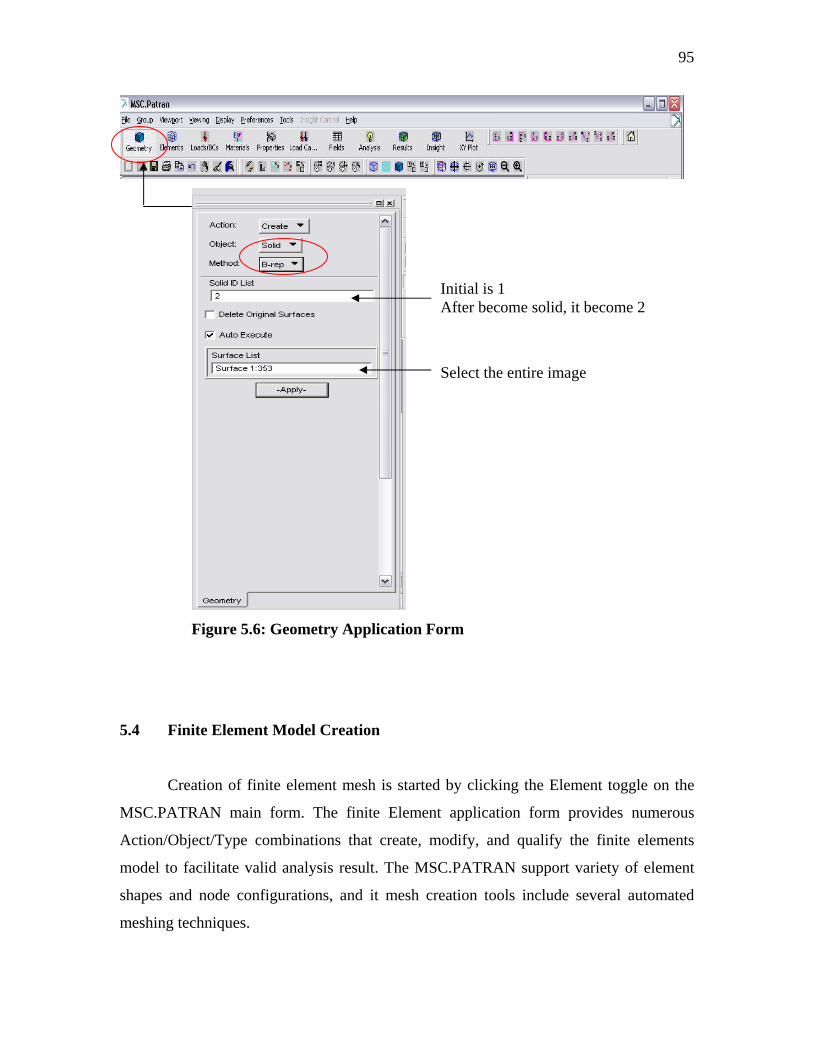
95
Initial is 1 After become solid, it become 2
Select the entire image
Figure 5.6: Geometry Application Form
5.4 Finite Element Model Creation
Creation of finite element mesh is started by clicking the Element toggle on the
MSC.PATRAN main form. The finite Element application form provides numerous
Action/Object/Type combinations that create, modify, and qualify the finite elements
model to facilitate valid analysis result. The MSC.PATRAN support variety of element
shapes and node configurations, and it mesh creation tools include several automated
meshing techniques.

96
Figure 5.7 shows the Finite Element Application Form. In this application form
Create, Mesh and Solid has been selected for the Action, Object and Type drop-down
menu. Mesh is chosen as the Object because the finite element method required that
divide the analysis model into interconnected pieces called element, to which separate
analysis equations are assigned. A set of these interconnected elements is referred to as a
mesh.
In the same main form, Tet, Tet Mesh and Tet 10 need to be selected for the
Element Shape, Mesher and Topology drop-down menu. The entire body is selected for
the Input list. This process is finished by clicking ‘Apply’ button.

97
Figure 5.7: Finite Element Model Creation

98
5.4.1 Loads and Boundary Conditions Application
In MSC.PATRAN, load and boundary conditions (LBCs) are treated as a single
type of data to be assigned to portions of geometry or finite element model. In a structural
analysis problem, we are generally trying to determine the response of the model to
physical loading, or specific structural behaviors such as frequency response or buckling.
Some of LBCs may work with included force, pressure, velocity, initial load,
displacement, temperature and contact. In this structure regulator base analysis, the LBCs
just require analysis in term of pressure and displacement analysis.
The LBCs application is where to define the load and boundary condition sets for
model analysis. To excess this application form, click Load/BCs toggle on the
MSC.PATRAN main menu. LBCs application form provided function to create, modify
and show a range of load and boundary data. To apply displacement force to the analysis
model, Create, Displacement and Nodal is selected from Action, Object and Type drop
down menu as shown in Figure 5.9.
By clicking New Set Name textbox, the name for the displacement analysis will
be specified. The Input Data unfold box has been selected on the application form to
bring up the Input Data Sub form. By using this form, displacement data boundary
condition has been specified by setting the Load/BC Set Scale Factor as 1. Then, the
Translation <T1 T2T3> and Rotation <T1 T2 T3> specified as <0 0 0> in the list box and
finishing by clicking ‘OK’ button.
By selecting the Select Application Region unfold box, the Select Application
Region sub form will appear as shown in Figure 5.10. Set Geometry as the choice of
Geometry Filter in this sub form. For the, Select Geometry Entities list box, surface to
applied displacement force will be selected. It is followed by clicking ‘Add’ button.
Figure 5.9 shows geometry model after meshing.

99
Figure 5.8: Geometry Model After Meshing

100
Figure 5.9: Load/BCs Application Form for Displacement Force

101
Figure 5.10: LBC Select Application Region Subform for Displacement Force
Figure 5.11: Region of Displacement Force Application (Red Line)
After completing applied displacement force to the structure case, the second
step of this process is applying the pressure force to the structural. Using the same
application form, the Action, Object, and Type drop-down menu is change to Create,
Pressure and Element Uniform. Then, New Set Name for this analysis is specified. As
procedure before, by clicking on the Input Data, sub form of Input Data will be filled up
by the required pressure value, which is 3600psi (20.7 E+07 Pascal). With the same
concept, at the Application Region the entire region for the applied pressure force is
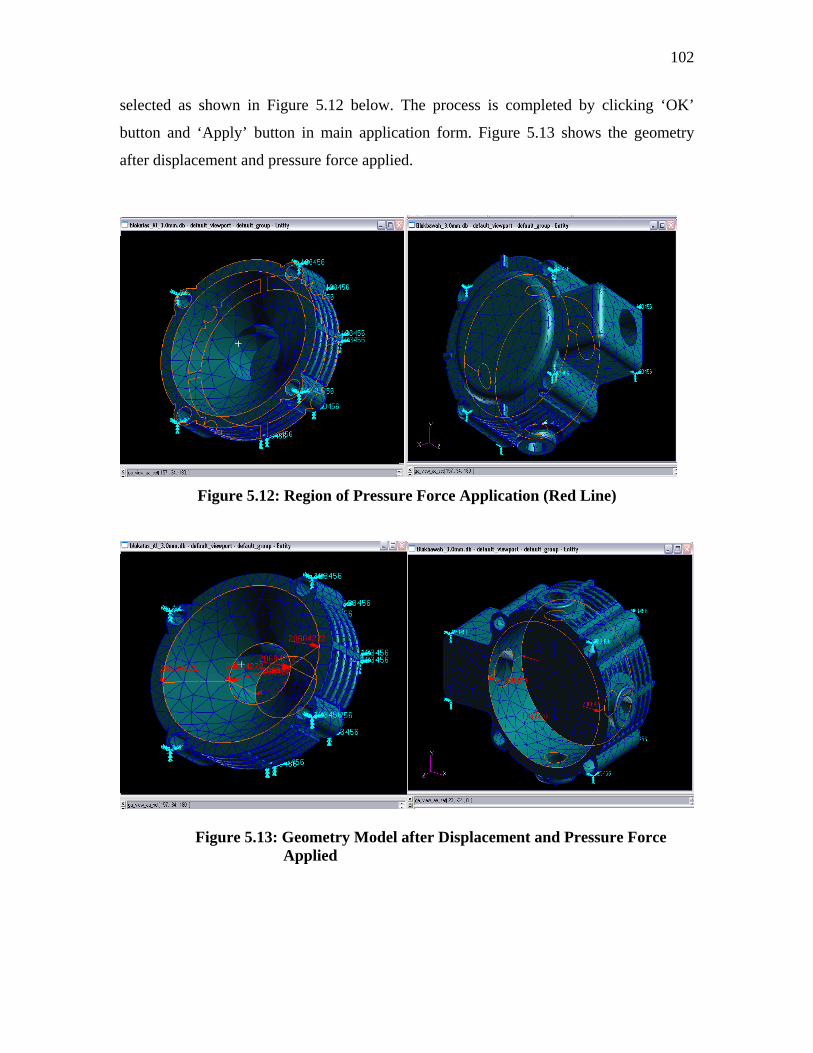
102
selected as shown in Figure 5.12 below. The process is completed by clicking ‘OK’
button and ‘Apply’ button in main application form. Figure 5.13 shows the geometry
after displacement and pressure force applied.
Figure 5.12: Region of Pressure Force Application (Red Line)
Figure 5.13: Geometry Model after Displacement and Pressure Force Applied

103
5.4.2 Material Property Models Creation
A material model is a group of material properties that describe what model is
made (such as pure element or composite) and the attributes of that material (stiffness,
density and so on). The material application is the platform to define materials for model
analysis. It can be done by clicking the material button on the MSC.PATRAN main form.
The Material Application form will appear in the view port as shown in Figure 5.14.
‘Create’, ‘Isotropic’ and ‘Manual Input’ has been selected as Action, Object and
Method in drop-down menu. Isotropic is chosen in this analysis because material
properties for the model, needed to be developed are the same in all direction. While,
Manual Input provided the input option form that used to input material property data.
Then, the Material Name textbox is filled with the specific material name that is needed
to be used for the analysis process. Each material must have a unique name which will be
assigned a sequential Material ID number automatically. By clicking Input Properties
button in Material application form, separate Input Options sub form will appear in the
view port as shown in Figure 5.14.
For Constitutive Model drop-down menu in this sub form, Linear Elastic is
selected and followed by filling the material property values in the form. This project is
running the analysis for structure, so the value of Thermal Expansion Coefficient,
Structural Damping Coefficient and Reference Temperature are not necessary. This
process is completed by clicking ‘OK’ button in Input Options form and ‘Apply’ button
in Material application form.

104
Figure 5.14: Material Property Models Application Form
105
5.4.3 Element Properties Creation
Through the Element Properties application, element type (such as beam and
shell) and element related properties for region of the model is defined. These defecations
to geometric or FEM entities is later assigned. Element type selection is based on
dimensions of the model and assumptions on model behavior.
Properties toggle has been selected in the MSC.PATRAN main menu to excess
the Element Property application form. The Element Property application form will
appears in the view port as shown in Figure 5.15 below. In the main screen of this
application form, Create, 3D and Solid for Action, Object and Type drop-down menu
needs to be selected. Properties set name for this analysis in the Property Set Name
textbox requires to be specified. It needs another unique name to specify this property. In
the Option part, Homogenous and Standard Formulation has been selected on its drop-
down menu. These Option pop-up menus are specific analysis code and have to be
referred to documentation for the analysis code.
Sub form of Input Properties will appear as shown in Figure 5.15 by clicking the
Input Properties button in Element Properties application. This sub form prompt to
provide additional required and optional information. Material name that has been
selected before in creating material property models is selected for the Material Name list
box, on Input Properties form. It is followed by clicking ‘OK’ button. Back to the
Element Properties form, the entire geometry identity model needs to be dragged for the
‘Select Member’ list box. This form is completed by clicking the ‘Apply’.

106
gg
Click to select the material to the property
Figure 5.15: Element Properties Application Form

107
5.4 Running the Analysis
To run the analysis application, Analysis button is selected on the
MSC.PATRAN main menu. The analysis form will appear as shown in Figure 5.16
below. Analysis, Entire Model and Full Run need to be selected for the Action, Object
and Method drop-down menu. Then, the Code and Type of analysis have to be checked
to ensure the code and type analysis used is MSC.NASTRAN and Structural. Job name
for this analysis in Job Name textbox must be defined. This name will be attached to all
files associated with this particular analysis run.
Figure 5.16: Analysis Application Form
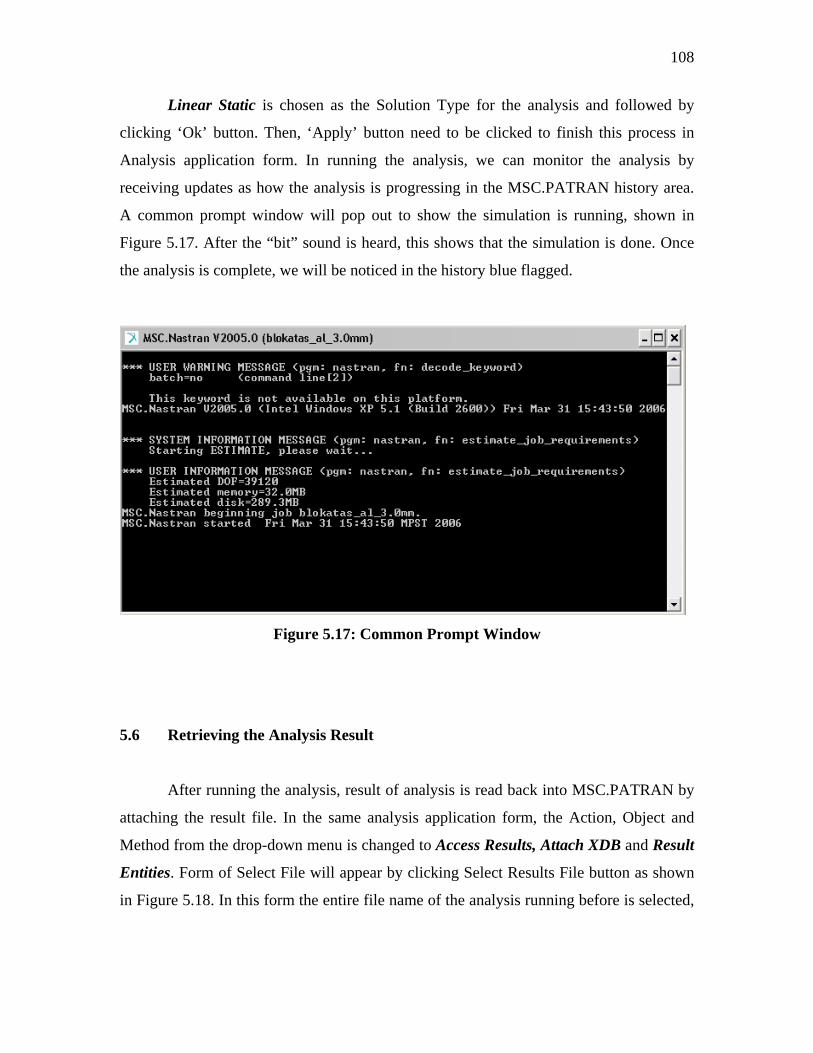
108
Linear Static is chosen as the Solution Type for the analysis and followed by
clicking ‘Ok’ button. Then, ‘Apply’ button need to be clicked to finish this process in
Analysis application form. In running the analysis, we can monitor the analysis by
receiving updates as how the analysis is progressing in the MSC.PATRAN history area.
A common prompt window will pop out to show the simulation is running, shown in
Figure 5.17. After the “bit” sound is heard, this shows that the simulation is done. Once
the analysis is complete, we will be noticed in the history blue flagged.
Figure 5.17: Common Prompt Window
5.6 Retrieving the Analysis Result
After running the analysis, result of analysis is read back into MSC.PATRAN by
attaching the result file. In the same analysis application form, the Action, Object and
Method from the drop-down menu is changed to Access Results, Attach XDB and Result
Entities. Form of Select File will appear by clicking Select Results File button as shown
in Figure 5.18. In this form the entire file name of the analysis running before is selected,

109
and followed by clicking ‘OK’ button. The process is finished by clicking ‘Apply’ button
on the Analysis application form.
Figure 5.18: Access Result Application Form
5.6.1 Numerical Result Visualization
To visualize the analysis result, the result button needs to be selected on the
MSC.PATRAN main menu. Analysis application form will appear as shown in Figure
5.19 below. Quick plot is created by selecting Create and Quick Plot as Action and
Object drop-down menu. Then, Stress Tensor is selected as the Fringe Result and

110
Displacement, Translational as Deformation Result. This process is completed by
clicking the ‘Apply’ button.
Figure 5.19: Result Visualization
The ability to visualize the results using computer graphics, animation and other
results tools provides a real, visual sense of a model’s behavior. Interactive results
display represents the link between finite elements analysis and the engineering
judgment. Visualization of simulation result, such as color –coded result displays,
deformed shapes, animations of how the model behave , and numerical result values, give

111
the insight needed in verifying our model design. It is important for the modification and
improvement of the critical or undeformed region of the design.
5.7 Analysis and Discussion
The result of simulation has to be analyzed to obtain the ideal structure of
NGVM pressure regulator body structure. The structure analysis is carried out to
authenticate the ability of the structure to resist force excreted by the flowing gas through
the FEA tool element. Analysis of results obtained, including the comparison of selected
material to fabricate the regulator base is further deliberated in the following Chapter 6.

CHAPTER 6
RESULTS AND DISCUSSION
6.0 Introduction
This chapter is designated to discuss the results attained through the
methodology undertaken in the previous chapter to meet the objective of this study.
The methodology section began with the design and development of pressure
regulator combined with the knowledge gained in Chapter 2 and Chapter 3 on
regulator provides the regulation mechanism. This is the core of the study where
work begins with the restricting element design aided by the computational fluid
dynamic and ends in the minimal wall thickness evaluation. Shortly thereafter, it
continues with the refinement of pressure regulator design by using Finite Element
analysis (FEA) method in order to improve the previous single step pressure
regulator design. The outcomes of the evaluations that have been optimized are
discussed in this chapter. The prototype results would be the first section of the
chapter. This section would begin with the restricting element design followed by the
material selection and all other design works. The regulator actuation, loading
element, and regulator body results depend strongly on the material selection. This
would be followed by the fabrication of the prototype which has resulted from the
methods described. The pressure regulator prototype model is then assessed using the
pressure regulator test bench. Subsequently, results of an improvement of the
pressure regulator prototype design are also being discussed in this chapter followed
by the two dimensional modeling, solidified modeling, MSC PATRAN/NASTRAN
analysis, simulation analysis for single step regulator, the comparison on

113
MSC/PATRAN results and lastly the comparison on the material selection. Finally
this chapter would present the test results of the pressure regulator using the
dedicated pressure regulator testing facilities.
6.1 Regulator Restriction Results
The evaluation on the path taken by the gas from the cylinder to the
restricting element showed that the smallest cross sectional area occurs at the high
pressure tubing. This high pressure tubing link connects the storage tank and the
pressure regulator. This 3 mm inner diameter would cause “choke” to occur. The
design of the valve seat to be smaller then this value would cause further choke thus
further limiting the maximum amount of gas capable of flowing through. This would
limit the maximum capacity of the regulator. On the other hand the design of the
valve seat to be greater then 3 mm would not increase the maximum flow rate as the
choke would have already occurred to the mass flow downstream. Having a bigger
valve seat would impose a greater force for the obturator to oppose during closure.
As we know force is pressure multiplied by the area its acting upon, thus the force
upon the obturator may be manipulated by decreasing the valve seat area to be
minimal. The incoming pressure acting on the obturator is unable to be manipulated
as it is a factor of the amount of gas within the storage cylinder. This elaborated
argument depicts that the valve seat should be designed to have 3 mm in diameter as
it would be the optimal value giving maximum capacity for the regulator with
minimal load on the obturator.
As we recall, the choke flow evaluation was used to evaluate suitable valve
seat sizing while the Computational Fluid Dynamic Software FLUENTTM was used
to evaluate the obturator movement away from the valve seat to provide the amount
of gas required by the system. The pictorial description in Figure 6.1 shows the flow
of the fluid from the inlet to the outlet around the obturator. The 3-Dimensional
simulation results have been sliced to form various planes such as the inlet plane, the

114
outlet plane and the 4 cross-sectional planes. The values of various parameters such
as velocity, temperature and density are viewed as post processing results of the
simulation.
Figure 6.1: 3-Dimensional Fluid Flow Pattern Around the Restricting Element.
Inlet
Outlet
Restriction
Obturator
Inlet
Outlet
Restriction
Obturator
Cross-Sectional Plane

115
Figure 6.2: 2-Dimensional Fluid Flow Pattern Around The Restricting Element.
Figure 6.3: Velocity Magnitude of Each Cross-Sectional Plane.
Figure 6.4: Total Pressure Profile of One Cross-Sectional Plane.

116
Figure 6.5: Total Density Profile of One Cross-Sectional Plane.
Mass flow rate is a function of gas density which depends on temperature,
pressure and other factors. The result of the simulation as shown in Figures 6.3 to 6.5
are examples of the data extraction. These values are the same as the thermophysical
property table (Friend et al.). This proves that the simulation has been conducted
successfully. Based on the computational fluid dynamic evaluation of the obturator
positioning, it is seen that the following flow rate was attained at various opening.
Simulations were conducted at inlet pressure of 4.5 Bar. The desired mass of 0.267
grams per second of natural gas is attained with openings of 0.3mm. This would be
the maximum travel for the obturator away from the valve seat.

117
Natural Gas Mass Flow Rate Against Obturator Distance for Valve Seat
y = 0.8543x + 0.0114R2 = 0.9966
0
0.1
0.2
0.3
0.4
0.5
0 0.2 0.4 0.6Distance Opening (mm)
Mas
s Fl
ow R
ate
(Gra
ms/
Sec)
Figure 6.6: CFD Simulation Results Comparing Mass Flow Rate and Obturator
Distance of Opening.
6.2 Regulator Actuation Results
Based upon the SAE HS 79550 spring indexes in the range of 5.5-9 are
preferred, particularly for close tolerance springs and those subjected to cyclic
loading. The wire diameter for the spring coil was selected arbitrarily selected as
3mm. Taking the spring index to be 6 which is within the suggested range, we get a
coil that would have an inner diameter of 15 mm. The spring diameter (D) however
is equivalent to the inner diameter plus the wire diameter which gives 18 mm. The
Torsional Modulus of Elasticity for the stainless steel 304 wire is given as 68,900
MPa. Combining these values into Equation 4.20, we attain the maximum corrected
allowable stress. This value is compared with the allowable working torsional stress
(corrected) for stainless steel type 304 for wire diameter of 3mm (0.118 inch) which
is 55, 000 psi as provided by Harold C.R. Carlson51. It is seen that the value is far
below the suggested level thus proving the safe operation of the spring.

118
The set-point pressure of 4.5 bar would pose a force of 1272.34 Newton when
it acts against the diaphragm area of 2.8274 x 10-03. This is the force that is used to
completely obstruct the incoming gas into the regulator compartment. This is done
through appropriate leverage that implies elementary moment calculation. The
preload force of the spring should hold the restricting element open during pressure
below 4.5 bar to allow pressure built-up within the compartment.
Through iterative evaluation on moment calculation paired with valve
opening and spring preloading, we attain the appropriate active number of coil for the
spring to be 10 giving a solid height of 30 mm. The solid height for closed ends
ground as used in the current evaluation is calculated by multiplying the number of
active coils with the spring wire diameter. The moment calculations were used to
calculate the amount of load the spring should give against the measuring element to
permit pressure built-up to the set-point level. A pre compression of 7.5 mm was
appropriate to provide sufficient loading force for the desired purpose.
18mm
30mm
3mm
Stainless Steel 304 Pre - Compression 7.5mm
Figure 6.7: Final Loading Element Design
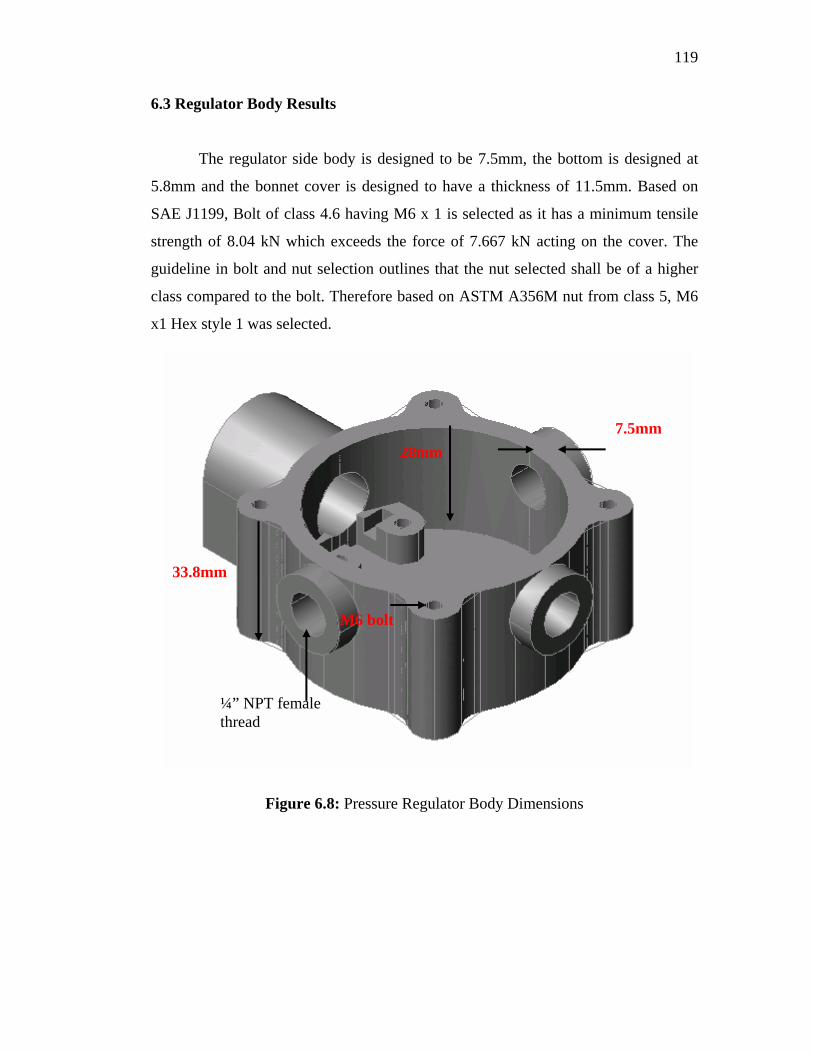
119
6.3 Regulator Body Results
The regulator side body is designed to be 7.5mm, the bottom is designed at
5.8mm and the bonnet cover is designed to have a thickness of 11.5mm. Based on
SAE J1199, Bolt of class 4.6 having M6 x 1 is selected as it has a minimum tensile
strength of 8.04 kN which exceeds the force of 7.667 kN acting on the cover. The
guideline in bolt and nut selection outlines that the nut selected shall be of a higher
class compared to the bolt. Therefore based on ASTM A356M nut from class 5, M6
x1 Hex style 1 was selected.
7.5mm 28mm
¼” NPT female thread
33.8mm
M6 bolt
Figure 6.8: Pressure Regulator Body Dimensions

120
11.5mm
Figure 6.9: Bonnet Cap Dimensions
6.4 Regulator Prototype End Product
The fabrication of each component and the appropriate assembly would result
in the finish product as shown in Figure 6.8 and 6.9. As we can see the pressure
regulator compartment has four accesses. One the inlet, the second the outlet, the
third for the pressure and temperature sensing while the last tapping is fitted with a
safety relieve valve which has a relief pressure of 6 bar which is above the set-point
pressure of 4.5 bar.

121
High Pressure Inlet
Pressure & Temperature Sensor Point
Relieve Valve
Bonnet Cover
Flow meter Connection
Flow Control Valve
Pressure Regulator Body
Figure 6.10: Fabricated Pressure Regulator Prototype
6.5 Pressure Regulator Performance Results
The dedicated test bench is used to prove the ability of the prototype pressure
regulator to provide constant outlet pressure regardless of inlet pressure and outlet
flow rate. The graph below depicts the outlet pressure at varying outlet flow rate. The
inlet pressure regulator of the regulator during this test is at 3000 psi as the Compress
Natural Gas cylinder was newly charged. From the graph in Figure 6.10, we can see
that the flow rate has been increased by 5 litres every 2 minutes. The regulator
successfully provides constant pressure of 4.5 Bar at all flow rate. The time limit of 2
minutes for each flow rate allows the stabilization of the system. The results clearly

122
prove the ability of the pressure regulator to provide constant outlet pressure
regardless of output flow demand.
Step Increment of Flowrate Plotted Against Outlet Pressure and Temperature
0.0
5.0
10.0
15.0
20.0
25.0
30.0
35.0
40.0
0 400 800 1200 1600
Time (Sec)
Flow
rate
(L/m
in) &
Te
mpe
ratu
re (D
egC
)
0.00
1.00
2.00
3.00
4.00
5.00
6.00
7.00
8.00
Pres
sure
(Bar
)
Outlet Flowrate
Outlet Temperature
Outlet Pressure
Figure 6.11: Performance Plot of the Pressure Regulator Prototype
Evaluated Using the Pressure Regulator Test Bench
123
6.6 Refinement of Previous Product
The research on improvement NGVM Pressure Regulator has been completed
via finite element analysis in order to optimize the NGVM pressure regulator
prototype. A robust regulator is an essential component of a safe and reliable NGV
fuel system. It is important to verify that the regulator is capable to effectively
manage NGV fuel system regarding to temperature, vibration, flow changes, supply
pressure changes as well as imperfect gas composition.
Result obtained from this research work has been such that optimized. The
NGVM regulator could manage the maximum force when pressure is supplied to the
system. Analysis will seriously focus upon the maximum tensor stress caused by the
applied pressure. Besides, selection of the satisfactory construction materials of the
body regulator is one of the major considerations.
6.7 Two Dimensional Modeling
Two dimensional model of regulator base is drawn to provide conceptual idea
for three dimensional drawing. The model is drawn by using AutoCAD version 2004
computer programming as shown in Figure 6.12. The model will be transformed to
solids views for the thickness and structure modification. This model is drawn based
on research by Rahmat M, Zulkefli Y, and Shameed A on the project of
Development of Regulator base.

124
Figure 6.12: Two Dimensional Drawing of Part A and Part B NGVM Pressure Regulator body divided into two parts, namely Part A and
Part B. Each part is drawn separately in shape and dimensional. Part A of regulator
body represents the regulator bowl base, and drawn with a projection that shows the
regulator bowl base from the upper view. Overall observation of this view shown that
the regulator bowl base has 93mm length and 70mm wide with one hollow cylinder
for fuel inlet.
Part B of regulator body represents the regulator cap base and drawn from the
bottom view. The base regulator cap has 70mm external diameter. Both of Part A and
Part B of regulator base have four unit holes with 5.5mm diameter screw in each of
its diagonal. It is designed to strongly coupled the bowl and cap of regulator body.
The general design of this regulator has been made suitable to be installed on the
NGVM system.
125
6.8 Solidified Modeling
Solid model for regulator base is developing by using SOLIDWORK
program based on the conceptual ideal of two dimensional drawing. The solid model
is drawn using the prototype system to analyze deformations and stresses.
By structural modification on the critical region of this regulator the
optimized thickness could be obtained. Preliminary, the thickness of the regulator
base is reduced by 0.5mm until the optimize thickness of the prototype is gained. The
thickness reduction of this prototype is done to get the optimize thickness of original
regulator base before structural modification is carried out.
Structural modification on the critical region of regulator base is carried out
in order to obtain the ideal structure design of NGVM pressure regulator. Evolution
of the structure modification design is developed using SOLIDWORK program as
shown in Figure 6.13. Thus, result of a new design of NGVM pressure regulator.
Figure 6.14 shows Part A and Part B of pressure regulator separately.
Modification has been done to the original base of the regulator by
incorporating fins to the body of the regulator, to increase total surface area of the
regulator. The fin plays an important role to absorb heat from the surrounding in
order to decrease temperature drop during the fall in pressure phase. It is also
preventing freezing of natural gas. It is shown that Part A of the regulator has been
modified by adding rib and thickness at the top part of the structure. While, Part B of
regulator is modified by adding the thickness at the bottom part of the structure.
The optimized thickness of the newly designed NGVM pressure regulator is
obtained after the structural modification. All the solid model that has been drawn
have to be saved by using IGES format before being exported to MSC. PATRAN

126
program for the structural analysis. The analysis will subsequently based on
separation of both parts.
Figure 6.13: Evolution of Structural Design Modification via SOLIDWORK

127
Part B Part A
Figure 6.14: Part A and Part B of New Design via SOLIDWORK 6.9 MSC. PATRAN/NASTRAN Analysis
The finite element analysis upon the deformations and stresses of the
regulator base is carried out by using MSC. PATRAN/NASTRAN. The applied
pressure at the inner surface of the pressure regulator base will force the elements to
move from it origin. The analysis will show the displacement nodes. Modification is
necessary at the critical region of the prototype design to ensure the safety and
durability of the prototype when it is pressure at 3000psi (2.07E+07 Pascal) from
CNG storage tank. Analysis will also take a serious consideration upon the maximum
tensor stress caused by the applied pressure.
Result obtained through the FEA analysis could be used to optimize the
design of single step NGVM pressure regulator thickness, in order to handle the
applied pressure produces by changes in gas flow rate and deformation.

128
6.9.1 Simulation Data for Single Stage Regulator
Simulation data for deformations and stresses analysis for single stage of
NGVM pressure regulator are shown in Table 6.1 until Table 6.6 below.
i. Regulator Bowl Base (Part A)
Material: Stainless Steel 304 (SS_304)
Table 6.1: Simulation Data for Part A Using SS304
Original Model New Model Thickness (mm) Stress
( x 108 Pa ) Deformation ( x 10-2 mm )
Stress ( x 108 Pa )
Deformation ( x 10-2 mm )
5.0 1.77 1.09 1.74 1.59
4.5 2.55 1.31 1.92 1.67
4.0 2.61 1.62 2.17 1.74
3.5 2.79 2.03 2.41 1.83
3.0 4.10 2.62 3.37 1.89
Material: Aluminum Cast Alloy
Table 6.2: Simulation Data for Part A Using Aluminum Cast Alloy
Original Model New Model Thickness (mm) Stress
( x 108 Pa ) Deformation ( x 10-2 mm )
Stress ( x 108 Pa )
Deformation ( x 10-2 mm )
4.0 3.54 7.38 1.82 4.25
5.0 2.32 5.68 1.42 3.98
5.5 1.92 4.58 1.27 3.82
6.0 1.66 3.71 1.12 3.70
7.0 1.44 3.13 1.04 3.38

129
Material:) Brass
Table 6.3: Simulation Data for Part A Using Brass
Original Model New Model Thickness (mm) Stress
( x 108 Pa ) Deformation ( x 10-2 mm )
Stress ( x 108 Pa )
Deformation ( x 10-2 mm )
5.0 1.77 2.04 1.74 2.46
4.5 2.09 2.44 1.98 3.12
4.0 2.67 3.02 2.16 3.27
3.5 2.78 3.79 2.38 3.40
3.0 4.10 4.88 3.30 3.53
ii. Regulator Bowl Base (Part B)
Material: Stainless Steel 304 (SS_304)
Table 6.4: Simulation Data for Part B Using SS304
Original Model New Model Thickness (mm) Stress
( x 108 Pa ) Deformation ( x 10-2 mm )
Stress ( x 108 Pa )
Deformation ( x 10-2 mm )
5.0 1.23 0.667 1.11 0.372
4.5 1.25 0.949 1.23 0.401
4.0 1.47 1.36 1.39 0.433
3.5 2.57 2.00 1.61 0.470
3.0 3.60 2.60 1.76 0.504
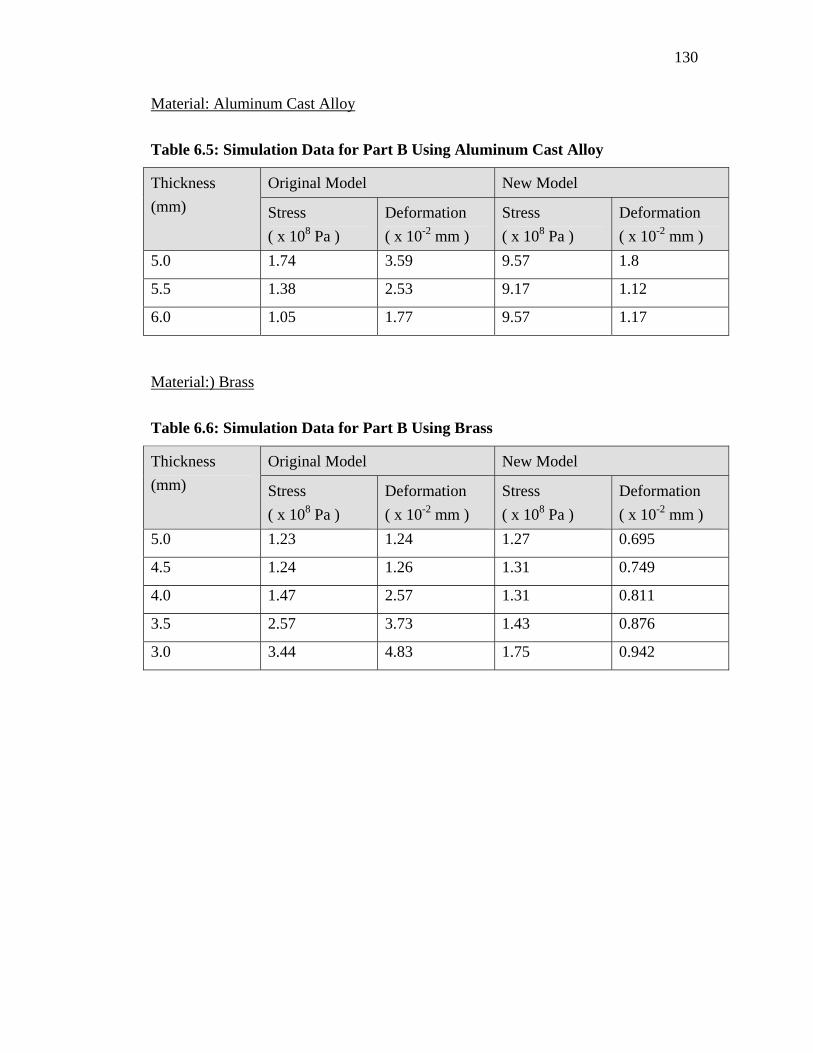
130
Material: Aluminum Cast Alloy
Table 6.5: Simulation Data for Part B Using Aluminum Cast Alloy
Original Model New Model Thickness (mm) Stress
( x 108 Pa ) Deformation ( x 10-2 mm )
Stress ( x 108 Pa )
Deformation ( x 10-2 mm )
5.0 1.74 3.59 9.57 1.8
5.5 1.38 2.53 9.17 1.12
6.0 1.05 1.77 9.57 1.17
Material:) Brass
Table 6.6: Simulation Data for Part B Using Brass
Original Model New Model Thickness (mm) Stress
( x 108 Pa ) Deformation ( x 10-2 mm )
Stress ( x 108 Pa )
Deformation ( x 10-2 mm )
5.0 1.23 1.24 1.27 0.695
4.5 1.24 1.26 1.31 0.749
4.0 1.47 2.57 1.31 0.811
3.5 2.57 3.73 1.43 0.876
3.0 3.44 4.83 1.75 0.942

131
For structural applications, the yield strength is usually more important
property than the tensile strength. Once it is passed, the structure has deformed
beyond acceptable limits. Yield strength is the pressure which a substance is capable
of supporting without fracturing. In industry, yield stresses are usually not even
approached because the applied stresses are kept well below the yield strength by a
safety factor on the order of 1.5 to 2.0.
Yield strengths for each material used are summarized in the following table.
Table 6.7: Yield Strength for Each Material
Material Yield strength
Psi ( x 108 Pa )
Stainless steel 304 76500 5.27
Brass 57000 3.93
Aluminum Cast Alloy 20000 1.65
Factor of safety (FS), also known as Safety Factor, is a multiplier applied to
the calculated maximum load (force, torque, bending moment or a combination) to
which a component or assembly will be subjected. Safety factor accounts for
imperfections in materials, flaws in assembly, material degradation, and uncertainty
in load estimates. An alternative way to use the safety factor is to derate the strength
of the material to get design strength.
FactorSafety Strength YieldStressDesign =
On this analysis, the safety factor that will be considered is 1.5. Thus, the
design stresses calculated for each material are shown in Table 6.8 below:

132
Table 6.8: Material Design Stress
Material Design Stress ( x 108 Pa )
Stainless steel 304 3.51
Brass 2.62
Aluminum Cast Alloy 1.10
The optimize thickness of each material summarized as the following table:
Table 6.9: Optimize Thickness of Each Material Selection
Material Construction SS304 Brass Aluminum Cast Alloy
Part A
Part B Part A Part B Part A
Part B
Stress Tensor( x 108 Pa ) 3.37 1.76 2.38 1.43 1.04 0.854
Deformation ( x 10-2 mm ) 1.89 0.504 3.40 0.876 3.38 1.08
Material Design Stress (x 108 Pa) 3.51 2.62 1.10 Optimize Thickness (mm) 3.0 3.5 6.0
6.9.2 Comparison on MSC/PATRAN Simulation Result
From Table 6.7, it is clearly shown that Stainless Steel 304 (SS304) gives the
minimum value of optimized thickness compared to Brass and Cast Aluminum
Alloy. The optimized thickness of SS304 is 3.0mm. Figure 6.4 shows the result in
graphical form of Part A analysis, where its material constructions is Stainless Steel
304 (SS304). After the structure modification, by adding fins and additional
thickness to the bottom part of the original model, the maximum stress of the Part A
structure reduced to 0.337GPa. The maximum stress of new model under the design
stresses, 0.351GPa. Maximum stress of node element occurs on node number 13544.

133
Figure 6.4: Stress Tensor Analysis Result for New Model of Part A Using SS304
For the displacement analysis, as shown in Figure 6.5, the maximum
displacement of Part A new model using SS304 is 0.0189 mm. It is showed that the
displacement is not critical due to the small distance of node displacement. Thus, the
new model with 3.0mm thickness is safe to operate at the applied pressure.
Figure 6.5: Deformation Analysis Result For New Model of Part A Using SS304

134
The optimized thickness of Brass as material construction is 3.5mm. Stress
tensor analysis result for this material shown in Figure 6.6. It is shown that maximum
stress is 0.238 GPa, which is 29.38% less than maximum node stress of SS304.
Maximum stress of node element occurs on node number 10652. The maximum
stress is under the design stress of brass material.
While, the maximum node displacement of this material is 0.0340 mm occurs
on node number 11358 as shown in Figure 6.7 below. The maximum displacement of
Brass as construction material is 44.41% more than SS304. The analysis shows that
the displacement values is less than 1mm, which mean the base regulator body is
sufficient to support the maximum operating pressure, 3000psi.
Figure 6.6: Stress Tensor Analysis Result for New Model of Part A Using Brass

135
Figure 6.7: Deformation Analysis Result for New Model of Part A Using Brass

136
While, aluminum cast alloy gives the largest thickness among the material
constructions, which is 6.0mm. The optimized thickness of cast aluminum alloy 50%
higher than SS304. The maximum stress tensor for this material is 0.104 GPa occurs
on node number 4681 as shown in Figure 6.8. The maximum stress tensor of this
material is less 69.13% and 56.30% than SS304 and Brass
The maximum node displacement of this material is 0.0338 mm occurs on
node number 8431 as shown in Figure 6.9 below. The maximum displacement of
cast aluminum alloy as construction material is 44.08% more than SS304.
Figure 6.8: Stress Tensor Result for New Model of Part A Using Aluminum Cast
Alloy
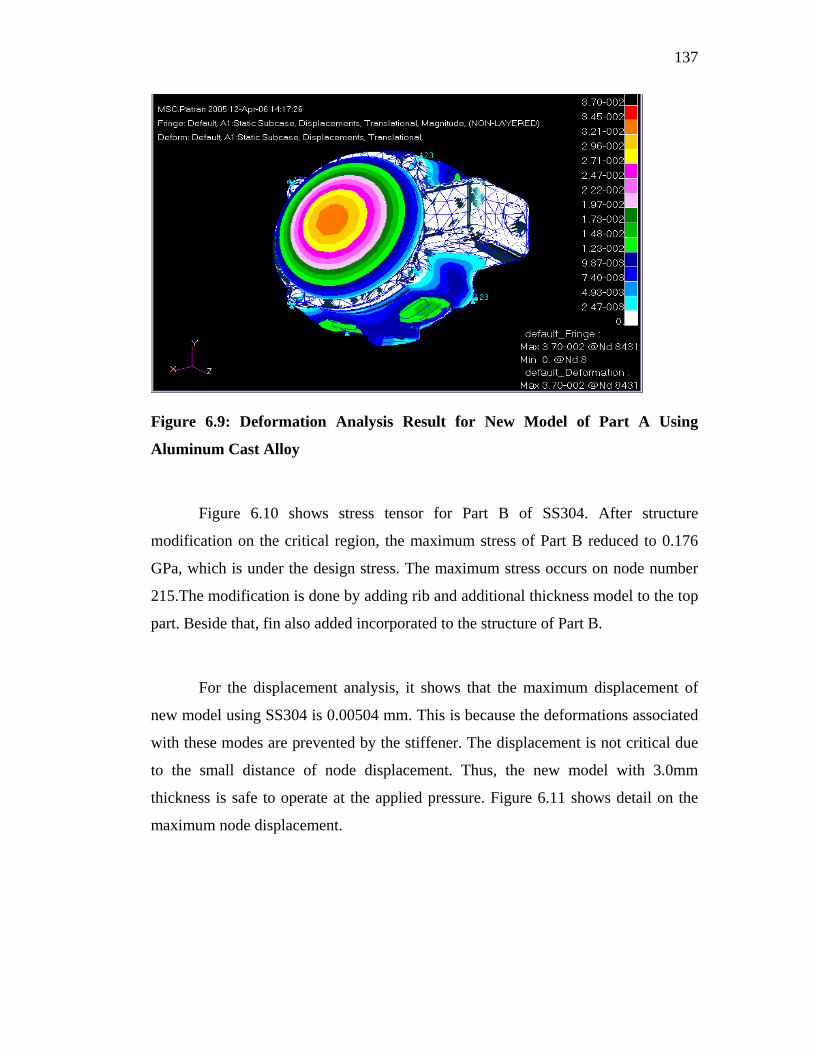
137
Figure 6.9: Deformation Analysis Result for New Model of Part A Using
Aluminum Cast Alloy
Figure 6.10 shows stress tensor for Part B of SS304. After structure
modification on the critical region, the maximum stress of Part B reduced to 0.176
GPa, which is under the design stress. The maximum stress occurs on node number
215.The modification is done by adding rib and additional thickness model to the top
part. Beside that, fin also added incorporated to the structure of Part B.
For the displacement analysis, it shows that the maximum displacement of
new model using SS304 is 0.00504 mm. This is because the deformations associated
with these modes are prevented by the stiffener. The displacement is not critical due
to the small distance of node displacement. Thus, the new model with 3.0mm
thickness is safe to operate at the applied pressure. Figure 6.11 shows detail on the
maximum node displacement.
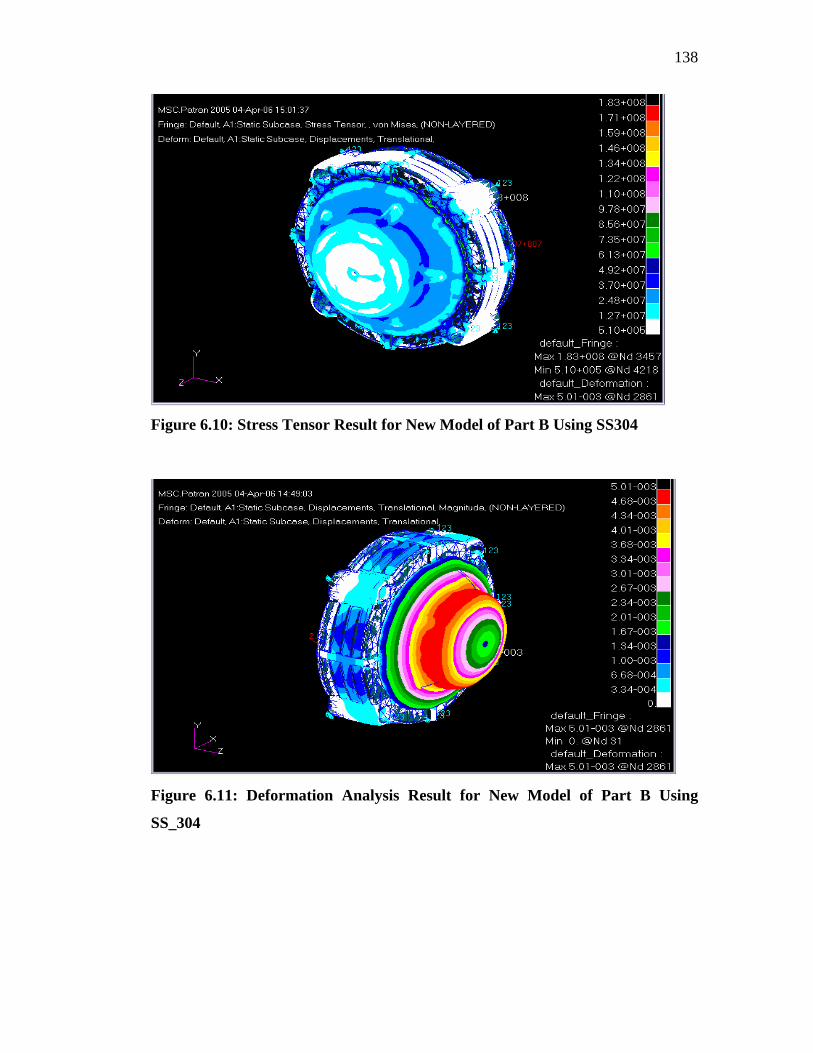
138
Figure 6.10: Stress Tensor Result for New Model of Part B Using SS304
Figure 6.11: Deformation Analysis Result for New Model of Part B Using
SS_304
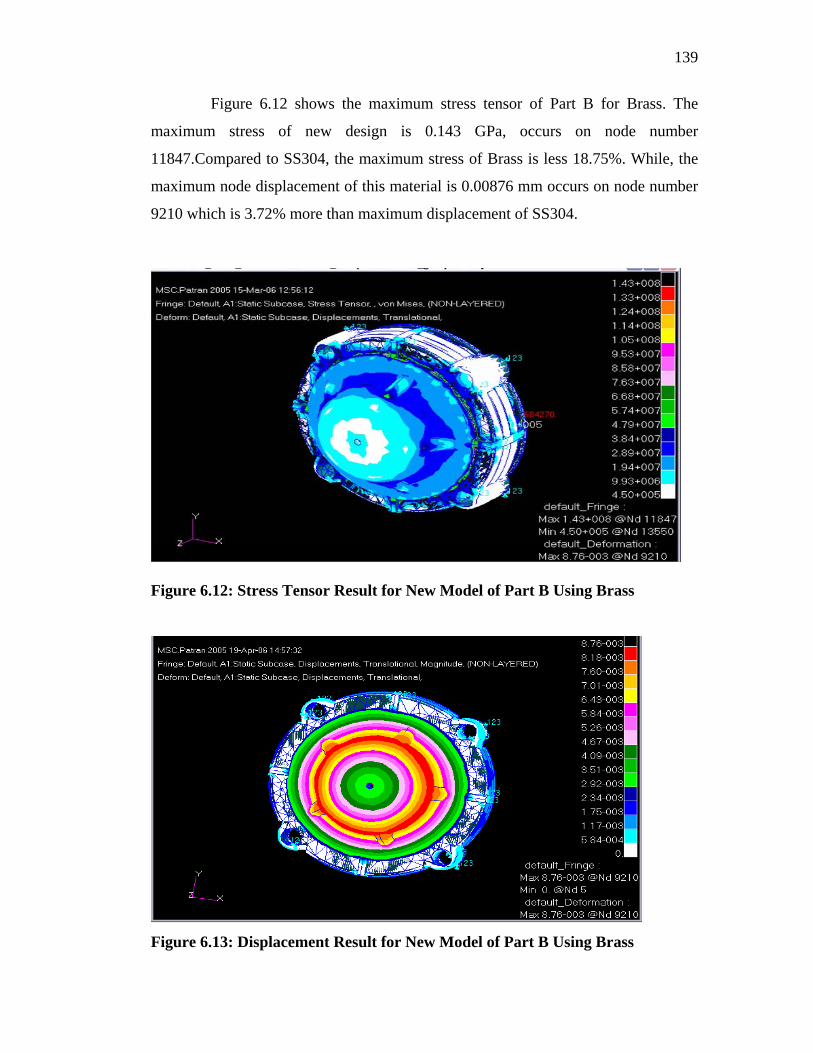
139
Figure 6.12 shows the maximum stress tensor of Part B for Brass. The
maximum stress of new design is 0.143 GPa, occurs on node number
11847.Compared to SS304, the maximum stress of Brass is less 18.75%. While, the
maximum node displacement of this material is 0.00876 mm occurs on node number
9210 which is 3.72% more than maximum displacement of SS304.
Figure 6.12: Stress Tensor Result for New Model of Part B Using Brass
Figure 6.13: Displacement Result for New Model of Part B Using Brass

140
For aluminum cast alloy, the maximum stress tensor for Part B is
0.0854GPa occur at node number 2660. It is shown in Figure 6.14 below. The
maximum stress tensor of this material is less 51.48% and 46.96% than SS34 and
Brass. While, maximum node displacement of this material is 0.0108 mm occurs on
node number 13271 which is 53.3% and 56.48% more than maximum displacement
of SS304 and Brass.
Figure 6.14: Stress Tensor Result for New Model of Part B Using Aluminum
Cast Alloy
Figure 6.15: Deformation Analysis Result for New Model of Part B Using
Aluminum Cast Alloy
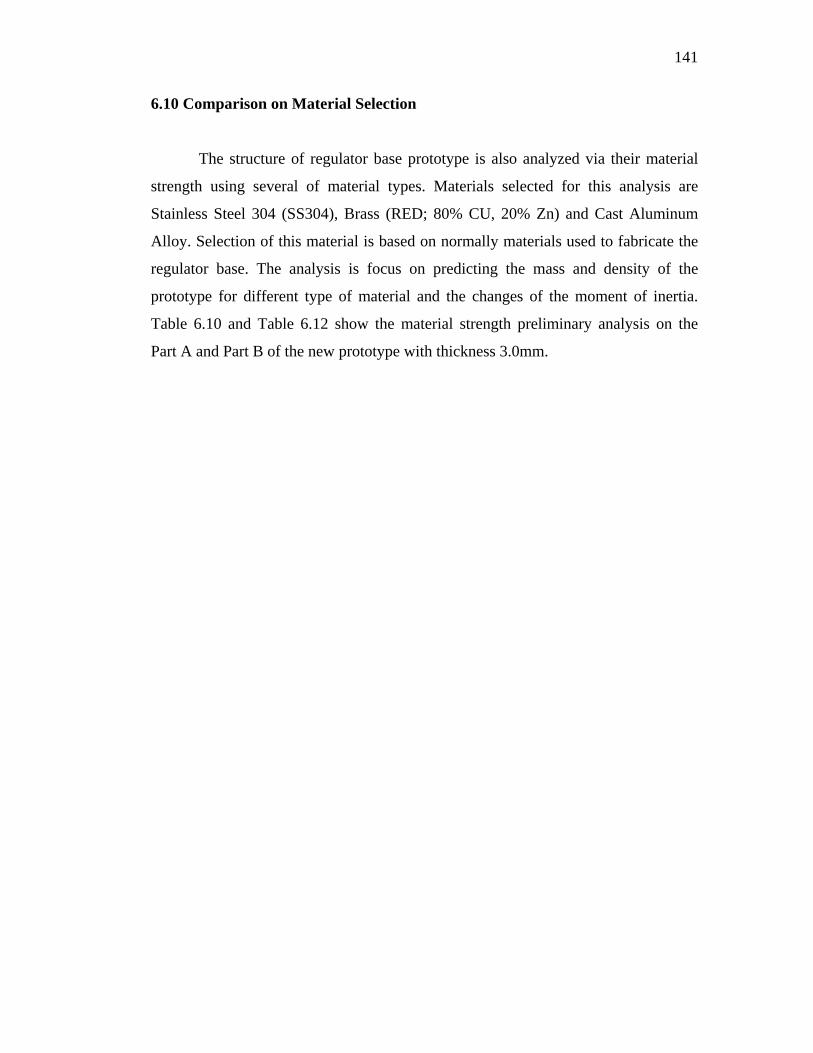
141
6.10 Comparison on Material Selection
The structure of regulator base prototype is also analyzed via their material
strength using several of material types. Materials selected for this analysis are
Stainless Steel 304 (SS304), Brass (RED; 80% CU, 20% Zn) and Cast Aluminum
Alloy. Selection of this material is based on normally materials used to fabricate the
regulator base. The analysis is focus on predicting the mass and density of the
prototype for different type of material and the changes of the moment of inertia.
Table 6.10 and Table 6.12 show the material strength preliminary analysis on the
Part A and Part B of the new prototype with thickness 3.0mm.
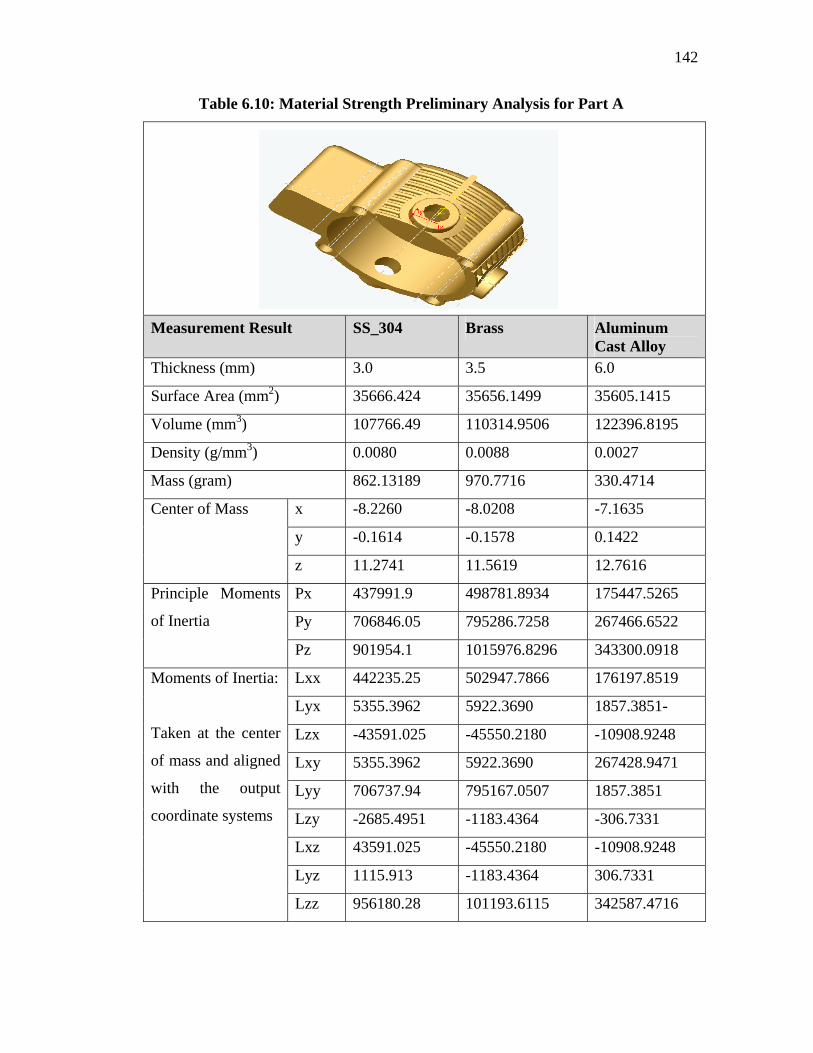
142
Table 6.10: Material Strength Preliminary Analysis for Part A
Measurement Result SS_304 Brass Aluminum Cast Alloy
Thickness (mm) 3.0 3.5 6.0
Surface Area (mm2) 35666.424 35656.1499 35605.1415
Volume (mm3) 107766.49 110314.9506 122396.8195
Density (g/mm3) 0.0080 0.0088 0.0027
Mass (gram) 862.13189 970.7716 330.4714
x -8.2260 -8.0208 -7.1635
y -0.1614 -0.1578 0.1422
Center of Mass
z 11.2741 11.5619 12.7616
Px 437991.9 498781.8934 175447.5265
Py 706846.05 795286.7258 267466.6522
Principle Moments
of Inertia
Pz 901954.1 1015976.8296 343300.0918
Lxx 442235.25 502947.7866 176197.8519
Lyx 5355.3962 5922.3690 1857.3851-
Lzx -43591.025 -45550.2180 -10908.9248
Lxy 5355.3962 5922.3690 267428.9471
Lyy 706737.94 795167.0507 1857.3851
Lzy -2685.4951 -1183.4364 -306.7331
Lxz 43591.025 -45550.2180 -10908.9248
Lyz 1115.913 -1183.4364 306.7331
Moments of Inertia:
Taken at the center
of mass and aligned
with the output
coordinate systems
Lzz 956180.28 101193.6115 342587.4716

143
Table 6.11: Material Strength Preliminary Analysis for Part B
Measurement Result SS_304 Brass Aluminum Cast Alloy
Thickness (mm) 3.0 3.5 6.0
Surface Area (mm2) 23206.4723 23179.1566 23219.0106
Volume (mm3) 60862.2857 61876.7158 65319.9116
Density (g/mm3) 0.0080 0.0088 0.0027
Mass (gram) 486.8983 535.5881 164.3282
x -0.0016 -0.0015 -0.0015
y 0.0058 0.0057 0.0054
Center of Mass
z 13.1930 13.1406 12.6811
Px 196482.0920 219133.4857 70477.6158
Py 198886.3836 221778.2067 71289.0645
Principle Moments
of Inertia
Pz 342941.6726 381362.5875 122002.8655
Lxx 198886.0400 221777.8287 71288.9485
Lyx -28.7423 -31.6166 -9.7006
Lzx 3.2699 3.5531 0.9724
Lxy 28.7423 -31.6166 -9.7006
Lyy 196482.4366 219133.8648 70477.7320
Lzy 12.2301 -13.2894 -3.6368
Lxz 3.2699 3.5531 0.9724
Lyz -12.2301 -13.2894 -3.6368
Moments of Inertia:
Taken at the center
of mass and aligned
with the output
coordinate systems
Lzz 342941.6715 381362.5863 122002.8653

144
Table 6.12: Material Strength Preliminary Analysis for New Prototype Model
Measurement Result SS_304 Brass Aluminum Cast Alloy
Thickness (mm) 3.0 3.5 6.0
Density (g/mm3) 0.0080 0.0088 0.0027
Volume (mm3) 168628.7757 172191.6664 187716.7311
Mass (gram) 1349.0302 1506.3597 494.7996
From Table 6.12 above, it shows that Aluminum Cast Alloy as construction
material provide the largest thickness and volume compared to SS304 and Brass
which is 6.0mm and 187716.7311 mm3. The thickness of new prototype with
aluminum cast alloy is 50% larger than SS304. While, the differential in volume
between aluminum cast alloy and SS304 is only 10.17%.
For the mass analysis, it base on the three type of the material selection,
which is Stainless Steel (SS304), Brass (RED; 80% CU, 20% Zn) and Aluminum
(pure). Even though, aluminum cast alloy give the largest thickness among the
selected material construction but this material offer the minimum value of weight
which is 63.32% less than SS304.
Decisions on selecting the most preferable material for the fabrication of this
regulator also have to take serious consideration on the material market price, in
order to gain the mot economic value. Based on the latest market price obtained from
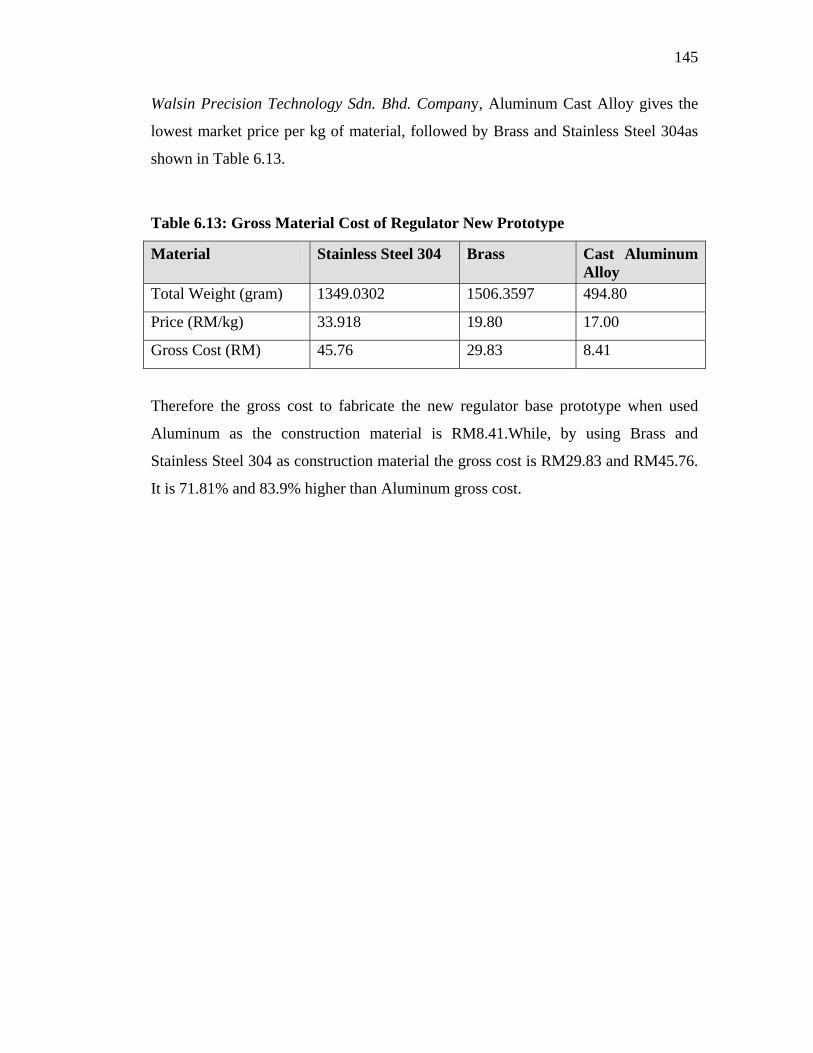
145
Walsin Precision Technology Sdn. Bhd. Company, Aluminum Cast Alloy gives the
lowest market price per kg of material, followed by Brass and Stainless Steel 304as
shown in Table 6.13.
Table 6.13: Gross Material Cost of Regulator New Prototype
Material Stainless Steel 304 Brass Cast Aluminum Alloy
Total Weight (gram) 1349.0302 1506.3597 494.80
Price (RM/kg) 33.918 19.80 17.00
Gross Cost (RM) 45.76 29.83 8.41
Therefore the gross cost to fabricate the new regulator base prototype when used
Aluminum as the construction material is RM8.41.While, by using Brass and
Stainless Steel 304 as construction material the gross cost is RM29.83 and RM45.76.
It is 71.81% and 83.9% higher than Aluminum gross cost.
CHAPTER 7
CONCLUSION
The previous chapter vividly shows the performance of the newly developed
pressure regulator evaluated by the newly developed pressure regulator test rig. It
clearly shows that both the regulator prototype and the regulator test bench has met
their objective and has proven to be effective. The performance of the regulator has
proven to provide constant pressure at fluctuating flow rates and varying inlet
pressure.
Based from the previous research project, a further extend and improvement
has been made through the use of finite element analyses; the optimized design of
NGVM pressure regulator thickness with the appropriate satisfying material
construction is obtained. In the design of pressure regulator structure, it is primarily
important to verify that the regulator is able to effectively manage NGV fuel system.
This is to ensure the safety and durability of the pressure regulator when it operates at
the applied pressure.
Cast Aluminum Alloy as construction material provide minimum amount of
stress tensor compared to Brass and Stainless Steel 304, which is 0.104GPa occurs at
node number 4681. Though the optimize thickness is 6.0mm, but total weight of base
prototype using Cast Aluminum Alloy offer the minimum mass and gross cost.
Results has been summarise shown in Table 7.1 below.
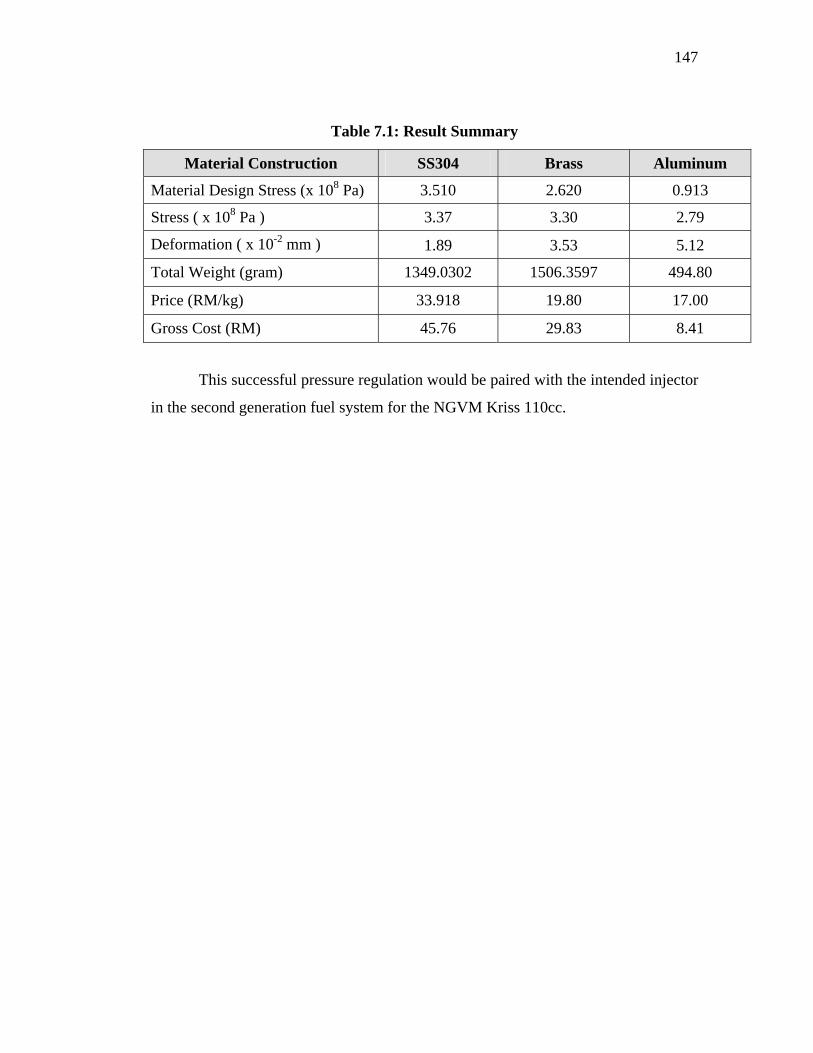
147
Table 7.1: Result Summary
Material Construction SS304 Brass Aluminum
Material Design Stress (x 108 Pa) 3.510 2.620 0.913
Stress ( x 108 Pa ) 3.37 3.30 2.79
Deformation ( x 10-2 mm ) 1.89 3.53 5.12
Total Weight (gram) 1349.0302 1506.3597 494.80
Price (RM/kg) 33.918 19.80 17.00
Gross Cost (RM) 45.76 29.83 8.41
This successful pressure regulation would be paired with the intended injector
in the second generation fuel system for the NGVM Kriss 110cc.

148
REFERENCES
Birky, A., Greene, D., Gross, T., Hamilton, D., Heitner, K., Johnson, L., Maples, J.,
Moore, J., Patterson, P., Plotkin, S., Stodolsky, F. Future U.S. Highway
Energy Use: A Fifty Year Perspective. Office of Transportation Technologies
Energy Efficiency and Renewable Energy, U.S. Department of Energy. 2001.
Min, B. H., Bang, K.H., Kim, H. Y., Chung, J. T., Park, S. Effect of Gas
Compositions on the Performance and Hydrocarbon Emissions for CNG
Engines. SAE Technical Paper 981918. 1998.
Subramaniam, P. K., Yaacob, Z., Amin, N. A. S., Piau, M. P. K. I., Majid, Z. A., Low
Pressure Storage System for Natural Gas Vehicle in Malaysia for Next
Millennium. Malaysian Science & Technology Congress Plaza Hotel, Johor
Bharu, 6-8th Dec. 1999.
Yeap Beng Hi. Computational Modelling of Air Fuel Mixer for Natural Gas
Powered Motorcycle. Masters Thesis. Universiti Teknologi Malaysia. 2002.
Wiederkehr, P. Motor Vehicle Pollution: Reduction Strategies Beyond 2010.
Organisation for Economic Co-operation and Development, Paris. 1995.
Alternative Fuel Vehicle Report: Fiscal Year 2002. Department of Commerce. 2002.
U.S. Department of Transportation. Fuel Options for Reducing Greenhouse Gas
Emissions from Motor Vehicles. Final Report September 2003.
Department of Energy. Alternative Fuel News Vol.5-No.3 U.S.
149
Langer, T., Williams, D. Greener Fleets: Fuel Economy Progress and Prospects.
Report Number T024, American Council for an Energy-Efficient Economy.
2002.
Tutt, E. Diesel Engines Emission Reduction: California’s Clean Air Strategy.
California Air Resources Board of U.S. 2003.
Winter, C. A Green Energy Strategy for Ontario. The Conservation Council of
Ontario. 2002.
Bleviss, D. L. Urban Transportation: Challenges Facing Latin America. 1999.
Sobti, G. S. Indian Automotive Industry. Office of Canadian High Commission,
India. 2003.
Bose, R. K. Automotive energy use and emissions control: a simulation model to
analyse transport strategies for Indian metropolis. Tata Energy Research
Institute, India. 1999.
Wolf, J.F., Nordheimer, R.K. BMW’s Energy Strategy Promoting the Technical and
Political Implementation. SAE Technical Paper 2000-01-1324. 2000.
Gustavsson, N. Alternative Fuels Environmental Care as VCC Core Value. Volvo
Car Corporation. 2003.
Suga, T., Muraishi, T., Brachmann, T., Yatabe, F. Potential of a Natural Gas Vehicle
as EEV. SAE Technical Paper 2000-01-1863. 2000.
Ishak A. Urban Air Quality Management: Motor Vehicle Emission Control in
Malaysia. Paper No. 18. Clean Air Regional Workshop.2001.
PETRONAS NGV Sdn. Bhd. Natural Gas for Vehicle (NGV). Kuala Lumpur. 1996.

150
Leong, C.F. “Instructions for Assembly of Compressed Natural Gas Equipment on a
Vehicle” Tractors Malaysia. 1996.
Tartarini Automotive. Instructions for the Assembly of CNG Equipment on a Vehicle.
Italy. 1982.
Chen, J.L., Chen, G. Flow and Structural Analysis for Fuel Pressure Regulator
Performance. SAE Technical Paper 950073. 1995.
Kalam, M. A., Masjuki, H. H, Maleque, M. A., Amalina, M. A., Abdessalem, H. and
Mahlia, T.M.I. Air-Fuel Ratio Calculation for a Natural Gas-Fuelled Spark
Ignition Engine. SAE Technical Paper 2004-01-0640. 2004.
IMPCO Technologies Inc. Material Handling & Industrial Engine Gaseous Fuel
Training Manual. 1998.
Yaacob, Z., Majid, Z. A., Piau, M. P. K. I. A Study on Exhaust Emission,
Performance and Lubricating Oil. Jordan International Chem. Eng.
Conference III. 27-29 Sept. Amman, Jordan. 1999.
Martin Philip King Ik Piau. Development of natural gas fuel system for motorcycle
with exhaust emission and performance comparison to gasoline. Masters
Thesis. Universiti Teknologi Malaysia. 2001.
Piau, M. P. K. I. P, Yaacob, Z., Majid, Z. A., Mohsin, R: Development of Natural
Gas Motorcycle in Malaysia. Gasex 2000, Conference and Exhibition.
Pattaya, Thailand, 11-14th September 2000.
Majid, Z. A., Yaacob, Z., Mohsin, R., Piau, M. P. K. I. Cleaner Emission From
Natural Gas Powered Motorcycle. Malaysian Science & Technology
Congress’ 99. Hilton Kuching, Sarawak, 8-10th Nov. 1999.

151
Majid Z. A., Yaacob, Z., Piau, M. P. K. I. Natural Gas Motorcycle- Emission.
International Conference & Exhibition on Natural Gas Vehicle. Yokohama,
Japan, 17-20th October 2000.
Majid, Z. A., Yaacob, Z., Yahya, M. A.A Comparison Study on Engine Oil
Properties for Bi-Fuel Motorcycle. Second World Engineering Congress
2002, Sarawak, 22nd-25th July 2002.
Whitehouse, R.C. The Valve and Actuator User’s Manual. The British Valve and
Actuator Manufacturers Association. Mechanical Engineering Publications
Limited. 1993.
Jury, F. D. Fundamental of Gas Pressure Regulation. Technical Monograph 27,
Fisher Controls Company.1972.
Carlson, H. Springs: Troubleshooting and Failure Analysis. Marcel Dekker, Inc.
1980.
Smith, B. and Vivian, B.E. An Introductory Guide to Valve Selection. Mechanical
Engineering Publications Limited. 1995.
Zappe, R.W. Valve Selection Handbook: Engineering Fundamentals for Selecting
Manual Valves Check Valves and Pressure Relief Valves. Gulf Publishing
Company. 1981.
Lyons, J. L. Lyon’s Valve Designer’s Handbook. Van Nostrand Reinhold Company.
1982.
Warring, R.H. Spring Design and Calculation. Model & Allied Publications Limited.
1973.
Stanton, V. A. The Best Spring Material for High Temperature. Spring Design and
Application. McGraw-Hill. Pg 314-318, 1961.

152
Jury, F. D. Fundamental of Three-Mode Controllers. Technical Monograph 28.
Fisher Control Company. 1973.
Heenan, J.S. Fuel System Pressure Control Improves NGV Performance. SAE
Technical Paper 960851. 1996.
International Standard. Road Vehicles- Compressed Natural Gas (CNG) Fuel System
Components – Pressure Regulator. ISO 15500 -9. 2001.
Malaysian Standard. Code of Practice for the Use of CNG Fuels in Internal
Combustion Engines, MS 1096. 1997.
National Fire Protection Association. Standard for Compressed Natural Gas (CNG)
Vehicular Fuel Systems. NFPA 52. 1984.
Sun, X., Aia, A., Hussain, S. A Dual-Fuel System for Motor Vehicles. SAE Technical
Paper 981356. 1998.
Pan, C. P., Li, M.C., Hussain, S.F. Fuel Pressure Control for Gaseous Fuel Injection
Systems. SAE Technical Paper 981397. 1998.
Oothuizen, P. H. and Carscallen, W. E. Compressible Fluid Flow. McGraw Hill Inc.
1997.
Versteeg, H. K. and Malalasekera, W. An Introduction to Computational Fluid
Dynamics, The Finite Volume Method. Prentice Hall. 1995.
Friend, D. G. Ely, J. F., Ingham, H. Thermophysical Properties of Methane. J. Phys.
Chem. Ref. Data 1989. Vol. 18 No.2.
Cain, T. Spring Design & Manufacture. Workshop Practice Series Number 19. Argus
Books Limited. 1988.
Society of Automotive Engineers. Manual on Design and Application of Helical and
Spiral Springs. SAE HS 795. 1990.
153
Carlson, C.R.H. Properties of Spring Materials and Allowable Working Stresses.
Spring Design and Application. McGraw-Hill. Pg 310-313; 1961.
The American Society of Mechanical Engineers. ASME Boiler and Pressure Vessel
Code, Section VIII Division. 1977.
Blake, A. Threaded Fasteners. What Ever Engineer Should Know Series Vol. 18.
Marcel Dekker, Inc.1986.
Society of Automotive Engineers. Mechanical and Material Requirements for Metric
Externally Threaded Steel Fasteners. SAE J1199. 2001.
Eakin, C.T. High Temperature Creep of Coil Springs. Spring Design and
Application. McGraw-Hill. Pg 77-81; 1961.
Beckwith, J.B. Flat Spring Material – Cost and Stress Factors. Spring Design and
Application: McGraw-Hill. Pg 122; 1961.
Dillon, C.P. Corrosion Resistance of Stainless Steels. Marcel Dekker Inc. 1995.
American Society of Testing Materials. Standard Specification for Carbon and Alloy
Steel Nuts [Metric]. A 563 M. 2003.
Kalpakjian, S. Manufacturing Engineering and Technology. Addison Wesley
Publishing Company. 1995.

1
APPENDIX
2
BI-FUEL ENGINE FUEL CONSUMPTION AND EMISSION RESULTS BASED ON NON-LOADED OPERATION
Rahmat, M., Zulkefli, Y., Shameed, A.
Gas Engineering Department Faculty of Chemical and Natural Resources Engineering
Universiti Teknologi Malaysia 81310 UTM Skudai, Johor Darul Takzim, Malaysia.
ABSTRACT
Alternative fuels for the internal combustion engines are introduced as an
improved fuel over mainstream fuels such as petrol and diesel. Compressed Natural Gas (CNG) is the most successful and widely used alternative fuels that helps mitigate emission problem caused by vehicles. Mainstream fuelled vehicles are fitted with a conversion kit to enable the operation with CNG, these converted vehicles are called Natural Gas Vehicles. A bi-fuel fuel engine test rig was fabricated using a 1500cc 12 Valve engine fitted with a Landi Renzo conversion kit enabling operations on petrol and natural gas. This test rig was used to conduct experiments to obtain the fuel consumption and the corresponding exhaust emission quality. The results obtained were compared with the actual NGV taxi using a Tartarini conversion kit for validation purpose. The findings from this experimental rig form a comparison between the use of petrol and natural gas as fuel for vehicles. The results clearly prove that the use of natural gas provides better exhaust emission at lower cost. Keywords: NGV, bi-fuel engine, fuel consumption, exhaust emission. Bahanapi alternative diperkenalkan sebagai bahanapi yang lebih baik untuk menggantikan bahanapi konvensional seperti petrol dan diesel. Gas Asli Termampat merupakan bahanapi alternative yang paling berkesan dan digunakan diseluruh dunia. Pembakaran gas asli yang lebih bersih dari bahanapi utama lain dapat mengurangkan pencemaran udara akibat kenderaan. Kit pengubahsuaian perlu dipasang untuk membolehkan kenderaan untuk berfungsi menggunakan gas asli. Bagi menguatkan pemahaman ke atas system dwi-bahan, rig pengujian engine menggunakan injin 1500 cc 12 Injap yang dilengkapi dengan kit Landi Renzo telah dihasilkan. Rig ujikaji ini digunakan untuk mendapatkan kadar keperluan bahanapi dan pembebasan eksos pada kelajuan injin yang pelbagai. Keputusan yang diperolehi dibandingan dengan hasil yang diperolehi menggunakan kit tartarini untuk memastikan kesahihan keputusan. Hasil ujikaji ini membuktikan bahawa penggunaan gas asli sebagai bahanapi dapat menggurangkan pencemaran udara dan mengurangkan kos. Katakunci: NGV, enjin dwi-bahanapi, kadar penggunaan bahanapi, pembebasan Ekzos.
3
1 INTRODUCTION
The introduction of Compressed Natural Gas (CNG) as an alternative fuel in Malaysia was supported by various factors that include; the abundant local natural gas reserve, the availability of Peninsular Gas Utilization distribution system (PGU) infrastructure, and the clean burning property of natural gas. The typical petrol operated mono-fuel vehicle is fitted with an imported conversion kit enabling bi-fuel capabilities of petrol and CNG. Two authorised conversion kit installers in Malaysia are Tractors Malaysia and OGPP that supply Tartarini NGV and Landi Renzo conversion kits respectively. These imported Natural Gas Vehicle (NGV) conversion kits are exempted from import duty and sales tax to encourage vehicle user to convert the engine into bi-fuel system. Road tax is reduced from the existing level by 50% for Mono-fuel (operating only on one fuel i.e. natural gas) and 25% for bi-fuel (operating on two types of fuel, one at a time) and dual- fuel (operating on both fuels forming a mixture of fuel).
The Petronas is the only fuel retailer that offers CNG to NGV users. There are
two types of NGV station called “mother station” and “daughter station”. The “mother station” type has a natural gas pipeline to its premises where the gas is compressed to 3600 psig via three stage compressor system and stored in a cascading storage system. The cascading storage systems are made portable enabling it to be moved to the “daughter station”. The daughter station supplies customers from the cascading storage system charged at the “mother station”. This is done by transferring the CNG from the cascading storage to the vehicle’s onboard storage cylinder thru the CNG dispenser unit.
Petrol is priced at RM 1.36 per litre where as one litre of natural gas is priced
at RM 0.585, making it the cheapest commercial fuel available in the market. The litre measurement used to describe the CNG pricing is proven by calculations shown in the appendix that it is actually litres energy equivalent to petrol. Due to the energy equivalent factor, the energy within the natural gas bought for RM 0.565 is the same as the energy content within 1 litre of petrol at RM 1.34. It is known from reference that 1 litre of petrol has approximately 30.676 MJ of energy [1]. The energy content of Malaysian natural gas is 1053 Btu per cubic ft [2] which translates to 0.9574 MJ per mol of natural gas. From experiments conducted, one 55 litre water capacity tank would accommodate approximately RM 7 worth of natural gas. The energy content of this fully charged tank is predicted as 380 MJ by the energy content calculations (shown in appendix A). The value is then divided with the energy content per mol of natural gas to obatain 397 moles of nattural gas per charge of a 55 litre cylinder. The petrol cost for similar amount of energy would sum up to RM 16.60, giving savings up to RM 9.60 for every charge of the NGV tank.
The amount of moles within the NGV cylinder as predicted by the energy
content calculation is validated using PV relations based on thermodynamic principles. The generalized correlation for gases by Pitzer [3], Benedict/Webb/Rubin [4], and results obtained from Friend et al [5] are compared to obtain the best prediction of mol content within the storage cylinder. The findings by Friend et al, is comparatively the most accurate method and proves similar value with the Benedict/Webb/Rubin method until the designed CNG operating pressure of 3000
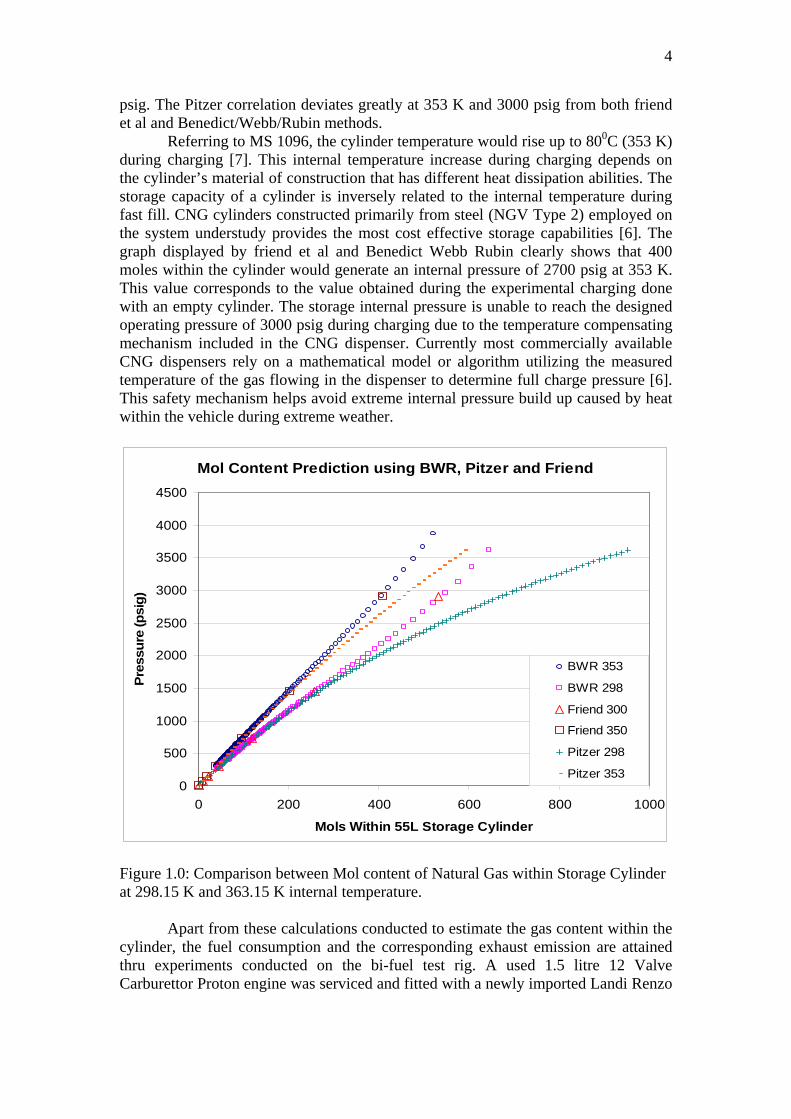
4
psig. The Pitzer correlation deviates greatly at 353 K and 3000 psig from both friend et al and Benedict/Webb/Rubin methods.
Referring to MS 1096, the cylinder temperature would rise up to 800C (353 K) during charging [7]. This internal temperature increase during charging depends on the cylinder’s material of construction that has different heat dissipation abilities. The storage capacity of a cylinder is inversely related to the internal temperature during fast fill. CNG cylinders constructed primarily from steel (NGV Type 2) employed on the system understudy provides the most cost effective storage capabilities [6]. The graph displayed by friend et al and Benedict Webb Rubin clearly shows that 400 moles within the cylinder would generate an internal pressure of 2700 psig at 353 K. This value corresponds to the value obtained during the experimental charging done with an empty cylinder. The storage internal pressure is unable to reach the designed operating pressure of 3000 psig during charging due to the temperature compensating mechanism included in the CNG dispenser. Currently most commercially available CNG dispensers rely on a mathematical model or algorithm utilizing the measured temperature of the gas flowing in the dispenser to determine full charge pressure [6]. This safety mechanism helps avoid extreme internal pressure build up caused by heat within the vehicle during extreme weather.
Mol Content Prediction using BWR, Pitzer and Friend
0
500
1000
1500
2000
2500
3000
3500
4000
4500
0 200 400 600 800 1000
Mols Within 55L Storage Cylinder
Pres
sure
(psi
g)
BWR 353
BWR 298
Friend 300
Friend 350
Pitzer 298
Pitzer 353
Figure 1.0: Comparison between Mol content of Natural Gas within Storage Cylinder at 298.15 K and 363.15 K internal temperature. Apart from these calculations conducted to estimate the gas content within the cylinder, the fuel consumption and the corresponding exhaust emission are attained thru experiments conducted on the bi-fuel test rig. A used 1.5 litre 12 Valve Carburettor Proton engine was serviced and fitted with a newly imported Landi Renzo

5
conversion kit to form the bi-fuel engine test rig. This helps establish a comprehensive understanding on the existing bi-fuel engine fuel system widely implied on local taxis. 2 THE BI-FUEL ENGINE TEST RIG The engine test rig has three mounting points that are made adjustable in both horizontal and vertical direction to aid the alignment of the engine onboard the rig. These movable mounting points would allow the engine rig to cater for other engines with similar size. The four poles around on the main structure is design to hold the closure panel to ensure safety of operator from the moving parts of the engine. Wheels are attached to the rig to ease manoeuvring and to aid the dampening of the engine vibration during operation. The rig metal structure is coated with epoxy (powder coating) to avoid corrosion caused by extreme working conditions. The installation of the NGV fuel system was based on the MS 1096 and NFPA 52. Graphical representation of the main structure used to support the engine and other equipments are as shown in Figure 2.0. Two separate skids are made to hold the NGV storage cylinder and the engine respectively. Figure 3.0 displays the control panel used to hold other components such as the petrol tank, the switches and sensors in place. Figure 4.0 depicts the bi-fuel system where the petrol from the tank is drawn and sent to the carburettor through a petrol solenoid valve. The return hose from the petrol pump is used to send access petrol to the storage tank during the NGV operation. The NGV system can be seen where the high pressure CNG is sent to the pressure regulator via high pressure tubing. Low pressure natural gas from the pressure regulator is then sent to the mixer beneath the air filter using a low pressure hose. Figure 5.0 presents the rig setup equipped with closure panels and extended exhaust pipe for operation.
Figure 2.0: Main Engine Mounting Frame
Figure 3.0: Test rig equipped with control panel

6
Figure 4.0: Bi-fuel Fuel Systems
Figure 5.0: Engine Test Rig for Operation
The engine components were assembled and wired according to Figure 6.0. When the ignition key is turned to I.G point (ignition - engine starting position), the current from the battery will be supplied to the various components such as the carburettor, radiator fan, spark distributor, and alternator. The voltage of the current is magnified by the ignition coil at the spark distributor to provide suitable voltage for the operation of spark plug. The distributor provides the spark for the combustion to take place according to the engines preset firing order. Current supplied to the petrol solenoid within the carburettor will allow fuel from the petrol pump to enter the carburettor to form combustible mixture with air. The fuel from the petrol tank is drawn by the petrol pump actuated by the movement of the cam shaft caused by the movement of pistons. Excess petrol from the petrol pump will be sent to the petrol tank thru the fuel return line. The alternator is used to recharge the battery and to supply power to other components on board the car such as car lamp, radio which are not relevant in our study.
When the ignition is turned to start, the current from the battery is supplied to
the starter motor which cranks the engine. This will begin the four stroke combustion cycle (intake, compression, power, exhaust) within the engine block which is perpetual depending on the supply of fuel; air and electric current are supplied. The engine is turned off by cutting the current supply from the battery thru the ignition key. The distributor is unable to supply current to form spark within the combustion chamber. This would cause the petrol solenoid to block the petrol from entering the carburettor. The conversion kit employed on this test rig is only suitable for the carburetion type internal combustion engine. The conversion kit produced by Landi Renzo comprises of a fuel selector switch, step 51 (spark advancer), mixer, pressure regulator and petrol solenoid. The electrical wiring for the conversion kit is shown in the Figure 6.0. The completely assembled conversion kit would enable the operator to switch between fuels thru the fuel selector switch with ease.
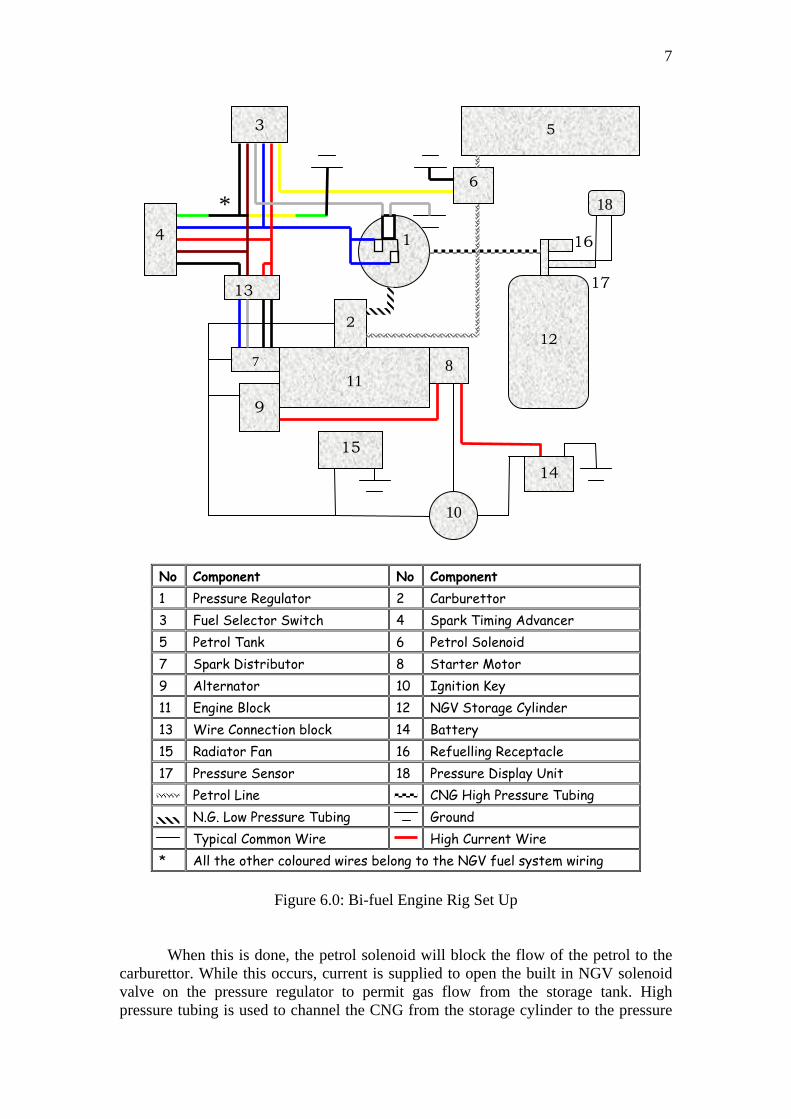
7
14
10
15
2
12
5
11
7
1
6
*
17
16
18
13
9
8
3
4
No Component No Component 1 Pressure Regulator 2 Carburettor 3 Fuel Selector Switch 4 Spark Timing Advancer 5 Petrol Tank 6 Petrol Solenoid 7 Spark Distributor 8 Starter Motor 9 Alternator 10 Ignition Key 11 Engine Block 12 NGV Storage Cylinder 13 Wire Connection block 14 Battery 15 Radiator Fan 16 Refuelling Receptacle 17 Pressure Sensor 18 Pressure Display Unit Petrol Line CNG High Pressure Tubing N.G. Low Pressure Tubing Ground Typical Common Wire High Current Wire * All the other coloured wires belong to the NGV fuel system wiring
Figure 6.0: Bi-fuel Engine Rig Set Up
When this is done, the petrol solenoid will block the flow of the petrol to the carburettor. While this occurs, current is supplied to open the built in NGV solenoid valve on the pressure regulator to permit gas flow from the storage tank. High pressure tubing is used to channel the CNG from the storage cylinder to the pressure

8
regulator. At the regulator, gas is regulated according to the requirement of the engine and sent to the mixer through the low pressure tubing. The natural gas fuel demand of the engine is sensed using the vacuum pressure generated by the air flow thru the mixer. This vacuum pressure generated by the mixer acts on the 3rd stage diaphragm of the regulator to provide greater fuel flowrate. The spark advancer is activated during engine operation with gas to alter the spark sequence to suit the combustion of CNG which varies from petrol. The mixer placed beneath the air filter not only detects fuel flow but also promotes the mixing between natural gas and air to improve combustion. 3 METHODOLOGY
The engine RPM was gauged using an infrared tachometer installed at the flywheel. The engine RPM was varied by manipulating the throttle opening at the carburettor. The engine RPM was held at a constant value while the fuel consumption and fuel emission was carried out. The petrol consumption was measured by combining a measuring cylinder and a stopwatch that provided the rate of fuel volume consumed by the engine at constant engine RPM. The corresponding exhaust emission of the engine was also acquired simultaneously at the same engine RPM. Several runs were conducted for each engine RPM to ensure the repeatability of the result obtained. The engine RPM was increased by 1000 from 1000 to 5000 in order to obtain the fuel consumption and emission behaviour of the bi-fuel engine.
Similar test was conducted to obtain the natural gas consumption and the
emission generated at different engine RPM. The method used to measure the natural gas consumption is based on the fact that the storage cylinder pressure will deplete proportionally to the moles of gas consumed at constant engine RPM. Higher engine RPM would consume more fuel causing greater rate of pressure depletion within storage cylinder. The relation between the storage pressure and mol content of gas within the tank is established using suitable thermodynamic equation incorporating the compressibility factor. The time taken for the pressure drop will be used to calculate the mol flowrate of gas consumed. The fuel consumption and corresponding emission result for both petrol and natural gas are displayed in the following section.
Ensure Constant Engine
Obtain Fuel Consumption Rate
Obtain Exhaust Emission
Figure 7.0: Methodology arranged in sequence for each engine RPM.

9
4 RESULTS & DISCUSSION 4.1 Fuel Consumption Result
The emission results from this bi-fuel test rig operating on natural gas were compared with the results obtained by Tractors Malaysia that carried out tests based on a similar engine fitted with a Tartarini NGV conversion kit. The unburned hydrocarbon values of 50-60 ppm discharged at 2500 RPM by the Tartarini fuel system (shown in the appendix B) is similar to the results obtain using the fuel system understudy (Figure 11.0). The rig understudy releases 0.1 % CO (Figure 12.0) which is much lower then the results from the tartarini fuel system that releases 0.3-0.5% CO (Appendix B). This is caused by the spark advancer employed in the landi renzo kit understudy but not applied in the tartarini system. This comparison between the only two types of NGV fuel system authorised to be installed in similar 1500 cc 12 valve engine taxis proves the validity of the result of the study. Other results obtained from the test engine understudy are displayed and discussed in the following paragraphs.
Mols of Natural Gas Required By Engine According to Engine RPM
y = 1E-07x2 - 0.0002x + 1.1027R2 = 0.9994
0
0.5
1
1.5
2
2.5
3
3.5
0 2000 4000 6000
RPM
Mol
s pe
r Min
ute
Litres of Petrol Required By Engine According to Engine RPM
y = 5E-09x2 - 2E-05x + 0.0492R2 = 0.9902
0
0.02
0.04
0.06
0.08
0.1
0.12
0 2000 4000 6000
RPM
Lite
rs p
er M
inut
e
Figure 9.0: Litres of Petrol Required By Engine According to Engine RPM.
Figure 8.0: Moles of Natural Gas Required By Engine According to Engine RPM
O 2 Content in Exhaust Gas for Natural Gas and Petrol Operations At Various RPM
y = 9E-07x2 - 0.0078x + 17.28R2 = 0.9886
y = 5E-07x2 - 0.0038x + 7.1332R2 = 0.9948
0
2
4
6
8
10
12
14
0 2000 4000 6000Engine RPM
Oxy
gen
(%)
O2 Natural Gas
O2 Petrol
Energy Value of Natural Gas and Petrol Required By Engine
y = 1E-07x2 - 0.0002x + 1.0556R2 = 0.9994
y = 2E-07x2 - 0.0005x + 1.5057R2 = 0.9902
0
0.5
1
1.5
2
2.5
3
3.5
0 2000 4000 6000Engine RPM
Meg
a Jo
ule
per M
inut
e
Petrol M J
NG M J
Figure 11.0: Oxygen Content in Exhaust Gas for Natural Gas and Petrol Operations at Various RPM
Figure 10.0: Energy Value of Natural Gas and Petrol Required By Engine

10
The natural gas and petrol consumption at the corresponding engine crankshaft
revolutions (RPM) are displayed in Figures 8.0 and 9.0 respectively. Both the graphs display similar pattern indicating the engines intrinsic fuel requirement to generate the desired engine RPM. Since the fuel is in different phases, comparisons are done by converting the fuel in terms of energy content (similarly done in appendix A) as shown in Figure 10.0. The average engine energy requirement is obtained between the natural gas energy supply and the petrol energy supply to the engine. This average value may come in handy with future works on alternative fuel system design.
The percentage of oxygen content of the exhaust gas is obtained using the
emission analyser and plotted in figure 11. The exhaust oxygen content graph displays the lowest oxygen content within the region of 3500 engine RPM for the natural gas operation and 4200 engine RPM for the petrol operation. The most effective combustion occurs within this the minimal oxygen concentrated regions. This effective combustion would cause very low values of unburned hydrocarbon content in the exhaust gas. Figure 13.0 depicts minimal unburned hydrocarbon values around 3000 RPM for the natural gas operation and 3500 RPM for the petrol operation. This slightly differs from the optimum combustion point described by the exhaust oxygen content in figure. This phenomenon is caused by the intake volumetric efficiency which alters the air to fuel ratio.
NOx Release At Various Engine RPM for Natural Gas and Petrol Use
y = 14.068e0.0008x
R2 = 0.9943
0100200300400500600700800900
0 2000 4000 6000Engine RPM
Nox
(ppm
)N
atur
al G
as
0
2
4
6
8
10
12
14
NO
x (p
pm) P
etro
l
NOx Natural Gas
NOx Petrol
Unburned HC Emission for Natural Gas and Petrol Use
0100200300400500600700800900
0 2000 4000 6000
Engine RPM
HC
(ppm
)
HC Natural Gas
HC Petrol
Figure 12: NOx Content in Exhaust Gas at Resulting Engine RPM
Figure 13: Unburned Hydrocarbon Content in Exhaust Gas at Parallel Engine RPM
The formation of nitrogen oxides are caused either by the combustion itself or the heat of combustion called thermal NOx. Figure 12.0 describes that the formation of NOx during petrol operation decreases with engine RPM. This proves that the NOx is formed due to the poor combustion and mixing factors. As the engine RPM increases, better combustion and mixing causes the NOx formation to decrease. The situation is inversed in the natural gas operation. This occurrence is caused by the formation of thermal NOx, as the operation with natural gas would cause higher exhaust temperature. This temperature increases with the engine RPM as the rate of combustion and exhaust air emission increases.

11
CO2 and CO Emission At Various Engine RPM for NG and Petrol Use
y = -5E-07x2 + 0.0044x + 1.6561R2 = 0.9907
y = 3E-08x2 - 8E-05x + 0.1039R2 = 0.9543
y = -2E-07x2 + 0.0011x - 0.4753R2 = 0.1517
y = -2E-07x2 + 0.0018x + 9.5547R2 = 0.502
0
2
4
6
8
10
12
14
0 2000 4000 6000
Engine RPM
CO
x (%
)
CO2 NG
CO NG
CO2 Pet
CO Pet
COx Release At Various Engine RPM for Natural and Petrol Use
y = -5E-07x2 + 0.0043x + 1.76R2 = 0.9887
y = -4E-07x2 + 0.0028x + 9.0794R2 = 0.9457
0
2
4
6
8
10
12
14
16
0 2000 4000 6000
Engine RPM
CO
x (%
)
COx Natural Gas
COx Petrol
Figure 14.0: CO2 and CO Content in Exhaust Gas at Relevant Engine RPM
Figure 15.0: COx Content in Exhaust Gas at Releted Engine RPM

Carbon based emission gases are unavoidable due to the use of carbon based fuels. The formation of carbon monoxide is less favourable compared to carbon dioxide due to its impact on human health. Figure 15.0 portrays that the use of natural gas as fuel decreases the total carbon based emission gas compared with petrol operation. The break down of the carbon based exhaust emission is shown in Figure 14.0 as carbon monoxide and carbon dioxide. Carbon monoxide released by petrol operation is much greater compared to the use of natural gas. The discharge of carbon dioxide is also greater with the use of petrol compared to natural gas. 5 CONCLUSION
The results obtained from the bi-fuel test rig have achieved its objective to
provide a comprehensive understanding of the existing bi-fuel system existing in Malaysia. The emission data obtained has clearly proven that the use of natural gas is much more favourable compared to the use of petrol. The fuel cost calculations shown in the introduction has proven that natural gas is not only cleaner burning fuel but also cheaper then the existing mainstream fuels. Most effective combustion occurs at 3500 engine RPM during operation with natural gas and at 4200 engine RPM for the operation with petrol.
6 ACKNOWLEDGEMENT Authors would like to extend gratitude to the Ministry of Science Technology and Innovation (MOSTI) for the financial support under Vot 74169. Special thanks dedicated to the Research Management Centre (RMC), UTM for the kind assistance and support during the tenure of research. To those involved directly and indirectly to this project, authors are deeply indebted.
7 References
1. “Perry’s Chemical Engineers’ Handbook” 1997. 7th ed. McGraw-Hill, Inc. 2-195.
2. Gas Malaysia Sdn. Bhd., http://www.gasmalaysia.com. 3. Smith, J.M., Van Ness, H.C., Abbott, M.M. 1996. “Introduction to Chemical
Engineering Thermodynamics”. 5th ed., McGraw-Hill, Inc. 85-93.

13
4. Cengel, Y. A. & Boles, M.A. “Thermodynamics an Engineering Approach, 3rd ed., McGraw Hill, 1998.
5. Friend, D. G., Ely, J. F., Ingham, H. 1989. “Thermophysical Properties of
Methane”. J. Phys. Chem. Ref. Data. Vol. 18, No.2. 6. Diggins, D.D, “CNG Fuel Cylinder Storage Efficiency and Economy in Fast Fill
Operations”, SAE Technical Paper 981398, 1998. 7. MS 1096, 1997. “Code of Practice for the Use of CNG in Internal Combustion
Engines”. Department of Standards Malaysia. 8. MS 1024, 1986. “Specification for Wheel Nuts for Passenger Vehicles”.
Department of Standards Malaysia. 9. NFPA 52-1984. “Compressed Natural Gas (CNG) Vehicular Fuel Systems”.
National Fire Protection Association. 10. Leong, C.F., 1997. “Training Manual on NGV”, Tractors Malaysia Sdn Bhd.
8 APPENDIXES Appendix A
a) From the ideal gas law we know one mole of gas would occupy the following volume at room temperature.
LitresPa
KKmol
LiterkPa
PRTv 45.24
101325
298314.8=
×⋅
⋅
==
b) Energy content of Natural Gas
molMJ
btuMJ
molKatlitre
Litrecft
cftbtu
⋅=⋅
⋅×
⋅⋅
×⋅
⋅× 9573.0
8169879.9471
1)298(4.24
31684659.2811053
c) Energy content of 1 Litre of petrol (estimate 1)
LitreMJ
JMJ
molJ
gmol
kgg
Litrekg
⋅⋅
=×⋅
×⋅×
×⋅
⋅×
⋅⋅
×⋅
⋅1625.30
1011
11007.5
23.1141
11000
169.0
6
6
d) Energy content of 1 Litre of petrol (estimate 2)
molMJMJ
molLitremolLitre
⋅⋅
=×⋅
×⋅×
×⋅
⋅×⋅
1727.30
1011
11007.5
165.011 6
6
e) Energy within a 55 Litre NGV cylinder charged for RM 7

14
based on RM 0.565 NGV = RM 1.34 = 30.676 MJ
cylinderMJ
RMMJ
cylinderRM ⋅
=⋅
×425.379
565.0625.307
f) Mol content within a cylinder based on energy per mol of natural gas.
cylindermol
MJmol
cylinderMJ ⋅
=⋅
⋅×
⋅ 35.3969573.01425.379
Appendix B Compiled By Leong Chok Fong Group Training Manager 11th April 1997 Emission Reference Chart Gasoline HC RPM CO% Non-Catalyst : Idle 300 2.5-3.0 Catalyst : Idle 30-100 0.2-0.5 Non-catalyst @2,500 RPM No Load 100 0.5-1.5 Catalyst @2,500 RPM No Load 20-30 0.5-1.5 Non-Catalyst Full Load* 50-70 0.5-1.5 Catalyst Full Load* 10-20 0.1-0.2 Natural Gas HC RPM CO% Non-Catalyst : Idle 100-150 0.5-1.0 Catalyst : Idle 20-50 0.1-0.3 Non-catalyst @2500 RPM No Load 50-60 0.3-0.5 Catalyst @2500 RPM No Load 20-30 0.1-0.3 Non-catalyst: Full Load* 10-20 0.1-0.2 Catalyst Full Load* 10-20 0.1-0.2 *full throttle @ 80 KMH on Dynometer:

15
2nd gear Automatic 3 or 4 speed 2nd gear Manual 3 speed 3rd gear Manual 4 or 5 speed. Note : The above chart is for reference purpose only.


