Wage structure and skill development
in Korea and Japan
Soo Kyeong Hwang
(Research Fellow, Korea Labor Institute)
2006. 5. 28
2
1. Introduction
Korea and Japan have developed similar institutions in the labor market. A
dismissal without a just cause is strictly banned by the provisions and rules of EPL
(Employment Protection Legislation). Internal labor market and the HRM practices
such as worker-based (not job-based) management system and seniority-based wages
look similar in appearance between Korean firms and Japanese firms. However, labor
market outcomes from the two countries are quite different.
Japanese firms are commonly known to have a stronger internal labor market
system than Korean counterparts, in which a lifetime employment is ensured for all
incumbents and seniority-based wages and promotion system is still working.
Nonetheless, the insider-outsider problem in Japanese labor market does not attract
public attention as much as in Korean labor market. What makes the differences? How
Japanese firms are balancing the required flexibility and the rigidity of internal labor
market?
We believe that a matter of concern is not an each practice itself but the way of
combining the individual practices. This paper focuses especially on the relationship
between the wage structure and skill formation of workers and clarifies the similarities
and differences in HRM practices between in Korean firms and in Japanese firms. From
the comparisons, we try to find policy implications for Korean labor market.
2. The Dual Structure of Korean Labor Market
Bipolarization in the labor market is currently the one of the hottest issues in

3
Korea. Evidences of polarization in the Korean labor market are observed in the various
dimensions such as large/small company, regular/non-regular work, union/nonunion
sector.
In 2005, 37.7% of male and 61.8% of female wage earners have a temporary or
daily job position (Table 1) and the wage level of non-regular workers does not reach at
60% level of regular workers (National Statistical Office, Economically Active
Population Survey). As the wage differentials between large and small company has
been enlarged, the relative wages of workers in small firms with 10-29 employees to
their counterparts in large firms with 500 or more employees dropped from 74% in 1990
to 58% in 2004. Compared to the trend of the 1990s that moderately decreased at the
70% level, a rapid decline of relative wages appears over the 2000s (Figure 1). In the
meantime, the coverage of labor union shrunk to less than 11%, moreover, it is so
overrepresented by large companies that 2/3 of union members belong to large company
with 1,000 or more employees that being no more than 5.3% of the whole employees
(Ministry of Labor, 2004).
Table 1. Employment Structure in Korea (unit: thousand person, %)
1990 1995 2000 2005
Male 6,759 7,975 7,963 8,794
Regular 4,361 ( 64.5) 5,392 ( 67.6) 4,716 ( 59.2) 5,479 ( 62.3)
Temporary 1,512 ( 22.4) 1,595 ( 20.0) 2,112 ( 26.5) 2,182 ( 24.8)
Daily 886 ( 13.1) 987 ( 12.4) 1,135 ( 14.3) 1,134 ( 12.9)
Female 4,190 4,924 5,397 6,391
Regular 1,577 ( 37.6) 2,107 ( 42.8) 1,679 ( 31.1) 2,439 ( 38.2)
Temporary 1,659 ( 39.6) 2,003 ( 40.7) 2,496 ( 46.2) 2,874 ( 45.0)
Daily 954 ( 22.8) 814 ( 16.5) 1,222 ( 22.6) 1,079 ( 16.9)Source: National Statistical Office, Economically Active Population Survey

4
Figure 1. Wage Differentials between Large and Small Company (500 or more employees=100)
59 5854
51
89 8985
89 89 9087
79
7471 73 73 72 72 70
72 7168 69
6359
49
58
93
74
68
58
40
50
60
70
80
90
100
80 81 82 83 84 85 86 87 88 89 90 91 92 93 94 95 96 97 98 99 00 01 02 03 04
5-9人
10-29人
Source: Ministry of Labor, Monthly Labor Statistics Survey, each year.
While the regular workers in large companies enjoy the privileged positions with
higher wages, employment security and strong bargaining power, the workers who work
for small companies or non-regular jobs have to endure unfavorable employment
opportunities such as lower wages and employment insecurity without any protection.
The former can be regarded as the “insiders” and the latter as the “outsiders” in Korean
labor market in the sense that the former has some market power to set their wages
whereas the latter is completely competitive (Lindbeck & Snower, 1986, 1988).
The insiders’ labor market in Korea takes a traditional internal labor market
system that cultivates long-term loyalty and attachment from employees by providing
job security and various seniority-based HRM practices, where the object of
management is the “workers” who belong to the organization. On the other hand, the
outsiders’ labor market in Korea seems one that an entry and an exit of workers occur
frequently and a job-based compensation system dominates. In other words, the “jobs”
5
that firms possess are the direct object of management. In this context, the HRM system
of the insiders’ labor market is similar to Japanese HRM practices and that of the
outsiders’ labor market to the HRM practices of United States.
The initial formation of internal labor market in Korea is said to date from the
period of industrialization in 1970s after the model of Japan. However it was restricted
within some of white collar workers until the early 1980s. Taking advantage of
democratization after the later 1980s, internal labor market system spread to all blue
collar workers in large company and furthermore, a demand for living wages and a
single wage table system strengthened the seniority feature of wages. Putting the brake
on employer’s tyranny, labor unions have exercised a strong influence over job transfers
and rotations as well as wages. On the contrary to the world’s trend to increase
flexibility over the 1990s, the internal labor market in Korea turned to reinforce wage
rigidity and functional rigidity.
The Asian economic crisis in 1997-1998 has given a profound impact in HRM in
Korean firms. After the economic crisis, many Korean firms have been forced to reduce
their workforce: 66% of listed companies are reported to lay-off their workforce (Korea
Labor Institute, 2000). And they learned an important lesson to increase the flexibility in
managing their workforce, which was not a consideration in the growth era before. On
the employees’ side, this (direct or indirect) lay-off experience has changed their attitude
vis-à-vis the company: the tie between company and employees become loose and the
interest in the short term become more important. Employees’ demands inclined to get
more wages on the spot before they laid-off rather than to invest on career development
for the long term opportunities. These changes in both sides have given a strong shock
to the traditional Korean HRM system.
6
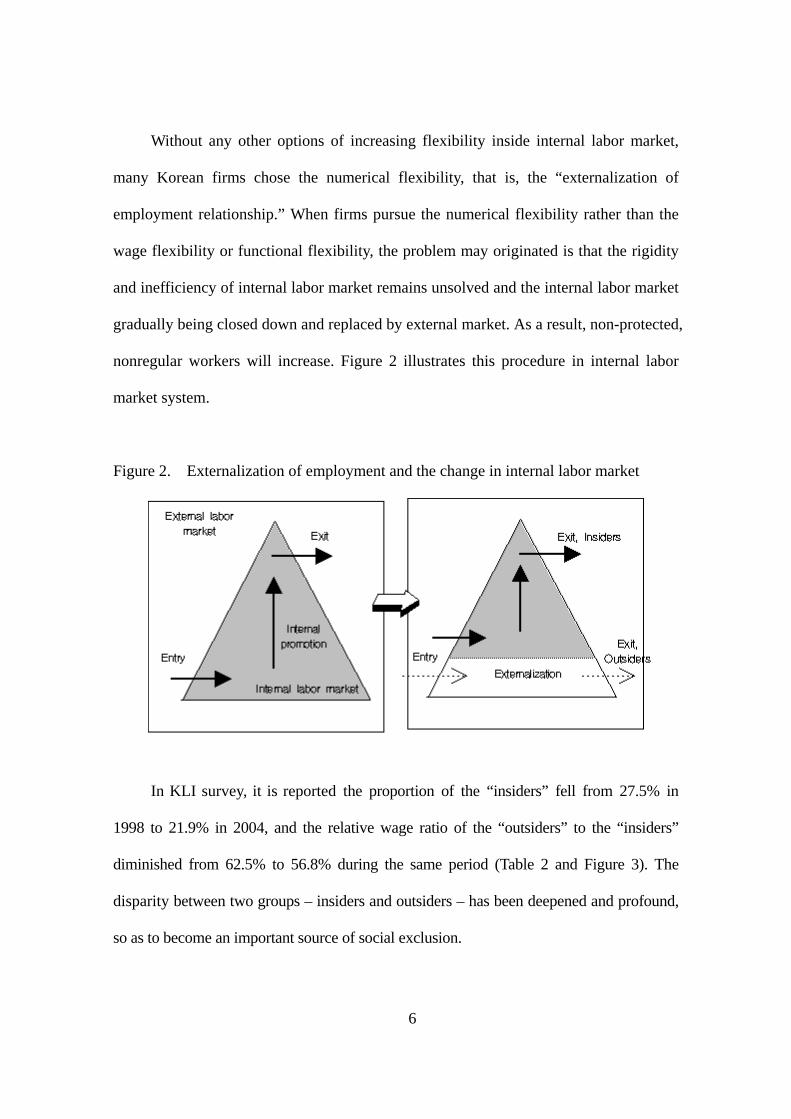
Without any other options of increasing flexibility inside internal labor market,
many Korean firms chose the numerical flexibility, that is, the “externalization of
employment relationship.” When firms pursue the numerical flexibility rather than the
wage flexibility or functional flexibility, the problem may originated is that the rigidity
and inefficiency of internal labor market remains unsolved and the internal labor market
gradually being closed down and replaced by external market. As a result, non-protected,
nonregular workers will increase. Figure 2 illustrates this procedure in internal labor
market system.
Figure 2. Externalization of employment and the change in internal labor market
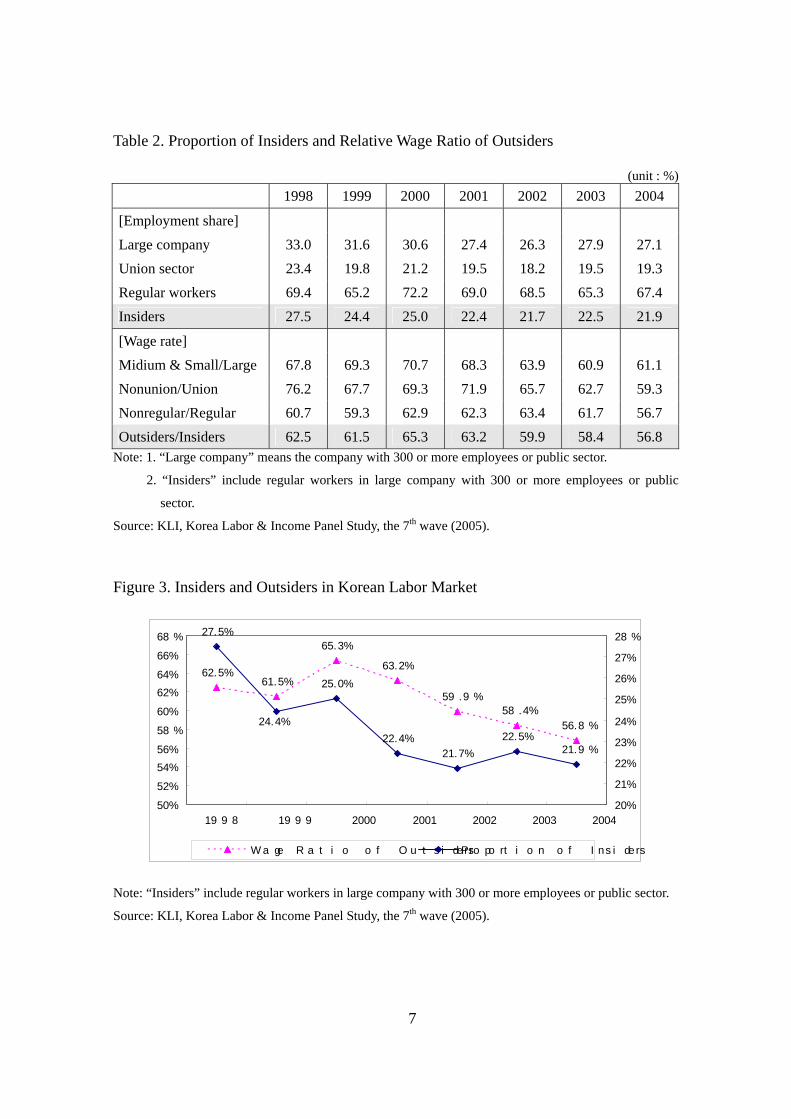
In KLI survey, it is reported the proportion of the “insiders” fell from 27.5% in
1998 to 21.9% in 2004, and the relative wage ratio of the “outsiders” to the “insiders”
diminished from 62.5% to 56.8% during the same period (Table 2 and Figure 3). The
disparity between two groups – insiders and outsiders – has been deepened and profound,
so as to become an important source of social exclusion.
7
Table 2. Proportion of Insiders and Relative Wage Ratio of Outsiders
(unit : %) 1998 1999 2000 2001 2002 2003 2004
[Employment share] Large company 33.0 31.6 30.6 27.4 26.3 27.9 27.1 Union sector 23.4 19.8 21.2 19.5 18.2 19.5 19.3 Regular workers 69.4 65.2 72.2 69.0 68.5 65.3 67.4 Insiders 27.5 24.4 25.0 22.4 21.7 22.5 21.9
[Wage rate] Midium & Small/Large 67.8 69.3 70.7 68.3 63.9 60.9 61.1 Nonunion/Union 76.2 67.7 69.3 71.9 65.7 62.7 59.3 Nonregular/Regular 60.7 59.3 62.9 62.3 63.4 61.7 56.7 Outsiders/Insiders 62.5 61.5 65.3 63.2 59.9 58.4 56.8
Note: 1. “Large company” means the company with 300 or more employees or public sector.
2. “Insiders” include regular workers in large company with 300 or more employees or public
sector.
Source: KLI, Korea Labor & Income Panel Study, the 7th wave (2005).
Figure 3. Insiders and Outsiders in Korean Labor Market
62.5%61.5%
65.3%
63.2%
59.9%
58.4%
56.8%
27.5%
25.0%
22.4%
21.7%
22.5%21.9%
24.4%
50%
52%
54%
56%
58%
60%
62%
64%
66%
68%
1998 1999 2000 2001 2002 2003 2004
20%
21%
22%
23%
24%
25%
26%
27%
28%
Wage Ratio of Outs iders Proportion of Ins iders
Note: “Insiders” include regular workers in large company with 300 or more employees or public sector.
Source: KLI, Korea Labor & Income Panel Study, the 7th wave (2005).
8
3. Comparison of Internal Labor Market in Korea and Japan
Internal labor market implies workers have careers inside organizations, which
departs from standard conceptions of competitive labor markets. In many cases, it may
show inconsistency with traditional economic theories of labor markets. From 1970s,
many economists beginning with Doeringer and Piore described these aspects of
internal labor markets (such as ports of entry and wages attached to jobs) that depart
from standard conceptions of competitive labor markets. More recently, personnel
economists headed by E. P Lazear have analyzed wage and promotion dynamics inside
firms and provided detailed empirical analyses of careers inside specific firms, which in
order to find the reasoning of internal labor market. Now internal labor markets are
considered as another factory that determines wage structure and skill development.
Japanese internal labor market is often portrayed as the typical corporate body of
long-term contract, firm-specific skills, and seniority wages. This section investigates
the aspects of internal labor market in Korea and compares with the case of Japan.
1) Long-term employment
Japan is well known as the country that highly developed internal labor market
system. Japanese internal labor market is often illustrated by long-term employment and
seniority rules in wage determination and promotions.
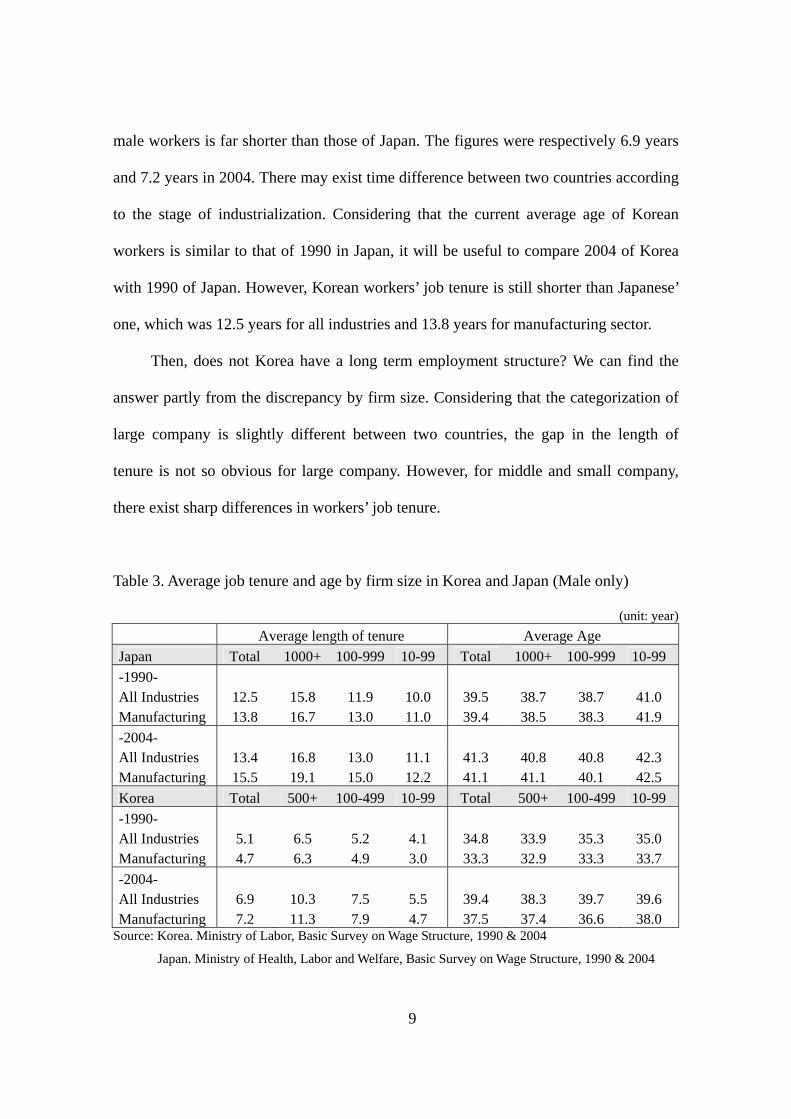
As of 2004, the average length of service of male workers in Japan is 13.4 years
for all industries and 15.5 years for manufacturing sector (Table 3). Although Korea is
also known to have similar institutions inside firms, the average length of service of
9
male workers is far shorter than those of Japan. The figures were respectively 6.9 years
and 7.2 years in 2004. There may exist time difference between two countries according
to the stage of industrialization. Considering that the current average age of Korean
workers is similar to that of 1990 in Japan, it will be useful to compare 2004 of Korea
with 1990 of Japan. However, Korean workers’ job tenure is still shorter than Japanese’
one, which was 12.5 years for all industries and 13.8 years for manufacturing sector.
Then, does not Korea have a long term employment structure? We can find the
answer partly from the discrepancy by firm size. Considering that the categorization of
large company is slightly different between two countries, the gap in the length of
tenure is not so obvious for large company. However, for middle and small company,
there exist sharp differences in workers’ job tenure.
Table 3. Average job tenure and age by firm size in Korea and Japan (Male only)
(unit: year) Average length of tenure Average Age Japan Total 1000+ 100-999 10-99 Total 1000+ 100-999 10-99 -1990- All Industries 12.5 15.8 11.9 10.0 39.5 38.7 38.7 41.0 Manufacturing 13.8 16.7 13.0 11.0 39.4 38.5 38.3 41.9 -2004- All Industries 13.4 16.8 13.0 11.1 41.3 40.8 40.8 42.3 Manufacturing 15.5 19.1 15.0 12.2 41.1 41.1 40.1 42.5 Korea Total 500+ 100-499 10-99 Total 500+ 100-499 10-99 -1990- All Industries 5.1 6.5 5.2 4.1 34.8 33.9 35.3 35.0 Manufacturing 4.7 6.3 4.9 3.0 33.3 32.9 33.3 33.7 -2004- All Industries 6.9 10.3 7.5 5.5 39.4 38.3 39.7 39.6 Manufacturing 7.2 11.3 7.9 4.7 37.5 37.4 36.6 38.0
Source: Korea. Ministry of Labor, Basic Survey on Wage Structure, 1990 & 2004
Japan. Ministry of Health, Labor and Welfare, Basic Survey on Wage Structure, 1990 & 2004
10
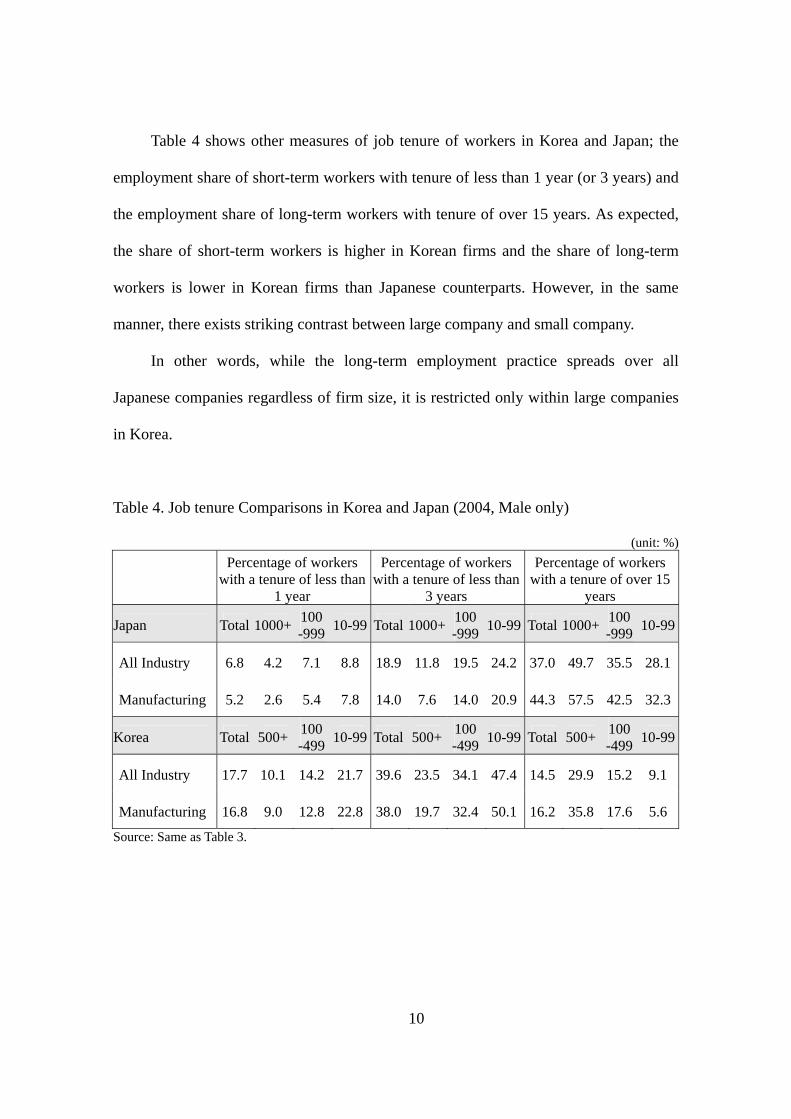
Table 4 shows other measures of job tenure of workers in Korea and Japan; the
employment share of short-term workers with tenure of less than 1 year (or 3 years) and
the employment share of long-term workers with tenure of over 15 years. As expected,
the share of short-term workers is higher in Korean firms and the share of long-term
workers is lower in Korean firms than Japanese counterparts. However, in the same
manner, there exists striking contrast between large company and small company.
In other words, while the long-term employment practice spreads over all
Japanese companies regardless of firm size, it is restricted only within large companies
in Korea.
Table 4. Job tenure Comparisons in Korea and Japan (2004, Male only)
(unit: %)
Percentage of workers
with a tenure of less than 1 year
Percentage of workers with a tenure of less than
3 years
Percentage of workers with a tenure of over 15
years
Japan Total 1000+ 100 -999 10-99 Total 1000+ 100
-999 10-99 Total 1000+ 100 -999 10-99
All Industry 6.8 4.2 7.1 8.8 18.9 11.8 19.5 24.2 37.0 49.7 35.5 28.1
Manufacturing 5.2 2.6 5.4 7.8 14.0 7.6 14.0 20.9 44.3 57.5 42.5 32.3
Korea Total 500+ 100 -499 10-99 Total 500+ 100
-499 10-99 Total 500+ 100 -499 10-99
All Industry 17.7 10.1 14.2 21.7 39.6 23.5 34.1 47.4 14.5 29.9 15.2 9.1
Manufacturing 16.8 9.0 12.8 22.8 38.0 19.7 32.4 50.1 16.2 35.8 17.6 5.6
Source: Same as Table 3.
11
2) Seniority wages
Most regular workers in Korea are paid according to a seniority–based wage
schedule like workers in Japan, which awards compensation according to their job
tenure not to their performance. In Korea, this seniority–based wage system is regarded
as the most important source that makes internal labor market more rigid. For instance,
most Korean firms have the wage table called as a “hobong” table, which fixes the base
wage of workers according to the rank given by one’s seniority. Therefore, it can be
virtually true that a major portion of compensation is settled down at the point of time
when workers entered the firm regardless of their current outcomes.
Now let us think about seniority wages in general. It is known as that wages
generally increase with seniority. This feature is observed not only in the countries with
seniority-based compensation system but also in the countries with job-based
compensation system. There are three approaches to explain the aspects of internal labor
market; those are job assignment, human-capital acquisition, and learning approach. Job
assignment approach assumes that jobs are ranked in terms of the importance of ability,
so it is efficient to assign higher-ability workers to higher levels of the job ladder (Rosen,
1982; Waldman, 1984). Human capital approach assumes that a worker’s productivity
rises during the worker’s career (Becker, 1962; Mincer, 1974). Learning approach
assumes that there is uncertainty about a worker’s ability at the beginning, but all firms
learn about the worker’s ability from output observations as the worker ages (Harris &
Holmstrom, 1982; Farber & Gibbons, 1996). These views give us insights in
understanding aspects of seniority wages from each different angle, respectively job,
worker, and employer.

12
If we want to focus on internal labor market, the most pervasive explanation is
that human capital accumulates as seniority increases and wages reflect rewards for
augmented human capital. The question at issue, however, is the structure and the slope
of wage profile over lifetime. It may correspond exactly to the extent of reflecting the
increase of productivity or may not.
One explanation for the discrepancy between wages and productivity on the spot
is that wages are deferred for incentive or long-term insurance contracts. The deferred
payment explanation is naturally accepted for the case of Japanese internal labor market
because workers’ wages in Japanese company increase gradually and steady during the
whole lifetime. That means the age-wage profile in cross sectional analysis takes the
upward sloping shape until age 50s. However, this explanation can be somehow
inadequate for the country in which long-term employment practice does not prevail or
the increase rate of wages overwhelms that of productivity from the beginning. The
former may reflect more competitive nature and the latter monopolistic rent-seeking.
Figure 4 and Figure 5 show the age-wage profiles in manufacturing sector in
Korea and Japan. We separates production workers and managerial and office workers.
As compared with Japan, several distinctions are observed in wage profiles in
Korea. First, the wage-profile of production workers differs from that of managerial and
office workers in Korea, contrary to Japan. The wage profile of Korean production
workers have an inverse U-shaped with peak at age 40s, while the wage profile of
Korean managerial/office workers increases monotonously over lifetime. In Japan, none
the less for different slopes and different peaks, both profiles are basically similar in
shape. It may be connected with career paths of them in both countries. This topic will
be dealt in the next section.

13
Figure 4. Changes in age-wage profile in Korean manufacturing sector (Male only)
A. Production worker
100
110
120
130
140
150
160
170
180
190
20-24 25-29 30-34 35-39 40-44 45-49 50-54 55-59 60-64
1990 1996 2004
20-24 25-29 30-34 35-39 40-44 45-49 50-54 55-59 60-64
1990 100 122 138 146 149 150 144 128 110
1996 100 124 144 154 158 154 146 132 117
2004 100 128 157 174 181 182 173 159 130
B. Managerial and office worker
100
120
140
160
180
200
220
240
260
280
300
20-24 25-29 30-34 35-39 40-44 45-49 50-54 55-59 60-64
1990 1996 2004
20-24 25-29 30-34 35-39 40-44 45-49 50-54 55-59 60-64
1990 100 127 159 195 219 226 214 181 150
1996 100 122 156 186 214 229 244 247 245
2004 100 135 173 214 241 257 282 293 279
14
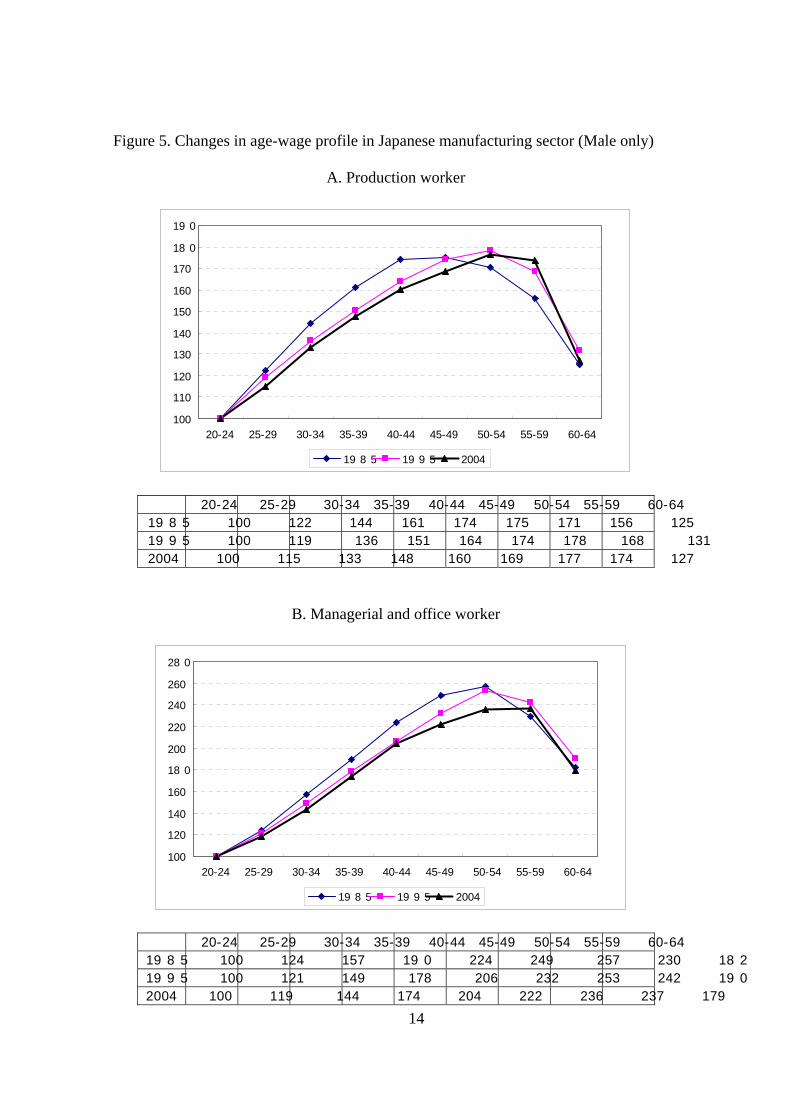
Figure 5. Changes in age-wage profile in Japanese manufacturing sector (Male only)
A. Production worker
100
110
120
130
140
150
160
170
180
190
20-24 25-29 30-34 35-39 40-44 45-49 50-54 55-59 60-64
1985 1995 2004
20-24 25-29 30-34 35-39 40-44 45-49 50-54 55-59 60-64
1985 100 122 144 161 174 175 171 156 125
1995 100 119 136 151 164 174 178 168 131
2004 100 115 133 148 160 169 177 174 127
B. Managerial and office worker
100
120
140
160
180
200
220
240
260
280
20-24 25-29 30-34 35-39 40-44 45-49 50-54 55-59 60-64
1985 1995 2004
20-24 25-29 30-34 35-39 40-44 45-49 50-54 55-59 60-64
1985 100 124 157 190 224 249 257 230 182
1995 100 121 149 178 206 232 253 242 190
2004 100 119 144 174 204 222 236 237 179
15
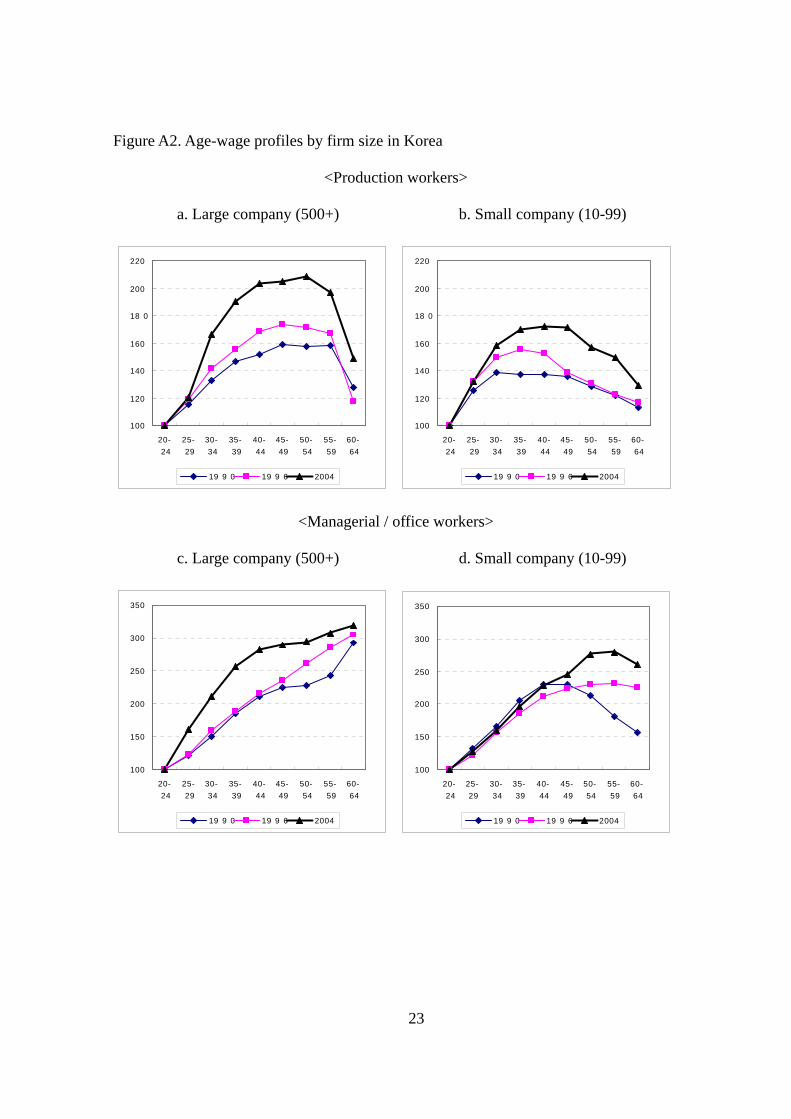
Second, the slopes of wage profiles in Korea are steeper than those in Japan all
through the period until they reach the peak. In particular, for Korean production
workers, wages in early stage increases very fast as age increases, and once it reaches a
certain level at age 40-44 it stays at that level during age 40s, and then it falls drastically
after age 50. In the case of Japan, wages of production workers increase until age 50s as
same as managerial/office workers. It is however noteworthy that wages of production
workers in large company in Korea stays at the highest level until age 50s, which is
similar to Japanese workers (See Appendix Figure A2).
Third, the slopes of wage profiles in Korea have been changed steeper overtime in
contrast to the case of Japan. What is more, its increase range became larger especially
after 1996. As workers’ expectation on lifetime employment has collapsed passing
through the economic crisis, workers showed a strong tendency to lean myopic interests
rather than long-run interests. Regardless of their intention, however, the consequences
ware that it makes the employment security of middle-aged workers worse due to high
labor costs of employing them. In order to alleviate labor costs, Firms commenced mass
layoff aiming at middle-and-old-aged workers. High-cost structure of employing
middle-and-old-aged workers is still a major hindrance in managing of workforce aging
in Korean society.
In Japan, on the contrary, it is found that the slope of profiles decreases and the
peak age moves out over time. These changes can be relevant to the effort to extend the
retirement age of workers under the framework of deferred payment (See Figure 6).
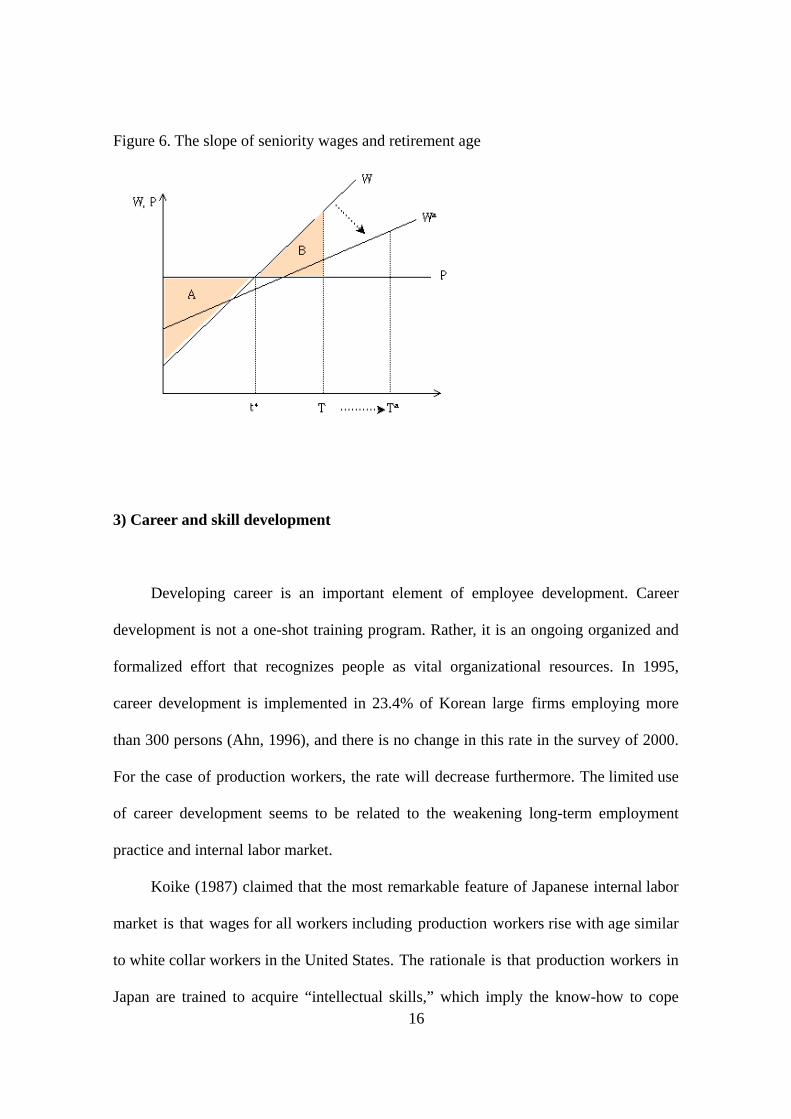
16
Figure 6. The slope of seniority wages and retirement age
3) Career and skill development
Developing career is an important element of employee development. Career
development is not a one-shot training program. Rather, it is an ongoing organized and
formalized effort that recognizes people as vital organizational resources. In 1995,
career development is implemented in 23.4% of Korean large firms employing more
than 300 persons (Ahn, 1996), and there is no change in this rate in the survey of 2000.
For the case of production workers, the rate will decrease furthermore. The limited use
of career development seems to be related to the weakening long-term employment
practice and internal labor market.
Koike (1987) claimed that the most remarkable feature of Japanese internal labor
market is that wages for all workers including production workers rise with age similar
to white collar workers in the United States. The rationale is that production workers in
Japan are trained to acquire “intellectual skills,” which imply the know-how to cope
17
with changes and to solve unusual problems, through work practices in the plant-level.
According to Koike’s argument, internal labor market in Japan can be said to succeed in
operating skill development system for production workers as well as providing them
seniority wages. This balance makes Japanese HRM practices to meet not only the
security criterion but also the productivity (or flexibility) criterion.
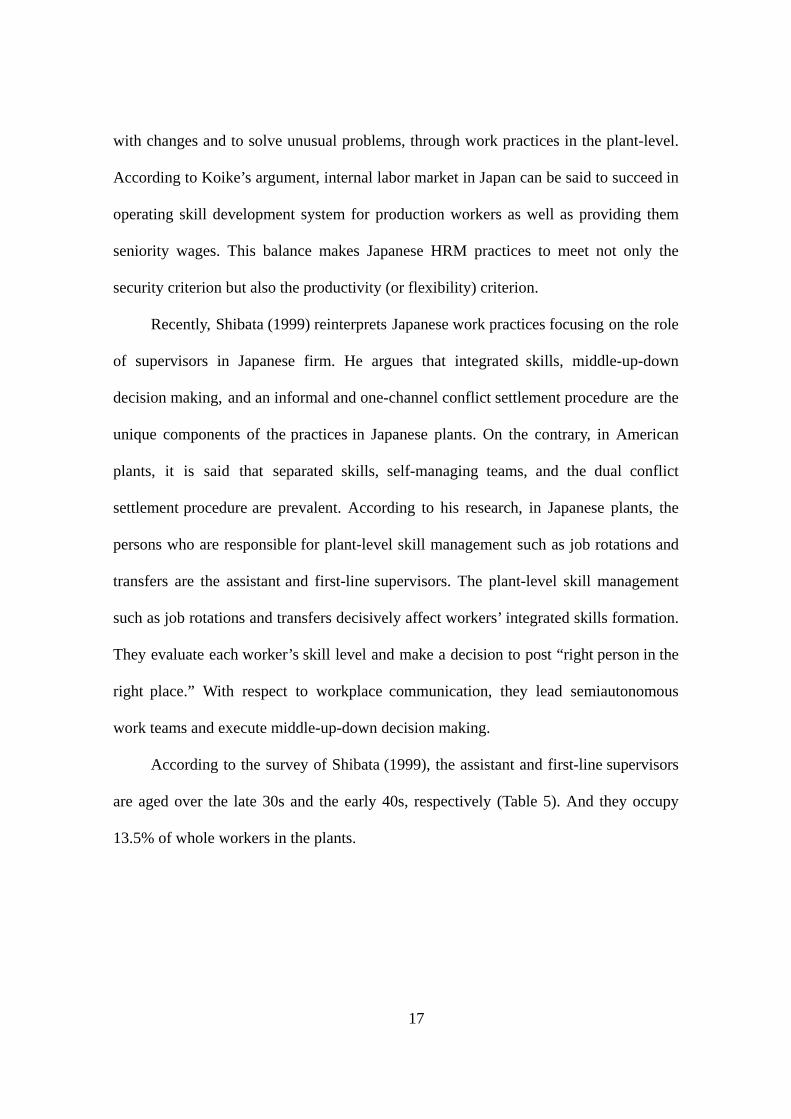
Recently, Shibata (1999) reinterprets Japanese work practices focusing on the role
of supervisors in Japanese firm. He argues that integrated skills, middle-up-down
decision making, and an informal and one-channel conflict settlement procedure are the
unique components of the practices in Japanese plants. On the contrary, in American
plants, it is said that separated skills, self-managing teams, and the dual conflict
settlement procedure are prevalent. According to his research, in Japanese plants, the
persons who are responsible for plant-level skill management such as job rotations and
transfers are the assistant and first-line supervisors. The plant-level skill management
such as job rotations and transfers decisively affect workers’ integrated skills formation.
They evaluate each worker’s skill level and make a decision to post “right person in the
right place.” With respect to workplace communication, they lead semiautonomous
work teams and execute middle-up-down decision making.
According to the survey of Shibata (1999), the assistant and first-line supervisors
are aged over the late 30s and the early 40s, respectively (Table 5). And they occupy
13.5% of whole workers in the plants.

18
Table 5. Numbers of Supervisors in 3 Japanese Plants, surveyed by Shibata (1999)
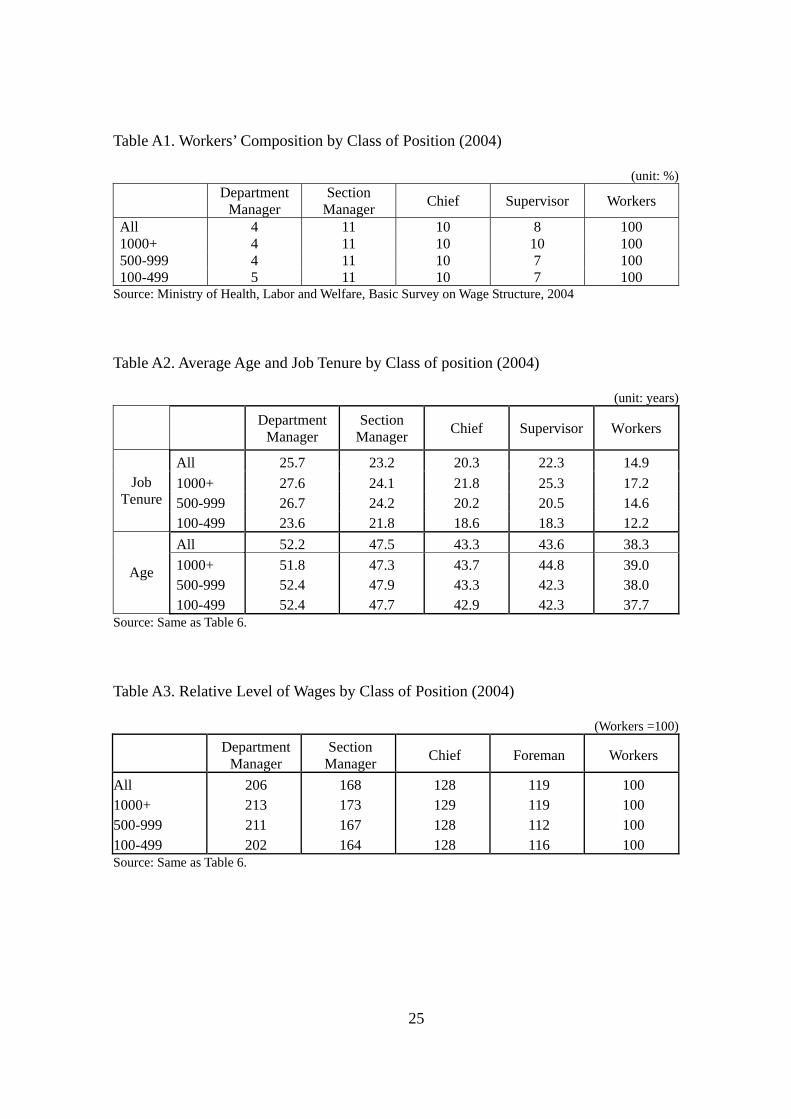
Using the ‘Basic Survey on Wage Structure’, we can get more general information
on characteristics of supervisors in Japanese company. According to the results, on
average, 7-10 supervisors per 100 workers are arranged in Japanese workplaces and the
ratio is higher in large company with 1000 or more employees (Appendix Table A1).
The supervisors consist of workers who have worked on average more than 20 years as
production workers, and their average age is 44. The status and the role of supervisors
may become a key factor to understand the conformity of long-term career development
and seniority wage system in the Japanese HRM practices.

19
4. Discussion
Skill development plays an important role in developing an individual’s career, in
enhancing corporate competitiveness, and in promoting economic development.
Developing the skill and competency of a worker not only contributes towards
employment security and higher income but also enables enterprises to secure and foster
human resources needed to maintain their competitive edge. Moreover, the effective
development, utilization, and allocation of human resources can catalyze economic
development beyond what is normally permitted by the limited amount of physical
resources.
Recently universal environmental pressure, especially globalization and
borderless market competition, led firms to change their HRM practices toward getting
more competitive advantage, which aims more flexibility in the workplace. Such
changes can be fundamental change or just extensions of the basic framework.
The traditional Korean HRM system has been defined as one that cultivates
long-term loyalty and organizational attachment from employees by providing job
security and various seniority-based HRM practices. It is clear that the universal
environmental pressure, traditional HRM practices and perspectives of Korean firms are
not very effective anymore. The new direction of HRM practices and perspectives is the
one that gives firms more flexibility of the workplace and the one that emphasizes more
performance from employees. Korea, however, does not seem successful in grafting the
flexibility into internal labor market, which results in the dual structure of Korean labor
market. The rigidity of internal labor market still remains as it was or even worse.
We have discussed the similarities and differences in wage structure and skill

20
development between Korea and Japan. It seems clear that Japanese firms are
successfully managed enough to meet security criterion and flexibility criterion than
Korean firms. However, the direct transformation of Japanese HRM practices will be
not easy and not desirable since each institution in different countries embodies each
country’s different cultural settings. The most important thing is to have new
perspective of HRM practices in Korea. And, it may be to make existing internal labor
market become healthy and well-functioning by means of functional flexibility and
wage flexibility.
References
Ahn, H. T. (1996), New Human Resource Practices in Korean Firms, Korea Employers
Federation. (in Korean)
Becker, G. (1962), Investment in Human Capital: A Theoretical Analysis, Journal of
Political Economy, 70, pp. 9-49.
Farber, H. and R. Gibbons (1996), Learning and Wage Dynamics, Quarterly Journal of
Economics, 111, pp. 1007-1047.
Harris, M. and B. Holmstrom (1982), A Theory of Wage Dynamics, Review of
Economic Studies, 49, pp. 315-333.
Koike, Kazuo (1987), Humen Resource Development and Labor-Management
Rrelations, Political Economy of Japan (ed. by Yamamura and Yasuba), v.1,
Stanford University Press
Lindbeck A.; D J. Snower (1986), Wage Setting, Unemployment, and Insider-Outsider
Relations (in Changes in Wage Norms), American Economic Review, Vol. 76,
No. 2, pp. 235-239.
Lindbeck A.; D J. Snower (1988), Cooperation, Harassment, and Involuntary
Unemployment: An Insider-Outsider Approach, American Economic Review, Vol.

21
78, No. 1. pp. 167-188.
Mincer, J. (1974), Schooling, Experience, and Earnings, NBER, New York.
Rosen, S. (1982), Authority, Control, and the Distribution of Earnings, Bell Journal of
Economics, 13, pp. 311-323.
Shibata, H. (1999), A Comparison of American and Japanese Work Practices: Skill
Formation, Communications, and Conflict Resolution, Industrial Relations, Vol.
38, No. 2, pp. 192-213.
Waldman, M. (1984a), Worker Allocation, Hierarchies, and the Wage Distribution,
Review of Economic Studies, 51, pp. 95-109.
22
Appendix
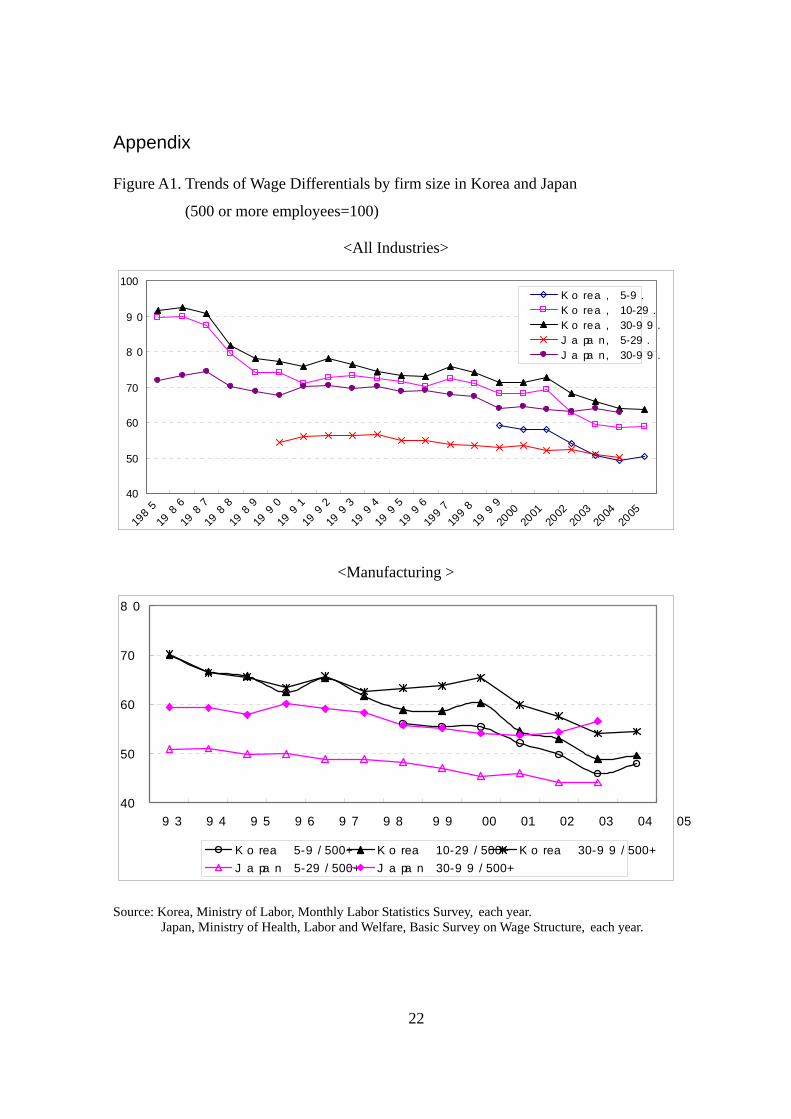
Figure A1. Trends of Wage Differentials by firm size in Korea and Japan
(500 or more employees=100)
<All Industries>
40
50
60
70
80
90
100
1985
1986
1987
1988
1989
1990
1991
1992
1993
1994
1995
1996
1997
1998
1999
2000
2001
2002
2003
2004
2005
Korea, 5-9.
Korea, 10-29.
Korea, 30-99.
Japan, 5-29.
Japan, 30-99.
<Manufacturing >
40
50
60
70
80
93 94 95 96 97 98 99 00 01 02 03 04 05
Korea 5-9/500+ Korea 10-29/500+ Korea 30-99/500+
Japan 5-29/500+ Japan 30-99/500+
Source: Korea, Ministry of Labor, Monthly Labor Statistics Survey, each year.
Japan, Ministry of Health, Labor and Welfare, Basic Survey on Wage Structure, each year.
23
Figure A2. Age-wage profiles by firm size in Korea
<Production workers>
a. Large company (500+) b. Small company (10-99)
100
120
140
160
180
200
220
20-
24
25-
29
30-
34
35-
39
40-
44
45-
49
50-
54
55-
59
60-
64
1990 1996 2004
100
120
140
160
180
200
220
20-
24
25-
29
30-
34
35-
39
40-
44
45-
49
50-
54
55-
59
60-
64
1990 1996 2004
<Managerial / office workers>
c. Large company (500+) d. Small company (10-99)
100
150
200
250
300
350
20-
24
25-
29
30-
34
35-
39
40-
44
45-
49
50-
54
55-
59
60-
64
1990 1996 2004
100
150
200
250
300
350
20-
24
25-
29
30-
34
35-
39
40-
44
45-
49
50-
54
55-
59
60-
64
1990 1996 2004
24
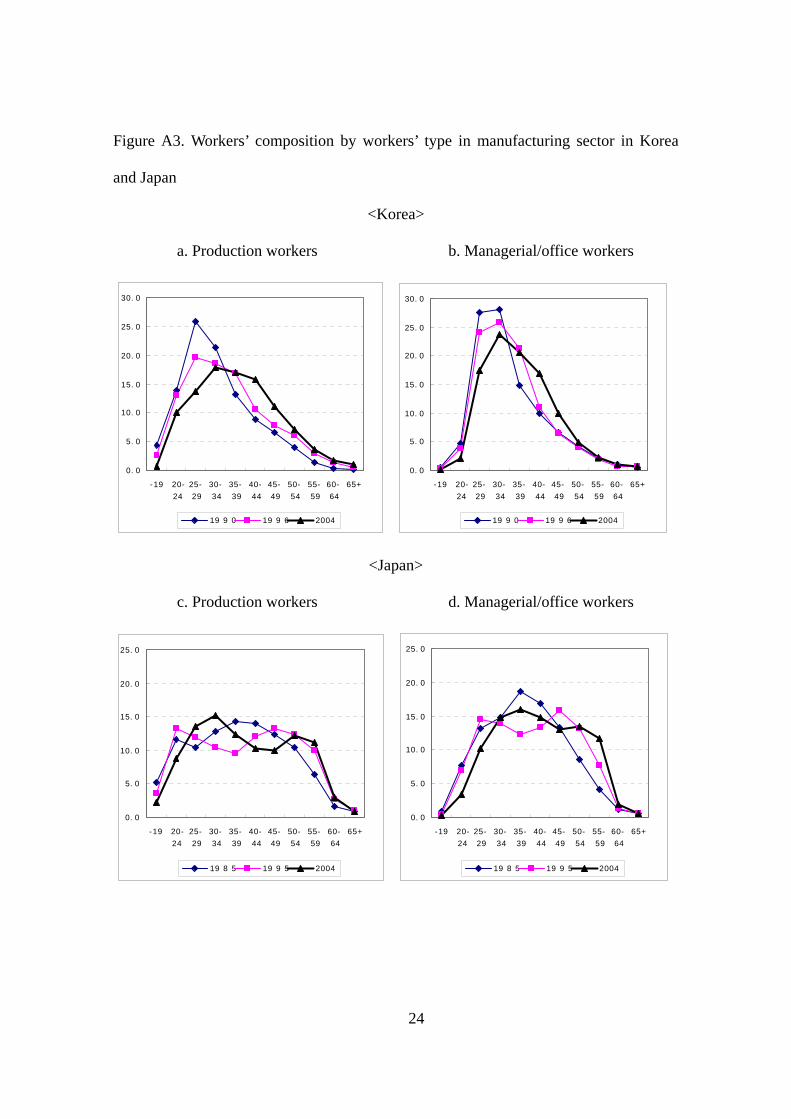
Figure A3. Workers’ composition by workers’ type in manufacturing sector in Korea
and Japan
<Korea>
a. Production workers b. Managerial/office workers
0.0
5.0
10.0
15.0
20.0
25.0
30.0
-19 20-
24
25-
29
30-
34
35-
39
40-
44
45-
49
50-
54
55-
59
60-
64
65+
1990 1996 2004
0.0
5.0
10.0
15.0
20.0
25.0
30.0
-19 20-
24
25-
29
30-
34
35-
39
40-
44
45-
49
50-
54
55-
59
60-
64
65+
1990 1996 2004
<Japan>
c. Production workers d. Managerial/office workers
0.0
5.0
10.0
15.0
20.0
25.0
-19 20-
24
25-
29
30-
34
35-
39
40-
44
45-
49
50-
54
55-
59
60-
64
65+
1985 1995 2004
0.0
5.0
10.0
15.0
20.0
25.0
-19 20-
24
25-
29
30-
34
35-
39
40-
44
45-
49
50-
54
55-
59
60-
64
65+
1985 1995 2004
25
Table A1. Workers’ Composition by Class of Position (2004)
(unit: %) Department
Manager Section
Manager Chief Supervisor Workers
All 4 11 10 8 100 1000+ 4 11 10 10 100 500-999 4 11 10 7 100 100-499 5 11 10 7 100
Source: Ministry of Health, Labor and Welfare, Basic Survey on Wage Structure, 2004
Table A2. Average Age and Job Tenure by Class of position (2004)
(unit: years)
Department Manager
Section Manager Chief Supervisor Workers
All 25.7 23.2 20.3 22.3 14.9 1000+ 27.6 24.1 21.8 25.3 17.2 500-999 26.7 24.2 20.2 20.5 14.6
Job Tenure
100-499 23.6 21.8 18.6 18.3 12.2 All 52.2 47.5 43.3 43.6 38.3 1000+ 51.8 47.3 43.7 44.8 39.0 500-999 52.4 47.9 43.3 42.3 38.0
Age
100-499 52.4 47.7 42.9 42.3 37.7 Source: Same as Table 6.
Table A3. Relative Level of Wages by Class of Position (2004)
(Workers =100) Department
Manager Section
Manager Chief Foreman Workers
All 206 168 128 119 100 1000+ 213 173 129 119 100 500-999 211 167 128 112 100 100-499 202 164 128 116 100 Source: Same as Table 6.


