
Water and Sanitation:Water and Sanitation:Water Services Water Services Development Plan Development Plan (WSDP) 2007/08 - (WSDP) 2007/08 - Executive SummaryExecutive Summary
Rev 1 Date: 16 March 2007
Presented by: J de Bruyn
Head: WSDP

CRITICAL CHALLENGESCRITICAL CHALLENGES
Eradicate sanitation services backlogKeep pace with basic services to cater for influxIntensify Water Demand Management strategyTreated effluent quality (not complying with DWAF standards) Greywater runoff (greywater management)Provide infrastructure for City development Maintain existing infrastructure Financial sustainability
High financial requirements Cost recovery and debt managementFair, cost-reflective tariffs that encourage water saving
Increase efficiencyInstitutional arrangements

To become a leader in the provision of equitable, sustainable, people-centred, affordable and credible water services to all
VISION OF WATER SERVICESVISION OF WATER SERVICES

EQUITABLE
To provide access to a basic water supply to all informal settlements by 2008 (Achieved in 2005/06)
To provide access to a basic sanitation service to at least 70% of all informal settlements by 2010
SUSTAINABLE
The availability and reliability of water resources is ensured at all times
The supply of safe drinking water that meets quality standards is ensured at all times
The protection of the environment is improved by ensuring that by 2010, 90% of treated effluent is in compliance with 1984 DWAF standards
STRATEGIC GOALSSTRATEGIC GOALS

PEOPLE-CENTRED To ensure that at least an 80% level of satisfaction of all customers with the provision of basic water services is reachedTo create an environment that develops and utilises the skills, competencies and innovation potential of all employees in order to meet the objectives of the organisationTo create an enabling environment that ensures development of meaningful relationships with all stakeholders
AFFORDABLETo establish fair tariff that ensures all residents have access to basic water and sanitation services, including indigent households.
CREDIBLE To ensure the implementation of international best management practices in the provision of water services.To become the preferred water services institution for all customers
STRATEGIC GOALSSTRATEGIC GOALS
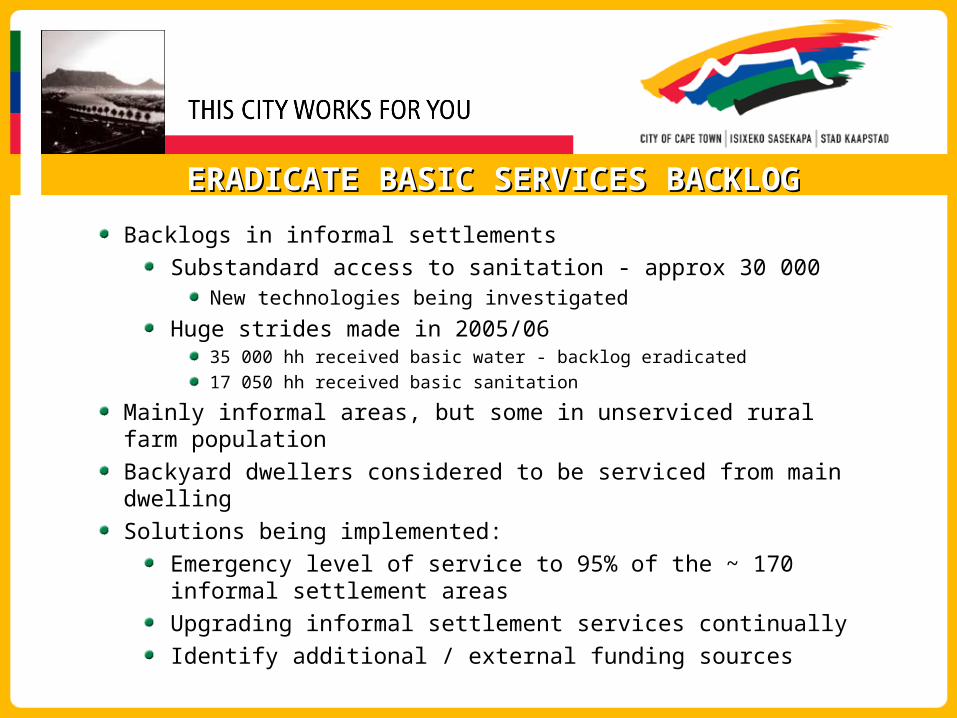
ERADICATE BASIC SERVICES BACKLOGERADICATE BASIC SERVICES BACKLOG
Backlogs in informal settlements
Substandard access to sanitation - approx 30 000 New technologies being investigated
Huge strides made in 2005/0635 000 hh received basic water - backlog eradicated
17 050 hh received basic sanitation
Mainly informal areas, but some in unserviced rural farm population
Backyard dwellers considered to be serviced from main dwelling
Solutions being implemented:
Emergency level of service to 95% of the ~ 170 informal settlement areas
Upgrading informal settlement services continually
Identify additional / external funding sources

ERADICATE BLACK BUCKETERADICATE BLACK BUCKET
Black buckets in formal areas
3 outstanding houses will be upgraded in 2007
Black buckets in informal areas
2 857 at 2 857 households
Will be eradicated over a 5-year programme
Related better technologies such as chemical toilets & Hundred-litre containers
7 462 chemical toilets in use, serving 37 300 households
1 049 Hundred litre containers in use, serving 5 200 households
Will continue to be used as emergency services

COSTING OF BASIC SERVICESCOSTING OF BASIC SERVICES
INFORMAL SETTLEMENT SANITATION BACKLOG
Informal households without basic sanitation 30 000Service Standard (hh/service) 5No. of new services needed 6 000Unit cost of provision R 6 000Total cost of service provision 36 000 000Years to provide 5Total annual cost of new service provision R 7 200 000
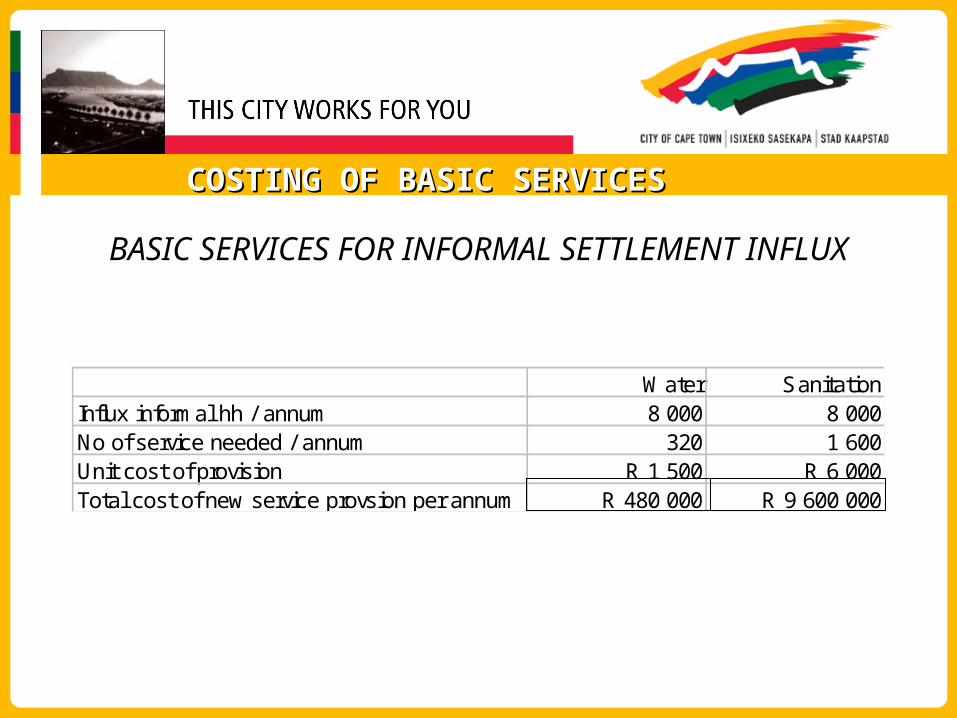
COSTING OF BASIC SERVICESCOSTING OF BASIC SERVICES
BASIC SERVICES FOR INFORMAL SETTLEMENT INFLUX
Water SanitationInflux informal hh / annum 8 000 8 000No of service needed / annum 320 1 600Unit cost of provision R 1 500 R 6 000Total cost of new service provsion per annum R 480 000 R 9 600 000

COSTING OF BASIC SERVICESCOSTING OF BASIC SERVICES
SERVICING HOUSING DEVELOPMENTS
BACKLOGInformal households 115 000Backyard dwellers, other 145 000Total Backlog 260 000unit Cost of service provision: water and sanitation R 10 000Total cost of service provision R 2 600 000 000Years to provide 20Total annual cost of service provision R 130 000 000
INFLUX
No of houses needed per annum 8 000Total annual cost of service provision R 80 000 000
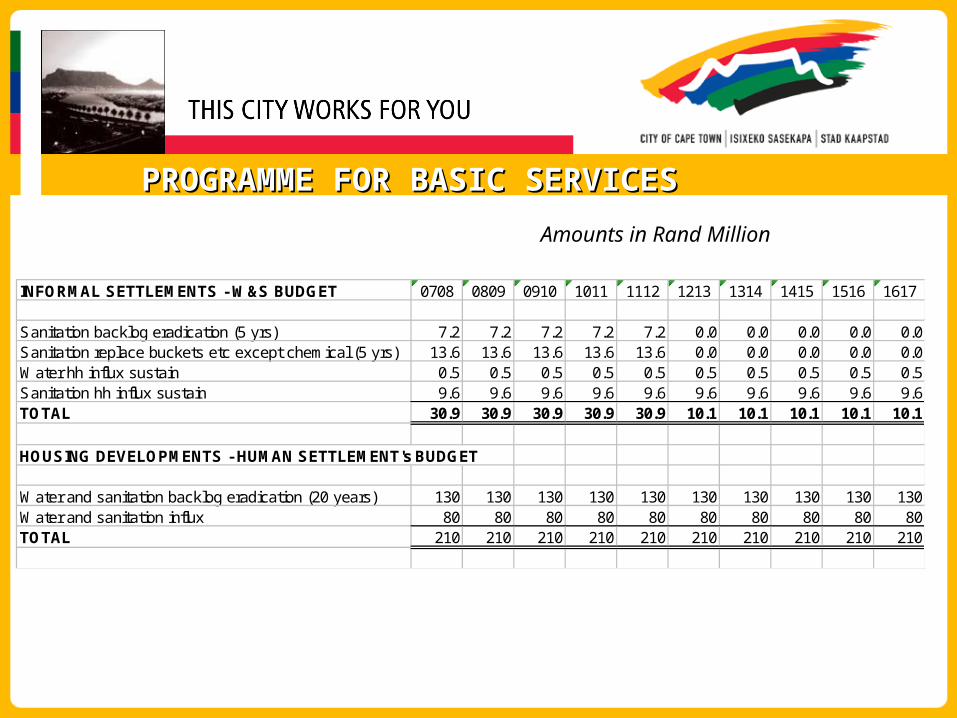
PROGRAMME FOR BASIC SERVICESPROGRAMME FOR BASIC SERVICES
INFORMAL SETTLEMENTS - W&S BUDGET 0708 0809 0910 1011 1112 1213 1314 1415 1516 1617
Sanitation backlog eradication (5 yrs) 7.2 7.2 7.2 7.2 7.2 0.0 0.0 0.0 0.0 0.0Sanitation replace buckets etc except chemical (5 yrs) 13.6 13.6 13.6 13.6 13.6 0.0 0.0 0.0 0.0 0.0Water hh influx sustain 0.5 0.5 0.5 0.5 0.5 0.5 0.5 0.5 0.5 0.5Sanitation hh influx sustain 9.6 9.6 9.6 9.6 9.6 9.6 9.6 9.6 9.6 9.6TOTAL 30.9 30.9 30.9 30.9 30.9 10.1 10.1 10.1 10.1 10.1
HOUSING DEVELOPMENTS - HUMAN SETTLEMENT's BUDGET
Water and sanitation backlog eradication (20 years) 130 130 130 130 130 130 130 130 130 130Water and sanitation influx 80 80 80 80 80 80 80 80 80 80TOTAL 210 210 210 210 210 210 210 210 210 210
Amounts in Rand Million

WATER DEMAND MANAGEMENTWATER DEMAND MANAGEMENTPrinciples:
Water is a strategic, scarce resource that cannot be wasted
Measure and account for all usage (UAW currently approx. 19%)
Reduce unconstrained water demand by 20% by 2010 or better20% reduction = 2% pa growth = Low water demand curve
future infrastructure planning based on this goal
attempt to better this and achieve 1% pa growth - will postpone costly infrastructure
as at 30 June 200628% below unconstrained demand curve
13% below low water demand curve!

Intensify implementation:Implement ALL WDM strategies in parallel with water resource strategies
Re-use treated effluent as an additional resource - generate further income
Reduce losses especially non-revenue demand
Water leaks projects
Pressure Reduction projects
Flow limiters to defaulters
High Benefit/Cost ratio (R750 each)
Can make major impact on Debt growth, Payment ratio
WATER DEMAND MANAGEMENTWATER DEMAND MANAGEMENT

11 YEARS OF DAM LEVELS % OF STORAGE CAPACITY11 YEARS OF DAM LEVELS % OF STORAGE CAPACITYCITY OF CAPE TOWN DAMS: 12 YEAR GRAPH INDICATING % OF TOTAL STORAGE CAPACITY
0
20
40
60
80
100
120
19
-Ja
n
02
-Fe
b
16
-Fe
b
01
-Ma
r
15
-Ma
r
29
-Ma
r
12
-Ap
r
26
-Ap
r
10
-Ma
y
24
-Ma
y
07
-Ju
n
21
-Ju
n
05
-Ju
l
18
-Ju
l
02
-Au
g
16
-Au
g
30
-Au
g
13
-Se
p
27
-Se
p
11
-Oct
25
-Oct
08
-No
v
22
-No
v
06
-De
c
20
-De
c
DATE
% F
UL
L
1996 1997 1998 1999 2000 2001 2002 2003 2004 2005 2006 2007

BULK WATER DEMAND CURVESBULK WATER DEMAND CURVES
CCT Demand Projections
0
100
200
300
400
500
600
700
19
91
19
93
19
95
19
97
19
99
20
01
20
03
20
05
20
07
20
09
20
11
20
13
20
15
20
17
20
19
Year
Bu
lk S
up
plie
d (
mill
ion
cu
bic
me
tre
s)
Existing Supply
Supply incl. BWP
Unconstrained
Low Water Demand
Actual

WATER RESOURCESWATER RESOURCES
DWAF “Reconciliation” Strategy for Western Cape
Draft far advanced
Water resources sufficient to 2013 (with Berg River Scheme)
Sources of Raw water: 70 - 75% from DWAF (Western-Cape Water System)
30 - 25% from own sources
Groundwater resources currently only 1% of total yield
Under investigationTable Mountain Group Aquifer Option (groundwater) - exploratory drilling phase to be complete by 30 June 2008
Desalination Option (seawater) - negotiations with V&A Waterfront progressing slowly

EXTENT OF TMG AQUIFEREXTENT OF TMG AQUIFER
Study area
Study area

BULK WATER INFRASTRUCTUREBULK WATER INFRASTRUCTURE
Northern areas under stress during peak demand
Northern area bulk infrastructure augmentation scheme
Reservoir and WTP originally planned to start early in 2007/0
Capital requirement 2007/08 to 2009/10:
R40M R350M R500M
Delay in EIA process by 6 month
Delays increase the probability of water restrictions in the northern area
Critical to secure funding immediately
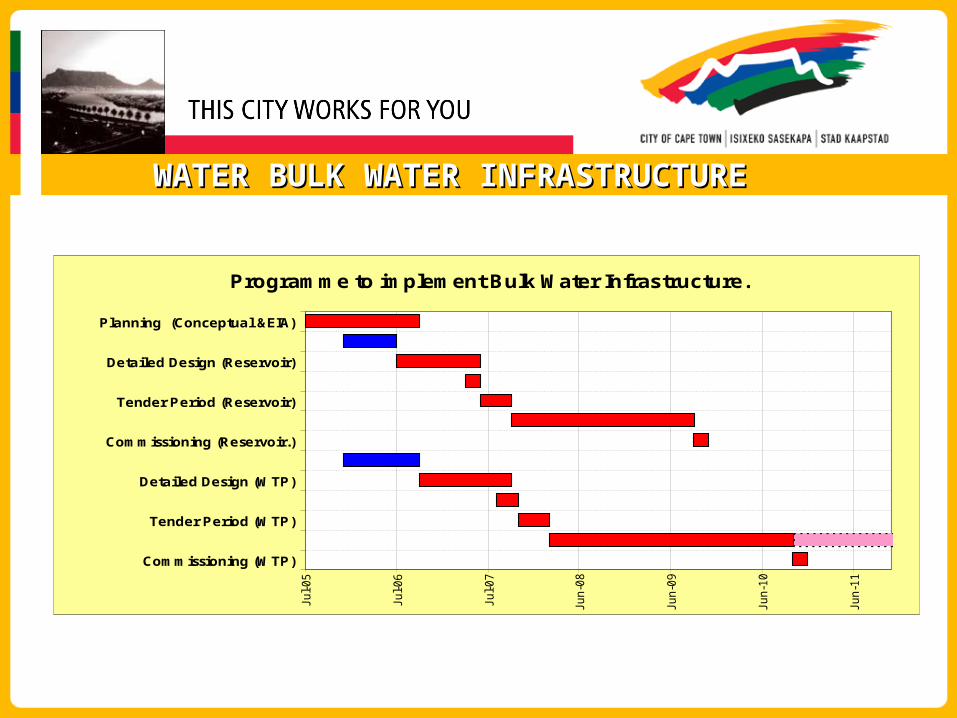
WATER BULK WATER INFRASTRUCTUREWATER BULK WATER INFRASTRUCTURE
Programme to implement Bulk Water Infrastructure.Jul-05
Jul-06
Jul-07
Jun-0
8
Jun-0
9
Jun-1
0
Jun-1
1
Planning (Conceptual &EIA)
Detailed Design (Reservoir)
Tender Period (Reservoir)
Commissioning (Reservoir.)
Detailed Design (WTP)
Tender Period (WTP)
Commissioning (WTP)

SUSTAINABLE ENVIRONMENT (WATER BODIES)SUSTAINABLE ENVIRONMENT (WATER BODIES)
Aim to achieve 1984 standard for Treated Wastewater Discharge
Need extensive upgrading of various WorksReceiving water quality
rivers and water bodies need to be protectedIn our favour:
limited use made of water from rivers around Cityshort run-off distances to the ocean
Health must not be compromised Solutions being implemented:
Develop strategy for complianceImproved operationsDevelop system for grey water runoff from standpipes

FINAL EFFLUENT QUALITY - % COMPLIANCEFINAL EFFLUENT QUALITY - % COMPLIANCEWORKS Susp Solids Chem Ox
DemandAmmonia E Coli
Athlone 98 98 98 0Bellville 78 82 62 2Borcherds Quarry 100 98 86 65Cape Flats 49 47 49 83Gordons Bay 100 98 96 93Klipheuwel 96 60 38 89Kraaifontein 98 92 76 89Llandudno 96 98 96 42Macassar 100 90 72 80Melkbosstrand 100 100 100 94Millers Point 69 29 76 95Mitchells Plain 98 96 92 48Oudekraal 79 67 85 81Parow 86 72 88 66Potsdam 86 26 20 26Scottsdene 96 89 96 91Simons Town 76 4 37 62Wesfleur – Domestic 100 98 100 100Wesfleur - Industrial 88 45 88 60Wildevoelvlei 94 94 100 96Zandvliet 98 100 92 98
MORE THAN 90% COMPLIANCE75% - 90% COMPLIANCELESS THAN 75% COMPLIANCE

PROVIDE INFRASTRUCTURE FOR CITY DEVELOPMENTPROVIDE INFRASTRUCTURE FOR CITY DEVELOPMENT
High demand for new housing and commerce
needs infrastructure as an enabler
Limited finances
Solutions being implemented:
Partnership approach with developers
Development contributions agreement for each area
Identify external funding sources (MIG etc)
Integrated planning to be improved

MAINTAIN EXISTING INFRASTRUCTUREMAINTAIN EXISTING INFRASTRUCTURE
Too little maintenanceDeteriorating infrastructure
Major pipe collapses, mainly sewersInfrastructure efficiency compromisedService interruptions
More expensive to replace ultimately
Solutions:Provide sufficient operational budget Address critical staff shortages at operational levelAlternative service delivery options

HIGH CAPITAL REQUIREMENTHIGH CAPITAL REQUIREMENT
5 YEAR CAPITAL BUDGET (FUTURE RAND VALUES)
-
200,000,000
400,000,000
600,000,000
800,000,000
1,000,000,000
1,200,000,000
1,400,000,000
2007/08 2008/09 2009/10 2010/2011 2011/2012
R
Informal settlements
Water Meter repl
Support Services
WDM
Bulk Water
Wastewater
Water Retic
Sewer Retic

OPERATING BUDGET REQUIREMENTOPERATING BUDGET REQUIREMENT
Year Budget (R Billion)
2007/08 2,953
2008/09 3,214
2009/10 3,540
2010/11 3,866
2011/12 4,167
This is based on the following assumptions: City growth: 1.50%
Inflation: 5.00%
Demand growth: 2.00%

HIGH FINANCIAL REQUIREMENTHIGH FINANCIAL REQUIREMENT
Under IDP Strategic Focus Area : Sustainable Infrastructure
Objective 3.1
“improved leveraging of the available funds without compromising the Council’s ability to
sustain service delivery”

COST RECOVERY, DEBT MGT & TARIFFSCOST RECOVERY, DEBT MGT & TARIFFS
City’s Credit control policy will be updated for 2007/08. Continue to:
Manage debt
Maximise income
Write off debt that has resulted from previous water leaks in low income and indigent areas
Ensure majority private dwellings in low income and indigent areas have minimal leaks and use only free portion - minimise future debt and need for credit control action
Cape Town tariffs low in comparison to other cities
Tariffs need to increase, but remain fair to different user categories

INCREASE EFFICIENCYINCREASE EFFICIENCY
New organisational structureReduce duplication and fragmentationOptimise for service delivery
Staff trainingImproved coordination and integrationImproved financial management - additional specialised staff requirement approvedOptimise systems and processesMeasurement, Balanced Scorecard, SDBIP, Performance indicatorsBenchmarking against peers : SALGA, CWMF and SAAWU

ESTABLISH NEW INSTITUTIONAL ARRANGEMENTESTABLISH NEW INSTITUTIONAL ARRANGEMENT
National Restructuring of the Water Services IndustryLegal requirement and Council resolution dated June 2004 Aim to improve operational & financial management and attract capitalMunicipal Systems Act, Section 78(1) requires choosing model:
internal ring-fenced business unit, orMunicipal Entity, orRegional Municipal UtilityIs this all – Wouter Loots mentioned 6 options???
IDP Objective 3.2 under Strategic Focus Area Sustainable Urban Infrastructure - develop alternative service delivery (ASD) and infrastructure funding or investment mechanisms. ASD mechanisms include:
PartnershipsConcessions (BOTT)Equity investments
Realistic tariffs and levies
Thank you
Let us work togetherfor a better city


