Water Framework Directive (WFD) River Basin District Management Systems
METHODOLOGY FOR RISK CHARACTERISATION OF IRELAND’S GROUNDWATER
Paper by the Working Group on Groundwater
Guidance document no. GW8 This is a guidance paper on the application of a Risk Characterisation Methodology. It documents the principles to be adopted by River Basin Districts and authorities responsible for implementing the Water Framework Directive in Ireland.
REVISION CONTROL TABLE Status Approved by National Technical
Co-ordination Group WFD
Requirement Relevant EU Reporting Sheets Date
Final March 2005 Characterisation GWPI 1, 2, 3, 4, 5, 6, 7 & 8 December 2004

Contents
1. PURPOSE OF THIS PAPER....................................................................................................... 1 2. ENVIRONMENTAL CHARACTERISATION AND RISK CHARACTERISATION ......... 1
2.1 ROLE OF THE RISK CONCEPT................................................................................................... 1 2.2 PHYSICAL CHARACTERISATION .............................................................................................. 3 2.3 RISK CHARACTERISATION....................................................................................................... 3
3. RISK ASSESSMENT.................................................................................................................... 7 3.1 RISK CATEGORIES ................................................................................................................... 7 3.2 RISK ASSESSMENT SHEETS...................................................................................................... 8
4. GROUNDWATER RISK ASSESSMENT GWRA1 .................................................................. 9 5. GROUND WATER RISK ASSESSMENT GWRA2 ............................................................... 11 6. GROUNDWATER RISK ASSESSMENT GWRA3 ................................................................ 13 7. GROUNDWATER RISK ASSESSMENT GWRA4 ................................................................ 15 8. GROUNDWATER RISK ASSESSMENT GWRA5 ................................................................ 17 9. GROUNDWATER RISK ASSESSMENT GWRA6 ................................................................ 19 10. GROUNDWATER RISK ASSESSMENT GWRA7 ............................................................ 21 11. GROUNDWATER RISK ASSESSMENT GWRA8 ............................................................ 23 12. GROUNDWATER RISK ASSESSMENT GWRA9 ............................................................ 25 13. GROUNDWATER RISK ASSESSMENT GWRA10 .......................................................... 27 14. GROUNDWATER RISK ASSESSMENT GWRA11 .......................................................... 29 15. GROUNDWATER RISK ASSESSMENT GWRA12 .......................................................... 30 16. GROUNDWATER RISK ASSESSMENT SWRA1 ............................................................. 31 17. GROUNDWATER RISK ASSESSMENT SWRA2 ............................................................. 33 18. GROUNDWATER RISK ASSESSMENT SWRA3 ............................................................. 35 19. GROUNDWATER RISK ASSESSMENT SWRA4 ............................................................. 37 20. GROUNDWATER RISK ASSESSMENT SWRA5 ............................................................. 39 21. GROUNDWATER RISK ASSESSMENT SWRA6 ............................................................. 41 22. GROUNDWATER RISK ASSESSMENT GWDTERA1.................................................... 42 23. GROUNDWATER RISK ASSESSMENT GWDTERA2A ................................................. 45 24. GROUNDWATER RISK ASSESSMENT GWDTERA2B ................................................. 48 25. GROUNDWATER RISK ASSESSMENT GWDTERA3.................................................... 50 26. GROUND WATER RISK ASSESSMENT GWDTERA4................................................... 52 27. GROUND WATER RISK ASSESSMENT GWDTERA5................................................... 54 28. GROUND WATER RISK ASSESSMENT GWDTERA6................................................... 56 29. GROUND WATER RISK ASSESSMENT GWDTERA7................................................... 58 30. GROUND WATER RISK ASSESSMENT GWDTERA8................................................... 60 31. GROUND WATER RISK ASSESSMENT GWDTERA9................................................... 62 32. GROUNDWATER RISK ASSESSMENT DWPARA1 ....................................................... 64 33. GROUNDWATER RISK ASSESSMENT DWPARA2 ....................................................... 66 34. MEMBERSHIP OF GROUNDWATER WORKING GROUP.......................................... 68 35. REFERENCES ........................................................................................................................ 68
i

Tables
TABLE 1 LAYERS OF GEOSCIENTIFIC INFORMATION USED IN IMPLEMENTING THE WFD ................. 5 TABLE 2 EXAMPLES OF RELEVANT CHARACTERISTICS OF THE PATHWAY AND THEIR IMPLICATION 6 TABLE 3 IRISH RISK ASSESSMENT REPORTING CATEGORIES ........................................................... 7 TABLE 4 WFD GROUNDWATER RISK ASSESSMENT SHEETS FOR RELEVANT RECEPTORS AND
PRESSURES ...................................................................................................................................... 8
Figures
FIGURE 1: SUMMARY OF WFD RISK ASSESSMENT APPROACH (ADAPTED FROM WFD GUIDANCE DOCUMENT GW4, GWWG, 2004.)................................................................................................. 1
FIGURE 2: DIAGRAMMATIC ILLUSTRATION OF A GROUNDWATER BODY SHOWING THE RANGE OF RECEPTORS THAT MUST BE CONSIDERED (ADAPTED FROM NERC, 1998) ...................................... 2
FIGURE 3: PRESSURE – PATHWAY-RECEPTOR MODEL FOR IMPLEMENTATION OF THE WFD.................. 2
ii

Methodology for Risk Characterisation of Ireland’s Groundwater
1. Purpose of this paper The paper sets out the detailed methodology and criteria for undertaking the risk characterisation of groundwater in Ireland. The principles on which the methodology is based are given in Guidance Document GW4 ‘Pressures and Impacts Assessment Methodology’ (GW WG, 2003). The approach used in undertaking the risk assessment is heavily influenced by the SEPA methodology (SEPA Groundwater Task Group, 2004).
2. Environmental Characterisation and Risk Characterisation
2.1 Role of the Risk Concept Risk assessment is at the heart of effective river basin planning (SEPA, 2002) and therefore of the WFD. In implementing the WFD, risk assessment allows environmental problems to be identified, monitoring programmes to be designed, and appropriate, cost effective protection and improvement measures to be formulated and implemented. The basic unit of risk assessment is the ‘groundwater body’, which is defined in the Directive as ‘a distinct volume of groundwater within an aquifer or aquifers’. The output of the risk assessment is a list of water bodies, including groundwater bodies, considered to be ‘at risk’ of failing to meet the environmental objectives of the Directive. The risk assessment approach is summarised in Figure 1.
Figure 1: Summary of WFD risk assessment approach (adapted from WFD Guidance Document GW4, GWWG, 2004.)
page 1 of 68

The risk assessment approach is broad, in that:
the receptors that must be considered are not just groundwater and drinking water abstraction points, but also groundwater dependent river and lakes and groundwater dependent terrestrial ecosystems (see Figure 2);
the geological pathway includes, potentially, both vertical and horizontal components to the receptors (see Figure 3).
Figure 2: Diagrammatic illustration of a groundwater body showing the range of receptors that must be considered (adapted from NERC, 1998)
Figure 3: Pressure – pathway-receptor model for implementation of the WFD
The groundwater characterisation process for each RBD involves two elements (SEPA, 2004):
1. Physical characterisation. 2. Risk characterisation.
page 2 of 68
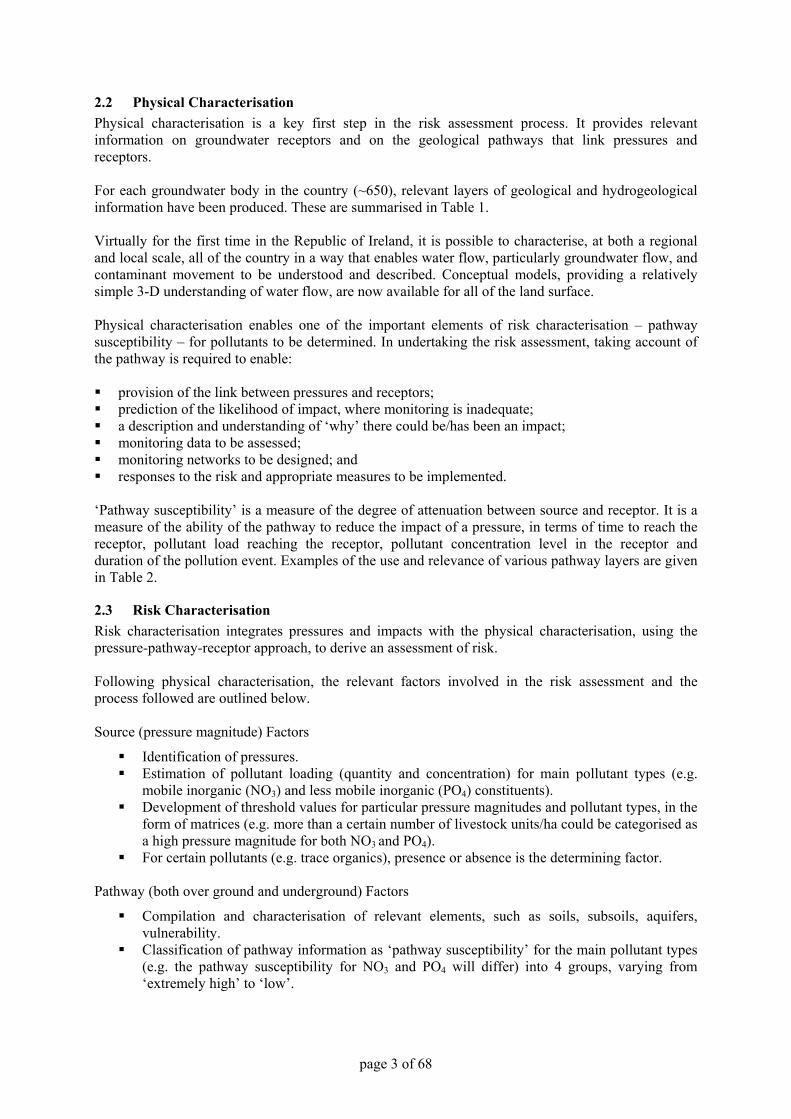
2.2 Physical Characterisation Physical characterisation is a key first step in the risk assessment process. It provides relevant information on groundwater receptors and on the geological pathways that link pressures and receptors. For each groundwater body in the country (~650), relevant layers of geological and hydrogeological information have been produced. These are summarised in Table 1. Virtually for the first time in the Republic of Ireland, it is possible to characterise, at both a regional and local scale, all of the country in a way that enables water flow, particularly groundwater flow, and contaminant movement to be understood and described. Conceptual models, providing a relatively simple 3-D understanding of water flow, are now available for all of the land surface. Physical characterisation enables one of the important elements of risk characterisation – pathway susceptibility – for pollutants to be determined. In undertaking the risk assessment, taking account of the pathway is required to enable: provision of the link between pressures and receptors; prediction of the likelihood of impact, where monitoring is inadequate; a description and understanding of ‘why’ there could be/has been an impact; monitoring data to be assessed; monitoring networks to be designed; and responses to the risk and appropriate measures to be implemented.
‘Pathway susceptibility’ is a measure of the degree of attenuation between source and receptor. It is a measure of the ability of the pathway to reduce the impact of a pressure, in terms of time to reach the receptor, pollutant load reaching the receptor, pollutant concentration level in the receptor and duration of the pollution event. Examples of the use and relevance of various pathway layers are given in Table 2.
2.3 Risk Characterisation Risk characterisation integrates pressures and impacts with the physical characterisation, using the pressure-pathway-receptor approach, to derive an assessment of risk. Following physical characterisation, the relevant factors involved in the risk assessment and the process followed are outlined below. Source (pressure magnitude) Factors
Identification of pressures. Estimation of pollutant loading (quantity and concentration) for main pollutant types (e.g.
mobile inorganic (NO3) and less mobile inorganic (PO4) constituents). Development of threshold values for particular pressure magnitudes and pollutant types, in the
form of matrices (e.g. more than a certain number of livestock units/ha could be categorised as a high pressure magnitude for both NO3 and PO4).
For certain pollutants (e.g. trace organics), presence or absence is the determining factor. Pathway (both over ground and underground) Factors
Compilation and characterisation of relevant elements, such as soils, subsoils, aquifers, vulnerability.
Classification of pathway information as ‘pathway susceptibility’ for the main pollutant types (e.g. the pathway susceptibility for NO3 and PO4 will differ) into 4 groups, varying from ‘extremely high’ to ‘low’.
page 3 of 68
Receptor Factors
Evaluation of the sensitivity of different receptors to pressures (pollutants and/or abstraction) and categorisation into high and moderate sensitivity, e.g. fens are more sensitive than raised bogs to groundwater abstraction but are less sensitive to nutrients.
Integrating Source, Pathway and Receptor Factors
This integration enables the predicted Risk Assessment category to be determined. Impact Data
Where adequate representative impact data are available, the predicted risk category can be adjusted. However, data cannot be used to adjust the category downwards (i.e. to a lower risk category).
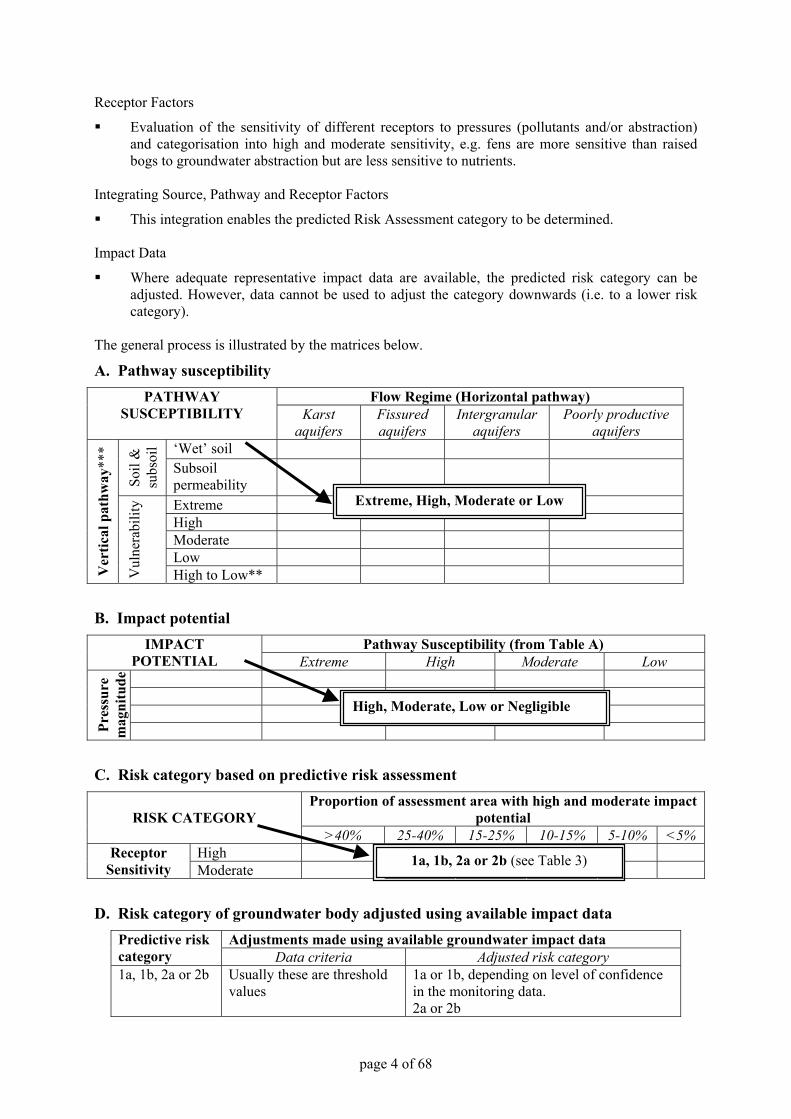
The general process is illustrated by the matrices below.
A. Pathway susceptibility Flow Regime (Horizontal pathway) PATHWAY
SUSCEPTIBILITY Karst aquifers
Fissured aquifers
Intergranular aquifers
Poorly productive aquifers
‘Wet’ soil
Soil
&
subs
oil
Subsoil permeability
Extreme High Moderate Low
Ver
tical
pat
hway
***
Vul
nera
bilit
y
High to Low**
B. Impact potential Pathway Susceptibility (from Table A) IMPACT
POTENTIAL Extreme High Moderate Low
Pres
sure
m
agni
tude
C. Risk category based on predictive risk assessment Proportion of assessment area with high and moderate impact
potential
RISK CATEGORY >40% 25-40% 15-25% 10-15% 5-10% <5%
High Receptor Sensitivity Moderate
D. Risk category of groundwater body adjusted using available impact data Adjustments made using available groundwater impact data Predictive risk
category Data criteria Adjusted risk category 1a, 1b, 2a or 2b Usually these are threshold
values 1a or 1b, depending on level of confidence in the monitoring data. 2a or 2b
Extreme, High, Moderate or Low
High, Moderate, Low or Negligible
1a, 1b, 2a or 2b (see Table 3)
page 4 of 68

Table 1 Layers of geoscientific information used in implementing the WFD
Map Description Organisation Soils A new digital map, which will be available for the whole
country in late 2005, is being produced, which maps soils on the basis of whether they are mineral or organic, well drained or poorly drained and acidic or basic.
Spatial Analysis Group, Teagasc, as part of a DEHLG funded project, managed by the EPA.
Subsoils A new digital map, which will be available for the country in mid 2005, is being produced, which is showing all the main subsoil types – sands/gravels, till, alluvium, lacustrine deposits, marine deposits and peat. GSI Quaternary geology maps, where available, are used as part of the mapping process.
Teagasc, as part of a DEHLG funded project, managed by the EPA.
Bedrock The ~1140 formations and members in the detailed GSI country-wide digital bedrock map have been grouped into 28 rock units, based on similarities in hydrogeological properties. This map is now available on the GSI website.
GSI
Outcrop and depth to bedrock
All outcrops on the GSI 6 inch sheets have been digitised by the GSI together with more recent information. Subsequently, Teagasc have rectified and improved this map using digital photogrammetry techniques. All depth to bedrock readily available in GSI and in consultancies have been compiled by GSI and included in a digital database.
GSI and Teagasc
Subsoil permeability
Three subsoil permeability categories (high, moderate, low) have been mapped in 10 counties.
GSI
Vulnerability Vulnerability maps produced by GSI are available for ~52% of the country; ‘extremely’ vulnerable areas are being delineated for the remainder of the country by RBD consultants.
GSI and RBD consultants
Aquifer A draft national aquifer map has been completed and is now available on the GSI website. A report has been drafted, which will be finalised in early 2005.
GSI
Groundwater flow regime
The aquifer categories have been grouped into four flow regimes – karstic, fissured, poorly productive and granular – to aid surface water and groundwater characterisation.
GSI
Groundwater bodies (GWBs)
The boundaries of the ~410 GWBs have been delineated. Reports (3-6 pages) have been completed for each GWB using the following headings: Topography; Geology and Aquifers; Overlying Strata; Recharge; Discharge; Groundwater Flow Paths; Groundwater and Surface Water Interactions; Conceptual Model; Information Sources.
GSI (Acknowledgement: funding was provided to GSI by the DEHLG through the RBD projects)
page 5 of 68
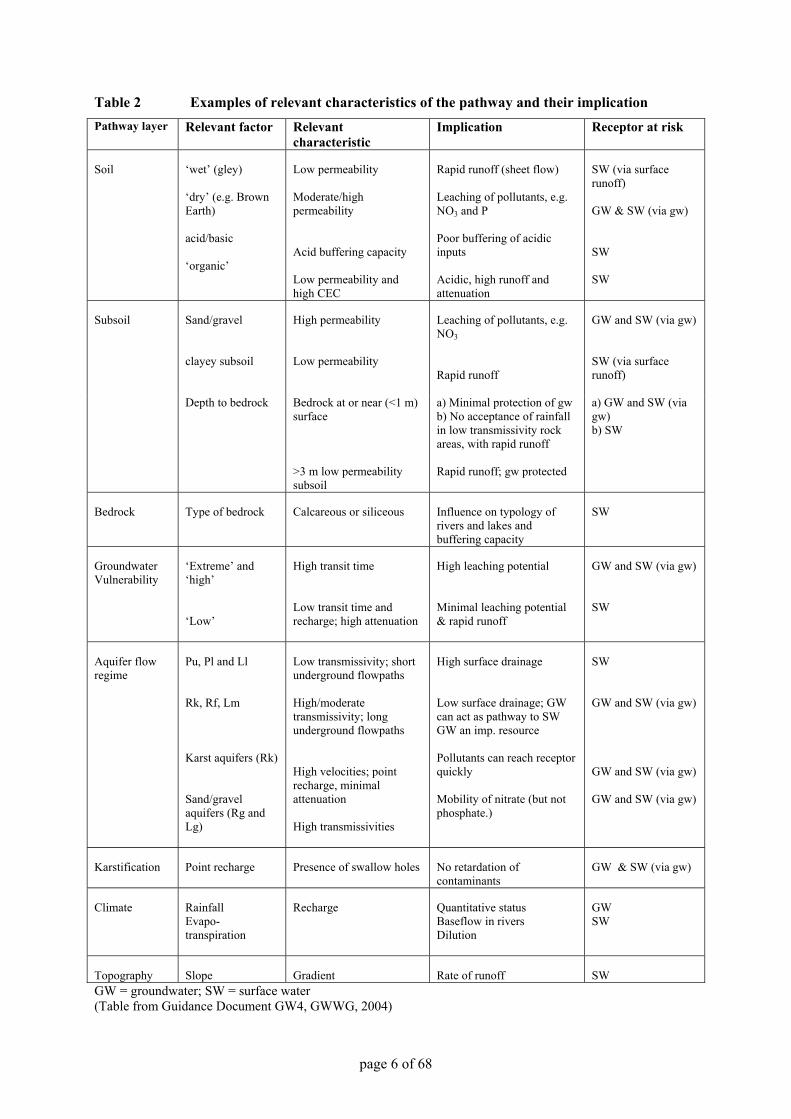
Table 2 Examples of relevant characteristics of the pathway and their implication Pathway layer
Relevant factor Relevant characteristic
Implication Receptor at risk
Soil
‘wet’ (gley) ‘dry’ (e.g. Brown Earth) acid/basic ‘organic’
Low permeability Moderate/high permeability Acid buffering capacity Low permeability and high CEC
Rapid runoff (sheet flow) Leaching of pollutants, e.g. NO3 and P Poor buffering of acidic inputs Acidic, high runoff and attenuation
SW (via surface runoff) GW & SW (via gw) SW SW
Subsoil
Sand/gravel clayey subsoil
High permeability Low permeability
Leaching of pollutants, e.g. NO3 Rapid runoff
GW and SW (via gw) SW (via surface runoff)
Depth to bedrock
Bedrock at or near (<1 m) surface >3 m low permeability subsoil
a) Minimal protection of gw b) No acceptance of rainfall in low transmissivity rock areas, with rapid runoff Rapid runoff; gw protected
a) GW and SW (via gw) b) SW
Bedrock
Type of bedrock
Calcareous or siliceous
Influence on typology of rivers and lakes and buffering capacity
SW
Groundwater Vulnerability
‘Extreme’ and ‘high’ ‘Low’
High transit time Low transit time and recharge; high attenuation
High leaching potential Minimal leaching potential & rapid runoff
GW and SW (via gw) SW
Aquifer flow regime
Pu, Pl and Ll Rk, Rf, Lm Karst aquifers (Rk) Sand/gravel aquifers (Rg and Lg)
Low transmissivity; short underground flowpaths High/moderate transmissivity; long underground flowpaths High velocities; point recharge, minimal attenuation High transmissivities
High surface drainage Low surface drainage; GW can act as pathway to SW GW an imp. resource Pollutants can reach receptor quickly Mobility of nitrate (but not phosphate.)
SW GW and SW (via gw) GW and SW (via gw) GW and SW (via gw)
Karstification
Point recharge
Presence of swallow holes
No retardation of contaminants
GW & SW (via gw)
Climate
Rainfall Evapo-transpiration
Recharge
Quantitative status Baseflow in rivers Dilution
GW SW
Topography
Slope
Gradient
Rate of runoff
SW
GW = groundwater; SW = surface water (Table from Guidance Document GW4, GWWG, 2004)
page 6 of 68

3. Risk Assessment
3.1 Risk Categories The impact of human activities is described in terms of risk assessment for each water body as to whether it will achieve the required ecological status by 2015 or not. The assessment undertaken results in all water bodies being placed into one of three risk categories defined under by the European Commission’s Reporting Sheets as follows:
Water bodies for which it is already clear without the need for further characterisation or additional monitoring data, that the objectives will be failed;
Water bodies for which it is possible that the objectives of the Directive will be failed but, because of inadequate data, further characterisation and operational monitoring are considered necessary to be sufficiently confident that this is the case;
Water bodies for which it is already clear, without the need for further characterisation or additional monitoring data, that the achievement of the objectives are not at risk.
In Ireland, these three Categories have been further refined to four risk categories for the purpose of focussing actions during the next phase (2005-2008). These risk categories, designated as 2b, 2a, 1b and 1a, and their relationship to the WFD reporting categories are shown in Table 3.
Table 3 Irish Risk Assessment Reporting Categories
WFD Risk Category
European Commission Reporting Sheet Risk Categories (Dec. 2004)
Irish Reporting Risk Categories
Water bodies for which it is already clear without the need for further characterisation or additional monitoring data, that the objectives will be failed
(1a) Water bodies at significant risk Action: Identifies water bodies for which consideration of appropriate measures to improve status can start as soon as practical
Water bodies at risk of failing to achieve an environmental objective
(1b) Water bodies probably at significant risk but for which further information will be needed to confirm that this view is correct Action: Focus for more detailed risk assessments (including, where necessary, further characterisation) aimed at determining whether or not the water bodies in this category are at significant risk in time for the publication of the interim overview of significant water management issues in 2007
Water bodies where, due to insufficient data, further characterisation and operational monitoring are necessary for a clear assessment of to be made
(2a) Water bodies probably not at significant risk on the basis of available information for which confidence in the available information being comprehensive and reliable is lower Action: Focus for more detailed risk assessments aimed at determining whether or not the water bodies in this category are not at significant risk in time for the publication of the draft River Basin Management Plan due to be completed in 2008
Water bodies not at risk of failing to achieve an environmental objective
Water bodies for which it is already clear, without the need for further characterisation or additional monitoring data, that the achievement of the objectives are not at risk
(2b) Water bodies not at significant risk on the basis of available information for which confidence in the available information being comprehensive and reliable is high Action: Identifies water bodies for which consideration of appropriate measures to ensure no deterioration in status can start as soon as practical
page 7 of 68

3.2 Risk Assessment Sheets The risk assessment methodology is based on considering four receptors – groundwater bodies, groundwater dependent rivers and lakes, groundwater dependent terrestrial ecosystems and drinking water abstraction points. The environmental objectives, pathway susceptibility and sensitivity of the receptors frequently vary. Therefore, for each of these receptors, the impact of three pressure types – groundwater abstraction, diffuse source pollutants and point source pollutants – is considered separately. Risk assessment sheets have been prepared for each scenario listed in Table 4, and they are given in the following Sections.
Table 4 WFD Groundwater Risk Assessment Sheets for Relevant Receptors and Pressures
Receptor: Groundwater Body
Groundwater dependent
rivers, lakes & estuaries
Groundwater Dependent Terrestrial Ecosystems
Abstraction points
WFD Objective: Pressure:
Status, trends Status Status Drinking water
protected areas
Groundwater Abstraction Water balance GWRA1 SWRA1 GWDTERA1 - Intrusion GWRA2 - - - Diffuse Source Pollutants Mobile nutrients (e.g. NO3) GWRA3 SWRA2 DWPARA1 Less mobile nutrients (e.g. PO4) - SWRA3 GWDTERA2a
GWDTERA2b -
Mobile chemicals GWRA4 SWRA4 DWPARA2 Clustered on-site systems & leaking urban sewerage systems
GWRA5 SWRA5 GWDTERA3
Sheep dip D D D D Less mobile chemicals - - - - Microbial organisms - - - D Point Source Pollutants Mining GWRA6 SWRA6 GWDTERA4 Quarries GWRA7 GWDTERA5 Landfills GWRA8 GWDTERA6 Oil industry infrastructure GWRA9 GWDTERA7 Contaminated land GWRA10 GWDTERA8 Trade effluent discharges GWRA11 Urban wastewater discharges GWRA12 GWDTERA9 Notes:
1. Each number represents a separate risk assessment sheet. 2. Where same heavy border colour is used, it indicates that the risk assessment matrices are identical. 3. “D”: assessment planned but deferred until data become available. 4. “-”: No assessment planned.
page 8 of 68

4. Groundwater Risk Assessment GWRA1 Summary details on pressures, receptors and WFD objective RA Sheet GWRA1 Receptor type Groundwater body Pressure type Abstraction WFD objective Quantitative status Assessment area Surface extent of the groundwater body Note: Further information and explanation is given in Guidance Document GW5 “Guidance on the Assessment of the Impact of Groundwater Abstractions” (GW WG, 2004).
A. Recharge Estimation a) Effective Rainfall Estimation
Obtained from recently produced Meteorological Service maps. b) Recharge Coefficient
The Recharge coefficient is the proportion of Effective Rainfall that may become Recharge. It should be determined by using Table 1 (below).
c) Applying a Recharge Cap on Poorly productive Aquifers
A recharge cap is applied to poorly productive aquifers, as they are not capable of accepting the available recharge due to their low transmissivity.
The recharge cap for Locally Important aquifers, which are moderately productive only in local zones (Ll) is 200mm/yr, whereas the cap for Poor Aquifers (Pl & Pu) is 100mm/yr.
B. Impact potential Aquifer Type
IMPACT POTENTIAL Bedrock Sand/gravel
>30% High High
20 to 30% High Moderate
10 to 20% Moderate Low
GW
AB
S as
a %
of
ave
rage
re
char
ge
2 to 10% Low Low <2% Negligible Negligible
C. Risk category based on predictive risk assessment and available impact data Potential Impact Evidence for GW
level decline No/ insufficient evidence for GW level decline
Evidence of no GW decline
High At Significant Risk (1a)
Probably at risk (1b) Not at significant risk (low confidence) (2a) to Not at significant risk (2b) based on confidence in the data
Moderate At Significant Risk (1a)
Not at significant risk (low confidence) (2a)
Not at significant risk (2b)
Low At Significant Risk (1a) to Probably at risk (1b) based on confidence in the data
Not at significant risk (low confidence) (2a)
Not at significant risk (2b)
page 9 of 68

Table 1 Recharge coefficients for different hydrogeological settings
Recharge coefficient (rc) Vulnerability category
Hydrogeological setting
Min (%)
Inner Range
Max (%)
1.i Areas where rock is at ground surface 60 80-90 100 1.ii Sand/gravel overlain by ‘well drained’ soil 60 80-90 100 Sand/gravel overlain by ‘poorly drained’ (gley)
soil
1.iii Till overlain by ‘well drained’ soil 45 50-70 80 1.iv Till overlain by ‘poorly drained’ (gley) soil 15 25-40 50 1.v Sand/ gravel aquifer where the water table is ≤ 3 m
below surface 70 80-90 100
Extreme
1.vi Peat 15 25-40 50 2.i Sand/gravel aquifer, overlain by ‘well drained’ soil 60 80-90 100
2.ii High permeability subsoil (sand/gravel) overlain by ‘well drained’ soil
60 80-90 100
2.iii High permeability subsoil (sand/gravel) overlain by ‘poorly drained’ soil
2.iv Moderate permeability subsoil overlain by ‘well drained’ soil
35 50-70 80
2.v Moderate permeability subsoil overlain by ‘poorly drained’ (gley) soil
15 25-40 50
2.vi Low permeability subsoil 10 23-30 40
High
2.vii Peat 0 5-15 20 3.i Moderate permeability subsoil and overlain by
‘well drained’ soil 25 30-40 60
3.ii Moderate permeability subsoil and overlain by ‘poorly drained’ (gley) soil
10 20-40 50
3.iii Low permeability subsoil 5 10-20 30
Moderate
3. iv Basin peat 0 3-5 10 4.i Low permeability subsoil 2 5-15 20 Low 4.ii Basin peat 0 3-5 10 5.i High Permeability Subsoils (Sand & Gravels) 60 90 100 5.ii Moderate Permeability Subsoil overlain by well
drained soils 25 60 80
5.iii Moderate Permeability Subsoils overlain by poorly drained soils
10 30 50
5.iv Low Permeability Subsoil 2 20 40
High to Low
5.v Peat 0 5 20
page 10 of 68

5. Ground Water Risk Assessment GWRA2 Summary details on pressures, receptors and WFD objective RA Sheet GWRA2 Receptor type Groundwater body Pressure type Saline Intrusion WFD objective Chemical & quantitative status Assessment area Surface extent of the ground water body This risk assessment only applies to those ground water bodies that are adjacent to transitional or coastal waters.
A. Pathway susceptibility The pathway susceptibility depends on:
Distance from saline water – a maximum distance of 5km from the transitional/coastal waters is sufficient for this risk assessment process;
Groundwater flow regime, as indicated by aquifer type. The vertical pathway (as defined by vulnerability) is not relevant, unless the aquifer is
confined. Table A
Flow Regime PATHWAY SUSCEPTIBILITY Karst
aquifers Fissured aquifers
Intergranular aquifers
Poorly productive aquifers
<100 m E E H M 100-1000 m H H M L
Distance from saline water 1000-3000 m M M L L
B. Impact potential Pressure magnitude is a function of the quantity of groundwater abstracted. Table B
Pathway Susceptibility (from Table A) IMPACT POTENTIAL
Extreme High Moderate Low
>5000 m3/d High High High Moderate
1000-5000 m3/d High Moderate Moderate Moderate
100-1000 m3/d Moderate Low Low Low
Pres
sure
m
agni
tude
<100 m3/d Low Low Negligible Negligible
page 11 of 68

C. Risk category based on predictive and impact risk assessments Assessments made on the basis of predictions from pressure-susceptibility analysis
Adjustments to risk assessment category based on available impact data
Impact potential (from Table B)
Risk category for whole groundwater
body
Data type* Adjusted risk assessment category
High 1b Average EC in excess of 1000 µS/cm at monitoring points within 2 km of coast where levels are not thought to be naturally derived
1a
Moderate 2a Average EC in excess of 1000 µS/cm at monitoring points within 2 km of coast where levels are not thought to be naturally derived
1b
Low 2a Negligible 2b *Based largely on SEPA RA sheet. Note: If sensitive receptors, such as GWDTEs, are present in an area of high, moderate and low impact potential, this risk assessment should be compared with the results of RA sheet GWDTERA1, to ensure that the risk assessment is sufficiently comprehensive.
D. Delineating Groundwater Bodies ‘At Risk’ from Point Saline Intrusion In most GWBs, saline intrusion will affect only a small proportion of the GWB. In order to focus monitoring and further characterisation on relevant areas, it is recommended that where saline intrusion is considered to be putting a groundwater body ‘at risk’ (categories 1a or 1b) and the impacted area is <50% of the GWB, subdivision should normally be undertaken. The boundaries must be based on the conceptual understanding of the area and on hydrogeological boundaries to flow. For instance, the surface water catchment may be used where it equates closely to the impacted catchment area. Alternatively, groundwater flow lines (estimated, in most instances) may be used.
page 12 of 68
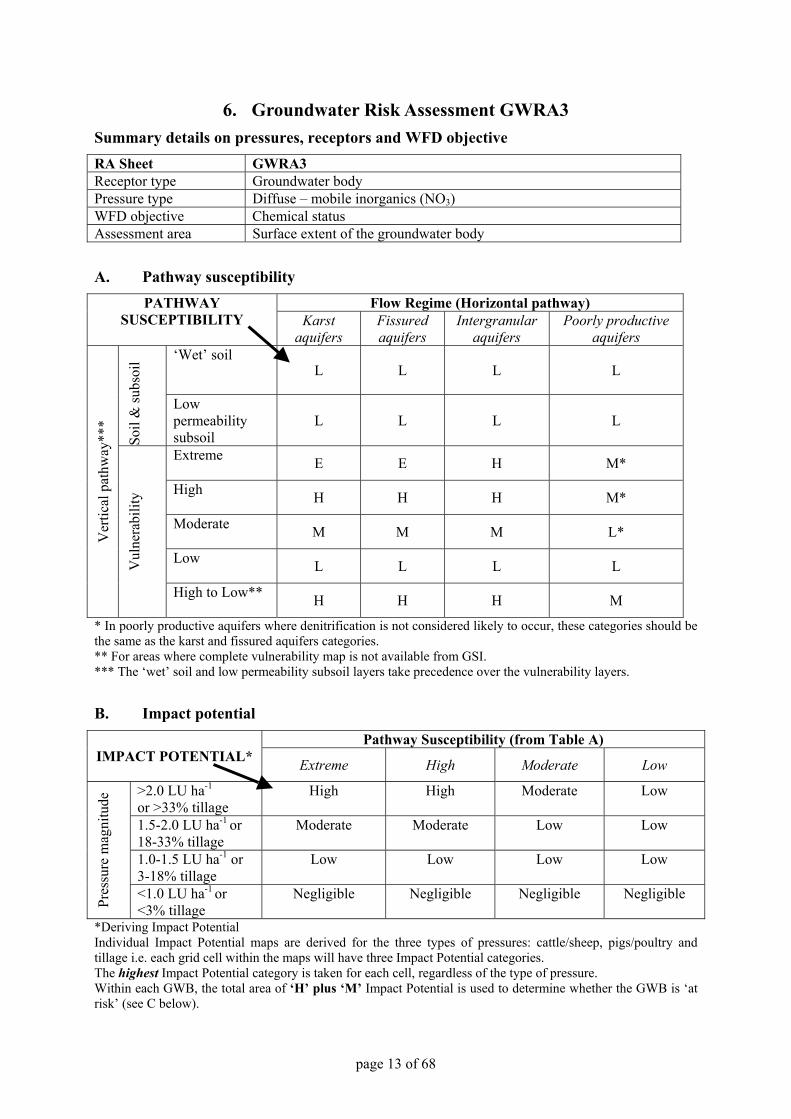
6. Groundwater Risk Assessment GWRA3 Summary details on pressures, receptors and WFD objective RA Sheet GWRA3 Receptor type Groundwater body Pressure type Diffuse – mobile inorganics (NO3) WFD objective Chemical status Assessment area Surface extent of the groundwater body
A. Pathway susceptibility Flow Regime (Horizontal pathway) PATHWAY
SUSCEPTIBILITY Karst aquifers
Fissured aquifers
Intergranular aquifers
Poorly productive aquifers
‘Wet’ soil L L L L
Soil
& su
bsoi
l
Low permeability subsoil
L L L L
Extreme E E H M*
High H H H M*
Moderate M M M L*
Low L L L L
Ver
tical
pat
hway
***
Vul
nera
bilit
y
High to Low** H H H M
* In poorly productive aquifers where denitrification is not considered likely to occur, these categories should be the same as the karst and fissured aquifers categories. ** For areas where complete vulnerability map is not available from GSI. *** The ‘wet’ soil and low permeability subsoil layers take precedence over the vulnerability layers.
B. Impact potential Pathway Susceptibility (from Table A)
IMPACT POTENTIAL* Extreme High Moderate Low
>2.0 LU ha-1
or >33% tillage High High Moderate Low
1.5-2.0 LU ha-1 or 18-33% tillage
Moderate Moderate Low Low
1.0-1.5 LU ha-1 or 3-18% tillage
Low Low Low Low
Pres
sure
mag
nitu
de
<1.0 LU ha-1 or <3% tillage
Negligible Negligible Negligible Negligible
*Deriving Impact Potential Individual Impact Potential maps are derived for the three types of pressures: cattle/sheep, pigs/poultry and tillage i.e. each grid cell within the maps will have three Impact Potential categories. The highest Impact Potential category is taken for each cell, regardless of the type of pressure. Within each GWB, the total area of ‘H’ plus ‘M’ Impact Potential is used to determine whether the GWB is ‘at risk’ (see C below).
page 13 of 68

C. Risk category based on predictive risk assessment Proportion of assessment area with high and moderate impact
potential
RISK CATEGORY >40%** 25-40% 15-25% 10-15% 5-10% <5%
High sensitivity* (nitrate-limited ecosystems)
n/a n/a n/a n/a n/a n/a
Rec
epto
r Se
nsiti
vity
Moderate 1b 2a 2a 2a 2b 2b
* Not applicable – see RA sheet SWRA2. **The basis for this threshold is given in guidance document no. GW10 (GW WG, 2004).
D. Risk category of groundwater body adjusted using available impact data Adjustments made using available groundwater impact data Predictive risk
category Data criteria Adjusted risk category All categories Available representative monitoring data
show an environmentally significant upward trend in groundwater nitrate concentrations
1a
1b Weighted mean NO3-N >11.3 mg l-1 1a or 1b, depending on level of confidence in the monitoring data
2a 2b
Weighted mean NO3-N 8.5-11.3 mg l-1
1b or 2a, depending on level of confidence in the monitoring data
Weighted mean NO3-N 5.65-8.5 mg l-1 2a 2b Weighted mean NO3-N <5.6 mg l-1 2b
page 14 of 68

7. Groundwater Risk Assessment GWRA4 Summary details on pressures, receptors and WFD objective RA Sheet GWRA4 Receptor type Groundwater body Pressure type Diffuse – mobile organics (pesticides and PAHs) WFD objective Chemical status Assessment area Surface extent of the groundwater body
A. Pathway susceptibility Flow Regime (Horizontal pathway) PATHWAY
SUSCEPTIBILITY Karst aquifers Fissured aquifers Intergranular aquifers
Poorly productive aquifers
Sub-
soil
Low permeability subsoil* L L L L
Extreme E E H E
High H H H H
Moderate M M M L
Low L L L L
Ver
tical
pat
hway
Vul
nera
bilit
y
High to low** H H H M
* In areas where GSI subsoil permeability map is unavailable, use vulnerability map alone. ** For areas where complete vulnerability map is not available from GSI.
B. Impact potential Pathway Susceptibility (from Table A)
IMPACT POTENTIAL Extreme High Moderate Low
Present
High Moderate Low Negligible
Pres
sure
m
agni
tude
Absent
Negligible Negligible Negligible Negligible
* Pressure magnitude The pressures that are considered to pose a significant threat to groundwater are: urban and industrial areas, tillage, major roads and railways.
C. Risk category based on predictive risk assessment Proportion of assessment area with high and moderate impact
potential
RISK CATEGORY >50% 25-50% 15-25% 10-15% 5-10% <5%
High sensitivity (all GW bodies)
1b 1b 1b 2a 2a 2b
Rec
epto
r Se
nsiti
vity
Moderate/Low sensitivity
n/a n/a n/a n/a n/a n/a
n/a = not applicable
page 15 of 68

D. Risk category of groundwater body adjusted using available impact data Adjustments made using available groundwater impact data Predictive risk
category (from Table C)
Data criteria** Adjusted risk category
1b One or more groundwater sampling stations have EITHER: Any individual selected trace organic >0.05 µg/l in more than 25% of groundwater samples, OR Total trace organic >0.01 µg/l in more than 2 samples, OR Maximum trace organic >100 µg/l in any one sample.
1a or 1b, depending on level of confidence in the monitoring data
2a
One or more groundwater sampling stations have EITHER: Any individual selected trace organic >0.05µg/l in more than 25% of groundwater samples, OR Total trace organic >0.01µg/l in more than 2 samples, OR Maximum total trace organic >0.1 µg/l in any one sample.
1b
2b One or more groundwater sampling stations have EITHER: Any individual selected trace organic >0.05µg/l in more than 25% of groundwater samples, OR Total trace organic >0.01µg/l in more than 2 samples, OR Maximum total trace organic >0.1 µg/l in any one sample.
2a or 1b, depending on level of confidence in the monitoring data
** copied from SEPA approach.
page 16 of 68

8. Groundwater Risk Assessment GWRA5 Summary details on pressures, receptors and WFD objective RA Sheet GWRA5 Receptor type Groundwater body Pressure type Clustered on-site systems & leaking urban sewerage systems* –
inorganics (N & P) WFD objective Chemical status Assessment area Surface extent of the groundwater body * Both pressures are assumed to produce similar pollutants. However, where the receptor is a groundwater body, the only pollutant considered is nitrate.
A. Pathway susceptibility Flow Regime (Horizontal pathway) PATHWAY
SUSCEPTIBILITY FOR NITRATES
Karst aquifers
Fissured aquifers
Intergranular aquifers
Poorly productive aquifers
Subs
oil Low permeability
subsoil L L L L
Extreme E E H M*
High H H H M*
Moderate M M M L*
Low L L L L*
Ver
tical
pat
hway
Vul
nera
bilit
y
High to Low H H H M*
*In poorly productive aquifers where denitrification is not considered likely to occur, these categories should be the same as the karst and fissured aquifers categories.
B. Impact Potential The presence of urban and discontinuous urban fabric from CORINE and/or build up areas from the Ordnance survey maps make up the pressure layer on the groundwater body.
Nitrogen Pathway Susceptibility (from Table A) IMPACT POTENTIAL
Extreme High Moderate Low
Present
High Moderate Low Negligible
Pres
sure
m
agni
tude
Absent
Negligible Negligible Negligible Negligible
page 17 of 68

C. Risk category based on predictive risk assessment Proportion of assessment area with high and moderate impact
potential
RISK CATEGORY >40% 25-40% 15-25% 10-15% 5-10% <5%
High sensitivity* (nitrate-limited ecosystems)
n/a n/a n/a n/a n/a n/a
Rec
epto
r Se
nsiti
vity
Moderate
1b 2a 2a 2a 2b 2b
* Not applicable – see RA sheet GWDTERA3.
D. Risk category of groundwater body adjusted using available impact data Adjustments made using available impact data Predictive
risk category Data criteria Adjusted risk category 1b Where significant impacts are known to occur
by GSI, EPA, local authorities or RBD consultants
1a
2a Where significant impacts are known to occur by GSI, EPA, local authorities or RBD consultants
1b or 1a, depending on confidence in data and/or degree of impact.
page 18 of 68
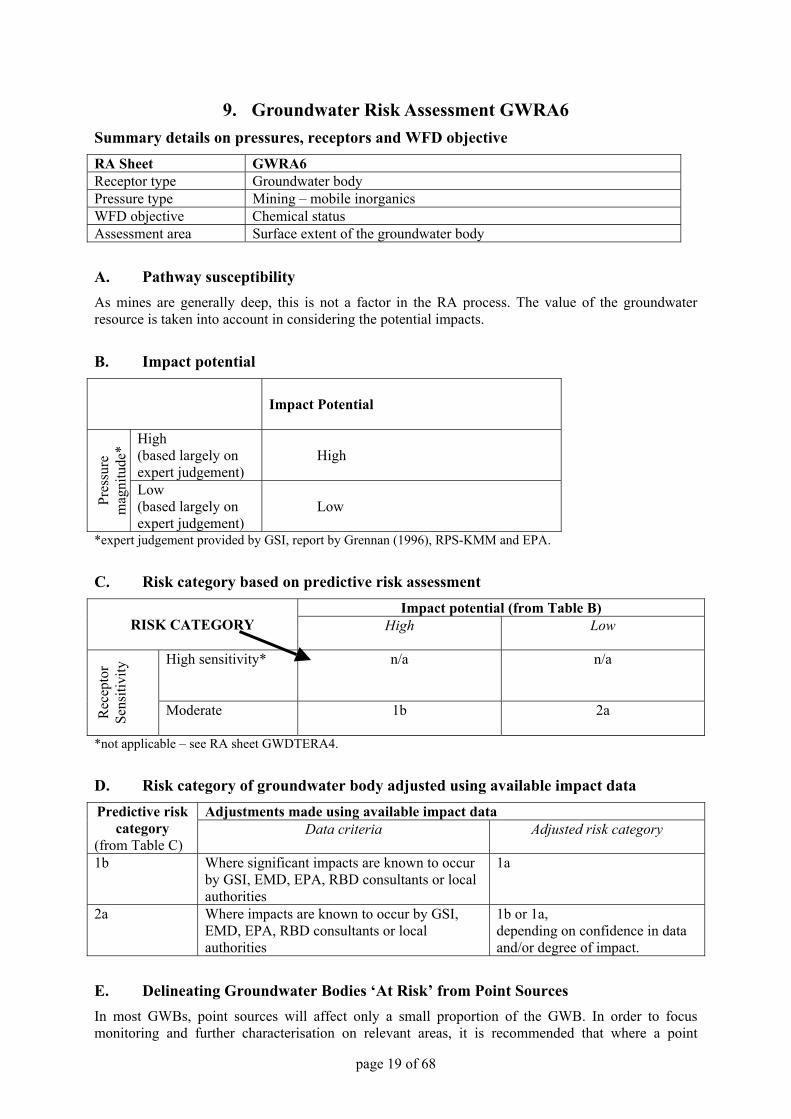
9. Groundwater Risk Assessment GWRA6 Summary details on pressures, receptors and WFD objective RA Sheet GWRA6 Receptor type Groundwater body Pressure type Mining – mobile inorganics WFD objective Chemical status Assessment area Surface extent of the groundwater body
A. Pathway susceptibility As mines are generally deep, this is not a factor in the RA process. The value of the groundwater resource is taken into account in considering the potential impacts.
B. Impact potential
Impact Potential
High (based largely on expert judgement)
High
Pres
sure
m
agni
tude
*
Low (based largely on expert judgement)
Low
*expert judgement provided by GSI, report by Grennan (1996), RPS-KMM and EPA.
C. Risk category based on predictive risk assessment Impact potential (from Table B)
RISK CATEGORY
High Low
High sensitivity*
n/a n/a
Rec
epto
r Se
nsiti
vity
Moderate
1b 2a
*not applicable – see RA sheet GWDTERA4.
D. Risk category of groundwater body adjusted using available impact data Adjustments made using available impact data Predictive risk
category (from Table C)
Data criteria Adjusted risk category
1b Where significant impacts are known to occur by GSI, EMD, EPA, RBD consultants or local authorities
1a
2a
Where impacts are known to occur by GSI, EMD, EPA, RBD consultants or local authorities
1b or 1a, depending on confidence in data and/or degree of impact.
E. Delineating Groundwater Bodies ‘At Risk’ from Point Sources In most GWBs, point sources will affect only a small proportion of the GWB. In order to focus monitoring and further characterisation on relevant areas, it is recommended that where a point
page 19 of 68

source(s) is considered to be putting a groundwater body ‘at risk’ (categories 1a or 1b) and the impacted area is <50% of the GWB, subdivision should normally be undertaken. The boundaries must be based on the conceptual understanding of the area and on hydrogeological boundaries to flow. For instance, the surface water catchment may be used where it corresponds closely to the impacted catchment area. Alternatively, groundwater flow lines (estimated, in most instances) may be used.
page 20 of 68
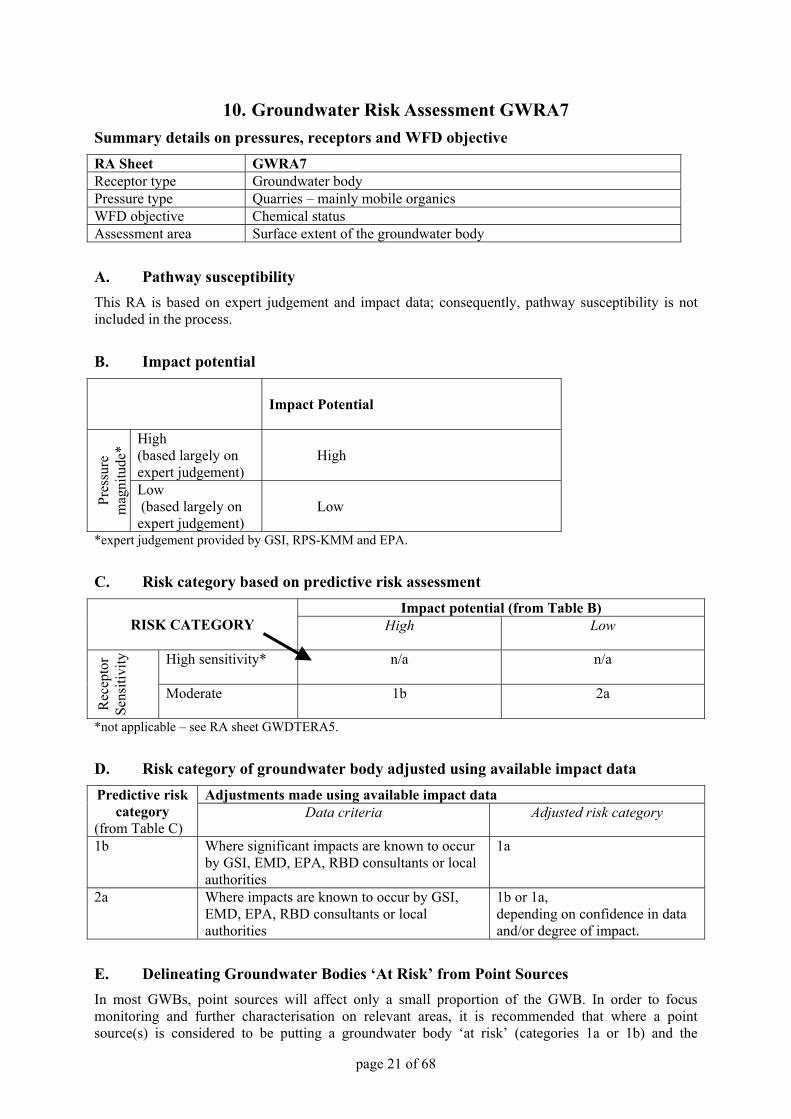
10. Groundwater Risk Assessment GWRA7 Summary details on pressures, receptors and WFD objective RA Sheet GWRA7 Receptor type Groundwater body Pressure type Quarries – mainly mobile organics WFD objective Chemical status Assessment area Surface extent of the groundwater body
A. Pathway susceptibility This RA is based on expert judgement and impact data; consequently, pathway susceptibility is not included in the process.
B. Impact potential
Impact Potential
High (based largely on expert judgement)
High
Pres
sure
m
agni
tude
*
Low (based largely on expert judgement)
Low
*expert judgement provided by GSI, RPS-KMM and EPA.
C. Risk category based on predictive risk assessment Impact potential (from Table B)
RISK CATEGORY
High Low
High sensitivity*
n/a n/a
Rec
epto
r Se
nsiti
vity
Moderate
1b 2a
*not applicable – see RA sheet GWDTERA5.
D. Risk category of groundwater body adjusted using available impact data Adjustments made using available impact data Predictive risk
category (from Table C)
Data criteria Adjusted risk category
1b Where significant impacts are known to occur by GSI, EMD, EPA, RBD consultants or local authorities
1a
2a
Where impacts are known to occur by GSI, EMD, EPA, RBD consultants or local authorities
1b or 1a, depending on confidence in data and/or degree of impact.
E. Delineating Groundwater Bodies ‘At Risk’ from Point Sources In most GWBs, point sources will affect only a small proportion of the GWB. In order to focus monitoring and further characterisation on relevant areas, it is recommended that where a point source(s) is considered to be putting a groundwater body ‘at risk’ (categories 1a or 1b) and the
page 21 of 68

impacted area is <50% of the GWB, subdivision should normally be undertaken. The boundaries must be based on the conceptual understanding of the area and on hydrogeological boundaries to flow. For instance, the surface water catchment may be used where it corresponds closely to the impacted catchment area. Alternatively, groundwater flow lines (estimated, in most instances) may be used.
page 22 of 68

11. Groundwater Risk Assessment GWRA8 Summary details on pressures, receptors and WFD objective RA Sheet GWRA8 Receptor type Groundwater body Pressure type Landfill Sites WFD objective Chemical status Assessment area Surface extent of the groundwater body
A. Pathway susceptibility This RA is based on expert judgement and impact data; consequently, a pathway susceptibility matrix is not included in the process.
B. Impact potential Impact Potential*
High (based largely on expert judgement)
High
Pres
sure
m
agni
tude
**
Low (based largely on expert judgement)
Low
* expert judgement provided by EPA and RPS-KMM. ** Modern engineered landfills with fully lined cells are considered to exert a low pressure magnitude on groundwater, whereas, older un-lined cells in landfills and older closed landfills are assumed to exert a high pressure magnitude on the groundwater.
C. Risk category based on predictive risk assessment Impact potential (from Table B)
RISK CATEGORY
High Moderate/Low
High sensitivity*
n/a n/a
Rec
epto
r Se
nsiti
vity
Moderate
1b 2a
*not applicable – see RA sheet GWDTERA6.
D. Risk category of groundwater body adjusted using available impact data Adjustments made using available impact data Predictive risk
category (from Table C)
Data criteria Adjusted risk category
1b Where significant impacts are known to occur by EPA, RBD consultants or local authorities
1a
2a
Where impacts are known to occur by EPA, RBD consultants or local authorities
1b or 1a, depending on confidence in data and/or degree of impact.
page 23 of 68

E. Delineating Groundwater Bodies ‘At Risk’ from Point Sources In most GWBs, point sources will affect only a small proportion of the GWB. In order to focus monitoring and further characterisation on relevant areas, it is recommended that where a point source(s) is considered to be putting a groundwater body ‘at risk’ (categories 1a or 1b) and the impacted area is <50% of the GWB, subdivision should normally be undertaken. The boundaries must be based on the conceptual understanding of the area and on hydrogeological boundaries to flow. For instance, the surface water catchment may be used where it corresponds closely to the impacted catchment area. Alternatively, groundwater flow lines (estimated, in most instances) may be used.
page 24 of 68

12. Groundwater Risk Assessment GWRA9 Summary details on pressures, receptors and WFD objective RA Sheet GWRA9 Receptor type Groundwater body Pressure type Oil Industry Infrastructure WFD objective Chemical status Assessment area Surface extent of the groundwater body
A. Pathway susceptibility This RA is based on expert judgement and impact data; consequently, a pathway susceptibility matrix is not included in the process.
B. Impact potential Impact Potential*
High (based largely on expert judgement)
High
Pres
sure
m
agni
tude
**
Low (based largely on expert judgement)
Low
* expert judgement provided by EPA and RPS-KMM. ** The EPA list of VOC licensed activities where there is large-scale storage of petroleum products is used as the national available dataset.
C. Risk category based on predictive risk assessment Impact potential (from Table B)
RISK CATEGORY
High Moderate/Low
High sensitivity*
n/a n/a
Rec
epto
r Se
nsiti
vity
Moderate
1b** 2a**
*not applicable – see RA sheet GWDTERA7. **based on expert judgement of EPA staff
D. Risk category of groundwater body adjusted using available impact data Adjustments made using available impact data Predictive risk
category (from Table C)
Data criteria Adjusted risk category
1b Where significant impacts are known to occur by EPA, RBD consultants or local authorities
1a
2a
Where significant impacts are known to occur by EPA, RBD consultants or local authorities
1b or 1a, depending on confidence in data and/or degree of impact.
page 25 of 68

E. Delineating Groundwater Bodies ‘At Risk’ from Point Sources In most GWBs, point sources will affect only a small proportion of the GWB. In order to focus monitoring and further characterisation on relevant areas, it is recommended that where a point source(s) is considered to be putting a groundwater body ‘at risk’ (categories 1a or 1b) and the impacted area is <50% of the GWB, subdivision should normally be undertaken. The boundaries must be based on the conceptual understanding of the area and on hydrogeological boundaries to flow. For instance, the surface water catchment may be used where it corresponds closely to the impacted catchment area. Alternatively, groundwater flow lines (estimated, in most instances) may be used.
page 26 of 68

13. Groundwater Risk Assessment GWRA10 Summary details on pressures, receptors and WFD objective RA Sheet GWRA10 Receptor type Groundwater body Pressure type Contaminated Land WFD objective Chemical status Assessment area Surface extent of the groundwater body
A. Pathway susceptibility This RA is based on expert judgement and impact data; consequently, a pathway susceptibility matrix is not included in the process.
B. Impact potential
Impact Potential*
High (based largely on expert judgement)
High
Pres
sure
m
agni
tude
*
Low (based largely on expert judgement)
Low
* expert judgement provided by EPA and RPS-KMM.
C. Risk category based on predictive risk assessment Impact potential (from Table B)
RISK CATEGORY
High Moderate/Low
High sensitivity*
n/a n/a
Rec
epto
r Se
nsiti
vity
Moderate
1b 2a
* not applicable – see RA sheet GWDTERA8.
D. Risk category of groundwater body adjusted using available impact data Adjustments made using available impact data Predictive risk
category (from Table C)
Data criteria Adjusted risk category
1b Where significant impacts are known to occur by EPA, RBD consultants or local authorities
1a
2a
Where impacts are known to occur by EPA, RBD consultants or local authorities
1b or 1a, depending on confidence in data and/or degree of impact.
E. Delineating Groundwater Bodies ‘At Risk’ from Point Sources In most GWBs, point sources will affect only a small proportion of the GWB. In order to focus monitoring and further characterisation on relevant areas, it is recommended that where a point source(s) is considered to be putting a groundwater body ‘at risk’ (categories 1a or 1b) and the
page 27 of 68

impacted area is <50% of the GWB, subdivision should normally be undertaken. The boundaries must be based on the conceptual understanding of the area and on hydrogeological boundaries to flow. For instance, the surface water catchment may be used where it corresponds closely to the impacted catchment area. Alternatively, groundwater flow lines (estimated, in most instances) may be used.
page 28 of 68
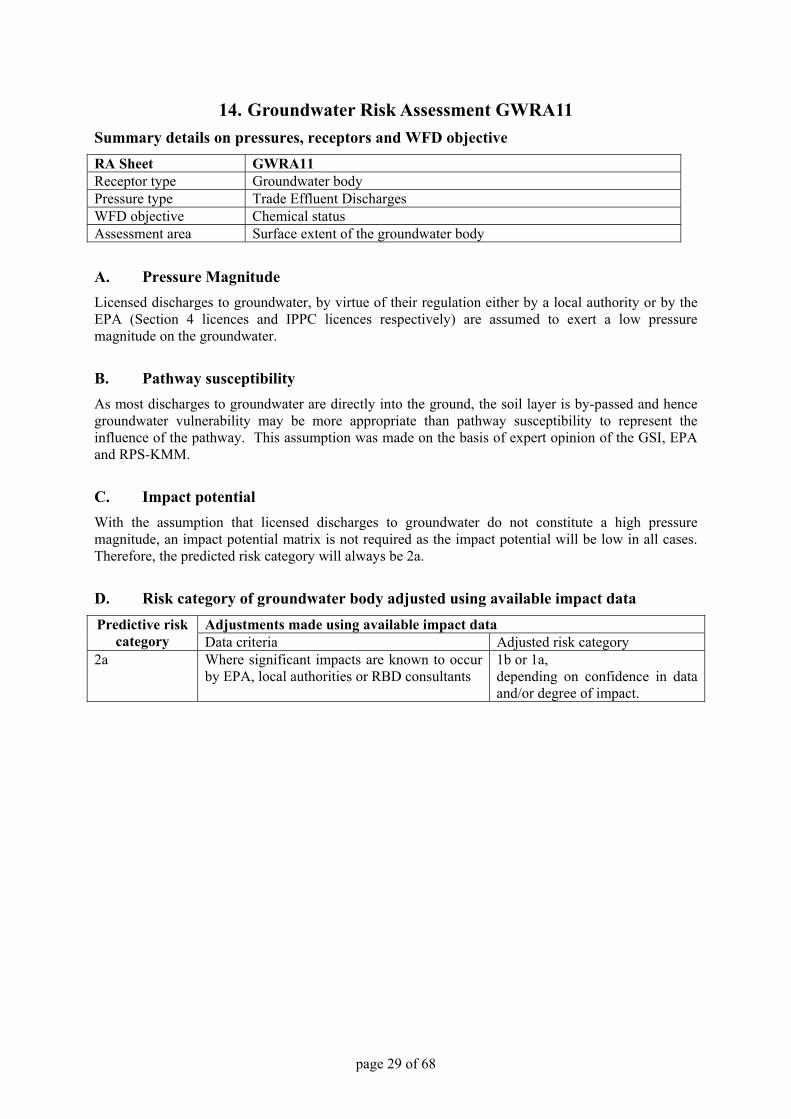
14. Groundwater Risk Assessment GWRA11 Summary details on pressures, receptors and WFD objective RA Sheet GWRA11 Receptor type Groundwater body Pressure type Trade Effluent Discharges WFD objective Chemical status Assessment area Surface extent of the groundwater body
A. Pressure Magnitude Licensed discharges to groundwater, by virtue of their regulation either by a local authority or by the EPA (Section 4 licences and IPPC licences respectively) are assumed to exert a low pressure magnitude on the groundwater.
B. Pathway susceptibility As most discharges to groundwater are directly into the ground, the soil layer is by-passed and hence groundwater vulnerability may be more appropriate than pathway susceptibility to represent the influence of the pathway. This assumption was made on the basis of expert opinion of the GSI, EPA and RPS-KMM.
C. Impact potential With the assumption that licensed discharges to groundwater do not constitute a high pressure magnitude, an impact potential matrix is not required as the impact potential will be low in all cases. Therefore, the predicted risk category will always be 2a.
D. Risk category of groundwater body adjusted using available impact data Adjustments made using available impact data Predictive risk
category Data criteria Adjusted risk category 2a Where significant impacts are known to occur
by EPA, local authorities or RBD consultants 1b or 1a, depending on confidence in data and/or degree of impact.
page 29 of 68

15. Groundwater Risk Assessment GWRA12 Summary details on pressures, receptors and WFD objective RA Sheet GWRA12 Receptor type Groundwater body Pressure type Wastewater Licensed Discharges to Groundwater – inorganics (N&P) WFD objective Chemical status Assessment area Surface extent of the groundwater body
A. Pressure Magnitude Local Authority wastewater discharges to groundwater that have discharge consents from the EPA and Local Authority Section 4 licenses are assumed to exert a low pressure on the groundwater as opposed to non-consented discharges that are assumed to exert a high pressure on the groundwater. EPA expert judgement is also used to determine other instances of high pressure magnitude discharges.
B. Pathway susceptibility As some of the urban waste-water discharges to groundwater are direct and others are indirect via percolation areas etc. it is not possible to factor in one single pathway into the risk assessment. For this risk assessment, EPA expert knowledge was used to assign a risk rating on a case-by-case basis.
C. Impact potential Impact Potential
High (based largely on expert judgement)*
High
Pres
sure
m
agni
tude
Low (based largely on expert judgement)
Low
*expert judgement provided by EPA and RPS-KMM.
D. Risk category based on predictive risk assessment Impact potential
RISK CATEGORY
High Low
High sensitivity*
n/a n/a
Rec
epto
r Se
nsiti
vity
Moderate
1b 2a
*not applicable – see RA sheet GWDTERA9.
E. Risk category of groundwater body adjusted using available impact data Adjustments made using available impact data Predictive risk
category Data criteria Adjusted risk category 1b Where significant impacts are known to occur
by EPA, RBD consultants or local authorities 1a
2a
Where impacts are known to occur by EPA, RBD consultants or local authorities
1b or 1a, depending on confidence in data and/or degree of impact.
page 30 of 68

16. Groundwater Risk Assessment SWRA1
Summary details on pressures, receptors and WFD objective RA Sheet SWRA1 Receptor type Groundwater Dependent Ecosystems in Rivers and Lakes Pressure type Abstraction WFD objective Quantitative status Assessment area Surface extent of the groundwater body Note: Further information and explanation is given in the Groundwater Working Group Report GW5 (2004) “Guidance on the Assessment of the Impact of Groundwater Abstractions”.
A. Recharge Estimation a) Effective Rainfall Estimation
Obtained from recently produced Meteorological Service maps. b) Recharge Coefficient
The Recharge coefficient is the proportion of Effective Rainfall that may become Recharge. It should be determined by using Table 1 (below).
c) Applying a Recharge Cap on Poorly productive Aquifers
A recharge cap is applied to poorly productive aquifers, as they are not capable of accepting the available recharge due to their low transmissivity.
The recharge cap for Locally Important aquifers, which are moderately productive only in local zones (Ll) is 200mm/yr, whereas the cap for Poor Aquifers (Pl & Pu) is 100mm/yr.
B. Impact potential Aquifer Type
IMPACT POTENTIAL Bedrock Sand/gravel >30% High High
20 to 30% High Moderate
10 to 20% Moderate Low
GW
AB
S as
a %
of
ave
rage
re
char
ge
2 to 10% Low Low
<2% Negligible Negligible
C. Risk category based on predictive risk assessment and available impact data Potential Impact Evidence for GW level
decline No/ insufficient evidence for GW level decline
Evidence of no GW decline
High At Significant Risk (1a) Probably at risk (1b) Not at significant risk (low confidence) (2a) to Not at significant risk (2b) based on confidence in the data
Moderate At Significant Risk (1a) Not at significant risk (low confidence) (2a)
Not at significant risk (2b)
Low At Significant Risk (1a) to Probably at risk (1b) based on confidence in the data
Not at significant risk (low confidence) (2a)
Not at significant risk (2b)
page 31 of 68

Table 1 Recharge Coefficients for different hydrogeological settings Recharge coefficient (rc) Vulnerability
category Hydrogeological setting
Min (%)
Inner Range
Max (%)
1.i Areas where rock is at ground surface 60 80-90 100 1.ii Sand/gravel overlain by ‘well drained’ soil 60 80-90 100 Sand/gravel overlain by ‘poorly drained’ (gley)
soil
1.iii Till overlain by ‘well drained’ soil 45 50-70 80 1.iv Till overlain by ‘poorly drained’ (gley) soil 15 25-40 50 1.v Sand/ gravel aquifer where the water table is ≤ 3 m
below surface 70 80-90 100
Extreme
1.vi Peat 15 25-40 50 2.i Sand/gravel aquifer, overlain by ‘well drained’ soil 60 80-90 100
2.ii High permeability subsoil (sand/gravel) overlain by ‘well drained’ soil
60 80-90 100
2.iii High permeability subsoil (sand/gravel) overlain by ‘poorly drained’ soil
2.iv Moderate permeability subsoil overlain by ‘well drained’ soil
35 50-70 80
2.v Moderate permeability subsoil overlain by ‘poorly drained’ (gley) soil
15 25-40 50
2.vi Low permeability subsoil 10 23-30 40
High
2.vii Peat 0 5-15 20 3.i Moderate permeability subsoil and overlain by
‘well drained’ soil 25 30-40 60
3.ii Moderate permeability subsoil and overlain by ‘poorly drained’ (gley) soil
10 20-40 50
3.iii Low permeability subsoil 5 10-20 30
Moderate
3. iv Basin peat 0 3-5 10 4.i Low permeability subsoil 2 5-15 20 Low 4.ii Basin peat 0 3-5 10 5.i High Permeability Subsoils (Sand & Gravels) 60 90 100 5.ii Moderate Permeability Subsoil overlain by well
drained soils 25 60 80
5.iii Moderate Permeability Subsoils overlain by poorly drained soils
10 30 50
5.iv Low Permeability Subsoil 2 20 40
High to Low
5.v Peat 0 5 20
page 32 of 68

17. Groundwater Risk Assessment SWRA2 Summary details on pressures, receptors and WFD objective RA Sheet SWRA2 Receptor type Groundwater dependent ecosystems in rivers, lakes, estuaries and
lagoons Pressure type Diffuse – mobile inorganics (NO3) WFD objective Chemical status Assessment area Surface extent of the groundwater body
A. Pathway susceptibility Flow Regime (Horizontal pathway)
PATHWAY SUSCEPTIBILITY Karst aquifers
Fissured aquifers
Intergranular aquifers
Poorly productive aquifers*
‘Wet’ soil L L L L
Soil
&
subs
oil
Low permeability subsoil
L L L L
Extreme E E H L High H H H L Moderate M M M L Low L L L L V
ertic
al p
athw
ay**
*
Vul
nera
bilit
y
High to Low** H H H M * These aquifers are not considered to be contributing a significant proportion of water to rivers and lakes and therefore are not included in pathway susceptibility. ** For areas where complete vulnerability map is not available form GSI. *** The ‘wet’ soil and low permeability subsoil layers take precedence over the vulnerability layers.
B. Impact potential Pathway Susceptibility (from Table A)
IMPACT POTENTIAL* Extreme High Moderate Low
>2.0 LU ha-1
or >33% tillage High High Moderate Low
1.5-2.0 LU ha-1 or 18-33% tillage
Moderate Moderate Low Low
1.0-1.5 LU ha-1 or 3-18% tillage
Low Low Low Low
Pres
sure
mag
nitu
de
<1.0 LU ha-1 or <3% tillage
Negligible Negligible Negligible Negligible
*Deriving Impact Potential Individual Impact Potential maps are derived for the three types of pressures: cattle/sheep, pigs/poultry and tillage i.e. each grid cell within the maps will have three Impact Potential categories. The highest Impact Potential category is taken for each cell, regardless of the type of pressure. Within each GWB, the total area of ‘H’ plus ‘M’ Impact Potential is used to determine whether the GWB is ‘at risk’ (see C below).
page 33 of 68

C. Risk category based on predictive risk assessment Proportion of assessment area with high and moderate impact potential
RISK CATEGORY
>50% 25-50%* 15-25% 10-15% 5-10% <5% High sensitivity (nitrate-limited ecosystems)
1b 1b 1b 2a 2a 2b
Rec
epto
r Se
nsiti
vity
Moderate (Rivers) 1b 1b 2a 2a 2b 2b
*The basis for this threshold is given in Guidance Document no. GW10 (GW WG, 2004).
D. Risk category of groundwater body adjusted using available impact data Adjustments made using available groundwater impact data Predictive risk
category Data criteria Adjusted risk category 1b Weighted mean NO3-N >11.3 mg l-1 1a or 1b,
depending on level of confidence in the monitoring data
2a 2b
Weighted mean NO3-N 5.65-11.3 mg l-1
1b or 2a, depending on level of confidence in the monitoring data
Weighted mean NO3-N 2.0-5.65 mg l-1 2a 2b Weighted mean NO3-N <2.0 mg l-1 2b
page 34 of 68
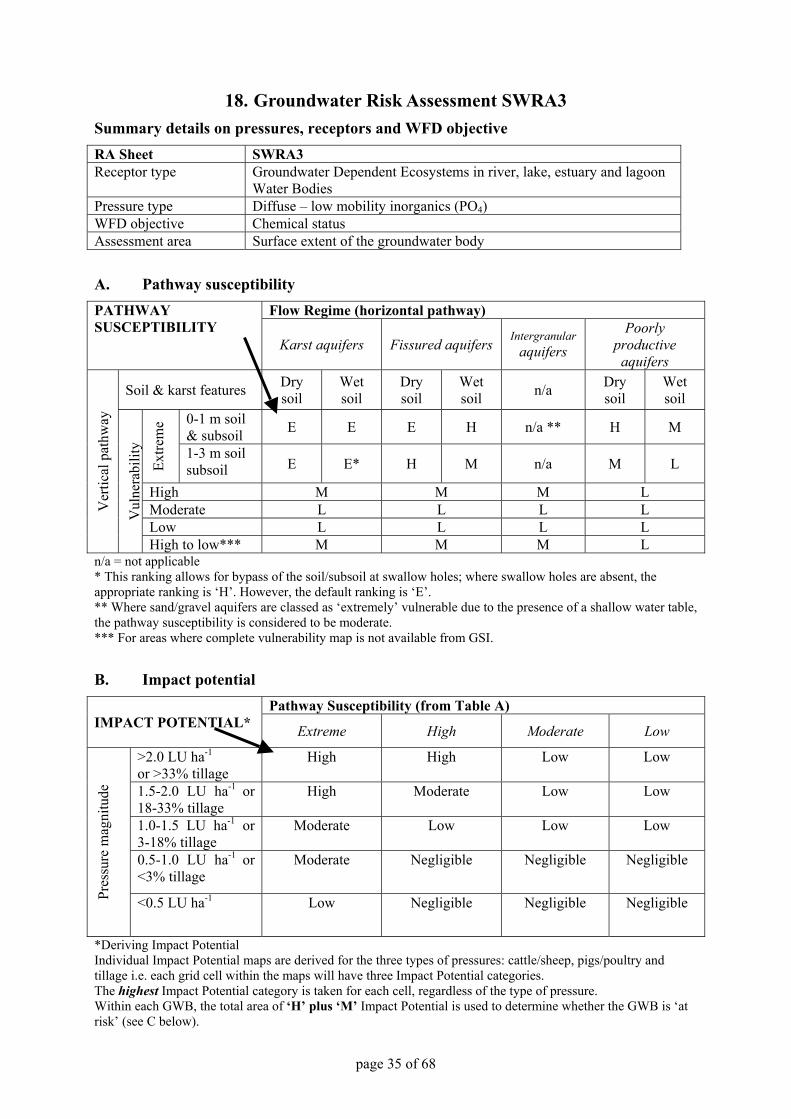
18. Groundwater Risk Assessment SWRA3 Summary details on pressures, receptors and WFD objective RA Sheet SWRA3 Receptor type Groundwater Dependent Ecosystems in river, lake, estuary and lagoon
Water Bodies Pressure type Diffuse – low mobility inorganics (PO4) WFD objective Chemical status Assessment area Surface extent of the groundwater body
A. Pathway susceptibility Flow Regime (horizontal pathway) PATHWAY
SUSCEPTIBILITY Karst aquifers Fissured aquifers Intergranular
aquifers Poorly
productive aquifers
Soil & karst features Dry soil
Wet soil
Dry soil
Wet soil n/a Dry
soil Wet soil
0-1 m soil & subsoil E E E H n/a ** H M
Extre
me
1-3 m soil subsoil E E* H M n/a M L
High M M M L Moderate L L L L Low L L L L
Ver
tical
pat
hway
Vul
nera
bilit
y
High to low*** M M M L n/a = not applicable * This ranking allows for bypass of the soil/subsoil at swallow holes; where swallow holes are absent, the appropriate ranking is ‘H’. However, the default ranking is ‘E’. ** Where sand/gravel aquifers are classed as ‘extremely’ vulnerable due to the presence of a shallow water table, the pathway susceptibility is considered to be moderate. *** For areas where complete vulnerability map is not available from GSI.
B. Impact potential Pathway Susceptibility (from Table A)
IMPACT POTENTIAL* Extreme High Moderate Low
>2.0 LU ha-1
or >33% tillage High High Low Low
1.5-2.0 LU ha-1 or 18-33% tillage
High Moderate Low Low
1.0-1.5 LU ha-1 or 3-18% tillage
Moderate Low Low Low
0.5-1.0 LU ha-1 or <3% tillage
Moderate Negligible Negligible Negligible
Pres
sure
mag
nitu
de
<0.5 LU ha-1 Low Negligible Negligible Negligible
*Deriving Impact Potential Individual Impact Potential maps are derived for the three types of pressures: cattle/sheep, pigs/poultry and tillage i.e. each grid cell within the maps will have three Impact Potential categories. The highest Impact Potential category is taken for each cell, regardless of the type of pressure. Within each GWB, the total area of ‘H’ plus ‘M’ Impact Potential is used to determine whether the GWB is ‘at risk’ (see C below).
page 35 of 68

C. Risk category based on predictive risk assessment Proportion of assessment area with high and moderate impact potential
RISK CATEGORY
>40% 25-40% 15-25% 10-15% 5-10% <5% High sensitivity*
1b 1b 2a 2a 2a 2b
Rec
epto
r Se
nsiti
vity
Moderate
1b 2a 2a 2a 2b 2b
* high sensitivity refers to certain sensitive lakes and lagoons
D. Risk category of groundwater body adjusted using available impact data (*) Adjustments for rivers and lakes in GWB Predictive Risk Category
Data Criteria** Adjusted risk category
1b MRP > 60 µg l-1
1a
2a MRP 30-60 µg l-1
1b
MRP 30-60 µg l-1
120-30 µg l-1
2a or 1b, depending on level of confidence in the monitoring data2b
MRP < 30µg l-1 1<20 µg l-1
2b
* Note: generally only MRP data will be available for groundwater, in which case only river criteria can apply. ** Median unfiltered Molybdate Reactive Phosphorus based on Phosphorus regulations which indicate that when in-river median MRP> 30µg l-1 the Q-value is generally less than Q4 (reference: McGarrigle et al. (2002) Appendix I). The 60 µg l-1 threshold is taken from SEPA, but is used here to highlight particular hotspots. 1 For protected areas (SPA and SAC) more stringent criteria apply. The 20 µg l-1 threshold is taken from McGarrigle et al. (2002) Appendix I, which indicates that when in-river median MRP> 20 µg l-1 the Q-value is generally less than Q4-5.
page 36 of 68
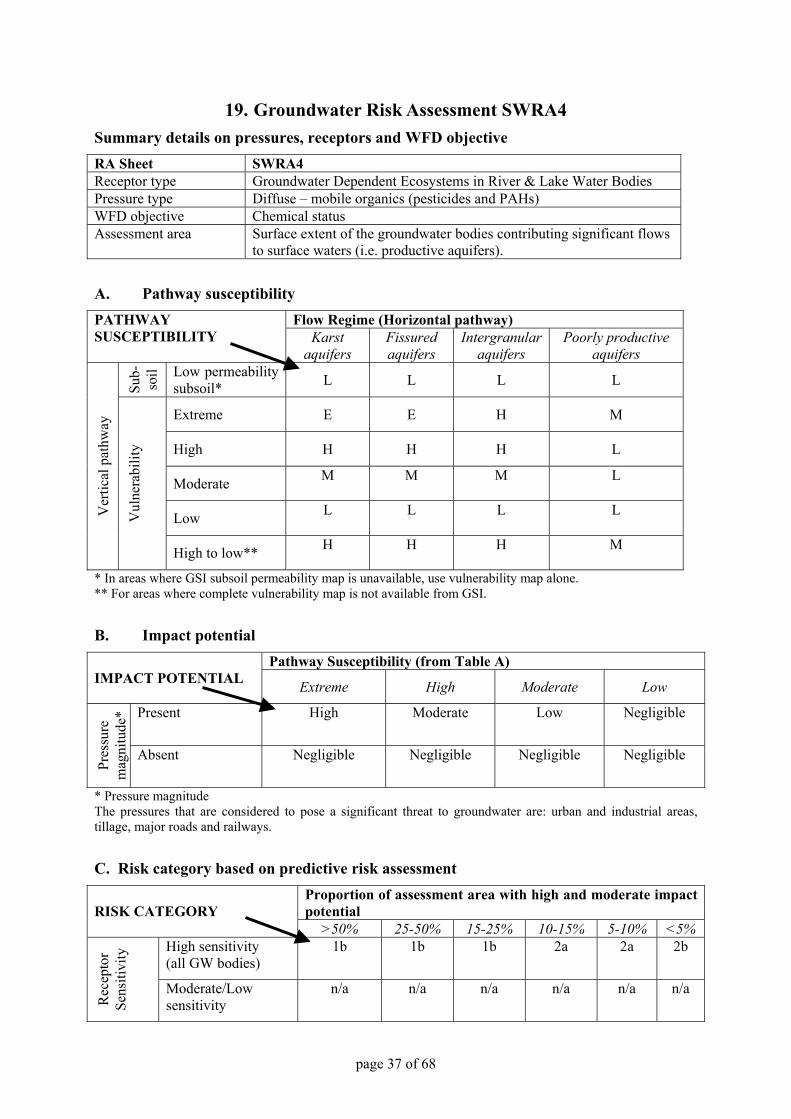
19. Groundwater Risk Assessment SWRA4 Summary details on pressures, receptors and WFD objective RA Sheet SWRA4 Receptor type Groundwater Dependent Ecosystems in River & Lake Water Bodies Pressure type Diffuse – mobile organics (pesticides and PAHs) WFD objective Chemical status Assessment area Surface extent of the groundwater bodies contributing significant flows
to surface waters (i.e. productive aquifers).
A. Pathway susceptibility Flow Regime (Horizontal pathway) PATHWAY
SUSCEPTIBILITY Karst aquifers
Fissured aquifers
Intergranular aquifers
Poorly productive aquifers
Sub-
soil Low permeability
subsoil* L L L L
Extreme E E H M
High H H H L
Moderate M M M L
Low L L L L Ver
tical
pat
hway
Vul
nera
bilit
y
High to low** H H H M
* In areas where GSI subsoil permeability map is unavailable, use vulnerability map alone. ** For areas where complete vulnerability map is not available from GSI.
B. Impact potential Pathway Susceptibility (from Table A)
IMPACT POTENTIAL Extreme High Moderate Low
Present High Moderate Low Negligible
Pres
sure
m
agni
tude
*
Absent Negligible Negligible Negligible Negligible
* Pressure magnitude The pressures that are considered to pose a significant threat to groundwater are: urban and industrial areas, tillage, major roads and railways.
C. Risk category based on predictive risk assessment Proportion of assessment area with high and moderate impact potential
RISK CATEGORY
>50% 25-50% 15-25% 10-15% 5-10% <5% High sensitivity (all GW bodies)
1b 1b 1b 2a 2a 2b
Rec
epto
r Se
nsiti
vity
Moderate/Low sensitivity
n/a n/a n/a n/a n/a n/a
page 37 of 68

D. Risk category of groundwater body adjusted using available impact data Adjustments made using available groundwater impact data Predictive risk
category (from Table C)
Data criteria** Adjusted risk category
1b One or more groundwater sampling stations have EITHER: Any individual selected trace organic >0.05 µg/l in more than 25% of groundwater samples, OR Total trace organic >0.01 µg/l in more than 2 samples, OR Maximum trace organic >100 µg/l in any one sample.
1a or 1b, depending on level of confidence in the monitoring data
2a
One or more groundwater sampling stations have EITHER: Any individual selected trace organic >0.05µg/l in more than 25% of groundwater samples, OR Total trace organic >0.01µg/l in more than 2 samples, OR Maximum total trace organic >0.1 µg/l in any one sample.
1b
2b One or more groundwater sampling stations have EITHER: Any individual selected trace organic >0.05µg/l in more than 25% of groundwater samples, OR Total trace organic >0.01µg/l in more than 2 samples, OR Maximum total trace organic >0.1 µg/l in any one sample.
2a or 1b, depending on level of confidence in the monitoring data
** copied from SEPA approach.
page 38 of 68

20. Groundwater Risk Assessment SWRA5 Summary details on pressures, receptors and WFD objective RA Sheet SWRA5 Receptor type Groundwater Dependent Ecosystems in Rivers, Lakes & Estuaries Pressure type Clustered on-site systems & Leaking Urban Sewerage Systems* –
inorganics (N & P) WFD objective Chemical status Assessment area Surface extent of the groundwater body * Both pressures are assumed to produce similar pollutants. Nitrates and phosphate are the pollutants considered in this RA.
A. Pathway susceptibility Table A1
Flow Regime (Horizontal pathway) PATHWAY SUSCEPTIBILITY FOR NITRATES
Karst aquifers
Fissured aquifers
Intergranular aquifers
Poorly productive aquifers
Subs
oil Low permeability
subsoil L L L L
Extreme E E H M*
High H H H M*
Moderate M M M L*
Low L L L L*
Ver
tical
pat
hway
Vul
nera
bilit
y
High to Low H H H M*
*In poorly productive aquifers where denitrification is not considered likely to occur, these categories should be the same as the karst and fissured aquifers categories. Table A2
Flow Regime (Horizontal pathway) PATHWAY SUSCEPTIBILITY FOR PHOSPHATES
Karst aquifers
Fissured aquifers
Intergranular aquifers
Poorly productive aquifers
Subs
oil Low permeability
subsoil
L L L L
Extreme E E n/a * H High M M n/a * M Moderate M M M L Low L L L L V
ertic
al p
athw
ay
Vul
nera
bilit
y
High to Low** M M M M *Where sand/gravel aquifers are classed as ‘extremely’ vulnerable due to the presence of a shallow water table, the pathway susceptibility is considered to be moderate. **Where complete GSI vulnerability map is not available.
page 39 of 68

B. Impact Potential The presence of urban and discontinuous urban fabric from CORINE and/or built up areas from the Ordnance Survey maps make up the pressure layer on the groundwater body.
Nitrate Pathway Susceptibility (from Table A1) IMPACT POTENTIAL Extreme High Moderate Low
Present
High Moderate Low Negligible
Pres
sure
m
agni
tude
Absent
Negligible Negligible Negligible Negligible
Phosphate Pathway Susceptibility (from Table A2) IMPACT POTENTIAL Extreme High Moderate Low
Present
High Moderate Low Negligible
Pres
sure
m
agni
tude
Absent
Negligible Negligible Negligible Negligible
C. Risk category based on predictive risk assessment Proportion of assessment area with high and moderate impact potential
RISK CATEGORY
>40% 25-40% 15-25% 10-15% 5-10% <5% Phosphate
1b 1b 1b 2a 2a 2b
Pollu
tant
Nitrate
1b 2a 2a 2a 2b 2b
D. Risk category of groundwater body adjusted using available impact data Adjustments made using available impact data Predictive
risk category Data criteria Adjusted risk category 1b Where significant impacts are known to occur
by GSI, EPA, local authorities or RBD consultants
1a
2a Where significant impacts are known to occur by GSI, EPA, local authorities or RBD consultants
1b or 1a, depending on confidence in data and/or degree of impact.
page 40 of 68

21. Groundwater Risk Assessment SWRA6 Summary details on pressures, receptors and WFD objective RA Sheet SWRA6 Receptor type Groundwater dependent ecosystems in River, Lake and Estuary Water
Bodies Pressure type Mining – mobile inorganics WFD objective Chemical status Assessment area Surface extent of the groundwater body
A. Pathway susceptibility As mines are generally deep, this is not a factor in the RA process. The value of the groundwater resource is taken into account in considering the potential impacts.
B. Impact potential Impact Potential
High (based largely on expert judgement)*
High
Pres
sure
m
agni
tude
Low (based largely on expert judgement)
Low
*expert judgement provided by Grennan (1996), RPS-KMM and EPA.
C. Risk category based on predictive risk assessment Impact potential (from Table B) RISK CATEGORY
High Low High sensitivity* n/a n/a
Rec
epto
r Se
nsiti
vity
Moderate 1b 2a
*not applicable – see RA sheet GWDTERA4.
D. Risk category of groundwater body adjusted using available impact data Adjustments made using available impact data Predictive risk
category (from Table C)
Data criteria Adjusted risk category
1b Where significant impacts are known to occur by GSI, EMD, EPA, RBD consultants or local authorities
1a
2a
Where impacts are known to occur by GSI, EMD, EPA, RBD consultants or local authorities
1b or 1a, depending on confidence in data and/or degree of impact.
page 41 of 68

22. Groundwater Risk Assessment GWDTERA1 Summary details on pressures, receptors and WFD objective RA Sheet GWDTERA1 Receptor type Groundwater Dependent Terrestrial Ecosystems (incl. turloughs) Pressure type Abstraction WFD objective Quantitative status Assessment area Catchment area of ecosystem
A. Recharge Estimation a) Effective Rainfall Estimation
Obtained from recently produced Meteorological Service maps. b) Recharge Coefficient
The Recharge coefficient is the proportion of Effective Rainfall that may become Recharge. It should be determined by using Table 1 (below).
c) Applying a Recharge Cap on Poorly productive Aquifers
A recharge cap is applied to poorly productive aquifers, as they are not capable of accepting the available recharge due to their low transmissivity.
The recharge cap for Locally Important aquifers, which are moderately productive only in local zones (Ll) is 200mm/yr, whereas the cap for Poor Aquifers (Pl & Pu) is 100mm/yr.
B. Catchment Area of GWDTE The RA applies to the area contributing water to the GWDTE. Therefore, the catchment area of the GWDTE must be delineated, even if only approximately. The boundaries must be based on the conceptual understanding of the area and on hydrogeological boundaries to flow. For instance, the surface water catchment may be used where it equates closely to the catchment area. Alternatively, groundwater flow lines (estimated, in most instances) may be used.
C. Impact potential The impact of abstraction may result from general abstraction in the catchment area and/or from wells in the immediate vicinity of the boundary of the GWDTE. Impacts can also be caused by drainage; only arterial drainage is considered in this assessment. C1. Potential impact resulting from abstraction in GWDTE catchment area Use Table below.
GWDTE Sensitivity to Abstraction IMPACT POTENTIAL High Moderate to Low
>20% High High
10 to 20% High Moderate
5 to 10% High Low
GW
AB
S as
a %
of
aver
age
rech
arge
in
‘cat
chm
ent’
of
GW
TDE
<5% Moderate Low
page 42 of 68

C2. Local abstraction & arterial drainage Use Table below.
GWDTE Sensitivity to Abstraction IMPACT POTENTIAL
High Moderate to Low
>10 m3/d Within GWDTE High Moderate/low Within GWDTE High High >100 m3/d
Within 100 m of boundary
High Moderate/low
Within GWDTE High High Within 100 m of boundary
High High >500 m3/d.
Within 500 m of boundary
High Moderate/low
Loca
l abs
tract
ions
& a
rteria
l dra
inag
e
Arterial drainage Within 100 m of boundary
High High
D. Risk category based on predictive risk assessment and available impact data Potential Impact Evidence for GW level
decline No/ insufficient evidence for GW level decline
Evidence of no GW decline
High At Significant Risk (1a) Probably at risk (1b) Not at significant risk (low confidence) (2a) to Not at significant risk (2b) based on confidence in the data
Moderate At Significant Risk (1a) Not at significant risk (low confidence) (2a)
Not at significant risk (2b)
Low At Significant Risk (1a) to Probably at risk (1b) based on confidence in the data
Not at significant risk (low confidence) (2a)
Not at significant risk (2b)
page 43 of 68
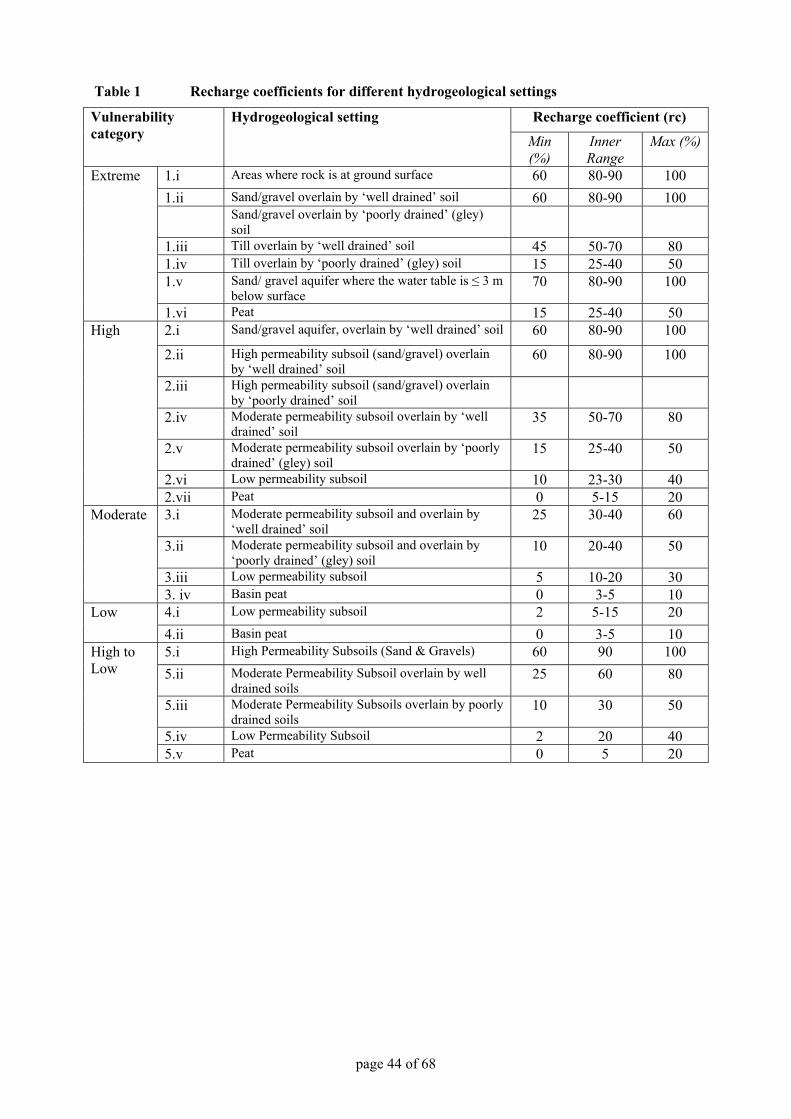
Table 1 Recharge coefficients for different hydrogeological settings
Recharge coefficient (rc) Vulnerability category
Hydrogeological setting
Min (%)
Inner Range
Max (%)
1.i Areas where rock is at ground surface 60 80-90 100 1.ii Sand/gravel overlain by ‘well drained’ soil 60 80-90 100 Sand/gravel overlain by ‘poorly drained’ (gley)
soil
1.iii Till overlain by ‘well drained’ soil 45 50-70 80 1.iv Till overlain by ‘poorly drained’ (gley) soil 15 25-40 50 1.v Sand/ gravel aquifer where the water table is ≤ 3 m
below surface 70 80-90 100
Extreme
1.vi Peat 15 25-40 50 2.i Sand/gravel aquifer, overlain by ‘well drained’ soil 60 80-90 100
2.ii High permeability subsoil (sand/gravel) overlain by ‘well drained’ soil
60 80-90 100
2.iii High permeability subsoil (sand/gravel) overlain by ‘poorly drained’ soil
2.iv Moderate permeability subsoil overlain by ‘well drained’ soil
35 50-70 80
2.v Moderate permeability subsoil overlain by ‘poorly drained’ (gley) soil
15 25-40 50
2.vi Low permeability subsoil 10 23-30 40
High
2.vii Peat 0 5-15 20 3.i Moderate permeability subsoil and overlain by
‘well drained’ soil 25 30-40 60
3.ii Moderate permeability subsoil and overlain by ‘poorly drained’ (gley) soil
10 20-40 50
3.iii Low permeability subsoil 5 10-20 30
Moderate
3. iv Basin peat 0 3-5 10 4.i Low permeability subsoil 2 5-15 20 Low 4.ii Basin peat 0 3-5 10 5.i High Permeability Subsoils (Sand & Gravels) 60 90 100 5.ii Moderate Permeability Subsoil overlain by well
drained soils 25 60 80
5.iii Moderate Permeability Subsoils overlain by poorly drained soils
10 30 50
5.iv Low Permeability Subsoil 2 20 40
High to Low
5.v Peat 0 5 20
page 44 of 68
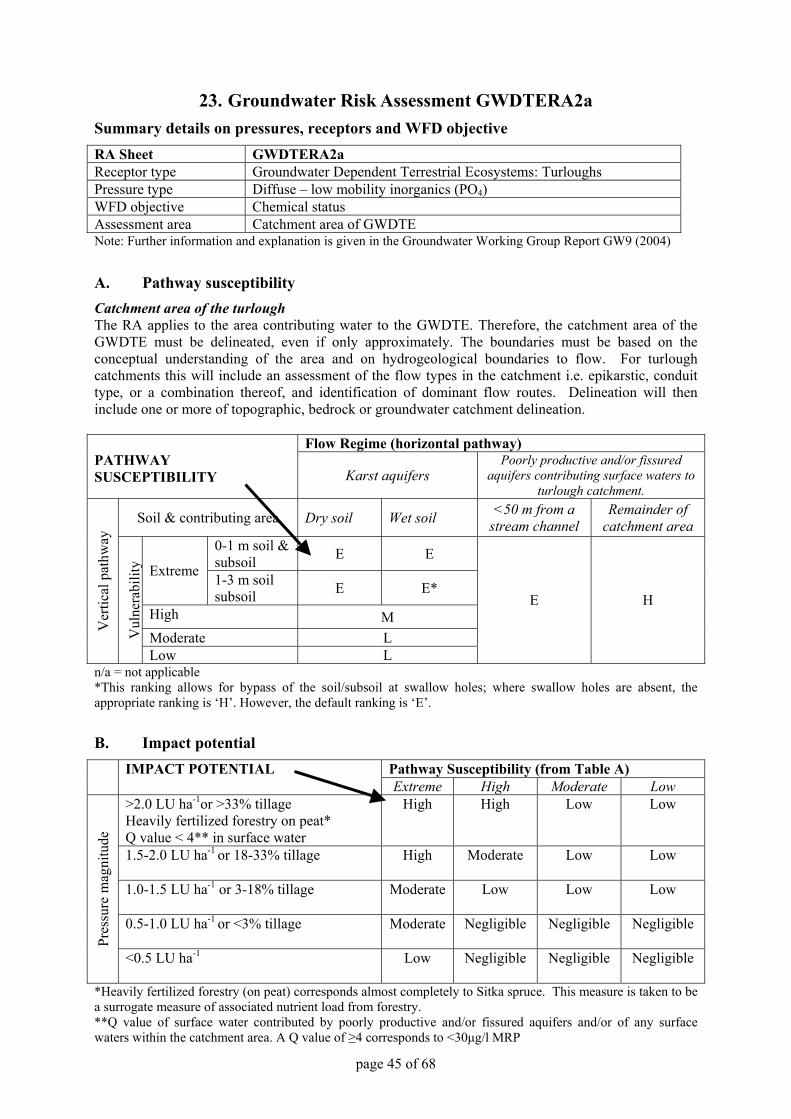
23. Groundwater Risk Assessment GWDTERA2a Summary details on pressures, receptors and WFD objective RA Sheet GWDTERA2a Receptor type Groundwater Dependent Terrestrial Ecosystems: Turloughs Pressure type Diffuse – low mobility inorganics (PO4) WFD objective Chemical status Assessment area Catchment area of GWDTE Note: Further information and explanation is given in the Groundwater Working Group Report GW9 (2004)
A. Pathway susceptibility Catchment area of the turlough The RA applies to the area contributing water to the GWDTE. Therefore, the catchment area of the GWDTE must be delineated, even if only approximately. The boundaries must be based on the conceptual understanding of the area and on hydrogeological boundaries to flow. For turlough catchments this will include an assessment of the flow types in the catchment i.e. epikarstic, conduit type, or a combination thereof, and identification of dominant flow routes. Delineation will then include one or more of topographic, bedrock or groundwater catchment delineation.
Flow Regime (horizontal pathway) PATHWAY SUSCEPTIBILITY Karst aquifers
Poorly productive and/or fissured aquifers contributing surface waters to
turlough catchment.
Soil & contributing area Dry soil Wet soil <50 m from a stream channel
Remainder of catchment area
0-1 m soil & subsoil E E
Extreme 1-3 m soil subsoil E E*
High M Moderate L
Ver
tical
pat
hway
Vul
nera
bilit
y
Low L
E H
n/a = not applicable *This ranking allows for bypass of the soil/subsoil at swallow holes; where swallow holes are absent, the appropriate ranking is ‘H’. However, the default ranking is ‘E’.
B. Impact potential Pathway Susceptibility (from Table A)
IMPACT POTENTIAL
Extreme High Moderate Low >2.0 LU ha-1or >33% tillage Heavily fertilized forestry on peat* Q value < 4** in surface water
High High Low Low
1.5-2.0 LU ha-1 or 18-33% tillage
High Moderate Low Low
1.0-1.5 LU ha-1 or 3-18% tillage
Moderate Low Low Low
0.5-1.0 LU ha-1 or <3% tillage
Moderate Negligible Negligible Negligible
Pres
sure
mag
nitu
de
<0.5 LU ha-1
Low Negligible Negligible Negligible
*Heavily fertilized forestry (on peat) corresponds almost completely to Sitka spruce. This measure is taken to be a surrogate measure of associated nutrient load from forestry. **Q value of surface water contributed by poorly productive and/or fissured aquifers and/or of any surface waters within the catchment area. A Q value of ≥4 corresponds to <30µg/l MRP
page 45 of 68

C. Risk category based on predictive risk assessment Proportion of turlough catchment with high and moderate impact potential
RISK CATEGORY
>40% 25-40% 15-25% 10-15% 5-10% <5% Extreme sensitivity* 1b 1b 1b 2a 2a 2b
High sensitivity 1b 1b 2a 2a 2b 2b
Rec
epto
r Sen
sitiv
ity
Moderate sensitivity 1b 2a 2a 2b 2b 2b
*Extreme, high and moderate receptor sensitivity classes were defined by NPWS using turlough vegetation data.
D. Risk category of turlough catchment adjusted using available impact data Adjustments for turlough catchment
Turlough data Criteria* Groundwater data criteria*** Predictive Risk Category
High/moderate sensitivity
receptors**
Extremely sensitive receptors
Adjusted Risk
Category
High/moderate sensitivity
receptors**
Extremely sensitive receptors
Adjusted Risk
Category
1b Total P > 30 µg l-1
1a MRP >30 µg l-1
1a
2a Total P 20-30 µg l-1
Total P >10 µg l-1
1b MRP 20-30 µg l-1
MRP >10 µg l-1
1b
Total P 10-20 µg l-1
2a or 1b depending on confidence in
the monitoring
data
MRP 10-20 µg l-1
2a or 1b depending on confidence in
the monitoring
data
2b
Total P <10 µg l-1
Total P <10 µg l-1
2b MRP <10µg l-1
MRP <10 µg l-1
2b
* Mean TP of turlough water, based on a mean of monthly sampling during the flood period, but excluding the extreme beginning and end of the flood period. Thresholds are based on the Phosphorus Regulations’ standards for total phosphorus (TP) in lakes, which indicate that when mean TP ≤10 µg l-1 the lake is oligotrophic and >10 to ≤20 µg l-1 mesotrophic. (Reference: McGarrigle et al. (2002) Appendix I). ** Sensitivity of receptor (turlough) is that defined by NPWS from turlough vegetation studies. *** Groundwater data is expressed as median unfiltered Molybdate Reactive Phosphorus (MRP). As many turloughs are conduit fed it is assumed that there will be very little attenuation in phosphorus concentrations in groundwater discharges to the turlough. For this reason it was considered more appropriate to use lake rather than river phosphorus regulation standards. See note (*) above.
E. Additional Impact data In addition to the type of phosphorus data described in Table D above, a number of turloughs have been assessed by the Ecological sub-group of the Turloughs Working Group, and the degree to which they are impacted has been described qualitatively. These data may be used to adjust the risk category of the turlough catchment, with the proviso that the data apply only to the immediate turlough basin and not the catchment, and that the data may not be consistent, as they reflect the focus of the visiting ecologist.
page 46 of 68

F. Expert Review Recommendations Expert review of the outcome of this risk assessment is recommended by EPA staff with field experience of the catchment area of the GWDTE and knowledge of surface water impacts. Final expert review is recommended by National Parks and Wildlife Service staff who may recommend upgrading of the risk category based on available impact data and local knowledge of the SAC/SPA involved.
page 47 of 68

24. Groundwater Risk Assessment GWDTERA2b Summary details on pressures, receptors and WFD objective RA Sheet GWDTERA2b Receptor type Groundwater Dependent Terrestrial Ecosystems (excluding turloughs) Pressure type Diffuse – low mobility inorganics (PO4) WFD objective Chemical status Assessment area Catchment area of GWDTE Note: Further information and explanation is given in the Groundwater Working Group Report GW11 (2004)
A. Pathway susceptibility Catchment area of the GWDTE The RA applies to the area contributing water to the GWDTE. Therefore, the catchment area of the GWDTE must be delineated, even if only approximately. The boundaries must be based on the conceptual understanding of the area and on hydrogeological boundaries to flow.
Table A1 Flow Regime (horizontal pathway)
PATHWAY SUSCEPTIBILITY Karst aquifers Fissured aquifers Intergranula
r aquifers Poorly productive
aquifers
Soil & karst features Dry soil
Wet soil
Dry soil
Wet soil n/a Dry
soil Wet soil
0-1 m soil & subsoil
E E E H n/a ** H M Extreme
1-3 m soil & subsoil
E E* H M n/a M L
High M M M L Moderate L L L L Low L L L L
Ver
tical
pat
hway
Vul
nera
bilit
y
High to low*** M M M L n/a = not applicable * This ranking allows for bypass of the soil/subsoil at swallow holes; where swallow holes are absent, the appropriate ranking is ‘H’. However, the default ranking is ‘E’. ** Where sand/gravel aquifers are classed as ‘extremely’ vulnerable due to the presence of a shallow water table, the pathway susceptibility is considered to be moderate. *** For areas where complete vulnerability map is not available from GSI.
B. Impact potential Pathway Susceptibility (from Table A) IMPACT POTENTIAL*
Extreme High Moderate Low >2.0 LU ha-1
or >33% tillage High High Low Low
1.5-2.0 LU ha-1 or 18-33% tillage
High Moderate Low Low
1.0-1.5 LU ha-1 or 3-18% tillage
Moderate Low Low Low
0.5-1.0 LU ha-1 or <3% tillage
Moderate Negligible Negligible Negligible
Pres
sure
mag
nitu
de
<0.5 LU ha-1 Low Negligible Negligible Negligible *Deriving Impact Potential Individual Impact Potential maps are derived for the three types of pressures: cattle/sheep, pigs/poultry and tillage i.e. each grid cell within the maps will have three Impact Potential categories. The highest Impact Potential category is taken for each cell, regardless of the type of pressure. Within each GWB, the total area of ‘H’ plus ‘M’ Impact Potential is used to determine whether the GWB is ‘at risk’ (see C below).
page 48 of 68
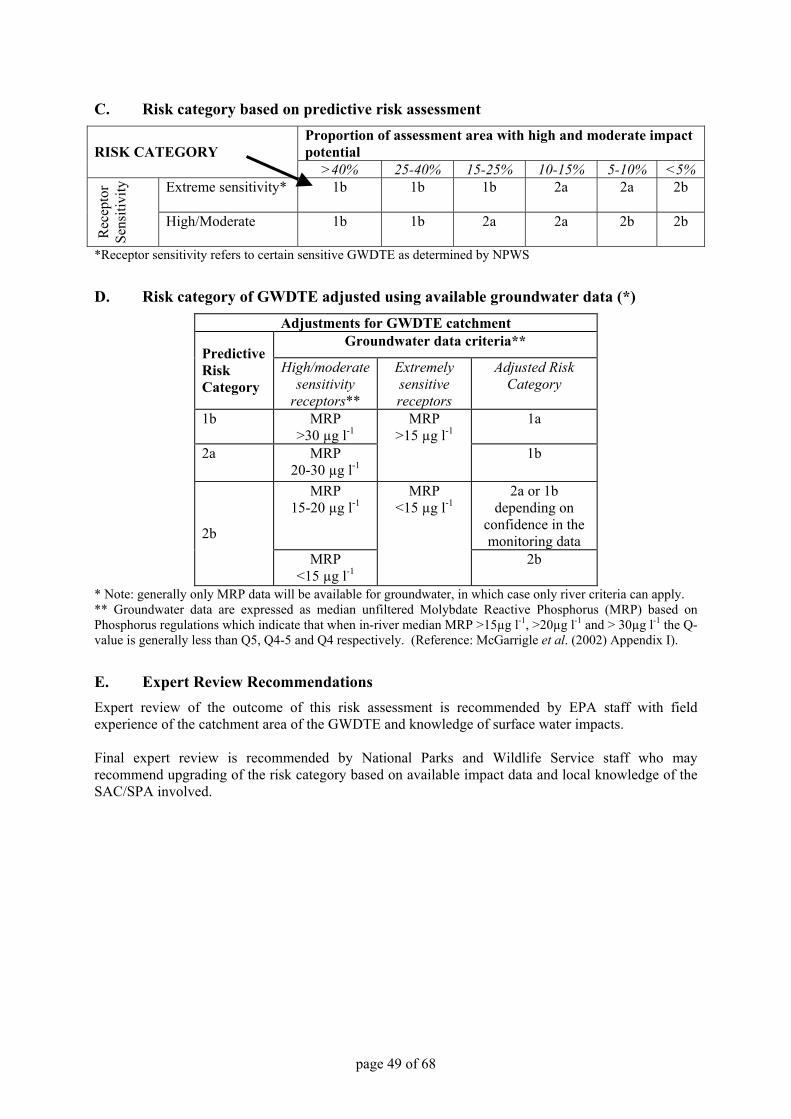
C. Risk category based on predictive risk assessment Proportion of assessment area with high and moderate impact potential
RISK CATEGORY
>40% 25-40% 15-25% 10-15% 5-10% <5% Extreme sensitivity*
1b 1b 1b 2a 2a 2b
Rec
epto
r Se
nsiti
vity
High/Moderate
1b 1b 2a 2a 2b 2b
*Receptor sensitivity refers to certain sensitive GWDTE as determined by NPWS
D. Risk category of GWDTE adjusted using available groundwater data (*) Adjustments for GWDTE catchment
Groundwater data criteria** Predictive Risk Category
High/moderate sensitivity
receptors**
Extremely sensitive receptors
Adjusted Risk Category
1b MRP >30 µg l-1
1a
2a MRP 20-30 µg l-1
MRP >15 µg l-1
1b
MRP 15-20 µg l-1
2a or 1b depending on
confidence in the monitoring data 2b
MRP <15 µg l-1
MRP <15 µg l-1
2b
* Note: generally only MRP data will be available for groundwater, in which case only river criteria can apply. ** Groundwater data are expressed as median unfiltered Molybdate Reactive Phosphorus (MRP) based on Phosphorus regulations which indicate that when in-river median MRP >15µg l-1, >20µg l-1 and > 30µg l-1 the Q-value is generally less than Q5, Q4-5 and Q4 respectively. (Reference: McGarrigle et al. (2002) Appendix I).
E. Expert Review Recommendations Expert review of the outcome of this risk assessment is recommended by EPA staff with field experience of the catchment area of the GWDTE and knowledge of surface water impacts. Final expert review is recommended by National Parks and Wildlife Service staff who may recommend upgrading of the risk category based on available impact data and local knowledge of the SAC/SPA involved.
page 49 of 68
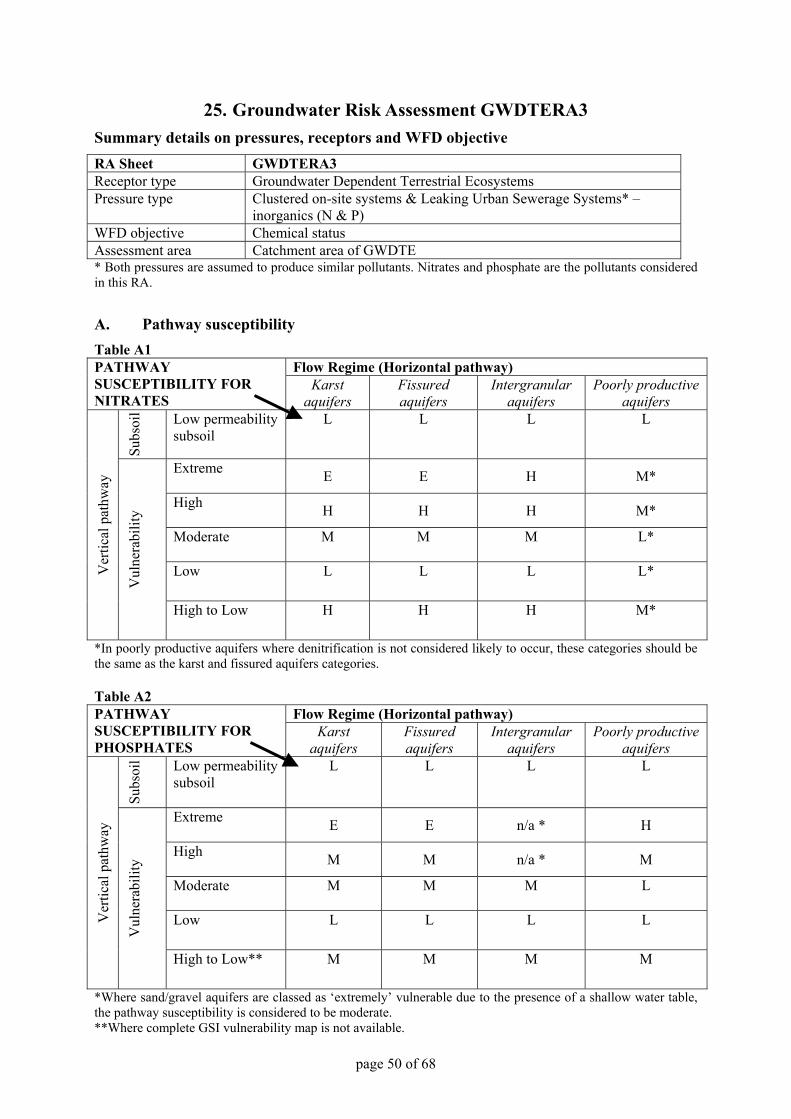
25. Groundwater Risk Assessment GWDTERA3 Summary details on pressures, receptors and WFD objective RA Sheet GWDTERA3 Receptor type Groundwater Dependent Terrestrial Ecosystems Pressure type Clustered on-site systems & Leaking Urban Sewerage Systems* –
inorganics (N & P) WFD objective Chemical status Assessment area Catchment area of GWDTE * Both pressures are assumed to produce similar pollutants. Nitrates and phosphate are the pollutants considered in this RA.
A. Pathway susceptibility Table A1
Flow Regime (Horizontal pathway) PATHWAY SUSCEPTIBILITY FOR NITRATES
Karst aquifers
Fissured aquifers
Intergranular aquifers
Poorly productive aquifers
Subs
oil Low permeability
subsoil L L L L
Extreme E E H M*
High H H H M*
Moderate
M M M L*
Low L L L L* Ver
tical
pat
hway
Vul
nera
bilit
y
High to Low H H H M*
*In poorly productive aquifers where denitrification is not considered likely to occur, these categories should be the same as the karst and fissured aquifers categories. Table A2
Flow Regime (Horizontal pathway) PATHWAY SUSCEPTIBILITY FOR PHOSPHATES
Karst aquifers
Fissured aquifers
Intergranular aquifers
Poorly productive aquifers
Subs
oil Low permeability
subsoil
L L L L
Extreme E E n/a * H
High M M n/a * M
Moderate
M M M L
Low L L L L Ver
tical
pat
hway
Vul
nera
bilit
y
High to Low** M M M M
*Where sand/gravel aquifers are classed as ‘extremely’ vulnerable due to the presence of a shallow water table, the pathway susceptibility is considered to be moderate. **Where complete GSI vulnerability map is not available.
page 50 of 68
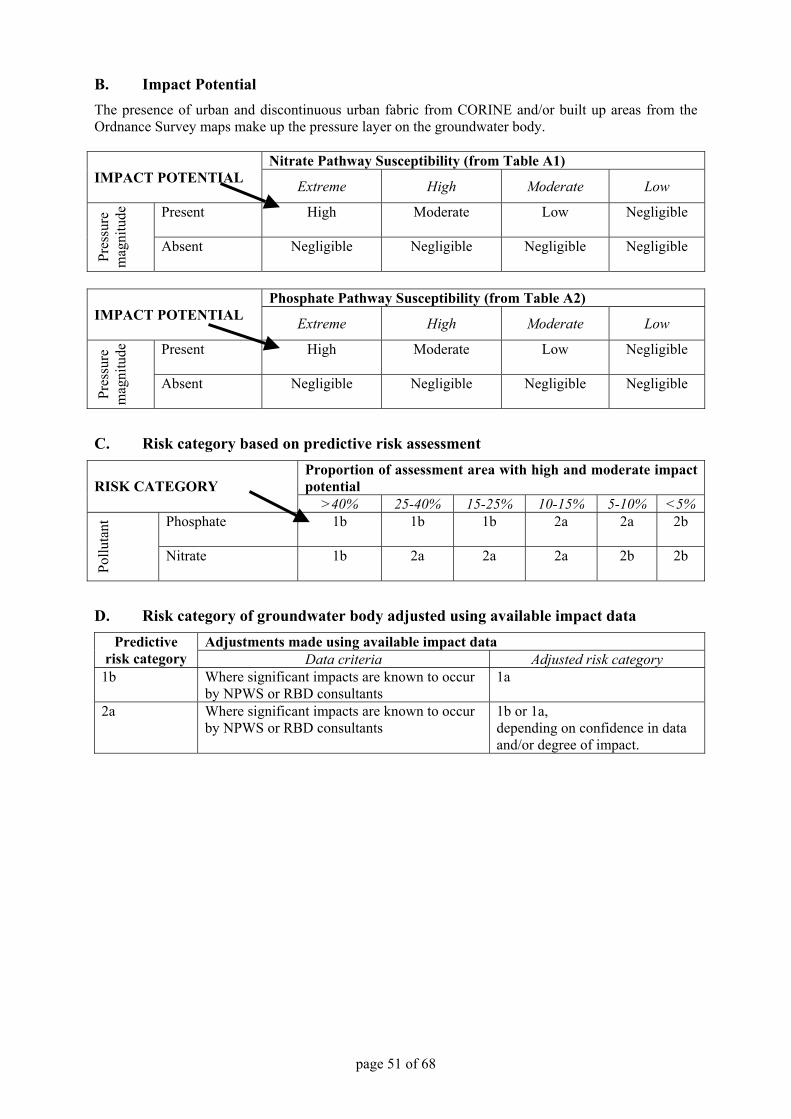
B. Impact Potential The presence of urban and discontinuous urban fabric from CORINE and/or built up areas from the Ordnance Survey maps make up the pressure layer on the groundwater body.
Nitrate Pathway Susceptibility (from Table A1) IMPACT POTENTIAL Extreme High Moderate Low
Present
High Moderate Low Negligible
Pres
sure
m
agni
tude
Absent
Negligible Negligible Negligible Negligible
Phosphate Pathway Susceptibility (from Table A2)
IMPACT POTENTIAL Extreme High Moderate Low
Present
High Moderate Low Negligible
Pres
sure
m
agni
tude
Absent
Negligible Negligible Negligible Negligible
C. Risk category based on predictive risk assessment Proportion of assessment area with high and moderate impact potential
RISK CATEGORY
>40% 25-40% 15-25% 10-15% 5-10% <5% Phosphate
1b 1b 1b 2a 2a 2b
Pollu
tant
Nitrate
1b 2a 2a 2a 2b 2b
D. Risk category of groundwater body adjusted using available impact data Adjustments made using available impact data Predictive
risk category Data criteria Adjusted risk category 1b Where significant impacts are known to occur
by NPWS or RBD consultants 1a
2a Where significant impacts are known to occur by NPWS or RBD consultants
1b or 1a, depending on confidence in data and/or degree of impact.
page 51 of 68

26. Ground Water Risk Assessment GWDTERA4 Summary details on pressures, receptors and WFD objective RA Sheet GWDTERA4 Receptor type Groundwater Dependent Terrestrial Ecosystems Pressure type Mining WFD objective Chemical status Assessment area Catchment area of GWDTE This risk assessment process is based largely on expert judgement. The matrices below are intended to assist the process; however, expert judgement and, where available, impact data can override the conclusions in the matrices.
A. Pathway susceptibility The pathway susceptibility is assumed to depend on:
Groundwater flow regime, as indicated by aquifer type. Length of pathway or distance from boundary of GWDTE. A maximum distance of 3km is
likely to be sufficient for this risk assessment process. Table A
Flow Regime PATHWAY SUSCEPTIBILITY Karst
aquifers Fissured aquifers
Intergranular aquifers
Poorly productive aquifers
<100 m E E H H 100-1000 m H H M M 1000-3000 m M M M L
Distance from GWDTE boundary
>3000 m L L L L
B. Impact potential Pathway Susceptibility (from Table A)
IMPACT POTENTIAL
Extreme High Moderate Low Present within 3000 m
High High High Low
Pres
sure
m
agni
tude
*
Absent
None None None None
* Based on expert judgement of NPWS, GSI, EPA and RBD consultants.
page 52 of 68

C. Risk category based on predictive and impact risk assessments Assessments made on the basis of predictions from pressure-susceptibility analysis
Adjustments to risk assessment category based on available impact data
Impact potential (from Table B)
Risk category for whole groundwater
body
Data type Adjusted risk assessment category
High 1b NPWS or RBD consultants identify known impact with a high level of certainty
1a
Low 2a NPWS or RBD consultants identify impact with a low level of certainty
1b
None 2b
page 53 of 68

27. Ground Water Risk Assessment GWDTERA5 Summary details on pressures, receptors and WFD objective RA Sheet GWDTERA5 Receptor type Groundwater Dependent Terrestrial Ecosystems Pressure type Quarries WFD objective Chemical status Assessment area Catchment area of GWDTE This risk assessment process is based largely on expert judgement. The matrices below are intended to assist the process; however, expert judgement and, where available, impact data can override the conclusions in the matrices.
A. Pathway susceptibility The pathway susceptibility is assumed to depend on:
Groundwater flow regime, as indicated by aquifer type. Length of pathway or distance from boundary of GWDTE. A maximum distance of 3km is
likely to be sufficient for this risk assessment process. Table A
Flow Regime PATHWAY SUSCEPTIBILITY Karst
aquifers Fissured aquifers
Intergranular aquifers
Poorly productive aquifers
<100 m E E H H 100-1000 m H H M M 1000-3000 m M M M L
Distance from GWDTE boundary
>3000 m L L L L
B. Impact potential Pathway Susceptibility (from Table A)
IMPACT POTENTIAL Extreme High Moderate Low
Present within 3000 m
High High High Low
Pres
sure
m
agni
tude
*
Absent
None None None None
* Based on expert judgement of NPWS, GSI, EPA and RBD consultants.
page 54 of 68

C. Risk category based on predictive and impact risk assessments Assessments made on the basis of predictions from pressure-susceptibility analysis
Adjustments to risk assessment category based on available impact data
Impact potential (from Table B)
Risk category for whole groundwater
body
Data type Adjusted risk assessment category
High 1b NPWS or RBD consultants identify known impact with a high level of certainty
1a
Low 2a NPWS or RBD consultants identify impact with a low level of certainty
1b
None 2b
page 55 of 68
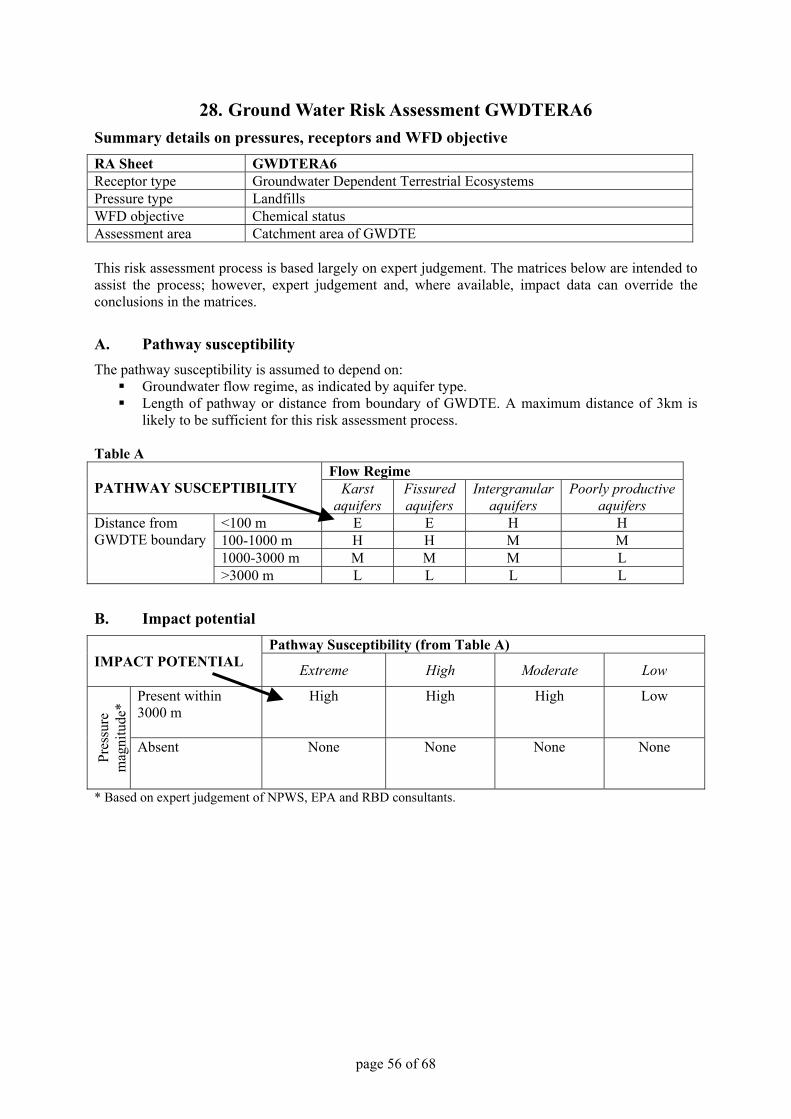
28. Ground Water Risk Assessment GWDTERA6 Summary details on pressures, receptors and WFD objective RA Sheet GWDTERA6 Receptor type Groundwater Dependent Terrestrial Ecosystems Pressure type Landfills WFD objective Chemical status Assessment area Catchment area of GWDTE This risk assessment process is based largely on expert judgement. The matrices below are intended to assist the process; however, expert judgement and, where available, impact data can override the conclusions in the matrices.
A. Pathway susceptibility The pathway susceptibility is assumed to depend on:
Groundwater flow regime, as indicated by aquifer type. Length of pathway or distance from boundary of GWDTE. A maximum distance of 3km is
likely to be sufficient for this risk assessment process. Table A
Flow Regime PATHWAY SUSCEPTIBILITY Karst
aquifers Fissured aquifers
Intergranular aquifers
Poorly productive aquifers
<100 m E E H H 100-1000 m H H M M 1000-3000 m M M M L
Distance from GWDTE boundary
>3000 m L L L L
B. Impact potential Pathway Susceptibility (from Table A)
IMPACT POTENTIAL Extreme High Moderate Low
Present within 3000 m
High High High Low
Pres
sure
m
agni
tude
*
Absent
None None None None
* Based on expert judgement of NPWS, EPA and RBD consultants.
page 56 of 68
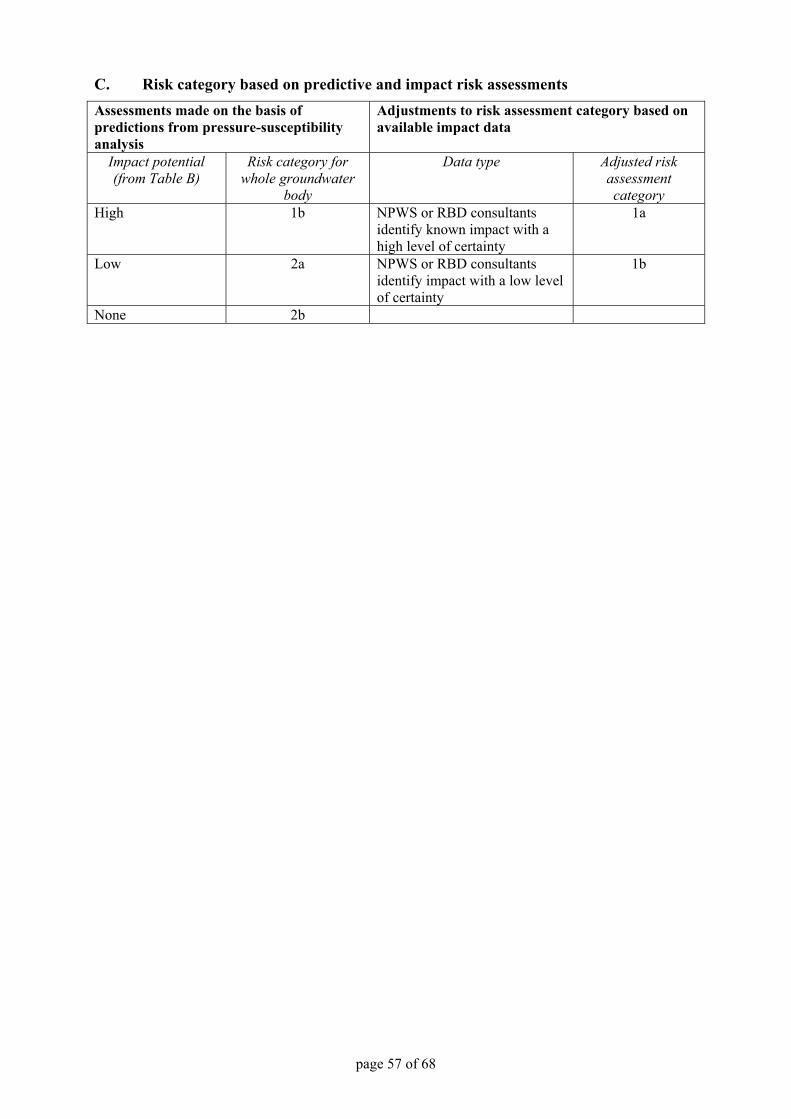
C. Risk category based on predictive and impact risk assessments Assessments made on the basis of predictions from pressure-susceptibility analysis
Adjustments to risk assessment category based on available impact data
Impact potential (from Table B)
Risk category for whole groundwater
body
Data type Adjusted risk assessment category
High 1b NPWS or RBD consultants identify known impact with a high level of certainty
1a
Low 2a NPWS or RBD consultants identify impact with a low level of certainty
1b
None 2b
page 57 of 68

29. Ground Water Risk Assessment GWDTERA7 Summary details on pressures, receptors and WFD objective RA Sheet GWDTERA7 Receptor type Groundwater Dependent Terrestrial Ecosystems Pressure type Oil industry infrastructure WFD objective Chemical status Assessment area Catchment area of GWDTE This risk assessment process is based largely on expert judgement. The matrices below are intended to assist the process; however, expert judgement and, where available, impact data can override the conclusions in the matrices.
A. Pathway susceptibility The pathway susceptibility is assumed to depend on:
Groundwater flow regime, as indicated by aquifer type. Length of pathway or distance from boundary of GWDTE. A maximum distance of 3km is
likely to be sufficient for this risk assessment process. Table A
Flow Regime PATHWAY SUSCEPTIBILITY Karst
aquifers Fissured aquifers
Intergranular aquifers
Poorly productive aquifers
<100 m E E H H 100-1000 m H H M M 1000-3000 m M M M L
Distance from GWDTE boundary
>3000 m L L L L
B. Impact potential Pathway Susceptibility (from Table A)
IMPACT POTENTIAL Extreme High Moderate Low
Present within 3000 m
High High High Low
Pres
sure
m
agni
tude
*
Absent
None None None None
* Based on expert judgement of NPWS, EPA and RBD consultants.
page 58 of 68

C. Risk category based on predictive and impact risk assessments Assessments made on the basis of predictions from pressure-susceptibility analysis
Adjustments to risk assessment category based on available impact data
Impact potential (from Table B)
Risk category for whole groundwater
body
Data type Adjusted risk assessment category
High 1b NPWS or RBD consultants identify known impact with a high level of certainty
1a
Low 2a NPWS or RBD consultants identify impact with a low level of certainty
1b
None 2b
page 59 of 68

30. Ground Water Risk Assessment GWDTERA8 Summary details on pressures, receptors and WFD objective RA Sheet GWDTERA8 Receptor type Groundwater Dependent Terrestrial Ecosystems Pressure type Contaminated land WFD objective Chemical status Assessment area Catchment area of GWDTE This risk assessment process is based largely on expert judgement. The matrices below are intended to assist the process; however, expert judgement and, where available, impact data can override the conclusions in the matrices.
A. Pathway susceptibility The pathway susceptibility is assumed to depend on:
Groundwater flow regime, as indicated by aquifer type. Length of pathway or distance from boundary of GWDTE. A maximum distance of 3km is
likely to be sufficient for this risk assessment process. Table A
Flow Regime PATHWAY SUSCEPTIBILITY Karst
aquifers Fissured aquifers
Intergranular aquifers
Poorly productive aquifers
<100 m E E H H 100-1000 m H H M M 1000-3000 m M M M L
Distance from GWDTE boundary
>3000 m L L L L
B. Impact potential Pathway Susceptibility (from Table A)
IMPACT POTENTIAL Extreme High Moderate Low
Present within 3000 m
High High High Low
Pres
sure
m
agni
tude
*
Absent
None None None None
* Based on expert judgement of NPWS, EPA and RBD consultants.
page 60 of 68

C. Risk category based on predictive and impact risk assessments Assessments made on the basis of predictions from pressure-susceptibility analysis
Adjustments to risk assessment category based on available impact data
Impact potential (from Table B)
Risk category for whole groundwater
body
Data type Adjusted risk assessment category
High 1b NPWS or RBD consultants identify known impact with a high level of certainty
1a
Low 2a NPWS or RBD consultants identify impact with a low level of certainty
1b
None 2b
page 61 of 68

31. Ground Water Risk Assessment GWDTERA9 Summary details on pressures, receptors and WFD objective RA Sheet GWDTERA9 Receptor type Groundwater Dependent Terrestrial Ecosystems Pressure type Urban Wastewater Discharges WFD objective Chemical status Assessment area Catchment area of GWDTE This risk assessment process is based largely on expert judgement. The matrices below are intended to assist the process; however, expert judgement and, where available, impact data can override the conclusions in the matrices.
A. Pathway susceptibility The pathway susceptibility is assumed to depend on:
Groundwater flow regime, as indicated by aquifer type. Length of pathway or distance from boundary of GWDTE. A maximum distance of 3km is
likely to be sufficient for this risk assessment process. Table A
Flow Regime PATHWAY SUSCEPTIBILITY Karst
aquifers Fissured aquifers
Intergranular aquifers
Poorly productive aquifers
<100 m E E H H 100-1000 m H H M M 1000-3000 m M M M L
Distance from GWDTE boundary
>3000 m L L L L
B. Impact potential Pathway Susceptibility (from Table A)
IMPACT POTENTIAL Extreme High Moderate Low
Present within 3000 m
High High High Low
Pres
sure
m
agni
tude
*
Absent
None None None None
* Based on expert judgement of NPWS, EPA and RBD consultants.
page 62 of 68

C. Risk category based on predictive and impact risk assessments Assessments made on the basis of predictions from pressure-susceptibility analysis
Adjustments to risk assessment category based on available impact data
Impact potential (from Table B)
Risk category for whole groundwater
body
Data type Adjusted risk assessment category
High 1b NPWS or RBD consultants identify known impact with a high level of certainty
1a
Low 2a NPWS or RBD consultants identify impact with a low level of certainty
1b
None 2b
page 63 of 68

32. Groundwater Risk Assessment DWPARA1 Summary details on pressures, receptors and WFD objective RA Sheet DWPARA1 Receptor type Groundwater drinking water supply Pressure type Diffuse – mobile inorganics (NO3) WFD objective Drinking Water Protected Area Assessment area Surface extent of the groundwater body
A. Pathway susceptibility Flow Regime (Horizontal pathway)
PATHWAY SUSCEPTIBILITY
Karst aquifers
Fissured aquifers
Intergranular aquifers
Poorly productive aquifers
‘Wet’ soil L L L L
Soil
& su
bsoi
l
Low permeability subsoil
L L L L
Extreme E E H M*
High H H H M*
Moderate M M M L*
Low L L L L
Ver
tical
pat
hway
Vul
nera
bilit
y
High to Low** H H H M
*In poorly productive aquifers where denitrification is not considered likely to occur, these categories should be the same as the karst and fissured aquifers categories. **For areas where complete vulnerability map is not available from GSI.
B. Impact potential Pathway Susceptibility (from Table A)
IMPACT POTENTIAL* Extreme High Moderate Low
>2.0 LU ha-1
or >33% tillage High High Moderate Low
1.5-2.0 LU ha-1 or 18-33% tillage
Moderate Moderate Low Low
1.0-1.5 LU ha-1 or 3-18% tillage
Low Low Low Low
Pres
sure
mag
nitu
de
<1.0 LU ha-1 or <3% tillage
Negligible Negligible Negligible Negligible
*Deriving Impact Potential Individual Impact Potential maps are derived for the three types of pressures: cattle/sheep, pigs/poultry and tillage i.e. each grid cell within the maps will have three Impact Potential categories. The highest Impact Potential category is taken for each cell, regardless of the type of pressure. Within each GWB, the total area of ‘H’ plus ‘M’ Impact Potential is used to determine whether the GWB is ‘at risk’ (see C below).
page 64 of 68
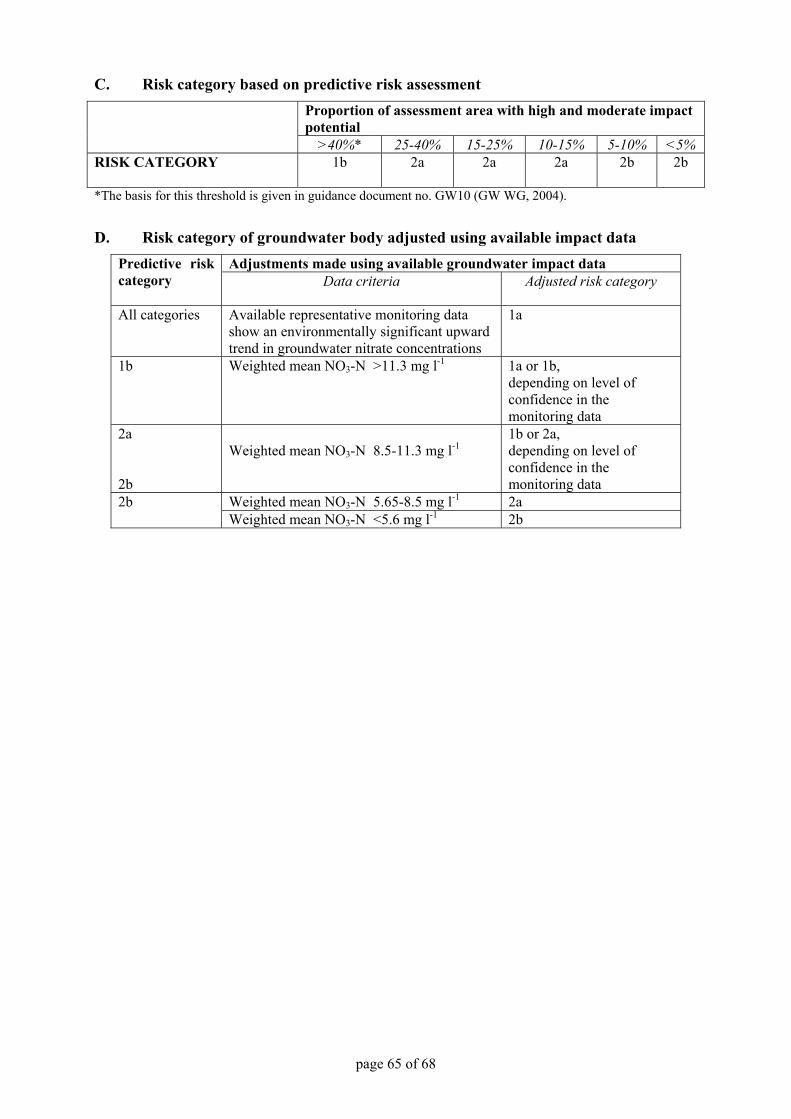
C. Risk category based on predictive risk assessment Proportion of assessment area with high and moderate impact potential
>40%* 25-40% 15-25% 10-15% 5-10% <5% RISK CATEGORY
1b 2a 2a 2a 2b 2b
*The basis for this threshold is given in guidance document no. GW10 (GW WG, 2004).
D. Risk category of groundwater body adjusted using available impact data Adjustments made using available groundwater impact data Predictive risk
category
Data criteria Adjusted risk category
All categories Available representative monitoring data show an environmentally significant upward trend in groundwater nitrate concentrations
1a
1b Weighted mean NO3-N >11.3 mg l-1 1a or 1b, depending on level of confidence in the monitoring data
2a 2b
Weighted mean NO3-N 8.5-11.3 mg l-1
1b or 2a, depending on level of confidence in the monitoring data
Weighted mean NO3-N 5.65-8.5 mg l-1 2a 2b Weighted mean NO3-N <5.6 mg l-1 2b
page 65 of 68

33. Groundwater Risk Assessment DWPARA2 Summary details on pressures, receptors and WFD objective RA Sheet DWPARA2 Receptor type Groundwater drinking water supply Pressure type Diffuse – mobile organics (pesticides and PAHs) WFD objective Drinking Water Protected Area Assessment area Surface extent of the groundwater body
A. Pathway susceptibility Flow Regime (Horizontal pathway)
PATHWAY SUSCEPTIBILITY
Karst aquifers
Fissured aquifers
Intergranular aquifers
Poorly productive aquifers
Subs
oil Low permeability
subsoil* L L L L
Extreme E E H E
High H H H H
Moderate
M M M L
Low L L L L Ver
tical
pat
hway
Vul
nera
bilit
y
High to low** H H H M
* In areas where GSI subsoil permeability map is unavailable, use vulnerability map alone. ** For areas where complete vulnerability map is not available from GSI.
B. Impact potential Pathway Susceptibility (from Table A)
IMPACT POTENTIAL Extreme High Moderate Low
Present
High Moderate Low Negligible
Pres
sure
m
agni
tude
Absent
Negligible Negligible Negligible Negligible
* Pressure magnitude The pressures that are considered to pose a significant threat to groundwater are: urban and industrial areas, tillage, major roads and railways.
C. Risk category based on predictive risk assessment Proportion of assessment area with high and moderate impact potential
>40% 25-40% 15-25% 10-15% 5-10% <5% RISK CATEGORY
1b 1b 1b 2a 2b 2b
page 66 of 68
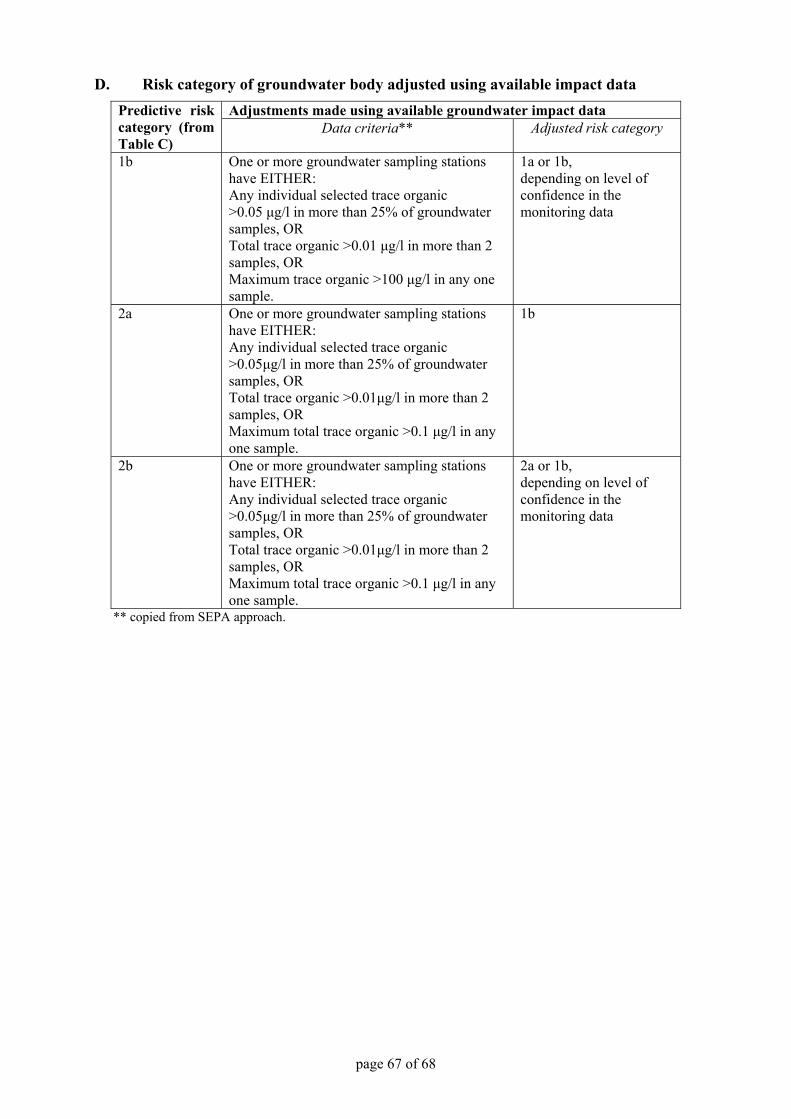
D. Risk category of groundwater body adjusted using available impact data Adjustments made using available groundwater impact data Predictive risk
category (from Table C)
Data criteria** Adjusted risk category
1b One or more groundwater sampling stations have EITHER: Any individual selected trace organic >0.05 µg/l in more than 25% of groundwater samples, OR Total trace organic >0.01 µg/l in more than 2 samples, OR Maximum trace organic >100 µg/l in any one sample.
1a or 1b, depending on level of confidence in the monitoring data
2a
One or more groundwater sampling stations have EITHER: Any individual selected trace organic >0.05µg/l in more than 25% of groundwater samples, OR Total trace organic >0.01µg/l in more than 2 samples, OR Maximum total trace organic >0.1 µg/l in any one sample.
1b
2b One or more groundwater sampling stations have EITHER: Any individual selected trace organic >0.05µg/l in more than 25% of groundwater samples, OR Total trace organic >0.01µg/l in more than 2 samples, OR Maximum total trace organic >0.1 µg/l in any one sample.
2a or 1b, depending on level of confidence in the monitoring data
** copied from SEPA approach.
page 67 of 68

34. Membership of Groundwater Working Group
Organisation
Taly Hunter Williams
Department of the Environment, Heritage and Local Government (DEHLG) Jim Ryan (NPWS)
Micheal McCarthaigh
Shannon Pilot River Basin – EPA/TCD Research Fellow
McGarrigle, M. et al. (2002) Water quality in Ireland 1998-2000, EPA, Wexford.
Representative(s)
Geological Survey of Ireland (GSI) Donal Daly (Convenor) Geoff Wright Vincent Fitzsimons Coran Kelly
Monica Lee
Camp Dresser McKee (CDM) Henning Moe
Compass Informatics Ltd. Paul Mills
Pat Duggan
Aine O’Connor (NPWS)
Environment and Heritage Service/ Geological Survey of Northern Ireland (EHS/GSNI)
Peter McConvey
Environmental Protection Agency (EPA) Margaret Keegan
RPS-Kirk McClure Morton (RPS-KMM) Grace Glasgow Kieran Fay
O’Callaghan Moran (OCM) Sean Moran Gerry Baker
O’Neill Groundwater Engineering (OGE) Shane O’Neill
Garrett Kilroy
Southeastern River Basin District (SERBD) Colin Byrne
Teagasc Karl Richards
Trinity College, Dublin (TCD) Paul Johnston Catherine Coxon
35. References Grennan, E. (1996) Small Scale Study of former Mine Sites in Ireland. Compiled by Sligo Institute of Technology and presented to the EPA.
NERC (1998) Groundwater – our hidden asset. UK Groundwater Forum. British Geological Survey. SEPA Groundwater Task Group (2004) Environmental characterisation of Scotland’s water environment. Supporting information on groundwaters. Scottish Environmental Protection Agency. 87pp. SEPA (2002) The future of Scotland’s waters. Guiding principles on the technical requirements of the Water Framework Directive. Scottish Environmental Protection Agency. 80pp. Working Group on Groundwater (2003) Guidance Document GW4: Guidance on Pressures and Impacts Assessment Methodology, 40 pp. Working Group on Groundwater (2004) Guidance Document GW5: Guidance on the Assessment of the Impact of Groundwater Abstractions, 23 pp. Working Group on Groundwater (2004) Guidance Document GW10: Verifying the Predictive Risk Assessment Methodology for Mobile Diffuse Inorganic Pollutants (NO3). Geological Survey of Ireland for Working Group on Groundwater, 18 pp.
page 68 of 68


