
Well-being at work: a cross-national analysis of the levelsand determinants of job satisfaction
Alfonso Sousa-Pozaa,*, Andres A. Sousa-Pozab,c
aDepartment of Economics and Research Institute for Labor Economics and Labor Law, University of St.Gallen, Guisanstrasse 92, 9010 St. Gallen, Switzerland
bDepartment of Engineering Management, University of Missouri at Rolla, Rolla, MO, USAcDepartment of Engineering Management, Old Dominion University, Norfolk, VA, USA
Abstract
The aim of this paper is to analyze the levels and determinants of job satisfaction in a cross-nationalsetting. This aim is accomplished using the latest Work Orientations data set from the InternationalSocial Survey Program (ISSP). The survey was conducted in 1997 and, in this paper, data for 21countries are used. The main results are: (i) workers in all countries are quite satisfied; this result alsoapplies to the five Eastern European countries analyzed here. (ii) Denmark is the country with thehighest job-satisfaction level. The United States is ranked seventh, Great Britain fifteenth, Japannineteenth, and Russia twentieth. (iii) A comparison with the 1989 ISSP data set reveals that jobsatisfaction has declined in Germany and the United States in the 1990s. (iv) Using a bottom-uppsychological model, in which we compare work-role inputs (e.g., effort) with work-role outputs (e.g.,pay), we try to explain cross-national differences. Countries with high work-role outputs, in general,have a high job-satisfaction ranking, and vice versa. (v) Having an interesting job and having goodrelations with management are the two most important work-role outputs, and having an exhaustingjob is the most important work-role input. (vi) Workers in Eastern European countries tend to valuehigh income. © 2001 Elsevier Science Inc. All rights reserved.
JEL classification:J28
Keywords:Job satisfaction; Cross-national analysis
* Corresponding author. Tel.:141-71-224-28-02; fax:141-71-224-28-07.E-mail address:[email protected] (A. Sousa-Poza).
Journal of Socio-Economics 29 (2000) 517–538
1053-5357/01/$ – see front matter © 2001 Elsevier Science Inc. All rights reserved.PII: S1053-5357(00)00085-8

1. Introduction
Subjective well-being (SWB) has been extensively researched in psychology and inmanagement. This, however, is not the case in economics. At least for noneconomists, thislack of research comes as a surprise since well-being is, one could argue, the centraleconomic variable driving individuals’ decisions. Oswald puts it very nicely:
“Economic performance is not intrinsically interesting. No-one is concerned in a genuinesense about the level of gross national product last year or about next year’s exchange rate.People have no innate interest in the money supply, inflation, growth, inequality, unemploy-ment, and the rest. [. . . ] The relevance of economic performance is that it may be a meansto an end. That end is not the consumption of beefburgers, nor the accumulation of televisionsets, nor the vanquishing of some high level of interest rates, but rather the enrichment ofmankind’s feeling of well-being” (Oswald, 1997, p. 1815).
Recently, there has been an increased interest among economists in aspects relating toSWB. There are two main research areas that have developed in recent years. (i) The analysisof general (life) well-being or happiness (see, for example, Clark and Oswald, 1994; Frey andStutzer, 1999; Kenny, 1999; Oswald, 1997) and (ii) the analysis of well-being at work, betterknown as “job satisfaction” (see, for example, Blanchflower and Oswald, 1999; Brown andMcIntosh, 1998; Clark, 1996, 1997; Clark and Oswald, 1996; Clark et al. 1995, 1997).1
The aim of this paper is to further international evidence on job satisfaction. We analyzethe latest available data set on Work Orientations from the 1997 International Social SurveyProgram (ISSP).2 This is an interesting data set since it covers numerous countries from fourcontinents.3 It also contains data for five Eastern European countries (Hungary, Russia,Slovenia, Bulgaria, Czech Republic) and Japan, that is, countries that have received com-parably little attention in this field of research. In fact, and as pointed out by Diener et al.(1995), cross-national research on SWB has, in the past, been primarily based on a very smallnumber of nations (for example, Easterlin, 1974; Veenhoven, 1991) and heavily weightedtoward Europe and the United States (for example, Blanchflower and Oswald, 1999). This isespecially the case in the job-satisfaction literature (see Spector, 1997). A further aim of thisstudy is to try and explain cross-national differences in job satisfaction with the aid of abottom-up psychological model. As far as the authors of this study can ascertain, this isgenerally not done among economists, who usually specify a model in an ad hoc manner.Furthermore, no one has yet been able to explain why countries have different job-satisfac-tion levels. By explicitly using a psychological model of the determinants of job satisfaction,we try to shed some light onto this topic.
The structure of this paper is as follows: in section 2, some conceptual issues on thedeterminants of job satisfaction are discussed. Furthermore, this section also introduces theconceptual framework implemented in this study. In section 3, we take a closer look at thequality of such data. This is necessary since it may explain economists’ reluctance to analyzesuch data, thereby hindering research in this field. This section also provides a few reasonswhy job satisfaction is an interesting research topic (for economists as well). In section 4, wepresent the results. Section 5 concludes.
518 A. Sousa-Poza, A.A. Sousa-Poza / Journal of Socio-Economics 29 (2000) 517–538

2. Conceptual issues
There are a number of psychological theories that attempt to explain the determinants ofSWB. One possible categorization distinguishes between two types of frameworks: bot-tom-up theories and top-down theories.Bottom-up theoriesanalyze the effects that externalevents, situations, and demographics have on SWB. In essence, this model assumes that thereare basic and universal human needs, and that if an individual’s needs are fulfilled in thecurrent situation, then he or she will be happy (see, Diener et al., 1999, p. 278). Thisframework therefore postulates that happiness is simply the sum of many small pleasures,and that a person will judge his or her life as happy if the pleasures outweigh the pains. Inother words, it proceeds from the premises of a “naturalistic” approach, which assumes thatSWB is something like the sum of positive and negative affects, which the more or less“livable” circumstances of living in an environment induce among its inhabitants (see,Walter-Busch, 2000 and Veenhoven, 1996).Top-down theories, on the other hand, assumethat there is “a global propensity to experience things in a positive way, and this propensityinfluences the momentary interactions an individual has with the world” (Diener, 1984, p.565). In this latter approach, an individual’s personality plays a central role.4
As in a number of studies that analyze the determinants of job satisfaction, we adapt abottom-up approach. The type of data plays an important role in our choice of model. TheISSP data set does not, for example, contain data on personality characteristics, making theimplementation of a top-down approach impossible. There is, however, a second reason forimplementing a bottom-up approach. Our aim is to analyze the determinants of job satis-faction in several countries. Knowing how situational factors such as working time, educa-tion, or job security influence job satisfaction in different countries is, from an economist’sor manager’s point of view, interesting, since these are often endogenous variables that canbe (wholly or partially) driven by public or corporate policies. For example, that longworking hours are a significant “pain” (i.e., reduce job satisfaction), could be an argumentfor reducing working time. Although in most job satisfaction studies conducted by econo-mists there is no explicit reference to a theoretical framework (i.e., the empirical specificationis done in an ad hoc manner), such studies do, de facto, implement a bottom-up approach.
The bottom-up approach used in this study is described in Hulin et al. (1985) andimplemented by, among others, Judge and Watanabe (1993). In essence, this frameworkpostulates that job satisfaction depends on the balance between work-role inputs (such aseducation, working time, effort) and work-role outputs (such as wages, fringe benefits, status,working conditions, intrinsic aspects). Thus, if work-role outputs (“pleasures”) increaserelative to work-role inputs (“pains”), then job satisfaction will increase.5,6
We distinguish five variables that capture thework-role inputs: years of schooling, usualworking time per week, working in an exhausting job, working in a physically demandingjob, working in a dangerous job. An increase in one of these inputs should,ceteris paribus,decrease job satisfaction.7 Nine variables characterize thework-role outputs: work compen-sation, job security, advancement opportunities, interesting job, independent work, helpingpeople, usefulness to society, good relationship with management, good relationship withcolleagues. An increase in one of these outputs should,ceteris paribus, increase job satis-faction. The work-role outputs and inputs are depicted in Table 1.
519A. Sousa-Poza, A.A. Sousa-Poza / Journal of Socio-Economics 29 (2000) 517–538

An important point to take note of is that most of these variables areself-perceived. Theonly exceptions are the working time and education variables. Thus, the high-incomevariable, for example, measures whether or not the respondent considers his or her job to bewell paid. Such data are interesting since it is primarily self-perceptions that determinesatisfaction. In fact, such self-perceived variables on income, job security, effort, and so forthare more appropriate than more objective measures (such as actual income) when trying toestablish the determinants of job satisfaction. To a certain extent, these self-perceivedmeasures are also compatible with the relativistic models encountered in psychology.Easterlin (1974), for example, states that differences in absolute income between nations donot necessarily lead to differences in SWB between nations. Instead, he argues that individ-uals compare their incomes to those around them and that their happiness is based on thiscomparison (see also Diener et al., 1995; Clark and Oswald, 1996). An individual’s judgmentwhether his income is high or not is, most probably, based on such a comparison. The samereasoning applies to the other self-perceived variables used in this study. Thus, the existenceof such self-perceived variables is another reason why the ISSP data set is interesting toanalyze.
We use this framework in order to identify the reasons for differing levels of jobsatisfaction among countries. One would expect that countries with a relatively high level ofjob satisfaction should also have lower levels of work-role inputs and/or higher levels ofwork-role outputs.
3. Some comments on the data
Perhaps the main reason that job satisfaction has received little attention in economics isthat economists tend to avoid data on subjective feelings and generally question theirusefulness. Clark (1997) and Oswald (1997), however, state a few good reasons why thisshould not be the case. The two most important reasons are that, first, SWB measurescorrelate with observable phenomena such as quit rates (see Clark et al., 1997) or suicides(i.e., reported job-satisfaction values are not just “noise”), and, second, psychologists have
Table 1Work-role inputs and outputs
work-role inputs work-role outputs
education high incomea
working time job securitya
exhausting joba advancement opportunitiesa
physically demandinga interesting joba
dangerous joba work independentlya
help peoplea
useful to societya
relationship with managementa
relationship with colleaguesa
a self-perceived values
520 A. Sousa-Poza, A.A. Sousa-Poza / Journal of Socio-Economics 29 (2000) 517–538

been using such data for many years.8 There are also other reasons why job satisfaction (andthus data on SWB) should be analyzed.
In management, it is argued that satisfied workers should have higher performance.Although a direct link with organizational performance, and thus economic performance, hasyet to be established,9 an indirect link can be ascertained. It has been shown that low satisfactionleads to higher absenteeism (Vroom, 1964) and labor turnover rates (further examples of howSWB measures correlate with observable phenomena). These are two factors that representconsiderable expenses to organizations and, consequently, to society. Lawler and Porter (1967),by reversing the causality, did find that high organizational performance is related to highsatisfaction. They argue that it is high performance and the results of high performance such asprestige, bonuses, and good evaluations that cause high satisfaction levels.
Another good reason for studying employee satisfaction lies in the change occurring in thestructure of industry. In most developed countries, there has been a strong shift frommanufacturing to service industries, and there is a related increase in professional andknowledge workers. It has been found that in service industries a direct and positiverelationship between employee satisfaction and customer satisfaction exists (see, Rogers etal., 1994; Fosam et al., 1998).10
Furthermore, performance of professional and knowledge workers is often difficult tomeasure and therefore indirect measures, such as employee satisfaction, take on a new andgreater importance. A clear understanding of employee satisfaction is therefore a primerequisite in industry and society.
Finally, it should also be noted that job satisfaction is one of the three most importantpredictors of overall well-being (see Argyle, 1989; Judge and Watanabe, 1993).
Thus, there are a number of good reasons for wanting to analyze job satisfaction and datarelated to job satisfaction. At this stage, however, it must be mentioned that data onself-perceived job satisfaction do have some problematic characteristics. SWB scores dependon the type of scale used, the ordering of the items, the time-frame of the questions, thecurrent mood at the time of measurement, and other situational factors (see Diener et al.,1999; Diener, 1984; Schwarz and Strack, 1991; Walter-Busch, 1977). A further problem withthe ISSP data set is that it only has a single item on job satisfaction, and, therefore, thevariance due to the specific wording of the item cannot be averaged out. A single item alsohinders the evaluation of internal consistency. Furthermore, our analysis is based on across-sectional analysis and it is therefore not possible to test the causality of certainvariables. Do satisfied workers, for example, consider their jobs interesting or do interestingjobs increase job satisfaction? The job-satisfaction literature is plagued with such causalityproblems (see, Diener et al., 1999), and our paper is no exception. Perhaps contrary to otherjob satisfaction studies conducted by economists, we do attempt to use a conceptualframework that explicitly postulates the direction of causality.
One central aim of this paper is to see whether different levels of job satisfaction amongcountries can be explained. Although such cross-national studies are valuable and interest-ing,11 they do introduce a number of additional problems (see Sousa-Poza, 1999). Perhapsthe most serious problem in this context is culturally-motivated biased perceptions (see, forexample, Hogan and Tartaglini, 1994). If the questionnaire or the topic being studied is“ethnically biased,” then errors in perception will occur. Similar sounding terms in different
521A. Sousa-Poza, A.A. Sousa-Poza / Journal of Socio-Economics 29 (2000) 517–538

languages such as “individualism” and“individualismo” , are based on different perceptions(Smith et al., 1995). For example, in collectivist countries such as Spain, individualism is a prizedpart of the self-concept. The Anglo-Saxon definition of the word however, does not apply. Pike(1967) calls the use of terms adapted from linguistics, that are “conceptualized and validated inone culture and then applied elsewhere without consideration of its local validity,” animposed etic.12 In other words, an interpretation of a word that does not apply to all culturalregions is imposed on regions where the word has a different meaning (or does not exist).
Thus, there are a number of data and methodological problems in a cross-national analysison a subjective topic such as job satisfaction. Yet the aim of the above paragraphs was, byno means, to disqualify our subsequent empirical analysis. In fact, most job-satisfactionstudies are based on such data. However, and as will be seen below, our bottom-up approachcannot explain everything, and one must therefore be aware that certain methodological anddata problems inevitably exist.
We analyze the data set on Work Orientations from the 1997 International Social SurveyProgram (ISSP). The ISSP is a continuing annual program of cross-national collaborationwhich started with the first survey in 1985. The data for the ISSP are collected by indepen-dent institutions in several countries. The topics change from year to year by agreement witha view to replication approximately every five years. The ISSP’s official data archive is theZentralarchiv at the University of Cologne, Germany. The topic of the 1989 and the 1997surveys is “Work Orientations,” and covers issues on general attitudes toward work andleisure, work organization, work content, collective interests, and aspects on second jobs.Furthermore, the ISSP data set contains several socio-demographic variables. We analyze asample of 15,324 full and part-time workers.
4. Results
4.1. A general overview
In Table 2, the levels of job satisfaction in the twenty-one countries considered in thisstudy are shown. The wording of the job satisfaction question is:“How satisfied are you inyour main job?”. Respondents were then allowed to classify their satisfaction level on aseven-point scale (ranging from “completely satisfied” to “completely dissatisfied”). Fig. 1depicts a ranking of the levels of reported job satisfaction in these countries (based on themean of the original seven-point scale).14 Some interesting results are: (i) Workers inDenmark reported the highest level of job satisfaction and workers in Hungary the lowestlevel. (ii) The United States ranks seventh, Germany thirteenth, and Great Britain fifteenth.(iii) All of the five Eastern European countries considered here (Hungary, Russia, Slovenia,Bulgaria, Czech Republic) are among the lowest eight. (iv) An interesting result is that theJapanese reported the third lowest level of job satisfaction. One would expect that in acountry with an economic model that propagates life-time employment, high skills devel-opment, good public services, “stakeholder” management principles, long-term strategies,and so forth that job satisfaction should, in an international comparison, be quite high.15 (v)Countries with the same language, or belonging to the same family of languages (for
522 A. Sousa-Poza, A.A. Sousa-Poza / Journal of Socio-Economics 29 (2000) 517–538

example, Switzerland and Germany; United States and Great Britain; Spain, Italy, Portugaland France) have quite different rankings, implying that language effects are not the onlypossible reasons for differing values.
Perhaps the most interesting observation in Table 2 and Fig. 1 is not that differences existamong countries but that, in all countries, the level of satisfaction is remarkably high. Onlya small fraction of workers are explicitly dissatisfied (in Switzerland about 4%, in the UnitedStates about 10%, and in Russia about 16%). The fact that Hungarian or Russian workers arenearly as satisfied as workers in several advanced Western European countries is aninteresting result, and it underscores the relativity of SWB.
In Table 3, the changes in the level of satisfaction for a selection of countries that wereincluded in both the 1989 and in the 1997 ISSP Work Orientations surveys are shown. Asin Blanchflower and Oswald (1999), a slight decrease in the level of satisfaction in the UnitedStates can be observed.16 An interesting, and to our knowledge new, result is the fact that jobsatisfaction appears to have decreased in West Germany in the 1990s. A similar result appliesto Norway. The trend in Great Britain is not as clear. On the one hand, there is a slight
Table 2Levels of job satisfaction
Completelysatisfied
Verysatisfied
Fairlysatisfied
Neithernor
Fairlydissatisfied
Verydissatisfied
Completelydissatisfied
No.obs.
Anglo-Saxon countriesUnited States (USA) 15.9% 32.5% 35.0% 7.3% 6.4% 1.8% 1.1% 834Great Britain (GB) 13.0% 22.6% 43.3% 10.3% 8.1% 1.8% 1.1% 571New Zealand (NZ) 11.8% 29.4% 42.6% 9.1% 5.2% 0.9% 0.9% 745
Western EuropeanCountries
Denmark (DK) 24.7% 36.9% 26.3% 7.7% 3.6% 0.9% 0.0% 700France (F) 11.4% 22.3% 42.2% 14.1% 7.7% 2.0% 0.4% 704Germany (D) 7.9% 28.6% 43.3% 14.5% 4.3% 1.0% 0.5% 1017Italy (I) 15.5% 19.9% 43.4% 13.1% 5.0% 2.5% 0.8% 482Netherlands (NL) 10.5% 37.6% 41.8% 6.1% 2.8% 0.8% 0.4% 1175Norway (N) 10.1% 26.6% 45.4% 12.3% 4.6% 0.8% 0.2% 1639Portugal (P) 17.7% 21.2% 32.5% 21.8% 3.7% 1.7% 1.4% 888Spain (E) 13.8% 36.0% 33.7% 11.3% 3.7% 1.0% 0.5% 406Sweden (S) 9.9% 30.4% 42.1% 11.7% 4.2% 1.3% 0.2% 826Switzerland (CH) 11.7% 40.3% 37.1% 7.2% 2.4% 0.6% 0.6% 1780
Eastern EuropeanCountries
Hungary (H) 9.1% 14.1% 39.0% 29.6% 5.0% 1.8% 1.4% 625Czech Republic (CZ) 15.4% 13.0% 50.5% 14.3% 4.7% 1.1% 0.9% 552Slovenia (SL) 11.6% 15.4% 39.7% 26.2% 5.2% 0.9% 0.9% 534Bulgaria (BU) 10.7% 18.4% 49.3% 13.0% 4.8% 2.5% 1.3% 477Russia (R) 13.2% 26.7% 19.2% 25.5% 8.0% 3.4% 4.1% 859
OthersJapan (J) 5.5% 24.7% 41.6% 13.4% 9.7% 4.1% 0.9% 776Israel (IS) 27.6% 20.8% 32.8% 10.9% 4.9% 1.9% 1.1% 912Cyprus (CY) 21.6% 38.2% 27.4% 10.3% 2.0% 0.5% 0.0% 602
Totala 13.6% 26.5% 38.6% 13.8% 5.1% 1.6% 0.9% 15324
a Unweighted.
523A. Sousa-Poza, A.A. Sousa-Poza / Journal of Socio-Economics 29 (2000) 517–538

increase in the number of completely satisfied workers. On the other hand, the portion ofdissatisfied workers appears to have increased. The only country in which there seems to bea (more or less) consistent increase in the number of satisfied workers is Holland. It isdifficult, however, to judge whether these changes are significant and to what extent they arethe product of changing attitudes or survey-related aspects. Furthermore, one can onlyspeculate on the causes of changes in job satisfaction.17
In order to attempt an explanation for the differing levels of job satisfaction in the twentycountries considered here,18 we have depicted in Table 4 each country’s “endowment” withwork-role inputs and work-role outputs. There are some interesting differences in theself-perceived values among countries. For example: (i) the portion of workers in Russia thatconsider their jobs well paid is higher than in several Western European countries (includingGreat Britain and Switzerland). This result underscores the assumption we made above that
Fig. 1. Levels of job satisfaction
Table 3Changes in the levels of job satisfaction: 1989 vs. 1997
Completelysatisfied
Verysatisfied
Fairlysatisfied
Neithernor
Fairlydissatisfied
Verydissatisfied
Completelydissatisfied
United States 0.98 0.96 0.95 1.22 1.23 1.38 1.83Great Britain 1.09 0.82 0.99 1.26 1.35 1.06 1.57Germany (West) 0.81 0.92 1.04 1.21 1.18 1.33 2.00Italy 0.94 1.14 0.93 1.36 0.81 1.67 0.42Netherlands 1.03 1.26 0.93 0.58 0.80 0.89 1.33Norway 0.73 0.93 1.08 1.03 2.09 1.14 0.29Hungary 1.44 1.96 0.62 1.66 1.25 2.57 2.00Israel 1.67 1.20 0.70 1.14 0.79 1.27 0.58
Note: values correspond to the quotient of the corresponding percentages for 1997 and 1989. A value of lessthan one thus implies that the corresponding item has declined.
524 A. Sousa-Poza, A.A. Sousa-Poza / Journal of Socio-Economics 29 (2000) 517–538

Tab
le4
Wor
k-ro
lein
puts
and
wor
k-ro
leou
tput
sby
coun
try
Wor
k-ro
lein
puts
Wor
k-ro
leou
tput
s
Sch
oolin
gin
year
sW
ork
time
(hou
rspe
rw
eek)
Exh
aust
-in
gjo
b(%
)
Phy
sica
llyde
man
d-in
g(%
)
Dan
gero
usJo
b(%
)In
com
eis
high
(%)
Job
isse
cure
(%)
Offe
rsgo
odad
vanc
e-m
ent
oppo
rtun
-iti
es(%
)
Inte
rest
ing
job
(%)
Can
wor
kin
depe
nd-
ently
(%)
Can
help
othe
rpe
ople
(%)
Job
isus
eful
to soci
ety
(%)
Goo
dre
latio
nsw
ithm
anag
e-m
ent
(%)
Goo
dre
latio
nsw
ithco
lleag
ues
(%)
DK
1236
3322
1143
7823
8795
8080
7086
CY
1239
6122
1743
5630
6955
6570
7784
CH
1240
3717
621
6122
8986
6569
7786
IS13
4050
2718
3168
3266
6875
7476
86N
L14
3116
156
2465
2475
8564
6166
83E
1239
3624
1517
5916
6459
6273
6680
US
A14
4141
2112
2468
3073
7979
7068
79S
1238
3825
917
5521
7683
6465
6386
N13
a37
4123
1218
7014
7485
7070
6386
I12
4148
2413
2461
2373
5858
5856
75P
842
4825
2115
6227
8172
8588
6775
D11
4046
2011
2358
1682
8550
6277
87C
Z13
4533
2121
1156
1065
7269
8058
77G
B12
3942
2111
1753
1970
7868
5566
87F
1439
4719
714
4613
7446
6565
5376
BU
1240
6527
269
4017
6152
6487
6169
SL
1242
4718
2032
6727
7577
7877
4774
J13
4329
1711
2366
1057
3948
5961
74R
1239
4024
1721
5312
4950
5372
4674
H12
4952
3125
948
1465
7474
7958
76
aA
ppro
xim
ated
.
525A. Sousa-Poza, A.A. Sousa-Poza / Journal of Socio-Economics 29 (2000) 517–538
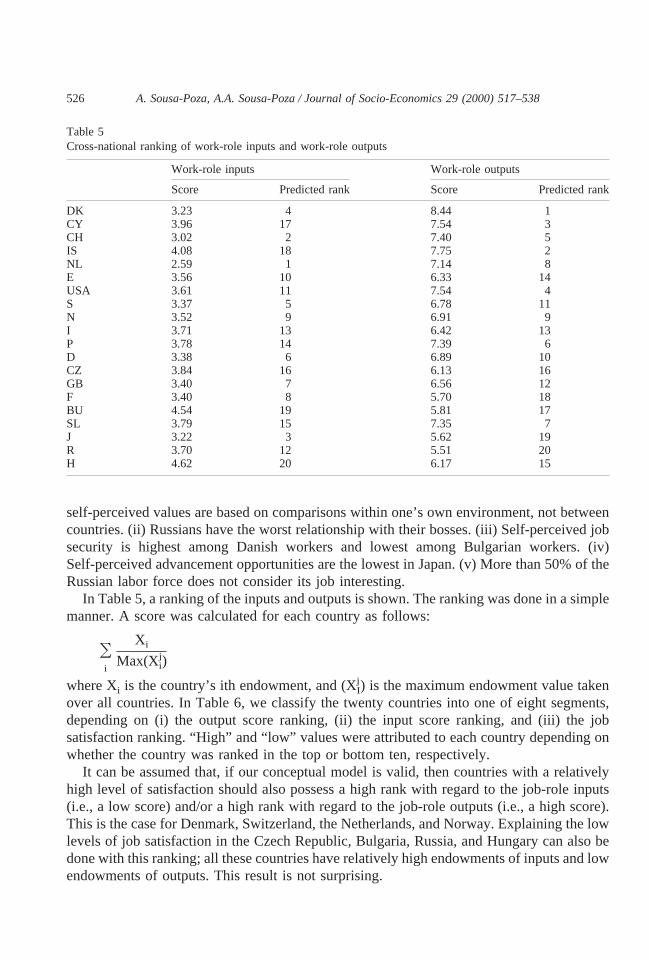
self-perceived values are based on comparisons within one’s own environment, not betweencountries. (ii) Russians have the worst relationship with their bosses. (iii) Self-perceived jobsecurity is highest among Danish workers and lowest among Bulgarian workers. (iv)Self-perceived advancement opportunities are the lowest in Japan. (v) More than 50% of theRussian labor force does not consider its job interesting.
In Table 5, a ranking of the inputs and outputs is shown. The ranking was done in a simplemanner. A score was calculated for each country as follows:
Oi
Xi
Max(Xij)
where Xi is the country’s ith endowment, and (XIj) is the maximum endowment value taken
over all countries. In Table 6, we classify the twenty countries into one of eight segments,depending on (i) the output score ranking, (ii) the input score ranking, and (iii) the jobsatisfaction ranking. “High” and “low” values were attributed to each country depending onwhether the country was ranked in the top or bottom ten, respectively.
It can be assumed that, if our conceptual model is valid, then countries with a relativelyhigh level of satisfaction should also possess a high rank with regard to the job-role inputs(i.e., a low score) and/or a high rank with regard to the job-role outputs (i.e., a high score).This is the case for Denmark, Switzerland, the Netherlands, and Norway. Explaining the lowlevels of job satisfaction in the Czech Republic, Bulgaria, Russia, and Hungary can also bedone with this ranking; all these countries have relatively high endowments of inputs and lowendowments of outputs. This result is not surprising.
Table 5Cross-national ranking of work-role inputs and work-role outputs
Work-role inputs Work-role outputs
Score Predicted rank Score Predicted rank
DK 3.23 4 8.44 1CY 3.96 17 7.54 3CH 3.02 2 7.40 5IS 4.08 18 7.75 2NL 2.59 1 7.14 8E 3.56 10 6.33 14USA 3.61 11 7.54 4S 3.37 5 6.78 11N 3.52 9 6.91 9I 3.71 13 6.42 13P 3.78 14 7.39 6D 3.38 6 6.89 10CZ 3.84 16 6.13 16GB 3.40 7 6.56 12F 3.40 8 5.70 18BU 4.54 19 5.81 17SL 3.79 15 7.35 7J 3.22 3 5.62 19R 3.70 12 5.51 20H 4.62 20 6.17 15
526 A. Sousa-Poza, A.A. Sousa-Poza / Journal of Socio-Economics 29 (2000) 517–538

For some countries, it is difficult to apply this approach because it would require an exactcomparison of the inputs with the outputs, which is not possible. In Cyprus, Israel, and the UnitedStates, both inputs and outputs are relatively high. It could be argued that in these countries a“give a lot, get a lot (and be satisfied)” mentality is being observed. In the United States workersgenerally consider their jobs to be secure, have good advancement opportunities, and providehigh income.19 Portugal and Slovenia also have a high output/high input combination, yet theyare countries with a relatively low satisfaction level. Spain and Sweden, on the other hand, havelow levels of inputs and also relatively low levels of outputs, yet rank high in the satisfactionscale.20 Great Britain, France and Japan have the same endowment structure as Spain andSweden, yet they are classified in the lower half of the satisfaction scale.21 An interesting resultis the relatively low ranking of Japan’s work-role outputs: Japanese workers have comparablylow levels of (self-perceived) advancement opportunities, interesting jobs, independent work, andjobs contributing to a society’s well-fare. Then there are two countries that do not fit into thisconceptual framework very well. According to this framework, German workers should have everyreason to be more satisfied than workers in other countries. They have relative low inputs andabove average outputs. Yet, they appear in the bottom half of the satisfaction ranking.22 Italy hasa high input and a low output and yet they have a job-satisfaction rank in the top ten. Finally, wealso note that countries with relatively high work-role outputs (irrespective of work-role inputs)have a high satisfaction ranking. In fact, this applies to seven of the top-ten ranked countries.Thus, one could argue that it is primarily work-role outputs that influence job satisfaction.23
In general, the results in Table 6 are quite encouraging: in eight cases, the results arecompletely compatible with the conceptual bottom-up framework used here, in ten cases, theresults do not conflict with the model, and in only two cases are the results conflicting. If onefurthermore notes that both Italy and Germany are borderline cases in the job satisfactionclassification (Italy is ranked tenth and Germany twelfth), then even this conflict does notappear to be very severe.
4.2. A regression analysis
In Table 7, the results of an ordered probit model are presented. The dependent variablehas been reclassified so that it only has three possible values that measure job satisfaction.
Table 6Classification of countries by inputs and outputs
Output
Low High
High satisfaction E, S DK, CH, NL, NLow
Low satisfaction GB, F, J DInput
High satisfaction I CY, IS, USAHigh
Low satisfaction CZ, BU, R, H P, SL
Note: ‘‘high satisfaction’’ implies that the country ranks in the top ten with regard to job satisfaction. Theshaded areas are not compatible with the bottom-up approach taken in this study.
527A. Sousa-Poza, A.A. Sousa-Poza / Journal of Socio-Economics 29 (2000) 517–538

There are two reasons for doing this: first, there is little variation and, in most cases, thereare only few observations in the low satisfaction scales. A second reason is that we assumethat there is quite a bit of “noise” in such a detailed scale.24 The goodness-of-fit is not poor(pseudo R2 equal to 0.20), yet a substantial degree of variation remains unexplained. This isa standard result for bottom-up approaches and indicates that job satisfaction does depend onother (possibly top-down) factors (see also Diener et al., 1999). Furthermore, the largestportion of the variation is explained by the variables “interesting job” and “good relationswith management.” The signs of the work-role input and work-role output coefficients are asexpected.25 The working-time variable is, however, only significantly negative for the femalesample. In general, the estimated coefficients for the male and female samples are quitesimilar. Only the work-role input “physically demanding,” and the two work-role outputs“can help other people” and “job is useful to society” differ.
In general, one can say that the determinants of job satisfaction do not differ substantiallybetween genders. In Table 8, we rank the determinants of job satisfaction according to theirmarginal effects.26
Having an interesting job and having good relations with one’s boss have the largest effect
Table 7Determinants of job satisfaction—ordered probit
All Males Females
Coef. MEb Coef. MEb Coef. MEb
Male 20.028 20.006Work-role inputs
Schooling in years 20.017** 20.004 20.015** 20.003 20.017** 20.004Work time 20.001 20.000 0.003 0.000 20.005** 20.001Exhausting joba 20.258** 20.059 20.254** 20.058 20.262** 20.059Physically demandinga 20.066** 20.015 20.081* 20.018 20.032 20.007Dangerous joba 20.819* 20.019 20.068 20.016 20.117 20.026
Work-role outputsIncome is higha 0.294** 0.067 0.325** 0.074 0.237** 0.053Job is securea 0.173** 0.039 0.216** 0.049 0.123** 0.028Good advancement opportunitiesa 0.203** 0.046 0.203** 0.046 0.214** 0.048Interesting joba 0.830** 0.189 0.828** 0.188 0.843** 0.189Can work independentlya 0.274** 0.062 0.243** 0.055 0.296** 0.066Can help other peoplea 0.082** 0.019 0.091* 0.021 0.069 0.015Job is useful to societya 0.098** 0.022 0.118** 0.027 0.068 0.015Good relations with managementa 0.623** 0.141 0.564** 0.128 0.685** 0.154Good relations with colleaguesa 0.204** 0.046 0.153** 0.035 0.273** 0.061
Number of observations 15112 8127 6985Log likelihood 27642 24108 23504Pseudo R2 0.202c 0.204c 0.208c
Note: the dependent variable can have three possible values: 0—dissatisfied, 1—neither nor, 2—satisfied. Theregressions included 19 country dummy variables. For the sake of clarity, these coefficients have not beenreported here.
a Dummy variables.b ME 5 marginal effect calculated at score equal to 2.c The pseudo R2 measure is that of McFadden (1973).*/** Significant at the 5%/1% level, respectively.
528 A. Sousa-Poza, A.A. Sousa-Poza / Journal of Socio-Economics 29 (2000) 517–538

on job satisfaction. These two determinants have the same ranking in both the male and femalesamples. Women, however, do appear to value good relations with management more than men.Third in the male’s ranking is perceived income, that is, whether the respondent considers hisincome to be high or not. High income ranks fifth in the female sample. This is not an uncommonresult in the psychology and management literature, which postulates that women value “soft”aspects of a job (such as good relationships), whereas men value “hard” aspects (such as pay andjob security). An interesting observation is that being able to work independently has quite a highranking in both the male and the female samples. A further interesting (and to our knowledgepreviously unobserved) result is that good relations with management has a substantiallylarger effect than good relations with colleagues. Altruistic characteristics of a job (i.e.,helping other people and being useful to society) have a much lower effect on job satisfactionthan more individualistic interests such as income and job security.
Having an exhausting job has the largest negative effect on job satisfaction. This result showsthat effort is an important work-role input. The other work-role inputs only have minimaleffects on job satisfaction. The robustness of these estimates is discussed in the appendix.
In Table 9, the marginal effects for each country are shown. These marginal effects arebased on standard probit regressions for each country. The fact that, in several countries, anumber of coefficients are insignificant is a disquieting result. This could imply that ourbottom-up model does not perform very well at the country level. More likely, however, thisis a result of the relatively small sample size in a number of countries. Despite thisshortcoming, there are a few interesting results27:
Y The two work-role outputs “interesting job” and “good relations with management” arestatistically significant (at the 10% level) across all countries.28 Furthermore, the marginaleffects for these two variables are quite high in all the countries considered here.
Table 8Ranking of determinants
All Males Females
ME Rank ME Rank ME Rank
Interesting job 0.189 1 0.188 1 0.189 1Good relations with management 0.141 2 0.128 2 0.154 2Income is high 0.067 3 0.074 3 0.053 5Can work independently 0.062 4 0.055 4 0.066 3Good advancement opportunities 0.046 5 0.046 6 0.048 6Good relations with colleagues 0.046 6 0.035 7 0.061 4Job is secure 0.039 7 0.049 5 0.028 7Job is useful to society 0.022 8 0.027 8 0.015* 8Can help other people 0.019 9 0.021 9 0.015* 9Work time 20.000* 10 0.000* 10 20.001 10Schooling in years 20.004 11 20.003 11 20.004 11Physically demanding 20.015 12 20.018 13 20.007* 12Dangerous job 20.019 13 20.016* 12 20.026* 13Exhausting job 20.059 14 20.058 14 20.059 14
Note: ME 5 marginal effects.* Not significant.
529A. Sousa-Poza, A.A. Sousa-Poza / Journal of Socio-Economics 29 (2000) 517–538

Y A number of studies for Great Britain and the United States show that women are moresatisfied than men (see, for example, Blanchflower and Oswald, 1999; Brown andMcIntosh, 1998; Clark, 1997, 1996). Since labor-market conditions are, in general, lessfavorable for women than for men, this is a paradoxical result. The results in Table 11reveal that this paradox cannot be generalized.29
Y Surprisingly, work-role inputs differ substantially from country to country. Further-more, in most countries, a number of the work-role inputs are insignificant. In fact,some countries (such as Bulgaria) do not have any work-role inputs. This, once again,is most probably due to the small sample sizes.
Y The effect of having a (self-perceived) well-paying job on job satisfaction is insignif-icant in, among others, the United States and Great Britain.30 A result that does catchour attention is that in four of the five Eastern European countries considered here, theimportance of a high income as a determinant of job satisfaction is quite high. InRussia, for example, high income is as important as having an interesting job.
5. Summary and conclusions
The aim of this paper was to analyze the levels and determinants of job satisfaction in across-national setting. We analyzed the latest available data set on Work Orientations fromthe 1997 International Social Survey Program (ISSP). This data set has a number ofinteresting properties: (i) it covers twenty-one countries, (ii) besides containing data forseveral Western European countries and the United States, this data set also has data for a
Table 9Marginal effects by country
USA GB DK F D I NL N
Male 20.05 20.07 0.00 0.00 0.00 0.00 0.00 0.00Work-role inputs
Schooling in years 20.01 0.00 0.00 0.00 0.00 0.00 20.01 0.00Work time 0.00 0.00 0.00 0.0020.01 0.00 0.00 0.00Exhausting joba 20.05 0.00 20.07 20.08 0.00 0.00 20.05 20.09Physically demandinga 0.00 0.00 0.00 0.00 0.00 0.00 0.00 0.00Dangerous joba 0.00 20.13 0.00 0.00 0.00 0.00 0.00 20.05
Work-role outputsIncome is higha 0.00 0.00 0.00 0.11 0.10 0.00 0.00 0.00Job is securea 0.07 0.00 0.05 0.08 0.00 0.07 0.00 0.04Good advancement opportunitiesa 0.00 0.00 0.00 0.00 0.09 0.12 0.00 0.00Interesting joba 0.12 0.21 0.13 0.22 0.24 0.27 0.08 0.18Can work independentlya 0.07 0.15 0.00 0.07 0.11 0.07 0.05 0.05Can help other peoplea 0.00 0.00 0.04 0.00 0.06 0.00 0.04 0.03Job is useful to societya 0.00 0.00 0.04 0.00 0.06 0.00 0.04 0.03Good relations with managementa 0.11 0.20 0.08 0.16 0.18 0.11 0.07 0.16Good relations with colleaguesa 0.00 0.00 0.06 0.13 0.00 0.07 0.06 0.09
Number of observations 798 531 628 659 977 469 1152 1554Pseudo R2 0.203 0.286 0.309 0.280 0.266 0.242 0.342 0.292
Note: a value equal to zero implies that the coefficient is not significant at the 10% level.
530 A. Sousa-Poza, A.A. Sousa-Poza / Journal of Socio-Economics 29 (2000) 517–538


especially the case for Japan, which ranks second last with regard to their work-role outputs.Furthermore, countries with high work-role outputs (irrespective of work-role inputs) alsogenerally have a high job-satisfaction ranking.
Our multivariate regression analysis confirmed that our work-role inputs and outputs have,in general, a significant influence on job satisfaction. A ranking of the marginal effects of thework-role inputs and outputs revealed that having an interesting job and good relations withmanagement are the most important determinants of job satisfaction (based on the variablesconsidered here). High income and being able to work independently are also importantdeterminants. Having an exhausting job is the most important work-role input. In general, thedeterminants of job satisfaction do not differ much between genders. We also estimatedstandard probit models for each individual country in order to investigate possible differ-ences in importance that specific countries attribute to certain work-role inputs and outputs.One interesting result is that, for workers in the Eastern European countries, having awell-paying job is an important determinant of job satisfaction.
Our main contribution in this paper was to show that job-satisfaction levels differ acrosscountries and that these differences can be partially attributed to differences in work-roleinputs and outputs. Furthermore, we showed that there are some determinants of jobsatisfaction that apply to all countries (namely, having an interesting job and good relationswith management) and others that are country specific (such as pay and job security). Theseresults are not only interesting from an economic and from a sociological perspective, theyalso supplement the management literature in this field. With the increased importance ofmultinational companies, knowing how employees’ job satisfaction can be influenced indifferent cultures is a central research objective in the international management literature.
Notes
1. Older studies which need to be mentioned are Easterlin (1974), Hamermesh (1977)and Freeman (1978).
2. The first ISSP Work Orientations survey was conducted in 1989. In a recent paper,Blanchflower and Oswald (1999) also analyze job satisfaction with this data set.
3. At the time of writing only 21 of the 25 countries included in 1997 ISSP survey wereavailable.
4. There are also other theoretical frameworks such as discrepancy theories, goals,adoption, and coping. See Diener et al. (1999).
5. This framework is similar to Herzberg’s Two-Factor Theory (Herzberg et al., 1959).He postulates that there are two sets of variables that influence employee satisfaction.Pain avoidance factors (hygienic: pay, safety, technical administration, etc.) that cancause dissatisfaction but do not contribute to satisfaction and psychological needsfactors (esthetic: value of work, perceived importance of work, social aspects of work,etc.) that increase satisfaction but do not cause dissatisfaction if they are not present.
6. Hulin et al. (1985) also argue that the utility of direct and opportunity costs (forexample, available alternatives) and also the frames of reference for evaluating joboutcomes (for example, past experience) influence job satisfaction. For the sake ofsimplicity, we have excluded variables that capture these aspects.
532 A. Sousa-Poza, A.A. Sousa-Poza / Journal of Socio-Economics 29 (2000) 517–538

7. The effect that the level of education has on job satisfaction has not always enjoyeda straight-forward interpretation among economists. Clark and Oswald (1996) viewthe negative effect of the level of education as a kind of curse of high aspirations;schooling raises the expectations of what someone thinks they should receive. Asimilar argument was proposed by Tsang et al. (1991). Treating education as acontribution (i.e., input) can be interpreted in a similar way.
8. Quoting Blanchflower and Oswald: “[. . . ] it seems difficult to believe that econo-mists have a more acute understanding of the limitations of well-being statistics thando the thousands of psychologists who use such data in their own research” (Blanch-flower and Oswald, 1999, p. 1).
9. And which has been questioned by many researchers (see, for example, Bayfield andCrockett, 1955; French, 1984; Robbins et al., 1986).
10. Quoting Fosam et al.: “The measurement of employee satisfaction as well as customersatisfaction is now central to most quality oriented companies’ strategies. This isparticularly relevant where employees have direct contact with customers, as ‘organiza-tions with satisfied employees have satisfied customers’” (Fosam et al., 1998, p. 236).
11. Quoting Kohn: “[. . . ] cross-national research is valuable, even indispensable, forestablishing the generality of findings and the validity of interpretations derived fromsingle-nation studies. In no other way can we be certain that what we believe to besocial structural regularities are not mere particularities, the product of some limitedset of historical or cultural or political circumstances. I also argue that cross-nationalresearch is equally valuable, perhaps even more valuable, for forcing us to revise ourinterpretations to take account of cross-national differences and inconsistencies thatcould never be uncovered in single-nation research” (Kohn, 1989, p. 77).
12. An etic effect is defined as an effect that transcends cultures, in contrast to an emiceffect, that is particular to a specific culture (Segall et al., 1990).
13. Official documentation on the 1997 ISSP is not yet available. The survey is, however,in essence (and with the main exception being the number of countries analyzed),identical to the 1989 ISSP survey (see, Beckmann, 1991). The 1997 survey ques-tionnaire is available from the Zentralarchiv at the University of Cologne, Germany.
14. The ranking does change slightly if, instead of a seven-point scale, a two or three-point scale is used (i.e., when a few scales are aggregated together).
15. Although this view of Japan may be outdated. Only about a quarter of full-time maleemployees still enjoy the life-time employment benefit, and about twenty percentageof the workforce has a part-time employment (see, Babcock, 1996, p. 371).
16. Blanchflower and Oswald (1999) use longitudinal data from the US General SocialSurvey. They show that job satisfaction is slowly trending down over time amongthose over 30. They also show that this decline is not caused by the slowly decliningjob security in the United States. In Blanchflower and Oswald (1997), it is shown thatlife satisfaction is actually increasing among young men and women.
17. The dynamics of job satisfaction are, needless to say, quite complex. The effect thata certain event (for example, German reunification, or transition of the EasternEuropean countries) or measure (for example, increase in wages, or reduction ofworking time) has on job satisfaction is difficult to determine. Even if panel data were
533A. Sousa-Poza, A.A. Sousa-Poza / Journal of Socio-Economics 29 (2000) 517–538

available, isolating the effect of an event or a measure could be quite problematic.Furthermore, the time between when an initial change took place and the posteffectstable level of satisfaction will vary greatly between individuals and across measures.
18. Because of missing variables, we have excluded New Zealand in the subsequentanalysis.
19. Thus, despite the fact that job security appears to be declining in the United States(see, Blanchflower and Oswald, 1999), most American workers still (and in compar-ison to workers in other countries) perceive their job to be quite secure.
20. They thus reflect hedonistic traits.21. The oxymoron “unsatisfied hedonists” would characterize such a situation.22. Perhaps there is a grain of truth in the popular notion that Germans consider work
more a duty than a pleasure (“. . . they live to work, and not work to live”).23. One could also argue that we have not been able to capture the most important
work-role inputs.

Appendix
Diagnostics of the standard probit
In order to test the robustness of the estimated coefficients we recoded the dependentvariable so that it only has two possible values: ‘09 for dissatisfied and “neither-nor” workers,and ‘19 for satisfied workers. There are, once again, two reasons for this. First, there is the“noise” argument mentioned above. A second reason is that the coefficients estimated withan ordered probit model are inconsistent if the underlying normality and homoskedasticityassumptions are violated. By estimating a standard probit model, these assumptions can betested. The results for the standard probit model are presented in Table A1. Using score testsdescribed in Pagan and Vella (1989), it can be seen that the homoskedasticity assumptionclearly does not hold (see Table A2). Heteroskedasticity appears through the variables“Switzerland”, “Norway”, “Slovenia”, “Russia”, “working time”, “exhausting job,” and
TABLE A1Determinants of job satisfaction—standard probit
Standard With mult. hetero.d
Coef. MEb Coef. MEb
Male 20.044 20.010 20.055 20.010Work-role inputs
Schooling in years 20.012** 20.003 20.015** 20.003Work time 20.001 20.000 0.000 20.001Exhausting joba 20.252** 20.057 20.302** 20.056Physically demandinga 20.072* 20.016 20.060 20.021Dangerous joba 20.070 20.016 20.090 20.017
Work-role outputsIncome is higha 0.308** 0.069 0.376** 0.069Job is securea 0.187** 0.042 0.221** 0.041Good advancement opportunitiesa 0.195** 0.044 0.251** 0.046Interesting joba 0.882** 0.197 1.135** 0.183Can work independentlya 0.303** 0.068 0.356** 0.066Can help other peoplea 0.086** 0.019 0.096* 0.018Job is useful to societya 0.121** 0.027 0.146** 0.027Good relations and managementa 0.642** 0.144 0.767** 0.141Good relations with colleaguesa 0.221** 0.049 0.263** 0.048
Number of observations 15112 8127Log likelihood 25642 24108Pseudo R2 0.258c 0.204c
Note: the dependent variable have two possible values: 0—dissatisfied and neither nor, 1—satisfied. Theregressions included 19 country dummy variables. For the sake of clarity, these coefficients have not beenreported here.
a Dummy variables.b ME 5 marginal effect.c The pseudo R2 measure is that of McFadden (1973).d It is assumed that in the model Ui ; N(0, (eg9Gi)) and the variables in G are ‘‘Switzerland’’, ‘‘Norway’’,
‘‘Slovenia’’, ‘‘Russia’’, ‘‘working time’’, ‘‘exhausting job’’, and ‘‘income is high’’.*/** Significant at the 5%/1% level, respectively.
535A. Sousa-Poza, A.A. Sousa-Poza / Journal of Socio-Economics 29 (2000) 517–538

“income is high.” The normality assumption, on the other hand, does not pose a problem. InTable A1, we estimate a probit model with multiplicative heteroskedasticity, as described inGreene (1995), pp. 422–425 and Greene (1997), pp. 889–891. This model uses the generalformulation analyzed by Harvey (1976) and assumes that
Ui ; N(0,(eg9Gi)2)where, in our case, the variables included in G are the seven variables mentioned above. Ascan be seen, the results do not diverge substantially from those of the normal probit model.
Table A2Profit diagnosticsa
variable t-statistic
HomoscedasticitySwitzerland 2.314Germany 1.851Great Britain 0.749Hungary 21.741Italy 20.200Netherlands 1.989Norway 3.077Sweden 1.439Czech Republic 0.539Slovenia 2.405Bulgaria 21.943Russia 22.965Israel 21.504Japan 21.706Spain -0.788France 1.241Portugal 21.379Cyprus 20.929Denmark 1.934Male 21.233Schooling in years 0.006Work time 22.055Exhausting job 22.598Physically demanding 21.319Dangerous job 21.898Income is high 22.354Job is secure 1.348Good advancement opportunities 21.086Interesting job 20.656Can work independently 1.056Can help other people 0.036Job is useful society 20.803Good relations with management 20.839Good relations with colleagues 20.950
NormalitySkewness 0.169Kurtosis 0.041
a Conditional moment tests described in Pagan and Vella (1989).
536 A. Sousa-Poza, A.A. Sousa-Poza / Journal of Socio-Economics 29 (2000) 517–538

Furthermore, the fact that the marginal effects are quite similar to those of the ordered probitmodel in Table 7 does underscore the robustness of those results.
References
Argyle, M., 1989. The Psychology of Happiness. Routledge, London.Babcock, D.L., 1996. Managing Engineering and Technology. Prentice Hall, New York.Bayfield, H.A., Crockett, W.H., 1955. Employee attitudes and employee performance. Psychological Bulletin,
September, 415–422.Blanchflower, D.G., Oswald, A.J., 1997. The rising well-being of the young. NBER Working Paper No. 6102.Blanchflower, D.G., Oswald, A.J., 1999. Well-being, insecurity and the decline of American job satisfaction.
mimeo.Brown, D., McIntosh, S., 1998. If you’re happy and you know it.. job satisfaction in the low wage service sector.
Discussion Paper No. 405, Centre for Economic Performance, London School of Economics.Clark, A.E., 1996. Job satisfaction in Britain. British Journal of Industrial Relations 4, 341–372.Clark, A.E., 1997. Job satisfaction and gender: why are women so happy at work? Labour Economics 4, 341–372.Clark, A.E., Georgellis, Y., Sanfey, P., 1997. Job satisfaction, wage changes and quits: evidence from Germany.
Discussion Paper No. 97/11, University of Kent at Canterbury.Clark, A.E., Oswald, A.J., Warr, P.B., 1995. Is job satisfaction U-shaped in age? Journal of Occupational and
Organizational Psychology 69, 57–81.Clark, A.E., Oswald, A.J., 1994. Unhappiness and unemployment. Economic Journal 104, 648–659.Clark, A.E., Oswald, A.J., 1996. Satisfaction and comparison income. Journal of Public Economics 61, 359–381.Diener, E., 1984. Subjective well-being. Psychol. Bull. 95, 542–575.Diener, E., Diener, M., Diener, C., 1995. Factors predicting the subjective well-being of nations. J. Pers. Soc.
Psychol. 69, 851–864.Diener, E., Suh, E.M., Lucas, R.E., Smith, H.L., 1999. Subjective well-being: three decades of progress. Psychol.
Bull. 125, 276–302.Easterlin, R., 1974. Does economic growth improve the human lot? Some empirical evidence. In: David, P.A.,
Reder, M.W. (Eds.), Nations and Households in Economic Growth: Essays in Honour of Moses Abramovitz.Academic Press, New York.
Fosam, E.B., Grimsley, M.F.J., Wisher, S.J., 1998. Exploring models for employee satisfaction - with particularreference to a police force. Total Quality Management 9, 235–247.
Freeman, R.B., 1978. Job satisfaction as an economic variable. American Economic Review 68, 135–141.French, W., 1984. The Personnel Management Process: Human Resources Administration. Houghton Mifflin,
Boston.Frey, B.S., Stutzer, A., 1999. Happiness, economy and institutions. mimeo.Greene, W.H., 1995. LIMDEP Version 7.0 User’s Manual. Econometric Software, Castle Hill.Greene, W.H., 1997. Econometric Analysis, third ed. Prentice Hall, Upper Saddle River, New Jersey.Hamermesh, D.S., 1977. Economic aspects of job satisfaction. In: Ashenfelter, O., Oates, W. (Eds.), Essays in
Labor Market and Population Analysis. Wiley, New York.Harvey, A., 1976. Estimating regression models with multiplicative heteroscedasticity. Econometrica 44, 461–
465.Herzberg, F., Mausner, B., Snyderman, B., 1959. The Motivation to Work. Wiley, New York.Hofstede, G., Bond, M.H., Chung-Leung, L., 1993. Individual perceptions of organizational cultures: a meth-
odological treatise on levels of analysis. Organization Studies 14, 483–503.Hofstede, G., 1991. Cultures and Organizations: Software of the Mind. McGraw-Hill, New York.Hogan, J. D., Tartaglini, A., 1994. A brief history of cross-cultural psychology. In: Bond M.H., Gielen, U. P.
(Eds.), Cross-Cultural Topics in Psychology. Praeger Publishers, Westport, pp. 15–23.Hulin, C.L., Roznowski, M., Hachiya, D., 1985. Alternative opportunities and withdrawal decisions: empirical
and theoretical discrepancies and an integration. Psychol. Bull. 97, 233–250.
537A. Sousa-Poza, A.A. Sousa-Poza / Journal of Socio-Economics 29 (2000) 517–538

Judge, T.A., Watanabe, S., 1993. Another look at the job satisfaction-life satisfaction relationship. J. Appl.Psychol. 6, 939–948.
Kenny, C., 1999. Does growth cause happiness, or does happiness cause growth? Kyklos 52, 3–26.Kohn, M.L., 1989. Cross-National Research as an Analytic Strategy. SAGE Publications, Newbury Park.Lawler, E.E., Porter, L.W., 1967. The effect of performance of job satisfaction. Industrial Relations 7, 20–28.McFadden, D., 1973. Conditional logit analysis of qualitative choice behavior. In: Zarembka, P. (Ed.), Frontiers
in Econometrics. Academic Press, New York, pp. 105–142.Oswald, A.J., 1997. Happiness and economic performance. Economic Journal 107, 1815–1831.Pagan, A., Vella, F., 1989. Diagnostic tests for models based on individual data: a survey. Journal of Applied
Econometrics 4, 29–59.Pike, K.L., 1967. Language in Relation to a Unified Theory of Human Behavior. Mouton, the Hague.Robbins, S.P., Low, P.S., Mourell, M.P., 1986. Managing Human Resources. Prentice-Hall, New York.Rogers, J. D., Clow, K. E., Kash, T.J., 1994. Increasing job satisfaction of service personnel. Journal of Service
Management 8, 14–26.Schwarz, N., Strack, F., 1991. Evaluating one’s life: a judgement model of subjective well-being. In: Strack, F.,
Argyle, M., Schwarz, N. (Eds.), Subjective Well-Being: An Interdisciplinary Perspective. Pergamon Press,Oxford, pp. 27–48.
Segall, M. H., Dafen, P. R., Berry J. W., Poortinga, Y.H., 1990. How Cross-Cultural Psychology is Done. HumanBehavior in Global Perspective. Pergamon Press, Oxford, pp. 48–66.
Smith, P., Trompenaars, F., Dugan, S., 1995. The Rotter locus of control in 43 countries: a test of culturalrelativity. International Journal of Psychology 30, 377–400.
Sousa-Poza, A., Sousa-Poza, A.A. (2000). Taking another look at the gender/job-satisfaction paradox. Kyklos 53,135–152.
Sousa-Poza, A.A., 1999. The relationship between ethnological culture, corporate culture and total qualitymanagement: an exploratory study across three continents. PhD Thesis, University of Missouri-Rolla.
Spector, P.E., 1997. Job Satisfaction: Application, Assessment, Causes, and Consequences. SAGE Publications,Thousand Oaks.
Tsang, M.C., Rumberger, R.W., Levin, H.M., 1991. The impact of surplus schooling on work productivity.Industrial Relations 30, 209–228.
Veenhoven, R., 1991. Is happiness relative? Social Indicators Research 24, 1–34.Veenhoven, R., 1996. Developments in satisfaction-research. Social Indicators Research 37, 1–46.Vroom, V., 1964. Work and Motivation. Wiley, New York.Walter-Busch, E., 1977. Arbeitszufriedenheit in der Wohlstandsgesellschaft. Paul Haupt, Berne.Walter-Busch, E., 2000. Stability and change of regional quality of life in Switzerland, 1978–1996. Social
Indicators Research 50, 1–49.Weinberg, R.A., 1989. Intelligence and IQ: landmark issues and great debates. Am. Psychol. 44, 98–104.
538 A. Sousa-Poza, A.A. Sousa-Poza / Journal of Socio-Economics 29 (2000) 517–538


