Policy Research Working Paper 6670
What Have We Learned from the Enterprise Surveys Regarding Access to Credit
by SMEs?
Veselin KuntchevRita Ramalho
Jorge Rodríguez-MezaJudy S. Yang
The World BankFinancial and Private Sector DevelopmentEnterprise Analysis UnitOctober 2013
WPS6670P
ublic
Dis
clos
ure
Aut
horiz
edP
ublic
Dis
clos
ure
Aut
horiz
edP
ublic
Dis
clos
ure
Aut
horiz
edP
ublic
Dis
clos
ure
Aut
horiz
edP
ublic
Dis
clos
ure
Aut
horiz
edP
ublic
Dis
clos
ure
Aut
horiz
edP
ublic
Dis
clos
ure
Aut
horiz
edP
ublic
Dis
clos
ure
Aut
horiz
ed

Produced by the Research Support Team
Abstract
The Policy Research Working Paper Series disseminates the findings of work in progress to encourage the exchange of ideas about development issues. An objective of the series is to get the findings out quickly, even if the presentations are less than fully polished. The papers carry the names of the authors and should be cited accordingly. The findings, interpretations, and conclusions expressed in this paper are entirely those of the authors. They do not necessarily represent the views of the International Bank for Reconstruction and Development/World Bank and its affiliated organizations, or those of the Executive Directors of the World Bank or the governments they represent.
Policy Research Working Paper 6670
Using a unique firm level data set—the Enterprise Surveys—this paper develops a new measure of credit-constrained status for firms using hard data instead of perceptions data. The paper classifies firms into four ordinal categories: Not Credit Constrained, Maybe Credit Constrained, Partially Credit Constrained, and Fully Credit Constrained to understand the characteristics of the firms that fall into each group. Comparable data from the Enterprise Surveys for 116 countries are used to look at the relationship between firm size and credit-constrained status. First, the analysis finds that small and medium enterprises are more likely to be credit constrained (either partially or fully) than large firms. Furthermore, small and medium enterprises finance their working capital and investments mainly
This paper is a product of the Enterprise Analysis Unit, Financial and Private Sector Development. It is part of a larger effort by the World Bank to provide open access to its research and make a contribution to development policy discussions around the world. We would like to thank all the participants in the European Central Bank Workshop “Access to finance of SMEs: What can we learn from survey data?” for their comments. Policy Research Working Papers are also posted on the Web at http://econ.worldbank.org. The corresponding authors may be contacted at [email protected] and [email protected].
through trade credit and informal sources of finance. These two results hold to a large extent in all the regions of the developing world. Second, although size is a significant predictor of the probability of being credit constrained, firm age is not. Third, high-performing firms, as measured by labor productivity, are less likely to be credit constrained. This result applies to all firms but is not as strong for small firms as it is for large and medium firms. Finally, in countries with high private credit-to-gross domestic product ratios, firms are less likely to be credit constrained. Given the importance of access to credit for firm growth and efficiency, this paper confirms that throughout the developing world access to credit is inversely related to firm size but positively related to productivity and financial deepening in the country.
What Have We Learned from the Enterprise Surveys Regarding Access to
Credit by SMEs?
Veselin Kuntchev, Rita Ramalho, Jorge Rodríguez-Meza, Judy S. Yang
Keywords and JEL classification codes: D22 firm behavior, empirical analysis O16 financial markets, corporate finance, O570 comparative studies of countries, Sector Board: Financial and Private Sector Development (FPD)

2
1. Introduction
Small and Medium Size Enterprises (SME) are the most common employers across the
world. In 48 out of 76 nations covered in Ayyagari, Beck and Demirgüç-Kunt (2007), SMEs
employed more than 50% of the formal workforce. In addition, Ayyagari, Demirgüç-Kunt and
Vojislav (2011) find that small firms and mature firms have the highest levels of total
employment and small firms and young firms have the highest rates of job creation. SMEs are a
fundamental part of a dynamic and healthy economy.
Consequently, it is important to understand the different factors that can help or hinder
SME creation and development. Recent research around the developing world provides evidence
that SMEs face greater financing obstacles than large firms (Beck, Demirgüç-Kunt &
Maksimovic 2005; Beck & Demirgüç-Kunt 2006; and Beck, Demirgüç-Kunt, Laeven
Maksimovic 2006). Ayyagari, Demirgüç-Kunt and Vojislav (2006) show that finance, crime, and
political instability directly affect the rate of growth of firms, with finance being the most robust
variable affecting firms’ growth rate. Furthermore, Beck, Demirgüç-Kunt and Maksimovic
(2008) find that small firms use less external finance, especially bank finance. This result,
coupled with the evidence found by Kumar, Rajan and Zingales (1999) that financial constraints
limit the average firm size, explains the paramount importance of investigating the usage of
finance by SMEs.
With this motivation, this paper tries to answer the following questions using a unique
data set covering 116 countries across the developing world (Enterprise Surveys): What type of
credit do SMEs use to finance their working capital and their investments? Moreover, which
SMEs are satisfied with the credit they have and which ones are credit-constrained? The paper
illustrates how firm-level survey data collected by the World Bank under a standard
3
methodology can be used to answer these questions. Given the richness of the data, the paper
also presents results using different definitions of SME as well as results for large firms which
can be used as a benchmark for SMEs.
This paper provides an innovative way of measuring credit-constrained firms based both
on their usage of and ability to obtain new credit. This is an important contribution to the
literature since most papers analyzing SME’s credit either look only at usage of credit, as
opposed to access, or focus on self-reported obstacles based on perceptions instead of objective
data based on the experience of the firm (e.g., whether access to finance is an obstacle for the
firm or whether the firm has a bank loan or a line of credit).
We find that SMEs are more likely to be credit constrained than large firms. In fact, the
probability of being credit constrained decreases with firm size. Firm age does not relate to the
credit constrained status. Once we control for size, age of the firm has no explanatory power with
regards to the probability of being credit constrained. When we use a measure based on the
perception of access to credit as an obstacle, we find that both size and age are negatively related
with the increasing degree of obstacle access to credit represents. Our measure of being credit
constrained based on hard data has a very high explanatory power over the perception measure.
That is, firms that are credit constrained in reality are more likely to report access to finance as
an increasing obstacle. This is an important check since several of the papers written on access to
finance using Enterprise Surveys data focus on the perception measure.
Regarding the sources of finance, the data show that SMEs rely more on trade credit and
informal sources and less on equity and formal debt than large firms. This finding applies both to
financing of investment and working capital although equity is not one of the explicitly provided
options for financing working capital in the survey.

4
In addition to describing who is credit constrained and how firms finance themselves, we
also analyze the link between access to credit and firm performance and the association between
access to credit -at the firm level- and equivalent macro variables. First, we find that firms with
higher performance, as measured by labor productivity, are less likely to be credit constrained,
which we take as an indication of well-functioning financial markets. A closer examination of
this result shows that this relationship is weaker for small firm than for medium and large firms.
Second, we find that countries with a higher level of private credit-to-GDP ratios have on
average lower percentages of firms that are credit constrained. These results are based on
correlations and should not be interpreted as causal.
The structure of the paper is as follows. The next section describes the data set being used
in detail, highlighting its richness and uniqueness. Section 3 explains the grouping of firms
according to their level of being credit constrained. Section 4 presents both the descriptive results
and the regression analysis on the determinants of being credit constrained. Finally, section 5
concludes the paper.
2. Data
As part of its strategic goal of building a climate for investment, job creation, and
sustainable growth, the World Bank has promoted improving business environments as a key
strategy for development, which has led to a systematic effort in collecting enterprise data across
countries. The Enterprise Surveys (ES) are an ongoing World Bank project in collecting both
objective data based on firms’ experiences and enterprises’ perception of the environment in
which they operate. The studies are implemented using firm-level surveys and over the last 10
years have evolved into a mature product that since 2005 uses a standardized methodology of

5
implementation, sampling and quality control in most client-countries of the World Bank. The
Enterprise Surveys currently cover over 130,000 firms in 125 countries, of which 116 have been
surveyed following the standard methodology. This allows for better comparisons across
countries and across time. Hundreds of academic research papers as well as policy documents
produced by the World Bank Group and other organizations use these data. Of the 116 countries
surveyed under the global methodology, 40 are in Sub-Saharan Africa, 29 are in Eastern Europe
and Central Asia, 31 are in Latin America and the Caribbean, 10 are in East Asia and Pacific, 4
are in South Asia, and only two in the Middle East and North Africa (Table 1).1 ES has included
some high-income countries as comparators mostly as an exception since the mandate of the
World Bank Group focuses on the developing world.
ES study a representative sample of the non-agricultural, formal, private economy with a
strong emphasis on building panel data to make it possible to track changes in the business
environment over time. In this paper, however, the panel dimension is not explored yet. The ES
facilitate linking firm performance and other firm characteristics with the business environment
while assessing the constraints to private sector growth and job creation faced in a particular
country. The questionnaire covers the following topics:
1. Firm characteristics – covering variables such as firm age, firm legal status, gender of the
owner.
2. Quality and availability of infrastructure and related services – covering variables such as
number of power outages, the time to get an electricity connection or water connection.
1 In MENA only Yemen and Iraq has been implemented using the global methodology up to now and therefore the results for this region should not be interpreted as representative of the whole region.

6
3. Sales and supplies – covering variables such as annual sales, ISIC code for the main product
of the firm, percentage of sales exported, the process of exporting and importing.
4. Competition – covering variables such as number of competitors and use of foreign
technology.
5. Capacity utilization –covering variables such as capacity utilization of staff and machinery.
6. Land and permits – covering variables such as time to obtain a construction permit.
7. Crime – covering variables such as the sales lost to theft and cost of security services.
8. Finance – covering variables, such as the percentage of investments financed through bank
loans, percentage of working capital financed through trade credit, the type of collateral used
to secure a bank loan.
9. Business-government relations – covering variables such as senior management time spend
on dealing with regulations, the incidence of informal payments, the frequency of visits from
tax inspectors.
10. Labor –covering variables such as the number of permanent and temporary employees,
education level of workers.
11. Ranking of obstacles – covering the most important of 15 potential obstacles to conduct
business.
12. Performance – covering obstacles such as cost of labor and cost of raw materials.
Indicators computed from these surveys are regularly posted and updated on the web site
of the Enterprise Analysis Unit (www.enterprisesurveys.org) and the anonymous raw data are
available to the researchers shortly after the completion of the surveys.
The ES are composed of representative random samples of firms. The universe of
inference for the sample is composed of the manufacturing and service sectors, including retail

7
wholesale hospitality and IT. The sectors of construction, transport and communication are also
included. Samples have broad within-country coverage typically centralized in the major centers
of economic activity of a country. Data are collected across the world using the same core
questionnaire and the same sampling methodology. Data are typically collected on a 3 to 4 year
rotation in each major region of the developing world.
Agricultural, extractive industries and fully government-owned firms are excluded from
the universe of inference, as well as firms with less than 5 employees. Formality is equated with
registration. Registration is defined country by country and it is generally based on registration
for tax purposes.
All samples are drawn following a stratified random selection. The standard strata for
every economy are sector of activity, firm size, and geographical location. Under geographical
location the stratification aims at having representativeness in the main economic centers of each
country. Firm size is consistently stratified into: small (5-19 employees), medium (20 to 99), and
large (100 and more). The degree of stratification by sector of activity is determined by the size
of the economy, as follows:
1. Very small economies: 2 strata, manufacturing and services (including construction,
transport and communications);
2. Small economies - 3 strata, where services are further stratified into retail and other services;
3. Medium and large economies - manufacturing is also subdivided into selected 2-digit
industries chosen according to their contribution to value added, employment and number of
establishments. The number of strata within manufacturing, or services, depends on the size
of the economy.
8
To preserve the same universe of inference across all countries, residual strata are usually
used such as rest of manufacturing and rest of services.
The primary sampling unit of every ES is the establishment. Sampling frames are
evaluated at the onset of every project and if necessary, new frames are constructed. Special
attention is placed on questionnaire translation, and in every country pretesting and pilot
interviews are conducted prior to main field work to reduce measurement errors. Measurement
error may be particularly concerning with some sensitive questions, in particular those regarding
corruption and firm’s accounting results. Experience and anecdotal evidence witnessed during
pilot surveys suggest that some facts may be intentionally underreported due to fears of
repercussions and/or due to the sensitive nature of the questions. Assuming such underreporting
is common and systematic across respondents there could be potential discrepancies between the
average response and the actual true mean of the sample. While, unfortunately, there is no ready
solution of this particular issue, over time, the ES questionnaire has been adjusted to minimize
this effect. Questions are simple and direct as opposed to indirect and wordy; respondents are
specially assured of the confidentiality of their answers; enumerators are specially trained to
circumvent difficult situations and a special code for “refuse to answer” was introduced to deal
with very sensitive questions.
Another issue when dealing with survey data in the developing world is coverage bias
emerging from outdated or incomplete firm listings. For the ES, as a general principle, the most
updated and complete sampling frame for each economy is used. Additionally, systematic efforts
are undertaken to purge ineligible elements from the frame prior to the selection of the sample.
Unfortunately, some ineligible elements are practically impossible to identify mechanically due
to incomplete or missing fields, outdated firm level information etc. Consequently, field work is

9
organized as a two stage procedure. In the first stage, telephone screening confirms eligibility
and schedules the interview. In the second stage, a face to face interview with the top manager of
each firm is conducted. When needed, follow-up questions and corrections are implemented, in
person, by phone, email or web interface.
Finally, the ES team has created quality control procedures and programs intended to
minimize coding and processing errors. Coding errors commonly occur due to the
misinterpretation by the enumerator of the answers, especially with questions about numbers, or
during the data entry stage. The ES implementation methodology includes comprehensive
systems of checking the answers for logical consistency and completeness. Furthermore, outlier
tests are implemented to capture potential typos. Several layers of extra verification, including
independent double entry, callbacks, and multiple logical and consistency tests are common
during the digitalization of the data.
3. Definition of Credit-Constrained Firms
Using the finance section of the Enterprise Surveys questionnaire, we construct four
major groups that measure the extent firms were credit constrained during the fiscal year
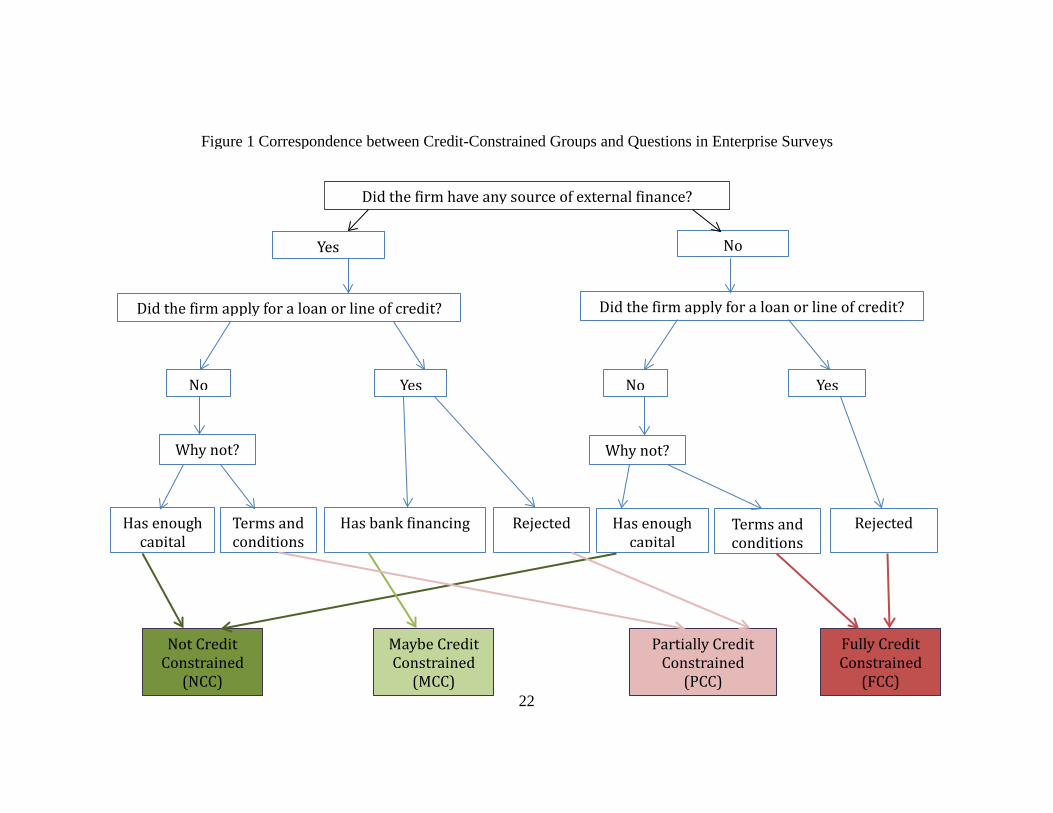
referenced in each survey. The first group called Fully Credit Constrained (FCC) includes the
firms that meet all the following conditions simultaneously:
A. Did not use external sources of finance for both working capital and investments
during the previous fiscal year;
B. Applied for a loan during the previous fiscal year;
C. Do not have a loan outstanding at the time of the survey which was disbursed during
the last fiscal year or later.

10
The intersection of A, B and C imply, in the context of the questionnaire, that these firms
applied for a loan and were rejected and do not have any type of external finance.
In addition this first group also includes the firms that meet the following criteria:
A. Did not use external sources of finance for both working capital and investments
during the previous fiscal year.
B. Did not apply for a loan during the previous fiscal year
C. Do not have an outstanding loan at the time of the survey
D. The reason for not applying for a loan was other than having enough capital for the
firm’s needs. Some characteristics of the potential loan’s terms and conditions
deterred these firms from applying. It is thus concluded that they were rationed out of
the market.
In summary, fully credit constrained firms have no external loans because loan
applications were rejected or the firm did not even bother to apply even though they needed
additional capital.
The second group called Partially Credit Constrained (PCC) includes firms that meet
the following conditions:
A. Used external sources of finance for working capital and/or investments during the
previous fiscal year and/or have a loan outstanding at the time of the survey, and
either:
1. Did not apply for a loan during the previous fiscal year and the reason for not
applying for a loan was other than having enough capital for the firm’s needs. Some
of these reasons may indicate that firms may self-select out of the credit market due
to prevailing terms and conditions, thus some degree of rationing is assumed or;

11
2. Applied for a loan but was rejected.
However, firms in this group manage to find some other forms of external finance and,
consequentially, they are only partially credit constrained.
The third group called Maybe Credit Constrained (MCC) includes firms that:
A. Used external sources of finance for working capital and/or investments during the
previous fiscal year and/or have a loan outstanding at the time of the survey;
B. Applied for a loan during the previous fiscal year
As firms in this group have had access to external finance and there is evidence of them
having bank finance, they are classified under the possibility of maybe being credit constrained
as it is impossible to ascertain whether they were partially rationed on the terms and conditions
of their external finance.
Finally, the fourth group called Non Credit Constrained (NCC) includes the firms that
fit into the following description:
A. Did not apply for a loan during the previous fiscal year;
B. The reason for not applying for a loan was having enough capital for the firm’s needs.
This fourth group can be further divided according to usage of external finance, since this
group includes both firms that use external finance and the ones that do not. The important
characteristic of this group is that, independently of its current level of external finance, these
firms are happy with their current financing structure for both working capital and investments.
It is important to note that for the Eastern Europe and Central Asia Region the question
on the sources of financing for working capital was not asked in the last wave of available
surveys. Therefore, the definitions of the four groups mentioned above were changed in the
following ways for firms in this region. For the first group, FCC, the subgroup of firms rejected

12
from loans was fully identified by using an additional question included only in this region
which directly inquired whether the firm was rejected on its loan application.2 For the second
subgroup within the FCC, those who did not apply due to the terms and conditions, an additional
question on the use of credit when buying inputs and supplies was used to discriminate those
with external finance used for working capital and those without it. While credit from suppliers
is only one of the potential sources for working capital finance, evidence from other regions
show that almost 70 percent of the firms that use external finance for working capital use this
type of credit. The second group, PCC, was fully identified once firms with external finance for
working capital were identified as explained above. Identifying the third and fourth groups,
MCC and NCC, did not pose any problem in the ECA region as the questions needed were
available in the survey instrument.
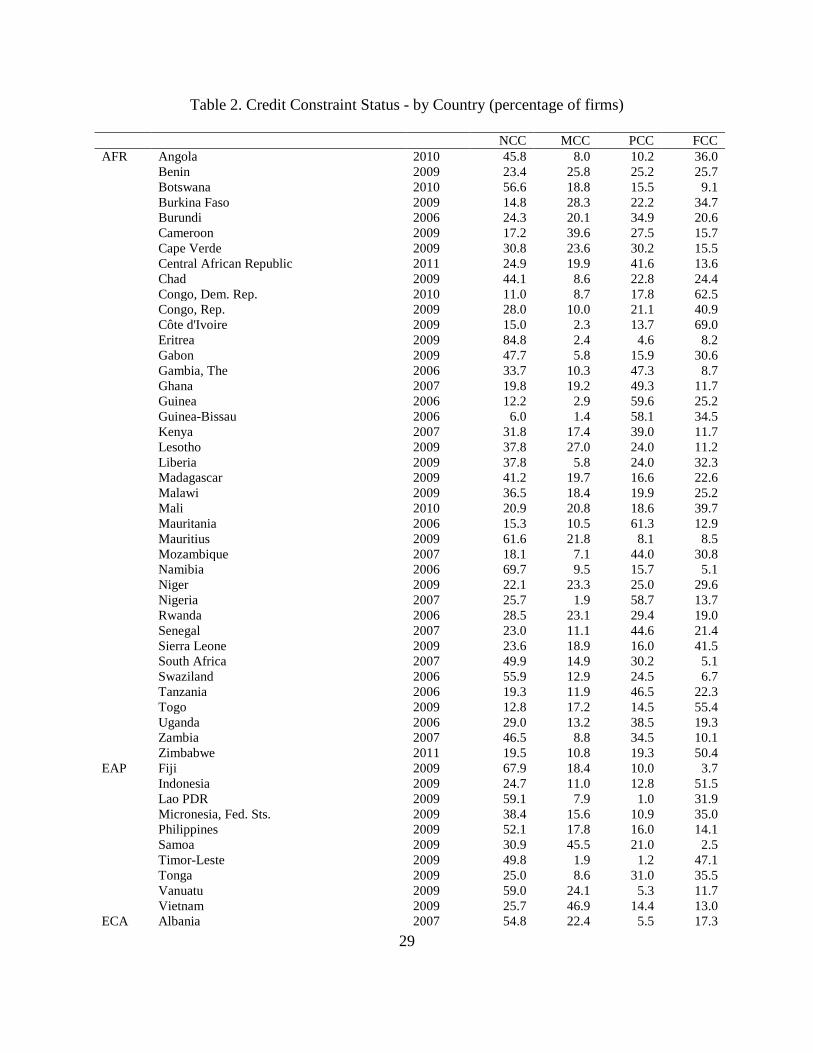
Figure 1 presents a diagram that explains the construction of our measure of credit
constraint and Table 2 presents the data by country of the percentage of firms that fall into the
four categories described above.
4. Results
4.1 Who Is Credit Constrained and Who Is Not?
Using the four definitions described above, we find that the firms for which there is no
hard evidence of being credit constrained, that is that they are either NCC or MCC, are the
2 In the global questionnaire, rejection to the loan application can only be inferred from comparing the question on the application with the realized fact that no external source of finance was used for financing investments or working capital. Since the ECA region did not include the question on working capital finance this inference cannot be done. Fortunately, the explicit question on the outcome of the application was included.

13
majority in 87 out of 116 countries (Table 2). This finding holds even if we focus just on SMEs
as opposed to firms of all sizes. We use three definitions of SMEs: SME100 – firms with up to
100 employees, SME250 – firms with up to 250 employees and SME500 – firms with up to 500
employees. The distribution of credit constrained status does not change across the three
different definitions as shown in Figure 3. Therefore, for the remainder of the analysis we will
use the SME100 definition since this is the one traditionally used in Enterprise Surveys.
Aggregating the data at the regional level, we find that in Sub-Saharan Africa (AFR),
East Asia and Pacific (EAP), and in South Asia (SAR), firms are more likely to be fully credit
constrained than in other regions (Figure 2). In these three regions, 23-25 percent of firms are
fully credit constrained, meaning that these firms sought credit and were unable of getting any
form of external credit. . For the two countries included in the Middle East and North Africa
region, this percentage was even higher, 28%. In the EAP region firms tend to be at the two
extremes of the credit constrained status. Firms are either not credit constrained at all (43%) or
they are fully credit constrained (25%) with fewer firms in the two middle categories.
The distributions of credit constrained status in Latin America and the Caribbean (LAC)
and Eastern Europe and Central Asia (ECA) are very similar. In those two regions around 42
percent of firms are not credit constrained and 9 to 10 percent are fully credit constrained. The
total proportion of firms who are maybe and partially credit constrained is also similar in these
two regions, at 48 percent.
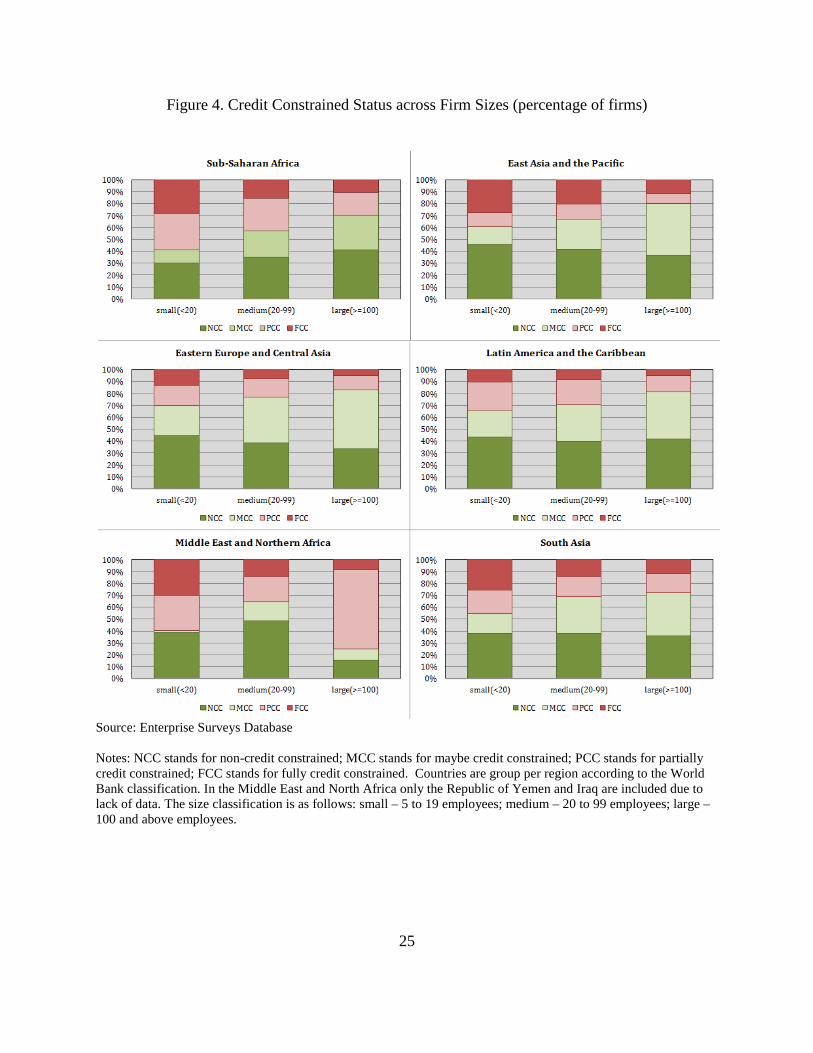
Analyzing the size composition within credit constrained categories indicates that SMEs
are more likely to be fully credit constrained than large firms (Figure 4 ). The proportion of
SMEs that are fully credit constrained is always larger than the proportion of large firms except
the Middle East and North Africa (MNA) (only the Republic of Yemen and Iraq are included in

14
this region). The difference in the proportion of firms that are fully credit constrained is more
pronounced for small firms, indicating the smaller the firm, the more likely it is to be credit
constrained. For example, 28.3 percent of small firms in AFR are fully credit constrained,
compared to 10.5 percent of large firms.
Firms younger than 5 or 9 years are not more likely to be more credit constrained than
older firms. There are no significant differences in the firms age distribution within the credit
constrained categories and found no significant differences. This lack of significance maybe in
part explained by the age cut off. Firms with up to 5 years of age may not face the same
challenges as very young firms (of 1 or 2 years). However, the Enterprise Surveys have a limited
number of observations for very young firms making it impractically to have an age cut off less
than 5 years.
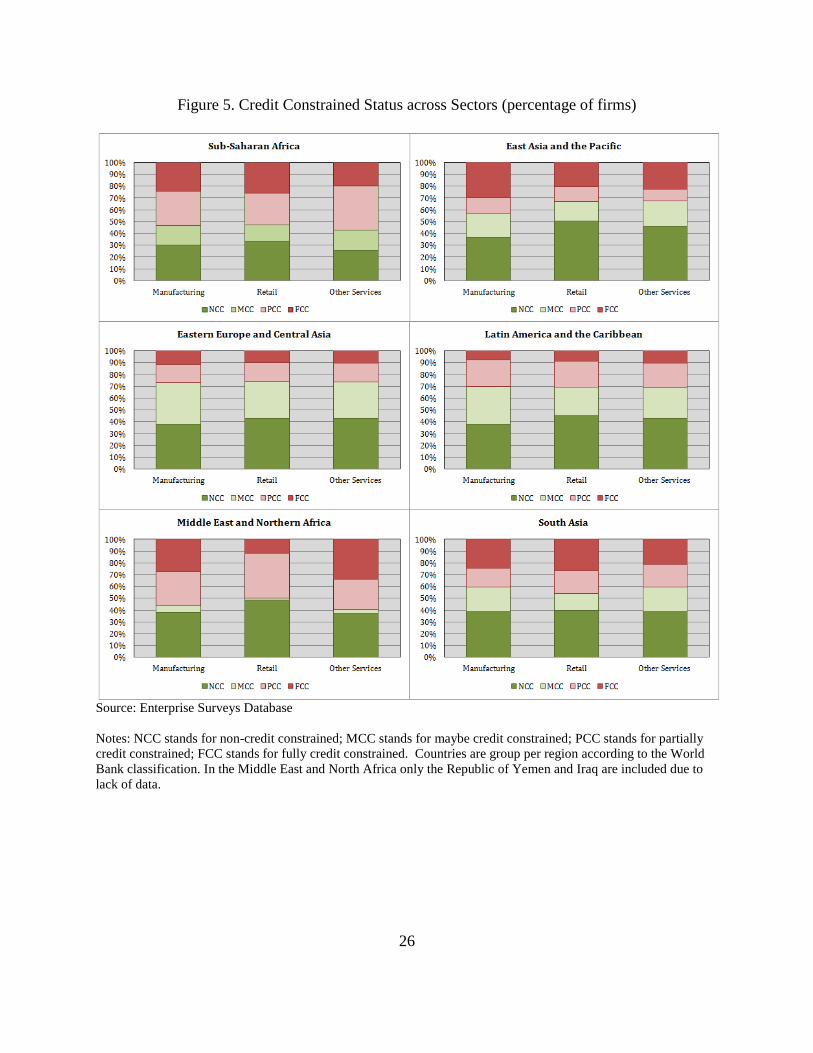
Figure 5 presents the distribution of credit constrained status by sectors and region. In
both the ECA and LAC regions, the distributions of the credit constrained status within the 3
sectors (manufacturing, retail, and other services) are very similar. In EAP, manufacturing firms
are more likely to be fully credit constrained than firms in the retail and other services sectors. In
AFR, other services sector stands out as being the least credit constrained. In SAR, firms in the
retail sector are more likely to be fully credit constrained.
To more formally test the association between firm characteristics and credit constrained
status we consider an ordered logit model in which the dependent variable is the ordinal variable:
1=NCC, 2=MCC, 3=PCC, and 4=FCC. Thus, higher values of the dependent variable denote
higher levels of credit constraint. Table 3 presents the results of the regression controlling for
country and industry fixed effects. There is a negative significant relationship between firm size
and credit constraint, i.e. the smaller the firm the higher the probability of being credit
15
constrained. Labor productivity is significant and negatively correlated with credit constraint, i.e.
more productive firms are less likely to be credit constrained. While the cross-section nature of
the data does not permit establishing whether this is the result of proper client selection by
financial markets or greater financial access causing greater productivity the positive correlation
is, at the very least, indicative of well-functioning financial markets.
We further explore this result by interacting labor productivity with three size categories,
(small, medium and large) and find that medium and large firms with higher labor productivity
are more likely to be less credit constrained when compared to small firms. However, the net
effect of labor productivity is negative for both groups of firms, showing that the negative
correlation between credit constrained and productivity holds for all sizes. Therefore, the data
suggest that the negative association between being credit constrained with having high labor
productivity, an indicator of well-functioning financial markets, is stronger to large and medium
firms than to small firms. The negative relationship between labor productivity and credit
constrained status holds for Sub-Saharan Africa, Eastern Europe and Central Asia, and South
Asia. For East Asia and Pacific this relationship is only significant if the effect is allowed to vary
by size.
Table 4 shows regression results from a logit regression, where PCC and FCC firms are
classified as credit constrained firms, and NCC and MCC firms are classified as firms with no
evidence of being credit constrained. Using this specification, the link between access to credit
and labor productivity is significant in all regions: the likelihood of being credit constrained
significantly decreases with higher labor productivity. Firm size is a significant determinant of
credit constraint status and small and medium firms are much likely to be credit constrained than
large firms.
16
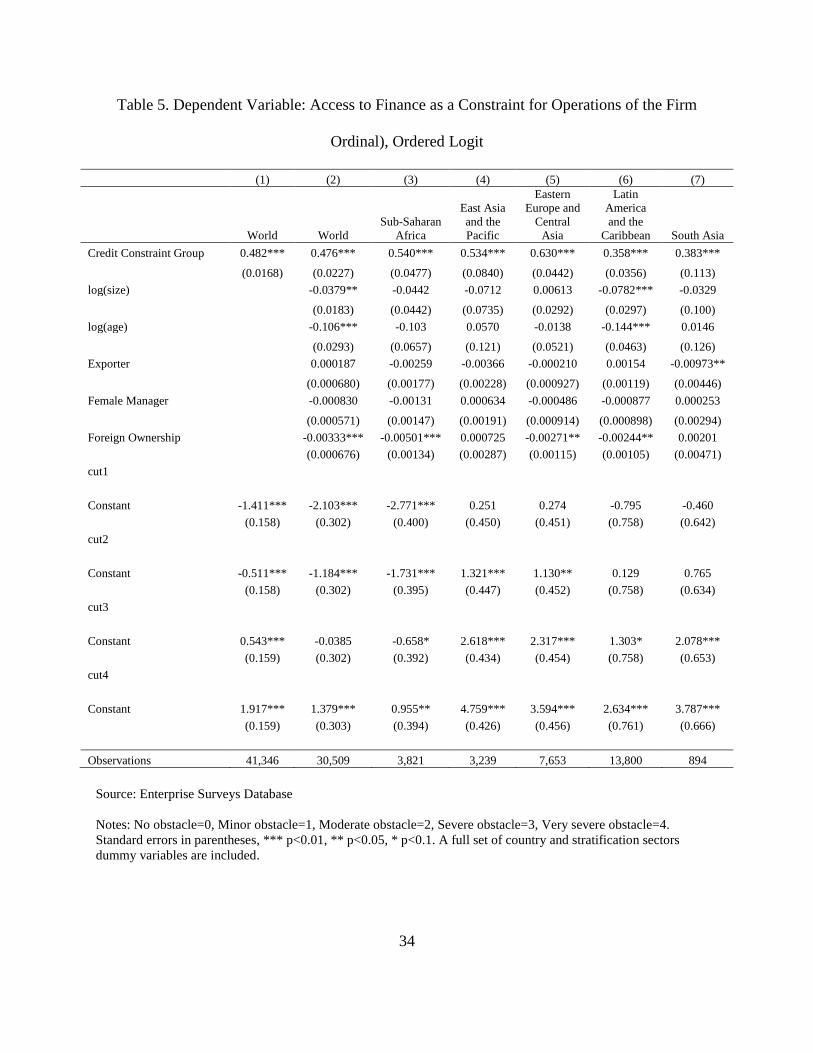
Table 5 presents the results from an ordered logit regression of perception of access to
credit as an obstacle. The regression is based on the direct opinion-based question on the degree
of obstacle access to finance represents to the current operations of the firm using a five point
scale: no obstacle, minor obstacle, moderate obstacle, severe obstacle and very severe obstacle.
This type of variable has often being used in the literature as a proxy for being credit constrained.
The results of the regression show that the perception of the obstacle is positively and highly
significantly correlated to our objective measure of credit constraint. The perception also shows a
negative significant correlation with size and with age: smaller firms and younger firms tend to
find access to credit to be more of a constraint to their operations than larger and older firms.
4.2 Which Sources of External Finance Do Firms Use and to What Extent?
The data collected by Enterprise Surveys also provide information on the different types
of external sources of financing used by firms as well as its relative intensity. The surveys
provide information on sources of financing for both working capital and purchases of fixed
assets.
The different sources of external finance for purchase of fixed assets are classified into
four categories: equity finance and three options for debt finance: formal debt finance, including
bank and non-banking financial institutions, trade finance, which includes credit from suppliers
and/or customers, and the other category, which includes informal sources of credit such as
moneylenders, friends and relatives, etc.3 It is worth clarifying that equity finance is phrased in
3 In the ECA region, the other category also includes non-banking financial institutions as the questionnaire used in this region group together these two categories.

17
the questionnaire in such a manner that it is not restricted to shareholding companies by
mentioning explicitly contributions by current or new owners.
Table 6 shows the relative use of each of these sources for all firms who used some
external finance to purchase fixed assets, i.e. excluding firms that did not use external finance at
all. Comparing across regions, it is interesting that in all regions except South Asia, SME’s use
of equity plus formal debt is relatively smaller than for large firms. SME’s consistently tend to
rely more on trade credit and informal sources. This trend is particularly clear in Africa, the
region with the largest relative use of informal credit to finance investments on fixed assets. It is
also worth noting that the use of formal debt is relatively high in all regions but it tends to be
lower for SME’s than for large firms, except again in South Asia where small, medium and large
firms’ share of use of formal debt is quite similar.
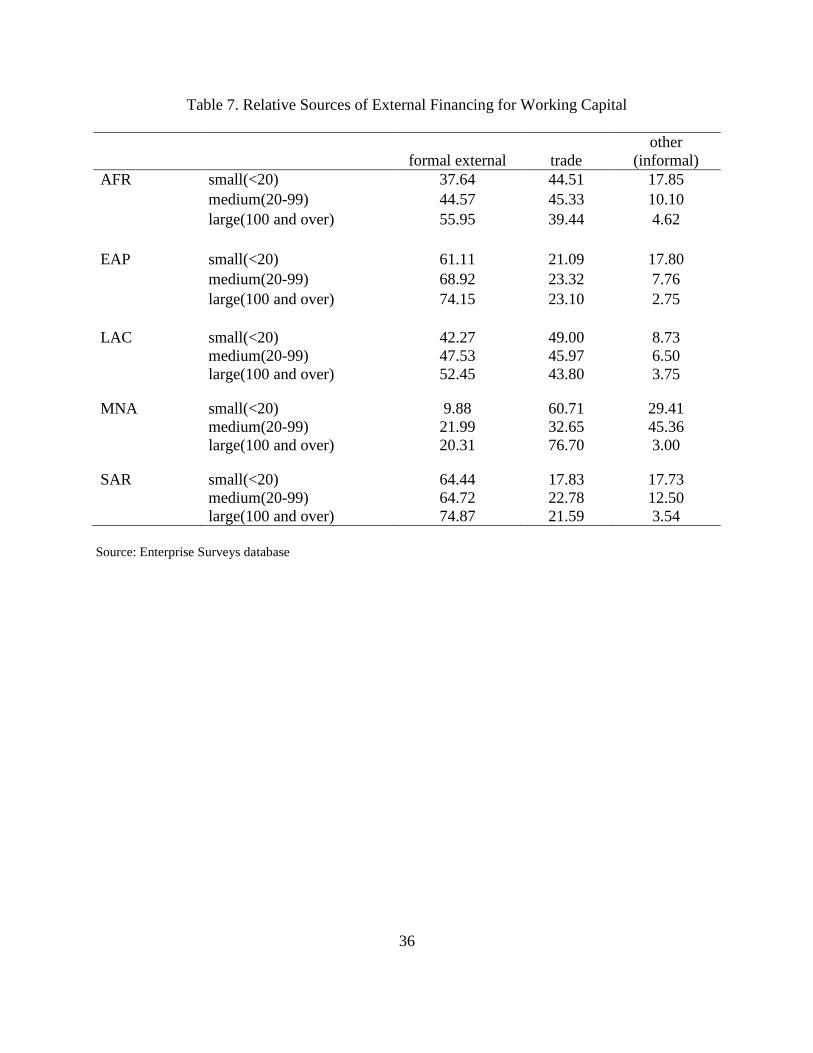
Table 7 shows the distribution of the different sources of finance for working capital. The
survey does not include equity as a source of finance for working capital as it was assumed that
this form of finance is rarely used to fund regular operations of a firm. Also, the regions of
Eastern Europe and Central Asia and the Middle East and Northern Africa are not presented as
this question was not part of the survey in the former region and in the latter only two countries
have been surveyed using the standard methodology. The results show that in the four regions
formal credit is relatively less used by SMEs than by large firms and that the likelihood of using
informal sources decreases with size.
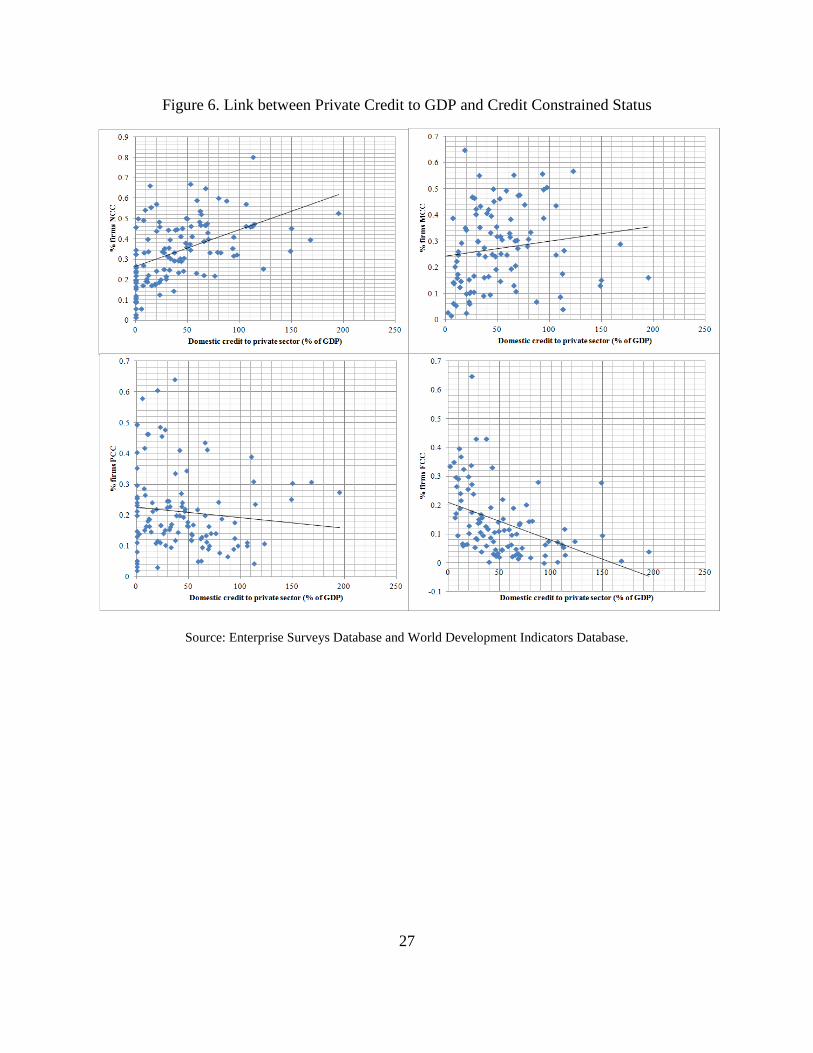
4.3 Linking Firm Level Data with Macro Variables
We test our data by looking at the correlation between domestic credit provided to the
private sector (% of GDP), a typical measure of financial deepening, and our credit constrained

18
measures aggregated at the country level. Figure 6 presents the main results. In countries with
high ratios of private credit to GDP firms are less likely to be fully or partially credit constrained
(FCC or PCC) and more likely to be non-credit constrained (NCC) or maybe credit constrained
(MCC). These relationships are stronger in the two extremes of the ordinal variable (NCC and
FCC) as shown by the larger slopes of the respective linear approximation.
5. Comparison of the Ordinal Metric of Credit-Constrained to Other Access-
to-Finance Indicators
In the literature, access to finance can refer to the availability and use of different
financial instruments. Some papers define access to finance based on only one condition:
whether or not a firm has a loan (Banerjee and Duflo 2004), or the stock of liquid assets (Love
2003), external financing without loans (Klapper, Laeven, and Rajan 2006). Still other papers
may use more than one financial instrument to describe access to finance: Honohan (2007)
define access to finance using bank loan and deposit accounts.
These differences in the literature illustrate the advantages of Enterprise Surveys which
contain information on a detailed list of a firm’s participation with financial instruments and
services. The credit constraint status of a firm is computed using information on the sources of
external financing for working capital and investment, whether or not a firm applied for a loan,
has a loan, and the reason they did not apply for a loan.
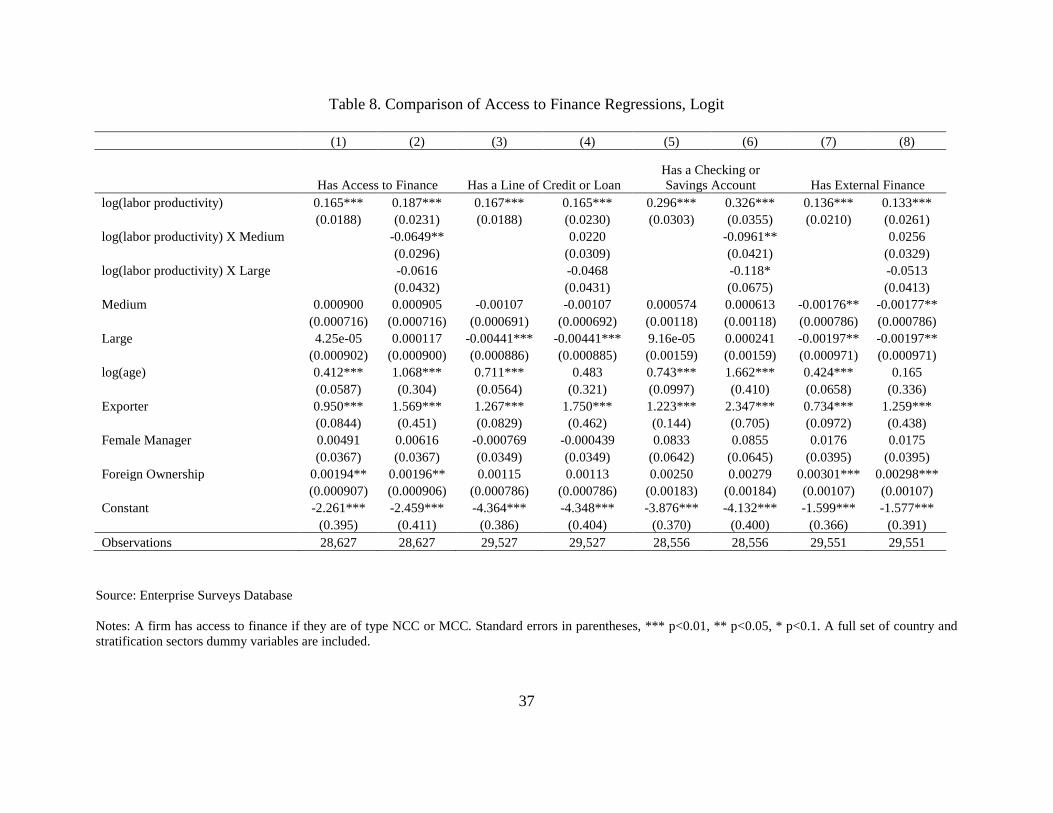
Table 8 displays results from logit regressions where the dependent variable varies in the
use of financial instruments. The regressions are estimated to determine the relationship of these
dependent variables to labor productivity and to determine how they compare to the ordinal
metric constructed in this paper. The results of the ordinal metric, subsumed into a dummy
19
variable, are presented in the first two columns. The other columns present results for different
definitions of access to credit that have been used in the literature. All these alternative
definitions provide similar result. Firms that have higher labor productivity are more likely to
have access to credit, and also to have a loan or line of credit, checking or savings account, or
use external financing.
While the Enterprise Survey finance module is comprehensive with almost forty finance
related variables, there is still potential to ask additional information to yield a clearer picture of
a firm’s financial inclusion. For example, for firms identified as being partially credit
constrained, it is not clear if these firms received the level of credit that they originally requested.
Another new variable that was recently added4 to the survey was whether or not a request for a
loan or line of credit was rejected. These new information will help identify a firm’s need of
financial services separately from the general availability of financial services in a country.
6. Conclusion
The importance of access to credit for firms, in particular for SMEs, has being the focus
of a vast literature. We add to that body of knowledge by creating a firm level measure of the
credit constrained status based on hard data and describing what type of firms are more likely to
be credit constrained and which ones are not. As commonly found in the literature, SMEs are
more likely to be credit constrained than large firms. They are also more likely to use trade credit
and informal sources of finance as funds for investment and working capital than large firms.
4 The Iraq 2011 survey was the first to include this variable.

20
Using our proposed measure of credit constrained status we find that age is not significant for
defining the probability of being credit constrained.
Higher performing firms are less likely to be credit constrained. This result is stronger for
large and medium firms than for small firms. Not surprisingly, we also find that in countries with
higher levels of the private credit-to-GDP ratio, firms are less likely to be credit constrained.
The new measure of credit-constrained status at the firm level is a very rich measure that
can be used in different types of analysis. This paper aims at presenting this new variable and
opening the door for future research in this area.
21
References
Ayyagari, Meghana, Thorsten Beck, and Asli Demirgüç-Kunt. 2007. “Small and Medium Enterprises across the Globe: A New Database.” Small Business Economics 29 (4): 415–34. Ayyagari, Meghana, Demirgüç -Kunt, Asli, Maksimovic, Vojislav, 2011. "Small vs. young firms across the world : contribution to employment, job creation, and growth," Policy Research Working Paper Series 5631, The World Bank. Ayyagari, Meghana, Aslı Demirgüç-Kunt and Vojislav Maksimovic, 2006. “How Important Are Financing Constraints? The Role of Finance in the Business Environment.” World Bank Policy Research Working Paper 3820. Beck, Thorsten and Aslı Demirgüç-Kunt. 2006. “Small and Medium-Size Enterprises.Access to Finance as Growth Constraint,” Journal of Banking and Finance 30, 2931-43. Beck, Thorsten, Asli Demirgüç-Kunt, and Vojislav Maksimovic. 2005. “Financial and Legal Constraints to Firm Growth: Does Firm Size Matter?” Journal of Finance 60 (1): 137–77. Beck, Thorsten, Asli Demirgüç-Kunt, and Vojislav Maksimovic. 2008. "Financing patterns around the world: Are small firms different?" Journal of Financial Economics 89 (3): 467-487. Beck, Thorsten, Aslı Demirgüç-Kunt, Luc Laeven and Vojislav Maksimovic. 2006. “The Determinants of Financing Obstacles.” Journal of International Money and Finance, 25, 932-52. Groves, Couper, Lepkowski, Singer and Tourangeau. 2004. “Survey Methodology” Harkness, Braun, Edwards, Johnson and Lyberg. 2010. “Survey Methods in Multinational, Multiregional, and Multicultural Contexts” Kumar, Krishna, Raghuram Rajan, and Luigi Zingales.1999. “What Determines Firm Size?” NBER Working Paper #7208.
22
Figure 1 Correspondence between Credit-Constrained Groups and Questions in Enterprise Surveys
Yes No
Did the firm apply for a loan or line of credit?
Yes No Yes No
Fully Credit Constrained
(FCC)
Partially Credit Constrained
(PCC)
Maybe Credit Constrained
(MCC)
Not Credit Constrained
(NCC)
Why not?
Terms and conditions
Has enough capital
Why not?
Terms and conditions
Has enough capital
Has bank financing Rejected
Did the firm have any source of external finance?
Did the firm apply for a loan or line of credit?
Rejected

23
Figure 2. Credit Constraint Status, by Region (percentage of firms)
Source: Enterprise Surveys Database
Notes: NCC stands for non-credit constrained; MCC stands for maybe credit constrained; PCC stands for partially credit constrained; FCC stands for fully credit constrained. Countries are grouped per region according to the World Bank classification. In the Middle East and North Africa only the Republic of Yemen and Iraq are included. The vertical axis represents the percentage of firms.
38% 39% 43% 32%
38% 42% 42%
23%
3%
20%
15%
20%
32% 27%
22%
29%
12%
29% 19%
16% 21%
17% 28% 25% 25% 23%
10% 9%
0%
10%
20%
30%
40%
50%
60%
70%
80%
90%
100%
World Middle Eastand North
Africa
East Asianand Pacific
Sub-SaharanAfrica
South Asia EasternEurope andCentral Asia
Latin Americaand the
Caribbean
NCC MCC PCC FCC

24
Figure 3. Percentage of Firms by Credit Constrained Status across the Developing World, by SMEs (percentage of firms)
Source: Enterprise Surveys Database Notes: SME100 reference firms with fewer than 100 employees, SME250 reference firms with fewer than 250 employees, and SME500 references firms with fewer than 500 employees. NCC stands for non-redit constrained; MCC stands for maybe credit constrained; PCC stands for partially credit constrained; FCC stands for fully credit constrained. Countries are group per region according to the World Bank classification. In the Middle East and North Africa only the Republic of Yemen and Iraq are included due to lack of data.
25
Figure 4. Credit Constrained Status across Firm Sizes (percentage of firms)
Source: Enterprise Surveys Database Notes: NCC stands for non-credit constrained; MCC stands for maybe credit constrained; PCC stands for partially credit constrained; FCC stands for fully credit constrained. Countries are group per region according to the World Bank classification. In the Middle East and North Africa only the Republic of Yemen and Iraq are included due to lack of data. The size classification is as follows: small – 5 to 19 employees; medium – 20 to 99 employees; large – 100 and above employees.
26
Figure 5. Credit Constrained Status across Sectors (percentage of firms)
Source: Enterprise Surveys Database Notes: NCC stands for non-credit constrained; MCC stands for maybe credit constrained; PCC stands for partially credit constrained; FCC stands for fully credit constrained. Countries are group per region according to the World Bank classification. In the Middle East and North Africa only the Republic of Yemen and Iraq are included due to lack of data.
27
Figure 6. Link between Private Credit to GDP and Credit Constrained Status
Source: Enterprise Surveys Database and World Development Indicators Database.

28
Tables
Table 1. Sample Size Statistics
Region N (countries)
N (firms)
Manu- facturing
Retail Other Services
Small (<20)
Medium (20-99)
Large (>100)
AFR 40 14,434 7,232 4,878 2,324 8,943 3,943 1,548 EAP 10 4,952 3,315 687 950 2,129 1,701 1,122 ECA 29 11,983 5,522 2,828 3,633 4,589 4,295 3,099 LAC 31 14,657 8,832 2,321 3,504 5,583 5,418 3,656 MNA 2 1,233 726 128 379 888 286 59 SAR 4 1,762 717 365 680 978 560 224 Source: Enterprise Surveys database. AFR stands for Sub-Saharan Africa; EAP stands for East Asia and the Pacific, ECA stands for Eastern Europe and Central Asia; LAC stands for Latin America and the Caribbean; MNA stands for Middle East and North Africa; and SAR stands for South Asia.
29
Table 2. Credit Constraint Status - by Country (percentage of firms) NCC MCC PCC FCC AFR Angola 2010 45.8 8.0 10.2 36.0 Benin 2009 23.4 25.8 25.2 25.7 Botswana 2010 56.6 18.8 15.5 9.1 Burkina Faso 2009 14.8 28.3 22.2 34.7 Burundi 2006 24.3 20.1 34.9 20.6 Cameroon 2009 17.2 39.6 27.5 15.7 Cape Verde 2009 30.8 23.6 30.2 15.5 Central African Republic 2011 24.9 19.9 41.6 13.6 Chad 2009 44.1 8.6 22.8 24.4 Congo, Dem. Rep. 2010 11.0 8.7 17.8 62.5 Congo, Rep. 2009 28.0 10.0 21.1 40.9 Côte d'Ivoire 2009 15.0 2.3 13.7 69.0 Eritrea 2009 84.8 2.4 4.6 8.2 Gabon 2009 47.7 5.8 15.9 30.6 Gambia, The 2006 33.7 10.3 47.3 8.7 Ghana 2007 19.8 19.2 49.3 11.7 Guinea 2006 12.2 2.9 59.6 25.2 Guinea-Bissau 2006 6.0 1.4 58.1 34.5 Kenya 2007 31.8 17.4 39.0 11.7 Lesotho 2009 37.8 27.0 24.0 11.2 Liberia 2009 37.8 5.8 24.0 32.3 Madagascar 2009 41.2 19.7 16.6 22.6 Malawi 2009 36.5 18.4 19.9 25.2 Mali 2010 20.9 20.8 18.6 39.7 Mauritania 2006 15.3 10.5 61.3 12.9 Mauritius 2009 61.6 21.8 8.1 8.5 Mozambique 2007 18.1 7.1 44.0 30.8 Namibia 2006 69.7 9.5 15.7 5.1 Niger 2009 22.1 23.3 25.0 29.6 Nigeria 2007 25.7 1.9 58.7 13.7 Rwanda 2006 28.5 23.1 29.4 19.0 Senegal 2007 23.0 11.1 44.6 21.4 Sierra Leone 2009 23.6 18.9 16.0 41.5 South Africa 2007 49.9 14.9 30.2 5.1 Swaziland 2006 55.9 12.9 24.5 6.7 Tanzania 2006 19.3 11.9 46.5 22.3 Togo 2009 12.8 17.2 14.5 55.4 Uganda 2006 29.0 13.2 38.5 19.3 Zambia 2007 46.5 8.8 34.5 10.1 Zimbabwe 2011 19.5 10.8 19.3 50.4 EAP Fiji 2009 67.9 18.4 10.0 3.7 Indonesia 2009 24.7 11.0 12.8 51.5 Lao PDR 2009 59.1 7.9 1.0 31.9 Micronesia, Fed. Sts. 2009 38.4 15.6 10.9 35.0 Philippines 2009 52.1 17.8 16.0 14.1 Samoa 2009 30.9 45.5 21.0 2.5 Timor-Leste 2009 49.8 1.9 1.2 47.1 Tonga 2009 25.0 8.6 31.0 35.5 Vanuatu 2009 59.0 24.1 5.3 11.7 Vietnam 2009 25.7 46.9 14.4 13.0 ECA Albania 2007 54.8 22.4 5.5 17.3

30
Armenia 2009 46.7 33.6 11.8 8.0 Azerbaijan 2009 47.8 10.1 13.9 28.2 Belarus 2008 20.8 51.4 24.1 3.7 Bosnia and Herzegovina 2009 27.2 46.3 17.1 9.5 Bulgaria 2009 42.4 24.7 17.2 15.7 Croatia 2007 38.6 42.0 13.8 5.6 Czech Republic 2009 47.6 34.9 15.4 2.1 Estonia 2009 48.0 38.0 12.4 1.6 Georgia 2008 42.6 33.7 9.1 14.5 Hungary 2009 60.5 26.1 10.7 2.7 Kazakhstan 2009 44.3 23.3 16.6 15.9 Kosovo 2009 71.3 10.2 14.8 3.7 Kyrgyz Republic 2009 38.4 16.7 18.8 26.0 Latvia 2009 48.8 27.5 18.3 5.4 Lithuania 2009 42.7 40.6 14.8 1.9 Macedonia, FYR 2009 39.0 30.9 26.8 3.2 Moldova 2009 30.0 36.5 21.4 12.1 Mongolia 2009 22.8 32.8 28.5 15.9 Montenegro 2009 23.0 39.4 13.3 24.4 Poland 2009 50.2 30.9 11.2 7.7 Romania 2009 42.2 35.2 17.2 5.5 Russian Federation 2009 41.8 35.8 15.7 6.7 Serbia 2009 24.1 50.3 21.1 4.5 Slovak Republic 2009 54.2 22.6 17.5 5.7 Slovenia 2009 38.1 53.5 8.3 0.0 Tajikistan 2008 41.9 25.9 16.6 15.6 Turkey 2008 40.5 40.9 12.7 5.9 Ukraine 2008 39.4 31.1 15.9 13.7 Uzbekistan 2008 38.9 12.3 18.9 29.9 LAC Antigua and Barbuda 2010 48.7 17.4 29.4 4.4 Argentina 2010 17.2 28.3 34.0 20.4 Bahamas, The 2010 49.3 10.0 34.7 5.9 Barbados 2010 66.4 10.5 19.7 3.4 Belize 2010 43.2 16.2 36.1 4.5 Bolivia 2010 47.5 28.4 14.1 10.0 Brazil 2009 30.0 52.5 10.2 7.3 Chile 2010 32.1 56.9 8.6 2.3 Colombia 2010 33.7 46.9 15.7 3.7 Costa Rica 2010 45.6 18.2 13.0 23.2 Dominica 2010 40.7 11.7 42.2 5.3 Dominican Republic 2010 37.7 42.3 18.4 1.6 Ecuador 2010 45.5 29.4 21.2 3.8 El Salvador 2010 36.0 33.1 25.2 5.7 Grenada 2010 45.4 27.3 24.6 2.7 Guatemala 2010 37.3 29.2 15.6 17.8 Guyana, Co-operative Republic of 2010 50.9 30.1 17.1 1.8 Honduras 2010 38.4 22.3 16.9 22.4 Jamaica 2010 34.1 21.0 42.4 2.4 Mexico 2010 53.0 18.7 15.7 12.6 Nicaragua 2010 54.9 14.5 6.8 23.8 Panama 2010 57.1 7.9 3.5 31.5 Paraguay 2010 32.0 51.4 10.0 6.6 Peru 2010 23.3 53.3 12.2 11.1 St. Kitts and Nevis 2010 38.8 28.6 31.6 1.0

31
St. Lucia 2010 53.6 9.6 28.3 8.5 St. Vincent and the Grenadines 2010 44.6 30.4 11.7 13.3 Suriname 2010 40.8 18.1 39.2 1.8 Trinidad and Tobago 2010 32.9 18.9 43.2 5.0 Uruguay 2010 46.7 27.4 13.4 12.5 Venezuela, RB 2010 45.9 30.2 9.0 14.9 MNA Iraq 2011 36.9 2.1 38.1 22.9 Yemen, Rep. 2010 41.7 3.9 20.6 33.8 SAR Afghanistan 2008 50.0 2.5 14.0 33.5 Bhutan 2009 27.8 30.8 27.3 14.0 Nepal 2009 49.9 25.5 6.0 18.6 Sri Lanka 2011 24.5 20.9 28.8 25.8
Source: Enterprise Surveys Database Notes: NCC stands for non-credit constrained; MCC stands for maybe credit constrained; PCC stands for partially credit constrained; FCC stands for fully credit constrained. AFR stands for Sub-Saharan Africa; EAP stands for East Asia and the Pacific, ECA stands for Eastern Europe and Central Asia; LAC stands for Latin America and the Caribbean; MNA stands for Middle East and North Africa; and SAR stands for South Asia.

32
Table 3. Dependent Variable: Credit Constraint Status, Ordered Logit
(1) (2) (3) (4) (5) (6) (7) (8) (9) (10) (11) (12)
World Sub-Saharan Africa East Asia and the Pacific Eastern Europe and
Central Asia Latin America and the
Caribbean South Asia log(labor productivity) -0.0929*** -0.145*** -0.123*** -0.136*** -0.0440 -0.111** -0.0585** -0.124*** -0.0583 -0.110* -0.243** -0.344***
(0.0176) (0.0229) (0.0289) (0.0360) (0.0426) (0.0537) (0.0275) (0.0359) (0.0374) (0.0574) (0.0962) (0.116)
log(labor productivity) X Medium
0.125***
0.0250
0.172**
0.162***
0.0899
0.428***
(0.0264)
(0.0419)
(0.0818)
(0.0410)
(0.0732)
(0.152)
log(labor productivity) X Large
0.157***
0.0797
0.168**
0.152***
0.170**
0.190
(0.0325)
(0.0653)
(0.0826)
(0.0464)
(0.0723)
(0.173)
Medium -0.162*** -1.446*** -0.500*** -0.747* -0.367* -2.037*** -0.0328 -1.737*** -0.0548 -0.993 -0.304 -4.171***
(0.0479) (0.279) (0.115) (0.423) (0.200) (0.779) (0.0727) (0.451) (0.0857) (0.777) (0.248) (1.335)
Large -0.254*** -1.878*** -0.884*** -1.692** -0.180 -1.831** -0.00270 -1.583*** -0.210** -2.001*** -0.581** -2.280
(0.0594) (0.349) (0.166) (0.702) (0.250) (0.833) (0.0845) (0.510) (0.105) (0.775) (0.278) (1.524)
log(age) 0.0169 0.0164 0.0488 0.0459 -0.143 -0.143 -0.0302 -0.0197 0.0618 0.0584 0.0640 0.100
(0.0312) (0.0312) (0.0737) (0.0737) (0.113) (0.113) (0.0510) (0.0509) (0.0526) (0.0526) (0.115) (0.112)
Exporter -0.000440 -0.000501 -7.40e-05 -4.74e-05 -0.00225 -0.00191 0.000464 0.000302 -0.00198* -0.00202* -0.00270 -0.00312
(0.000599) (0.000598) (0.00196) (0.00196) (0.00207) (0.00205) (0.000843) (0.000846) (0.00111) (0.00111) (0.00453) (0.00498)
Female Manager -0.000691 -0.000691 -0.000938 -0.000918 -0.00316** -0.00342** -0.00143 -0.00162* -1.72e-05 8.62e-05 0.00429 0.00466
(0.000614) (0.000612) (0.00166) (0.00167) (0.00159) (0.00158) (0.000915) (0.000914) (0.00107) (0.00106) (0.00308) (0.00315)
Foreign Ownership -0.00205** -0.00220*** -0.00205 -0.00211 -0.00688* -0.00738** -0.00211 -0.00227* -0.000801 -0.000885 -0.00697 -0.00828
(0.000799) (0.000794) (0.00144) (0.00144) (0.00378) (0.00375) (0.00138) (0.00135) (0.00138) (0.00138) (0.00527) (0.00534)
cut1 Constant -2.378*** -2.841*** -3.300*** -3.421*** -2.073*** -2.748*** -1.666*** -2.231*** -1.396** -1.997*** -2.903*** -3.707***
(0.456) (0.474) (0.373) (0.422) (0.529) (0.598) (0.424) (0.465) (0.641) (0.772) (0.846) (0.994)
cut2 Constant -1.186*** -1.647*** -2.354*** -2.474*** -0.841 -1.512** -0.203 -0.761* -0.224 -0.825 -1.862** -2.656***
(0.455) (0.472) (0.368) (0.417) (0.533) (0.601) (0.423) (0.462) (0.641) (0.772) (0.851) (0.988)
cut3 Constant 0.100 -0.356 -1.266*** -1.386*** -0.119 -0.785 1.080** 0.526 1.409** 0.810 -0.966 -1.750*
(0.454) (0.471) (0.367) (0.415) (0.533) (0.598) (0.422) (0.460) (0.639) (0.770) (0.846) (0.981)
Observations 28,627 28,627 2,895 2,895 3,029 3,029 8,606 8,606 12,220 12,220 856 856 Source: Enterprise Surveys database. Notes: NCC=1, MCC=2, PCC=3, FCC=4. Standard errors in parentheses, *** p<0.01, ** p<0.05, * p<0.1. A full set of country and stratification sectors dummy variables are included.

33
Table 4. Dependent Variable: Credit Constrained Dummy Variable, Logit
(1) (2) (3) (4) (5) (6)
World
Sub-Saharan Africa
East Asia and the Pacific
Eastern Europe and Central
Asia
Latin America and
the Caribbean South Asia
log(labor productivity) -0.165*** -0.142*** -0.191*** -0.225*** -0.129*** -0.354***
(0.0188) (0.0300) (0.0539) (0.0342) (0.0397) (0.102)
log(age) -0.00491 0.0780 -0.160 -0.0336 0.000847 -0.00554
(0.0367) (0.0849) (0.137) (0.0604) (0.0605) (0.137)
Exporter -0.00194** -0.000923 -0.00473* -0.000981 -0.00308** -0.00372
(0.000907) (0.00264) (0.00274) (0.00151) (0.00135) (0.00522)
Female Manager -0.000900 -0.00148 -0.00694*** -0.00113 -9.60e-05 0.00119
(0.000716) (0.00188) (0.00188) (0.00114) (0.00115) (0.00413)
Foreign Ownership -4.25e-05 -0.00215 -0.00183 0.00133 0.00119 -0.00218
(0.000902) (0.00152) (0.00411) (0.00177) (0.00148) (0.00686)
Small 0.950*** 1.258*** 0.815*** 0.849*** 0.882*** 1.686***
(0.0844) (0.192) (0.307) (0.136) (0.145) (0.348)
Medium 0.537*** 0.507*** 0.174 0.463*** 0.676*** 0.974***
(0.0832) (0.192) (0.283) (0.131) (0.141) (0.355)
Constant 1.311*** 0.994** 1.471** 1.113** 0.385 1.759*
(0.408) (0.447) (0.679) (0.519) (0.969) (1.060)
Observations 28,627 2,895 3,029 8,606 12,220 856 Source: Enterprise Surveys Database
Notes: Standard errors in parentheses, *** p<0.01, ** p<0.05, * p<0.1. A full set of country and stratification sectors dummy variables are included.
34
Table 5. Dependent Variable: Access to Finance as a Constraint for Operations of the Firm
Ordinal), Ordered Logit
(1) (2) (3) (4) (5) (6) (7)
World World Sub-Saharan
Africa
East Asia and the Pacific
Eastern Europe and
Central Asia
Latin America and the
Caribbean South Asia Credit Constraint Group 0.482*** 0.476*** 0.540*** 0.534*** 0.630*** 0.358*** 0.383***
(0.0168) (0.0227) (0.0477) (0.0840) (0.0442) (0.0356) (0.113)
log(size)
-0.0379** -0.0442 -0.0712 0.00613 -0.0782*** -0.0329
(0.0183) (0.0442) (0.0735) (0.0292) (0.0297) (0.100)
log(age)
-0.106*** -0.103 0.0570 -0.0138 -0.144*** 0.0146
(0.0293) (0.0657) (0.121) (0.0521) (0.0463) (0.126)
Exporter
0.000187 -0.00259 -0.00366 -0.000210 0.00154 -0.00973**
(0.000680) (0.00177) (0.00228) (0.000927) (0.00119) (0.00446)
Female Manager
-0.000830 -0.00131 0.000634 -0.000486 -0.000877 0.000253
(0.000571) (0.00147) (0.00191) (0.000914) (0.000898) (0.00294)
Foreign Ownership
-0.00333*** -0.00501*** 0.000725 -0.00271** -0.00244** 0.00201
(0.000676) (0.00134) (0.00287) (0.00115) (0.00105) (0.00471)
cut1
Constant -1.411*** -2.103*** -2.771*** 0.251 0.274 -0.795 -0.460
(0.158) (0.302) (0.400) (0.450) (0.451) (0.758) (0.642)
cut2
Constant -0.511*** -1.184*** -1.731*** 1.321*** 1.130** 0.129 0.765
(0.158) (0.302) (0.395) (0.447) (0.452) (0.758) (0.634)
cut3
Constant 0.543*** -0.0385 -0.658* 2.618*** 2.317*** 1.303* 2.078***
(0.159) (0.302) (0.392) (0.434) (0.454) (0.758) (0.653)
cut4
Constant 1.917*** 1.379*** 0.955** 4.759*** 3.594*** 2.634*** 3.787***
(0.159) (0.303) (0.394) (0.426) (0.456) (0.761) (0.666)
Observations 41,346 30,509 3,821 3,239 7,653 13,800 894 Source: Enterprise Surveys Database Notes: No obstacle=0, Minor obstacle=1, Moderate obstacle=2, Severe obstacle=3, Very severe obstacle=4. Standard errors in parentheses, *** p<0.01, ** p<0.05, * p<0.1. A full set of country and stratification sectors dummy variables are included.

35
Table 6. Relative Sources of External Financing for the Purchase of Fixed Assets, by Size and Region
equity external
financing formal
external debt semi-formal
financing informal financing
AFR small(<20) 3.99 29.62 11.71 14.81
medium(20-99) 3.77 34.19 12.71 7.59
large(100 and over) 5.4 44.9 9.1 4.8
EAP small(<20) 11.21 31.91 5.79 11.13
medium(20-99) 10.18 36.40 5.54 9.19
large(100 and over) 8.9 45.4 5.1 1.7
LAC small(<20) 11.98 42.02 13.84 4.45
medium(20-99) 8.85 42.37 14.93 3.84
large(100 and over) 6.83 46.29 10.03 1.71
MNA small(<20) 2.07 2.89 40.15 15.72
medium(20-99) 4.89 52.04 11.83 2.04
large(100 and over) 17.10 30.20 6.69 0.00
SAR small(<20) 17.40 43.35 1.26 6.50
medium(20-99) 14.26 46.66 1.82 4.81
large(100 and over) 13.56 49.50 3.16 6.79
Source: Enterprise Surveys database
36
Table 7. Relative Sources of External Financing for Working Capital
formal external trade
other (informal)
AFR small(<20) 37.64 44.51 17.85
medium(20-99) 44.57 45.33 10.10
large(100 and over) 55.95 39.44 4.62
EAP small(<20) 61.11 21.09 17.80
medium(20-99) 68.92 23.32 7.76
large(100 and over) 74.15 23.10 2.75
LAC small(<20) 42.27 49.00 8.73
medium(20-99) 47.53 45.97 6.50
large(100 and over) 52.45 43.80 3.75
MNA small(<20) 9.88 60.71 29.41
medium(20-99) 21.99 32.65 45.36
large(100 and over) 20.31 76.70 3.00
SAR small(<20) 64.44 17.83 17.73
medium(20-99) 64.72 22.78 12.50
large(100 and over) 74.87 21.59 3.54
Source: Enterprise Surveys database
37
Table 8. Comparison of Access to Finance Regressions, Logit
(1) (2) (3) (4) (5) (6) (7) (8)
Has Access to Finance Has a Line of Credit or Loan
Has a Checking or Savings Account Has External Finance
log(labor productivity) 0.165*** 0.187*** 0.167*** 0.165*** 0.296*** 0.326*** 0.136*** 0.133***
(0.0188) (0.0231) (0.0188) (0.0230) (0.0303) (0.0355) (0.0210) (0.0261)
log(labor productivity) X Medium
-0.0649**
0.0220
-0.0961**
0.0256
(0.0296)
(0.0309)
(0.0421)
(0.0329)
log(labor productivity) X Large
-0.0616
-0.0468
-0.118*
-0.0513
(0.0432)
(0.0431)
(0.0675)
(0.0413)
Medium 0.000900 0.000905 -0.00107 -0.00107 0.000574 0.000613 -0.00176** -0.00177**
(0.000716) (0.000716) (0.000691) (0.000692) (0.00118) (0.00118) (0.000786) (0.000786)
Large 4.25e-05 0.000117 -0.00441*** -0.00441*** 9.16e-05 0.000241 -0.00197** -0.00197**
(0.000902) (0.000900) (0.000886) (0.000885) (0.00159) (0.00159) (0.000971) (0.000971)
log(age) 0.412*** 1.068*** 0.711*** 0.483 0.743*** 1.662*** 0.424*** 0.165
(0.0587) (0.304) (0.0564) (0.321) (0.0997) (0.410) (0.0658) (0.336)
Exporter 0.950*** 1.569*** 1.267*** 1.750*** 1.223*** 2.347*** 0.734*** 1.259***
(0.0844) (0.451) (0.0829) (0.462) (0.144) (0.705) (0.0972) (0.438)
Female Manager 0.00491 0.00616 -0.000769 -0.000439 0.0833 0.0855 0.0176 0.0175
(0.0367) (0.0367) (0.0349) (0.0349) (0.0642) (0.0645) (0.0395) (0.0395)
Foreign Ownership 0.00194** 0.00196** 0.00115 0.00113 0.00250 0.00279 0.00301*** 0.00298***
(0.000907) (0.000906) (0.000786) (0.000786) (0.00183) (0.00184) (0.00107) (0.00107)
Constant -2.261*** -2.459*** -4.364*** -4.348*** -3.876*** -4.132*** -1.599*** -1.577***
(0.395) (0.411) (0.386) (0.404) (0.370) (0.400) (0.366) (0.391)
Observations 28,627 28,627 29,527 29,527 28,556 28,556 29,551 29,551
Source: Enterprise Surveys Database Notes: A firm has access to finance if they are of type NCC or MCC. Standard errors in parentheses, *** p<0.01, ** p<0.05, * p<0.1. A full set of country and stratification sectors dummy variables are included.


